Crustal Structure and Anisotropy in the Lower Yangtze Region and its Metallogenic Implications
 Rubing Han1
  Dinghui Yang1* Qiusheng Li2* Hao Chen3 Hongshuang Zhang2 Zhuo Ye4
  Yongzhi Cheng2 Wei Fu4
- 1Department of Mathematical Sciences, Tsinghua University, Beijing, China
- 2Key Laboratory of Deep-Earth Dynamics of Ministry of Natural Resources, Institute of Geology, Chinese Academy of Geological Sciences, Beijing, China
- 3School of Geophysics and Measurement-Control Technology, East China University of Technology, Nanchang, China
- 4SinoProbe Center, Chinese Academy of Geological Sciences, Beijing, China
In this study, we performed receiver function profiling and fitted harmonic functions to the arrival time variations of Pms phases to calculate the crustal seismic anisotropy with delay time and fast polarization direction, using broadband seismic data obtained from 55 temporary stations in two linear profiles and 39 stations in the Lower Yangtze and adjacent region. Moreover, we determined the crustal thickness and Poisson’s ratio using a novel H-κ-c stacking method. Our results revealed that the Middle-Lower Yangtze Metallogenic Belt and the north east section of the Qinzhou-Hangzhou Metallogenic Belt are characterized by Moho upliftment (<32 km), a relatively high Poisson’s ratio (>0.26), local lithospheric thinning (<70 km), and a pattern of deep faults that connect the crust and asthenosphere and serve as conduits for magma upwelling. The NE-SW fast polarization direction was consistent with the SKS splitting results, and the average delay time was 0.45 s. Moreover, underplating of deep magma and upwelling along the weak zone caused local Moho uplift and ductile shear of the lower crust, resulting in the directional arrangement of amphibole and other minerals, which may be the controlling mechanism for the crustal anisotropy in the study area. The variations in crustal structure and anisotropy characteristics indicated that in the context of the northeastern Paleo-Pacific plate subduction, the existence of weak lithospheric zones and the northeastern asthenospheric flow are important conditions for metal supernormal enrichment in the Lower Yangtze region.
Introduction
The Mesozoic period is regarded as the lithospheric active period of eastern South China when multi-phase structure-magma-thermal events were extensively developed and marked by massive and explosive mineralization (Li and Li, 2007; Lin et al., 2019; Wang et al., 2021). The Middle-Lower Yangtze Metallogenic Belt (MLYMB) and the Dexing porphyry copper deposit in the northern east part of the Qinzhou-Hangzhou Metallogenic Belt (QHMB) are typical representatives of copper-gold deposits in eastern South China (Mao et al., 2011; Ni and Wang, 2017; Yan et al., 2021). Scholars concur that the deep process of its mineralization is intimately connected to the transformation of the Mesozoic tectonic system and associated widespread magmatism (Shu, 2012; Lü et al., 2015; Li et al., 2017).
Recent seismic studies in the Lower Yangtze region have revealed the deep structure of the metallogenic area, providing new evidence for the genesis of these super normally enriched deposits. The deep seismic reflection profiles have shown that the crust in the MLYMB has undergone significant compression and detachment deformation (Gao et al., 2010; Dong et al., 2013; Liu et al., 2018; Lü et al., 2021). Moreover, wide-angle reflection profiles revealed uplifting of the Moho beneath this belt and low-velocity anomalies zone extending from the upper mantle to the crust of the metallogenic area (Xu et al., 2014; Zhang et al., 2015). Seismic tomography results indicated a “sandwich” structure of velocity anomalies in the upper mantle of the metallogenic area (Jiang et al., 2014, 2021), and the ambient noise tomography results suggested that the upper and lower crusts are characterized by relatively low velocities, whereas the middle crust is characterized by relatively high-velocities (Meng et al., 2021). The joint inversion results of receiver functions analyses and surface wave dispersions suggested that low-velocity anomalies exist in the upper mantle of the Lower Yangtze Block, several of which occur beneath the Dexing and Tongling ore deposits, and have been attributed to the ponding of relic (still cooling) mantle magma chambers (Ye et al., 2019). However, existing research has predominately focused on the crust-mantle structure below the MLYMB, with few studies describing the seismic anisotropy characteristics below the belt and its adjacent areas and the correlation between the dynamic environment and mineralization.
Seismic anisotropy is related to the material composition and velocity structure of the Earth, and it reflects the past and present stress field states. Moreover, seismic anisotropy is one of the important parameters used to investigate continental dynamics. Various methods are used to obtain the anisotropic characteristics or parameters, including shear wave splitting analyses (Wang et al., 2014; Tian and Santosh, 2015), the receiver function method (Wang et al., 2016; Yang et al., 2018), and surface wave velocity inversion (Wang et al., 2015; Gu et al., 2016). A XKS splitting analysis of the belts beneath eastern South China indicated a NE-SW (Zhao et al., 2007) and E-W (Yang et al., 2019) orientation of the fast directions. The fast directions and delay times calculated by several stations were relatively discrete and showed no clear spatial correspondence with the main structural direction, reflecting the complexity of the anisotropy. Shi et al. (2013) argued that the differences in the fast directions beneath the North China block (NW-SE), the metallogenic area (NE-SW), and the Yangtze Block (WNW-ESE) are related to the properties and evolution history of the structural unit. Belt-parallel azimuthal anisotropy below the MLYMB revealed by surface wave studies is considered to be caused by belt-parallel flow under the extensional tectonic stress field (Ouyang et al., 2015). However, XKS splitting analyses are limited by low vertical resolution, and they reflect only the average data of the whole lithosphere (Savage, 1999). The surface wave method is characterized by high vertical resolution; however, the horizontal resolution is insufficient due to the long period of the surface wave (Yang et al., 2020). Therefore, the internal anisotropy of the crust needs to be further explored in the study area.
The receiver function method is sensitive to lateral discontinuities inside the Earth. Moreover, the Pms converted wave is the seismic phase generated by the Moho and is sensitive to shear wave splitting (Frederiksen and Bostock., 2000; Nagaya et al., 2008). Anisotropy information about the medium conducted by the propagation Pms is derived from the inside of the crust and not the mantle. The characteristics of crustal anisotropy vital for exploring crust-mantle coupling and revealing the mechanism of crustal deformation. In recent years, the receiver function method has been widely applied to crustal anisotropy studies and has aided the discovery of significant crustal anisotropy (e.g., Liu and Niu, 2012; Tan and Nie, 2021; Wu et al., 2021). In this study, based on the observation data of 55 temporary stations in two linear profiles and 39 surrounding stations, as well as a novel H-κ-c method, we attempted to derive crustal structures and anisotropy beneath the study region. The results provide constraints on the dynamic mechanism of crustal deformation in the study area, as well as the metallogenic relationship between the metal deposits in the MLYMB and the northeast section of the QHMB.
Geological and Mineralization Settings
The QHMB is evolved from the Jiangnan-Shaoxing Fault. Striking NNE, this fault is a boundary fault zone developed from strong Mesozoic tectonic activation of a Neoproterozoic collision suture between the Yangtze Block in the north side and the Cathaysian Block in the other side (Zhang et al., 2015; Yan et al., 2021). This area can be divided into two secondary tectonic units, namely the Jiangnan Proterozoic island arc and the Caledonian orogenic belt in southeastern China (Zhou et al., 2017). The Dexing deposit in the northeastern part of the QHMB is the largest porphyry copper deposit in eastern China (Ni and Wang, 2017). The stratum in this area presents a typical dual-element structure. The lower part is the Shuangqiaoshan Group, which is regarded as the Neoproterozoic basement strata of shallow metamorphic rocks. The upper part is the terrestrial volcanic tuff of the Jurassic Ehuling Formation, and most of the other strata are missing (Chen et al., 2017). The MLYMB, adjacent to the north of the QHMB, is originates from strong crustal compression caused by the collision between the North China and Yangtze Blocks in the Indonesian period. A great quantity of horizontally shrunken material may be uplifted or descended in the collision process, leaving the tectonic belt sandwiched between the two uplifts (Jiang et al., 2014; Meng et al., 2021). Under the background of strong crustal extension and stress transformation in Yanshanian period, the MLYMB further evolved in to three parts: the fault fold zone in the north of the Yangtze River, the ramp zone along the Yangtze River and the transitional zone in the south of the Yangtze River, where later widely began to deposit (Chang et al., 2019). Several large Cu-Fe ore clusters mainly of skarn type Porphyry type and hydrothermal vein type with a structural trend of NNE have been developed in this area, such as Anqing, Luzong, Tongling and Ningwu ore deposits (Lü et al., 2021).
Data and Method
Data
The study area includes five geological units, from south to north, namely, the Cathaysia Block (CB), the Jiangnan Orogenic Belt (JOB), the Lower Yangtze Block (LYB), the Qinling-Dabie Orogenic Belt (QDOB), and the south margin of the North China Block (NCB), with many large and super-large deposits such as the Dexing porphyry copper deposit crossed by Line 1, the Tongling polymetallic deposit crossed by Line 2, as well as several others (e.g., the Ningwu ore deposit, the Anqing ore deposit, and the Luzong ore deposit) (Figure 1). Line1 consists of 24 portable stations belongs to the Land Resource Survey Project of China Geological Survey (recording time is from January 2015 to June 2016, Han et al., 2020). Line 2 consists of 31 portable stations belongs to the SinoProbe-02 (recording time is from 2009 to 2010, Zheng et al., 2013; Ye et al., 2019). In addition, as an essential supplement, data recorded by 20 permanent stations and 19 temporary stations around the study area were added to the raw data, in which the data of the temporary stations belonged to the same project as Line 1. All the temporary stations were equipped with two types of data collectors (REFTEK-130 or Q330S+) and three types of the broadband seismometers [CMG-3ESP (60 s–50 Hz), CMG-3T (120 s–50 Hz), and STS-2.5 (240 s–50 Hz)]. Furthermore, each continuously operating station with a 100 Hz sampling rate could generate a single file with a length of 3,600 s. All the permanent stations collected seismic data from January 2012 to December 2017.
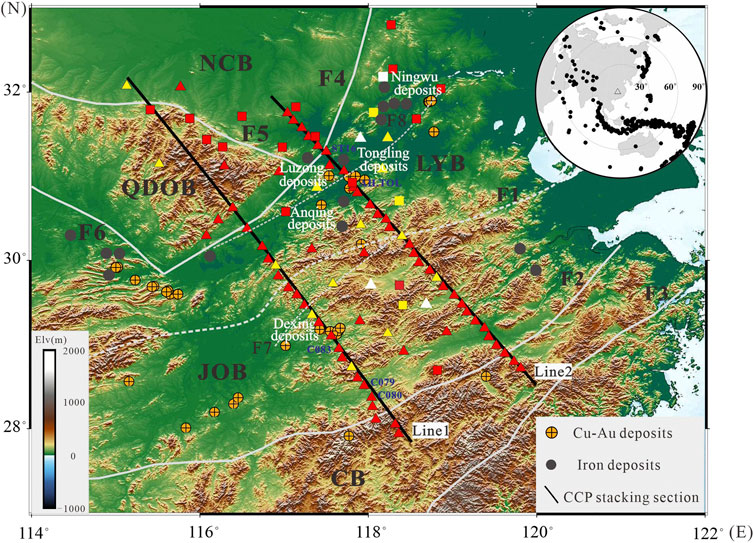
FIGURE 1. Seismic stations and teleseismic event locations (upper right corner) in the study area. The background color maps indicate the topography (unit: m). The triangles represent the temporary stations, squares represent the permanent stations, yellow triangles and squares denote stations without harmonic corrections, and white triangles and squares indicate abandoned stations. NCB, North China Block; LYB, Lower Yangtze Block; JOB, Jiangnan Orogenic Belt; QDOB, Qinling-Dabie Orogenic Belt; CB, Cathaysia Block; F1, Jiangnan Buried Fault; F2, Jiangshao Fault; F3, Zhenghe-Dapu Fault; F4, Tanlu Fault; F5, Xinyang-Shucheng Fault; F6, Xiangfan-Guangji Fault; F7, northeast Jiangxi Fault; F8, Yangtze River Deep Fault. Showing locations of major Cue-Au and Iron deposits. The black lines are the position of the research profiles (Line 1 and Line 2 used in Figure 7), and the triangle and black dots in the upper right corner indicate the center of the study area and teleseismic events, respectively. Main structural lines and fault lines are described in (Shu et al., 2013) and (Lü et al., 2015, Lü et al., 2021).
In this study, we calculated and obtained new receiver functions of 63 stations, and the receiver functions of Line 2 (31 stations) used the previous calculation results and were further selected according to waveform quality (Ye et al., 2019). In accordance with standard processing flow (Han et al., 2020), we first selected the earthquake events with epicentral distances in the range of 30°–90° and magnitudes >5.5 from raw waveform data. Next, three-component event waveforms were bandpass-filtered (two-pole Butterworth filter, corner frequency = 0.05–2 Hz) and rotated into Z-R-T components after the waveforms were detrended and demeaned. Finally, a total of 4,110 high quality receiver function records were calculated using a time-domain deconvolution (Ligorría and Ammon, 1999) with the Gaussian parameter of 2.5 and 100 times in iteration. Overall, the data from four stations was disregarded due to inferior quality caused by interference of the receiver function records in the shallow layer. Figure 2 shows the receiver function records of station C080 with clear Pms converted phases and relatively good back-azimuthal coverage, which met the requirement of harmonics correction.
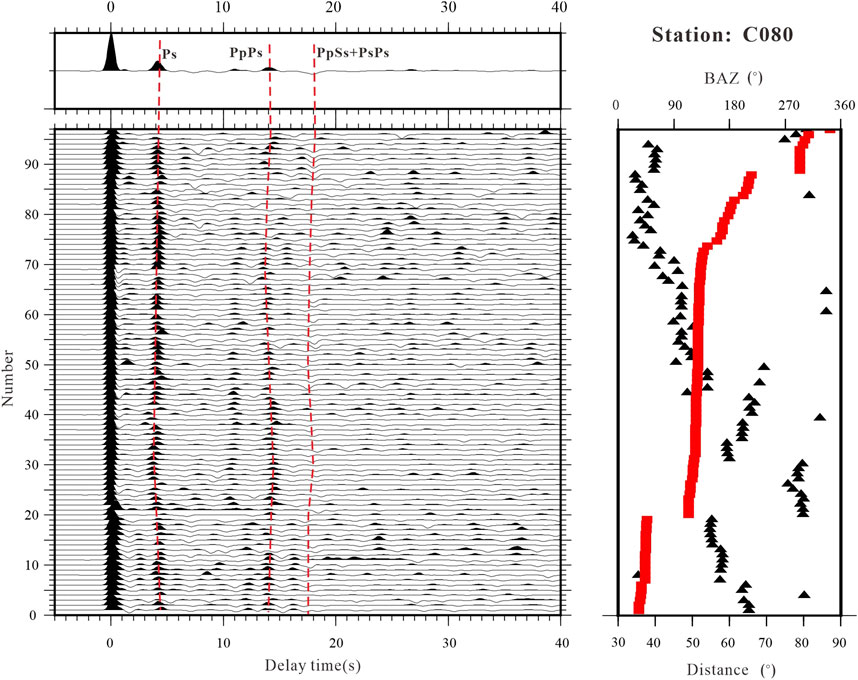
FIGURE 2. Receiver function records from station C080: (left) receiver functions arranged according to back-azimuth, where the numbers on the axis denote the latency time of P wave arrival. The results of the linear superposition receiver functions are shown at the top of the left figure. The seismic phases (Ps, PpPs, PpSs + PsPs) are marked by red and broken lines. Red rectangles represent the back-azimuth in the figure on the right, and the black triangles denote epicenter distance distribution.
H-κ-c Method
The widely used method of H-κ stacking scans the crustal thickness (H) and Vp/Vs ratio (κ) within a certain range, and obtains the weighted sum of the Pms and crustal multiples (PpPs and PpSs + PsPs) (Zhu and Kanamori, 2000). The maximum value corresponding is the optimal estimate of H and κ.This method constructs stacking function S (H, κ) is defined as:
Here r (t) denotes the radial receiver function. wi is weighting factors of the Pms and crustal multiples which satisfy w1 + w2 + w3 = 1. The errors estimation of H (δH) and κ (δκ) can be obtained by using the Taylor expansion of S (H, κ) at the maximum and solve the quadratic differential and its standard deviation (Zhu and Kanamori, 2000):
In H-κ-c stacking (where “c” denotes “correction”), the influence of crustal anisotropy and inclined interface is further considered and harmonic corrected to the azimuthal arrival variations of converted wave, and then performed H-κ stacking processing on the corrected receiver functions (Li et al., 2019). The weights used for the three waves in the traditional H-κ method are 0.7, 0.2, and 0.1, and H-κ-c calculation are 0.6, 0.3, and 0.1. The weights were altered to enhance the consistency of the converted wave.
Figure 3 indicates the results of the data obtained from stations AH. TOL and C079, before and after the harmonic corrections. Overall, the seismic phase of the Pms and crustal multiples were clearly aligned and the uncertainty among the H-κ energy maps was significantly reduced. The harmonic fit provides a more robust and reliable stacking result (Li and Song, 2021). It should be noted that the effectiveness of harmonic correction is reduced when effective receiver functions have an uneven and incomplete back-azimuthal coverage. The H and κ continue to use traditional H-κ results for these stations, which are mostly concentrated in areas with thick sedimentary basins lacking sufficient receiver functions.
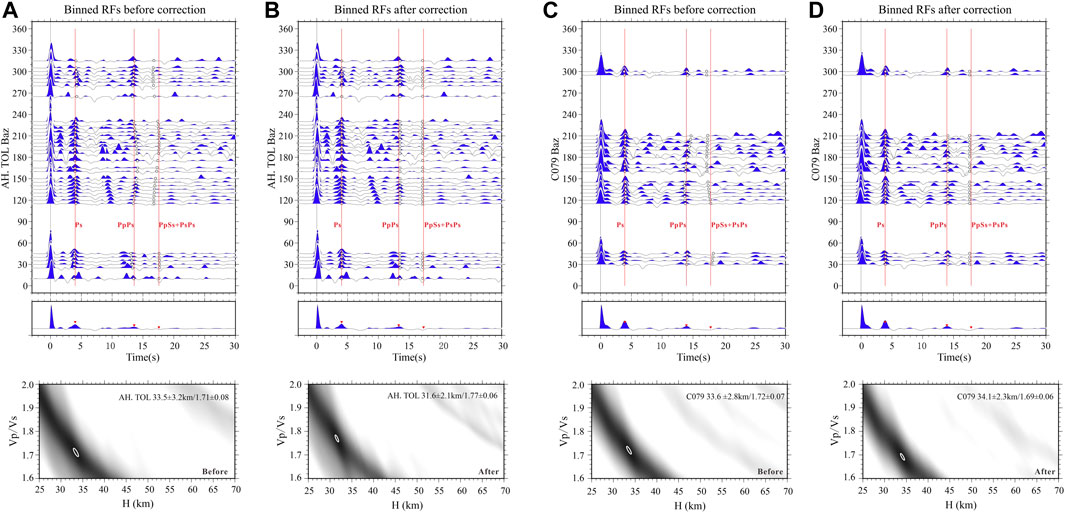
FIGURE 3. Arrival time and waveform fitting of the Pms and multiples before (A,C) and after (B,D) harmonic corrections. The white circles represent the peak amplitude of the Pms and multiples. The dynamic correction stacking is shown below (ray parameter is 0.06 s/km), where the red lines and inverted triangles represent the arrivals of the Pms and multiple phases, respectively. H-κ energy maps are indicated at the bottom of the figures; the obtained H and Vp/Vs (κ), as well as corresponding errors and error ellipses, are shown.
Crustal Anisotropy Analysis
Based on the H-κ-c calculation (Li et al., 2019), we obtained the anisotropy of the entire crust by fitting the azimuth arrival changes of the Pms through a harmonic analysis. This method has been applied in Eastern Iran (Mahmoodabadi et al., 2020) and the eastern margin of the Tibetan Plateau (Tan and Nie., 2021). The arrival time of the Pms is characterized by a cosine function with the incident azimuth of seismic events, which is a tool for diagnosing anisotropy (Savage, 1998; Frederiksen and Bostock, 2000). The back-azimuthal variation of the Pms arrival times in the radial receiver functions from the crustal anisotropy, dipping Moho can be fitted by a combination of cosθ function and cos2θ function (Li et al., 2019).
The equation for the harmonic fitting is:
where F (θ) represents the variation of arrival times with the back-azimuth (θ) for Ps or crustal multiples; A0 is the central arrival time, A1, A2 and θ1, θ2 are the amplitudes and phases of the two-lobed and four-lobed variations, respectively. The delay time (δt) and the fast polarization directions (φ), which mirrors the strength and orientation of anisotropy, correspond to 2A2 and θ2, respectively. The delay time is related to the anisotropic strength of the media and the propagation path length of the shear wave in the media, and the fast directions mainly correspond to the direction of the symmetry axis of the anisotropic media orientation (Yang et al., 2018). The harmonic corrections method includes the following three main steps: 1) Apply the traditional H-κ stacking to obtain the reference arrival times for Pms and crustal multiples; 2) Perform the grid search to get harmonic fits of back-azimuthal variations of Ps and crustal multiples; 3) Correct the Pms and multiples and redo H-κ stacking with the receiver functions. The key of this method is to obtain the optimal solution for five parameters (A1, A2, θ1, θ2, dt = A0-tref), where tref represent reference arrival time which obtained by the traditional H-κ stacking; The searching range is: A1 and A2 ∈ (0–0.5 s), θ1 ∈ (0°–355°), and θ2 ∈ (0°–175°), dt ∈ (–1.0–1.0 s). The Pms fitting results of three stations (AH.TOL, C083, and ST16) are shown in Figure 4, indicating a good fit between the Pms arrival times and the four parameters of A1, A2, θ1, θ2.
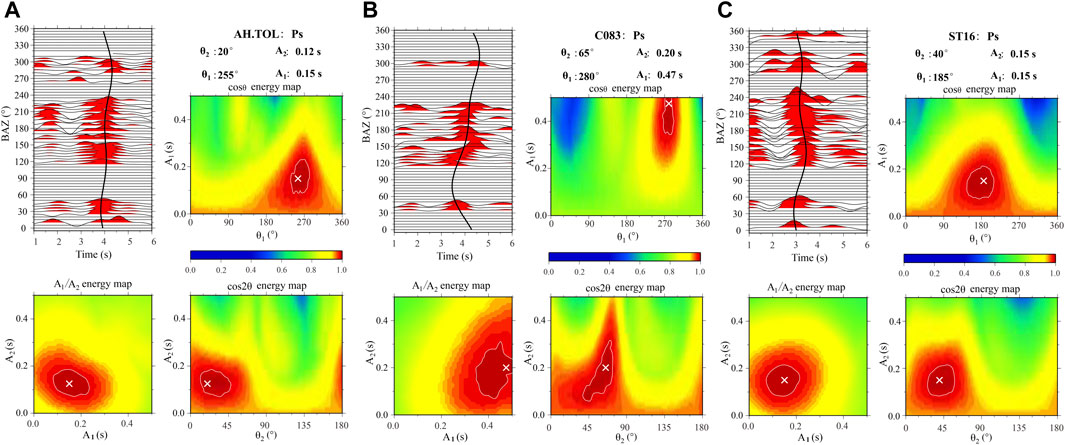
FIGURE 4. Pms fitting results of three stations AH.TOL (A), C083 (B) and ST16 (C). The black lines represent the arrival times of Pms, the crosses mark indicate the best solutions, and the 99% contours to show the empirical uncertainty.
Results
Crustal Thickness and Vp/Vs Ratio
Figure 5 shows the crustal thickness (H) and Vp/Vs ratio (κ) for the study area, and Supplementary Table S1 shows all the statistical results obtained in this study. The crustal thickness varied from 28.0 to 37.5 km, with an average value of 33.2 km, and the error range was 0.5–3.1 km. The Vp/Vs ratio ranged from 1.63 to 1.88, with an average value of 1.74 and an error range of 0.01–0.13. The results with relatively large errors were obtained for the areas directly on either sides of the fault zone or in the orogenic zone and are marked in Figure 5. Our results are consistent with adjacent profiles of deep seismic sounding (Deng et al., 2011; Teng et al., 2013) and coincide with the results of other studies using the H-κ method (Liu et al., 2021; Zhang et al., 2021). In this study, the effects of dip interface and velocity anisotropy were also considered, and based on a denser seismic array, which can enhance resolution and decreasing uncertainty and reveal more details of regional horizontal variation of crust thickness than predecessors.
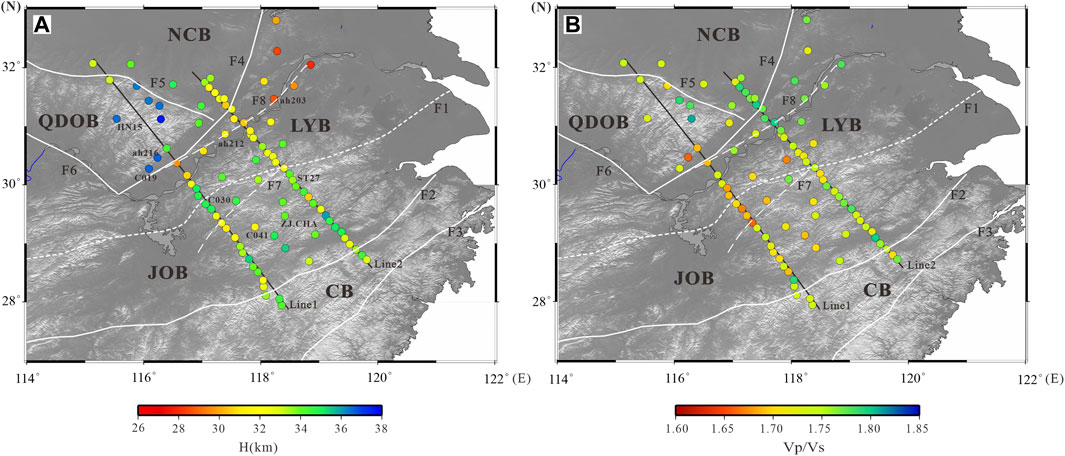
FIGURE 5. Distribution of crustal thickness (A) and Vp/Vs ratio (B) beneath the stations. Labels are the same as Figure 1.
We achieved three-dimensional variation characteristics of the crustal thickness and Vp/Vs ratio in the study area (Figure 6). The high-resolution results revealed that the QD crust is the thickest (average value >37 km), followed by the southern margin of the NCB and JOB (32–34 km), and the LYB, which is the thinnest (average value <32 km). Moreover, a negative correlation was observed between the crustal thickness and the Poisson’s ratio (Vp/Vs ratio (κ) conversion:
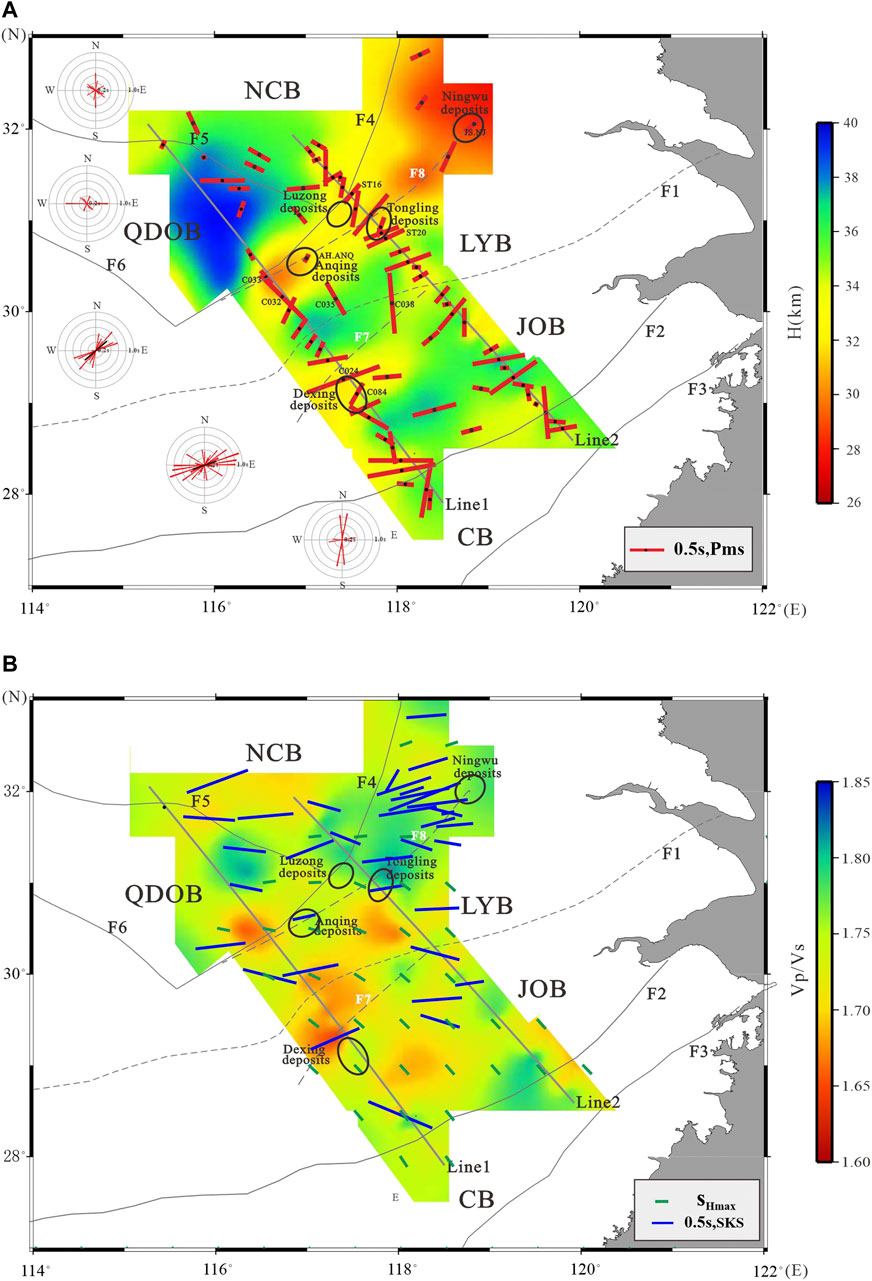
FIGURE 6. Distribution of crustal thickness (A): the length of the bars denotes the delay time, the azimuths of the bars indicates the fast wave directions, and the rose maps is shown in the corresponding geological unit, the red and black bars represent the anisotropy parameters of each station and average values of the LYB and JOB, respectively. The interval between each ring and from the center to the outermost ring is 2 and 1 s, respectively. Distributions of Vp/Vs (B): the blue bars indicate the average splitting parameter of the SKS (Yang et al., 2019), and the green bars indicate the maximum horizontal stress (SHmax) orientations (Heidbach et al., 2018). The black circle indicates the metallogenic area. Labels are the same as Figure 1.
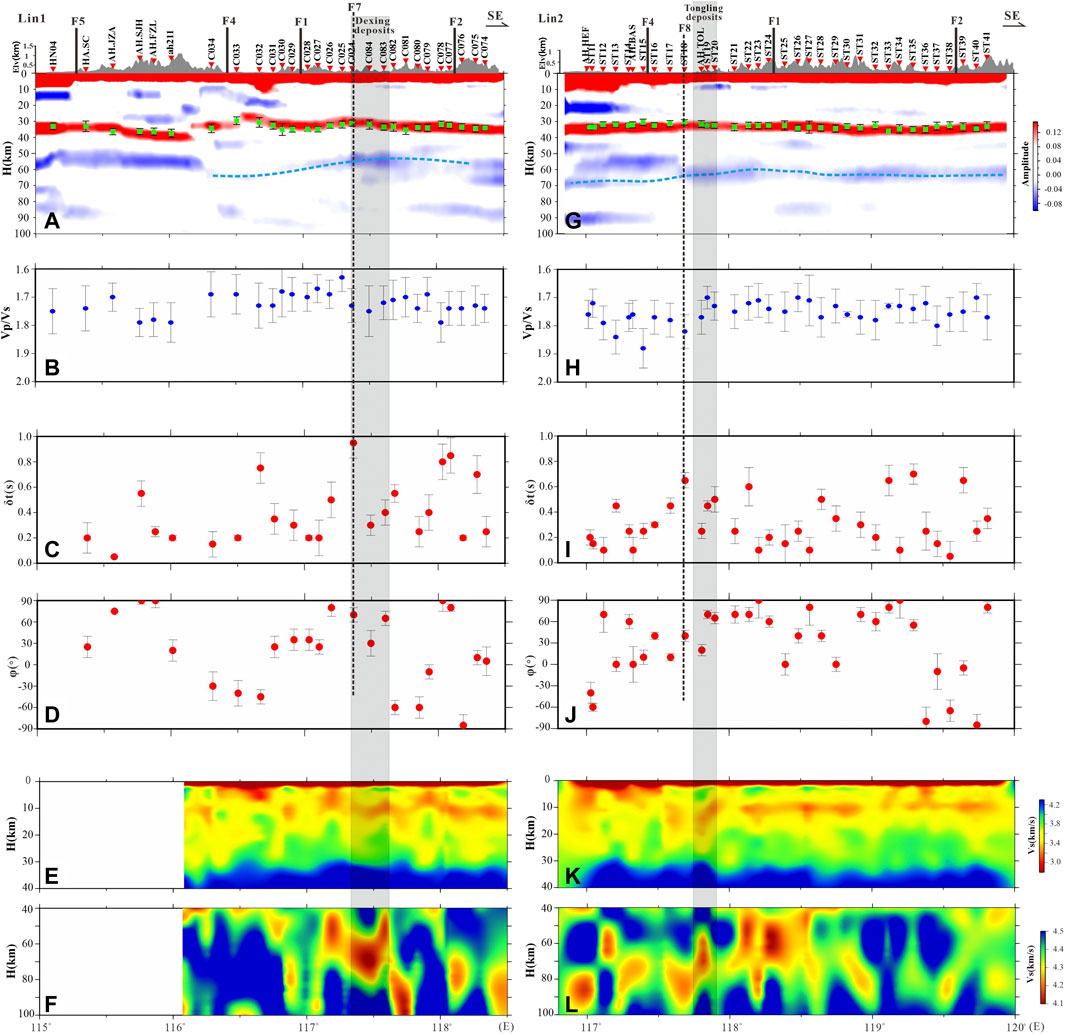
FIGURE 7. Migration cross sections of “Line 1” (A) and “Line 2” (G) of CCP stacking, where the light blue dotted lines denote the location of LAB, and the green squares and error bars correspond to the single station H-κ-c results; Vp/Vs ratio (B,H) and associated errors; anisotropic parameters (δt, φ) (C,D,I,J) and associated errors. We subtracted 180° if φ was >90°, so that the range of φ was (−90°, 90°); velocity structure (E,F,K,L) of nonlinear joint inversion (Ye et al., 2019). Station location and topography along the profile are shown on the top. Gray shading in the background indicates the different metallogenic areas, and the black dashed lines show the positions of the northeast Jiangxi fault (F7) and the Yangtze River Deep Fault (F8) in the sections. Labels are the same as for Figure 1.
Crustal Anisotropy
Overall, we obtained 72 high-quality measurements of crustal anisotropy (Pms) that met the harmonic correction conditions (Figure 6). The delay time varied from <0.1 to 0.95 s, with an average value of 0.35 s. The Pms fitting results for those with Pms delay times greater than 0.5 s of Line 1 and Line 2 are shown in Supplementary Figure S1. The delay time caused by microcracks in the upper crust was typically <0.2 s (Wu et al., 2021). Therefore, the larger delay time observed (mean value of Line1 = 0.4 s; mean value of Line 2 = 0.35 s) most likely resulted from the deformation of the middle or lower crust.
There are a total of 10 stations in the NCB, and the delay time was approximately 0.2 s, indicating weak crustal anisotropy (Shahzad et al., 2021; Wu et al., 2021). The fast directions of the stations close to the Xinyang-Shucheng Fault (F5) were approximately NW-SE, which is nearly parallel to the fault direction and consistent with previous results (Huang et al., 2013; Shi et al., 2013). The LYB has a total of 20 stations and the rose diagram shows a consistent NE-SW fast wave direction for all the stations except for C032, C035, and the two stations close to the Tanlu Fault (F4). Our results are consistent with results revealed by shear wave splitting analyses (Huang et al., 2013). The average polarization direction was 45° and delay time was 0.35 s, which is larger than that for the NCB. The stations C032 and C035 measured large delay times, and the polarization direction was close to the NWN-SES direction, which may be attributed to their location on the thick deposit layer. There are 30 stations in the JOB. The rose diagram shows that the fast direction was also predominately NE-SW, with an averaged polarization direction of 75° and a delay time of 0.32 s. The fast polarization direction was approximately S-N at station C038, which may be affected by the adjacent Jiangnan Buried Fault (F1). At the southern end of JOB, the distribution of fast directions was relatively discrete and the anisotropy pattern was more complex, reflecting the local tectonic complexity of the area (Gao et al., 2011). Except for the two stations distribute close to the Jiangshao Fault (F2), only four stations are located in the CB, and the anisotropy characteristics of these stations differed significantly. The fast directions of stations C074 and C075 in Line1 were NE-SW and those of stations ST40 and ST41 in Line2 were W-E, suggesting a deep and more complex dynamic environment beneath the station CB.
After a comparison of the crustal fast directions in this study with those obtained by SKS wave splitting (blue short bars in Figure 6B, Yang et al., 2019) in LYB and JOB, we observed that the directions were relatively similar, particularly for the stations C024, C083, and C084 situated near the Dexing ore deposits; AH. TOL, ST19, and ST20 located near the Tongling ore deposits; AH. ANQ situated near to the Anqing ore deposits; and JS. NJ located near the Ningwu ore deposits. The crustal fast directions measured at these stations was closer to those noted in of the SKS splitting results, showing a consistent NE-SW direction (Shi et al., 2013), which is nearly perpendicular to the direction of the Paleo-Pacific plate subduction (Li and Li, 2007).
The Tanlu Fault (F4) is a large-scale strike-slip fault formed at the end of the Triassic. The decrease in crustal thickness (<32 km) and the increase in Poisson’s ratio (>0.26) measured for the stations situated near this fault may be related to shear deformation of the lithosphere (Zhang et al., 2015). Moreover, the fast direction gradually rotates near F4 and becomes nearly parallel to the fault when it is close to the fault. The fast direction of station ST16 is parallel to the fault direction (NE-SW), and station C033 is almost perpendicular to the fault strike, indicating that F4 has a weaker influence on the anisotropy at the southern end of the study area.
Discussion
Crustal Structure and Magma Upwelling Channel
Previous studies have shown that the Moho of the MLYMB and the eastern QHMB is relatively uplifted (Shi et al., 2013; Huang et al., 2015; Luo et al., 2019). The results obtained from the broadband seismic array and linear profile further proved that the Moho beneath the metallogenic region is uplifted by 2–4 km compared with its southeast and northwest sides, and the Poisson’s ratio is also higher (>0.26) in this study (Figure 6), which is consistent with the prediction of the underplating model (Lü et al., 2014). The LAB depth acquired by our CCP stacking results was 60–70 km in the Lower Yangtze region (medium light blue dotted line in Figures 7A,G), which is consistent with previous results (Sodoudi et al., 2006; Zheng et al., 2013; Bao et al., 2015; Ye et al., 2019; Zhang et al., 2019). Moreover, we observed an obvious low velocity zone 70 km below the Dexing and Tongling ore deposits (Figures 7F, L, Ye et al., 2019). The P-wave tomography results revealed recognizable low-velocity anomalies in the depth range of 150–400 km beneath the LYB (Jiang et al., 2014, 2021). These velocity anomalies have been interpreted as the source of hot magma injected into the lithosphere (Jiang et al., 2021; Lü et al., 2021).
Deep and large faults significantly influence crustal anisotropy and control the spatial distribution of ore deposits (Yan et al., 2021). Moreover, they provide good channels for magma transporting to the shallow of the crust. The Dexing porphyry copper deposit was formed at the background of Neoproterozoic copper-gold crust remelting (Wang et al., 2019). During the post-orogenic stage of the Jiangnan Orogeny, significant NE shear strike-slip occurred (Zhang et al., 2013). As shown in Figure 7, station C024 near the metallogenic region measured the thinnest crustal, a larger Poisson’s ratio, and the largest delay time compared to both sides, and fast direction deflection was also observed for this station. All of them reveal the trace of the northeast Jiangxi Fault (F7, black dotted line in Figures 7A–D, Yan et al., 2021), providing a channel for the upwelling of mantle-derived materials. However, the delay times obtained by SKS wave splitting of near the metallogenic region show normal values (Figure 6B), and a possible explanation is stronger deformation and anisotropy in the crust after the lithosphere is weakened. The Tongling ore deposit is located in the southeastern uplift and fold belt of the NNE tectonic belt, which is formed during the Indosinian period of the lower Yangtze region. Stations ST17 and ST18 from the Tongling area measured thin crustal thicknesses, larger Poisson’s ratios, and the largest delay time compared to both sides, as well as fast direction deflection. Based on these results, we determined that these most likely represent the trace of the Yangtze River Deep Fault and provide a channel for the upwelling of mantle-derived materials (F8, black dotted line in Figures 7G–J, Lü et al., 2015). The two-dimensional results more clearly limit a possible track of the fault zone in the study area. The mineralization of the Tongling, Anqing, Luzong, and Ningwu ore deposits along the belt indicate that the mineralization process in the MLYMB may be controlled by F8 (Figure 6).
Crustal Anisotropy and Mineralization
Generally, due to the action of the non-hydrostatic stress field, numerous microcracks occur in the shallow crust, and the anisotropy of the shallow crust is mainly caused by the directional arrangement of these microcracks (Crampin and Gao, 2014). The direction of anisotropy caused by the fracture is parallel to the direction of compressive stress. The anisotropy of the middle and lower crust is generally considered to be caused by the directional arrangement of minerals. In particular, rocks rich in mica and hornblende typically exhibit strong anisotropy (Crampin and Peacock, 2008). When compressive stress is applied to rocks, minerals will align along the direction of maximum shear or tensile stress, intersecting or even perpendicular to the compressive stress direction (Tatham et al., 2008). Most of the fast polarization directions in the study area were in the NE-NNE direction, which is consistent with the tectonic direction but inconsistent with the main compressive stress direction (green short rods in Figure 6B). This indicates that crustal anisotropy in the study area predominately arises from the local deformation field in the middle and lower crust.
By comparing the crustal delay time and the splitting time of the SKS wave, we observed that the LYB and JOB measurements (approximately 0.33 s) approached a quarter of the mean splitting time (approximately 1.2 s) determined from the SKS data (Yang et al., 2019). Furthermore, we estimated the thickness of the anisotropic layer from the relationship of
During the early stage (began from the early Jurassic), Pacific subduction was characterized by low angles and rapid subduction rates along the NW–NWW direction at approximately 180 Ma. The dip angle of subduction then increased gradually, accompanied by wedge melting of the mantle and basalt intrusion. The strike-slip shear and torsion related to subduction are considered to be the driving forces of lithosphere extension, as well as thinning and magmatic activities in eastern South China (Gilder et al., 1996). During the early Cretaceous, the direction of back arc extension of the eastern continental margin of China was controlled and changed by the direction of Pacific subduction, resulting in strong NW-SE stretching and the formation of numerous related extensional basins in the eastern part of South China (Zhu et al., 2012). The crustal thinning zone (Li et al., 2013; Han et al., 2019; Shahzad et al., 2021) and upper-mantle low-velocity anomalies (Jiang et al., 2014) show a consistent distribution in the NE-SW direction, which is consistent with that of the crustal anisotropic fast directions revealed in this study and approximately parallel to the strike of the adjacent fault, indicating the direction of migration with ore-forming fluid (or magma) (Jiang et al., 2021). At the block scale, various layers of the lithosphere are dominated by coupling deformation. Moreover, crustal anisotropy in the metallogenic area was significantly enhanced (Figure 6A, average delay time = 0.45 s), which may be attributed to the migration of large-scale molten magma along the fault zone and the superposition of ductile shear deformation in the lower crust.
Conclusion
This paper investigated the crustal structure and anisotropy in the Lower Yangtze region and its adjacent areas by teleseismic receiver functions, combining the previous velocity structure of the crust and upper mantle. The high resolution results show that: 1) The Moho is uplifted by 2–4 km beneath the metallogenic area, and the Poisson’s ratio is also relatively higher (>0.26), which is consistent with the prediction of the underplating model. 2) The significant local anisotropy of the MLYMB and the Dexing porphyry copper deposit (delay time = 0.45 s) is caused by mantle-derived material upwelling and underplating or the local lateral ductile shear in the lower crust. The NE-SW fast polarization direction is consistent with those of the SKS splitting results, indicating that various layers of the lithosphere are dominated by coupling deformation. 3) The variation characteristics of crustal thickness, Vp/Vs ratio, fast polarization direction and delay time have consistently revealed that the northeast Jiangxi Fault and Yangtze River Deep Fault Zone may serve as the channel for the upwelling of ore-forming fluid.
Data Availability Statement
The original contributions presented in the study are included in the article/Supplementary Material, further inquiries can be directed to the corresponding authors.
Author Contributions
RH: methodology, writing—original draft. DY: funding acquisition, project administration, proper guidance QL: conceptualization, supervision, provided raw data, review and editing. HC: data processing, investigation. HZ: formal analysis, software. ZY: data curation, investigation. YC: investigation, editing. WF: investigation, methodology.
Funding
This work was supported by the National Natural Science Foundation of China (Grant Nos 91962110, 20181311579, 41774113 and 42104099), and China Postdoctoral Science Foundation (Grant No. 2021M690087).
Conflict of Interest
The authors declare that the research was conducted in the absence of any commercial or financial relationships that could be construed as a potential conflict of interest.
Publisher’s Note
All claims expressed in this article are solely those of the authors and do not necessarily represent those of their affiliated organizations, or those of the publisher, the editors and the reviewers. Any product that may be evaluated in this article, or claim that may be made by its manufacturer, is not guaranteed or endorsed by the publisher.
Acknowledgments
We thank Jiangtao Li (Wuhan University), Jiayong Yan and Jianhua Li (Chinese Academy of Geological Sciences), Doc. Nian Wang (Tsinghua University) for providing valuable advice about the discussion. The broadband portable stations data acquisition by Land Resource Survey Project of China Geological Survey undertaken by Institute of geology, Chinese Academy of Geological Sciences (Grant Nos. 12120114067701, DD20179354) and SinoProbe02-03 (grant 201011042). The permanent data were supplied by the Data Management Center of the China National Seismic Network. Most of the figures were made using Generic Mapping Tools (Wessel and Smith, 1998).
Supplementary Material
The Supplementary Material for this article can be found online at: https://www.frontiersin.org/articles/10.3389/feart.2022.849088/full#supplementary-material
References
An, M., and Shi, Y. (2006). Lithospheric Thickness of the Chinese Continent. Phys. Earth Planet. Interiors 159 (3-4), 257–266. doi:10.1016/j.pepi.2006.08.002
Bao, X., Song, X., and Li, J. (2015). High-resolution Lithospheric Structure beneath Mainland China from Ambient Noise and Earthquake Surface-Wave Tomography. Earth Planet. Sci. Lett. 417, 132–141. doi:10.1016/j.epsl.2015.02.024
Barruol, G., and Fontaine, F. R. (2013). Mantle Flow beneath La Réunion Hotspot Track from SKS Splitting. Earth Planet. Sci. LettersSci. Lett. 362, 108–121. doi:10.1016/j.epsl.2012.11.017
Chang, Y. F., Li, J. H., and Song, C. Z. (2019). The Regional Tectonic Framework and Some New Understandings of the Middle-Lower Yangtze River Valley Metallogenic Belt. Acta Petrologica Sinica 35 (12), 3579–3591. doi:10.18654/1000-0569./2019.12.01
Chen, A. G., Zhou, T. F., Liu, D. J., and Ge, C. (2017). The Moho Depth and Metallogenic Setting of the Middle-Lower Yangtze River Valley Metallogenic Belt and its Adjacent Areas. Acta Geologica sinica 91 (06), 1299∼1311.
Chen, L., Zheng, T., and Xu, W. (2006). A Thinned Lithospheric Image of the Tanlu Fault Zone, Eastern China: Constructed from Wave Equation Based Receiver Function Migration. J. Geophys. Res. 111 (B9), B09321. doi:10.1029/2005jb003974
Crampin, S., and Peacock, S. (2008). A Review of the Current Understanding of Seismic Shear-Wave Splitting in the Earth's Crust and Common Fallacies in Interpretation. Wave Motion 45 (6), 675–722. doi:10.1016/j.wavemoti.2008.01.003
Deng, Y. F., Li, S. L., Fan, W. M., and Liu, J. (2011). Crustal Structure beneath South China Revealed by Deep Seismic Soundings and its Dynamics Implications. Chin. J. Geophys. 54 (10), 2560–2574. doi:10.3969/j.issn.0001-5733.2011.10.013
Dong, S.-W., Li, T.-D., Lü, Q.-T., Gao, R., Yang, J.-S., Chen, X.-H., et al. (2013). Progress in Deep Lithospheric Exploration of the continental China: a Review of the SinoProbe. Tectonophysics 606, 1–13. doi:10.1016/j.tecto.2013.05.038
Dueker, K. G., and Sheehan, A. F. (1997). Mantle Discontinuity Structure from Midpoint Stacks of Converted P to S Waves across the Yellowstone Hotspot Track. J. Geophys. Res. 102 (B4), 8313–8327. doi:10.1029/96JB03857
Frederiksen, A. W., and Bostock, M. G. (2000). Modelling Teleseismic Waves in Dipping Anisotropic Structures. Geophys. J. Int. 141, 401–412. doi:10.1046/j.1365-246x.2000.00090.x
Gao, R., Lu, Z. W., Liu, J. K., Kuang, C. Y., Feng, S. Y., Li, P. W., et al. (2010). A Result of Interpreting from Deep Seismic Reflection Profile Revealing fine Structure of the Crust and Tracing Deep Process of the Mineralization in Lu-Zong deposit Area. Acta Petrol. Sinica 26 (9), 2543–2552.
Gao, Y., Wu, J., Fukao, Y., Shi, Y., and Zhu, A. (2011). Shear Wave Splitting in the Crust in North China: Stress, Faults and Tectonic Implications. Geophys. J. Int. 187 (2), 642–654. doi:10.1111/j.1365-246X.2011.05200.x
Gilder, S. A., Gill, J., Coe, R. S., Zhao, X., Liu, Z., Wang, G., et al. (1996). Isotopic and Paleomagnetic Constraints on the Mesozoic Tectonic Evolution of South China. J. Geophys. Res. 101 (B7), 16137–16154. doi:10.1029/96JB00662
Gu, Q. P., Ding, Z. F., Kang, Q. Q., and Zhao, Q. G. (2016). Pn Wave Velocity and Anisotropy in the Middle-Southern Segment of the Tan-Lu Fault Zone and Adjacent Region. Chin. J. Geophys. 59 (2), 504–515. doi:10.6038/cjg20160210
Han, R. B., Li, Q. S., Xu, Y. X., Zhang, H. S., Chen, H., Lang, C., et al. (2019). Deep Structure Background and Poisson's Ration beneath the Intersection Zone of Nanling and Wuyi. Chin. J .Geophys. 62 (7), 2477–2489. doi:10.6038/cjg2019M02017
Han, R., Li, Q., Huang, R., and Zhang, H. (2020). Detailed Structure of Mantle Transition Zone beneath southeastern China and its Implications for Thinning of the continental Lithosphere. Tectonophysics 789, 228480. doi:10.1016/j.tecto.2020.228480
Heidbach, O., Rajabi, M., Cui, X., Fuchs, K., Müller, B., Reinecker, J., et al. (2018). The World Stress Map Database Release 2016: Crustal Stress Pattern across Scales. Tectonophysics 744, 484–498. doi:10.1016/j.tecto.2018.07.007
Huang, H., Xu, M., Wang, L., Huang, Z., Wang, P., Mi, N., et al. (2013). Distinct Lateral Variations of Upper Mantle Anisotropy beneath Eastern China Revealed by Shear-Wave Splitting. Geochem. Geophys. Geosyst. 14 (6), 1842–1855. doi:10.1002/ggge.20126
Huang, R., Xu, Y., Zhu, L., and He, K. (2015). Detailed Moho Geometry beneath southeastern China and its Implications on Thinning of continental Crust. J. Asian Earth Sci. 112, 42–48. doi:10.1016/j.jseaes.2015.09.002
Huang, Z., Wang, L., Zhao, D., Mi, N., and Xu, M. (2011). Seismic Anisotropy and Mantle Dynamics beneath China. Earth Planet. Sci. Lett. 306 (1-2), 105–117. doi:10.1016/j.epsl.2011.03.038
Ji, S., Wang, Q., and Salisbury, M. H. (2009). Composition and Tectonic Evolution of the Chinese continental Crust Constrained by Poisson's Ratio. Tectonophysics 463, 15–30. doi:10.1016/j.tecto.2008.09.007
Jiang, G. M., Zhang, G. B., Lü, Q. T., Shi, D. N., and Xu, Y. (2014). Deep Geodynamics of Mineralization beneath the Middle-Lower Reaches of Yangtze River: Evidence from Teleseismic Tomography. Acta Petrologica Sinica 30 (4), 907–917. doi:10.1127/0078-0421/2014/0044
Jiang, G. M., Zhang, G. B., Zhao, D. P., Lü, Q. T., Shi, D. N., Li, H. Y., et al. (2021). Mantle Flow and Dynamics beneath Central‐East China: New Insights from P‐Wave Anisotropic Tomography. J. Geophys. Res. Solid Earth 126 (5), e2020JB020070. doi:10.1016/j.tecto.2013.01.01210.1029/2020jb020070
Li, J., Song, X. D., and Song, X. (2021). Crustal Structure beneath the Hi-CLIMB Seismic Array in the central-western Tibetan Plateau from the Improved H-κ-C Method. Earthq Sci. 34 (3), 1–12. doi:10.29382/eqs-2021-0002
Li, J., Song, X., Wang, P., and Zhu, L. (2019). A Generalized H‐κ Method with Harmonic Corrections on Ps and its Crustal Multiples in Receiver Functions. J. Geophys. Res. Solid Earth 124 (4), 3782–3801. doi:10.1029/2018JB016356
Li, Q., Gao, R., Wu, F. T., Guan, Y., Ye, Z., and Liu, Q., (2013). Seismic Structure in the southeastern China Using Teleseismic Receiver Functions. Tectonophysics 606, 24–35. doi:10.1016/j.tecto.2013.06.033
Li, S. Z., Zang, Y. B., Wang, P. C., Suo, Y. H., Li, X. Y., Liu, X., et al. (2017). Mesozoic Tectonic Transition in South China and Initiation of Palaeo-Pacific Subduction. Earth Scirnce Front. 24 (4), 213–225. doi:10.13745/j.esf.yx.2017-4-13
Li, Z. X., and Li, X. H. (2007). Formation of the 1300-km-wide Intracontinental Orogen and Postorogenic Magmatic Province in Mesozoic South China: A Flat-Slab Subduction Model. Geology 35 (2), 179–182. doi:10.1130/G23193A.1
Ligorría, J. P., and Ammon, C. J. (1999). Iterative Deconvolution and Receiver-Function Estimation. Bull. Seismological Soc. America 89, 1395–1400. doi:10.1029/1999JB900220
Lin, W., Xu, D., Hou, Q. L., Li, S. J., Meng, L. T., Ren, Z. H., et al. (2019). Early Cretaceous Extensional Dome and Related Polymetallic Mineralization in the Central and Eastern China. Geotectonica et Metallogenia 409–430. doi:10.16539/j.ddgzyckx.2019.03.004
Liu, B., Li, S. Z., Wang, P. C., LiuLi, X. X. Y., and Zhao, S. J. (2018). Deep-seated Structural Styles and Mesozoic Metallogenic Dynamic Model in the Middle-Lower Yangtze Region, China. Acta Petrologica Sinica 34 (3), 799–812.doi:10.4095/329175
Liu, H., and Niu, F. (2012). Estimating Crustal Seismic Anisotropy with a Joint Analysis of Radial and Transverse Receiver Function Data. Geophys. J. Int. 188 (1), 144–164. doi:10.1111/j.1365-246X.2011.05249.x
Liu, W., Guo, Z., Chen, Y. S., and Zhang, A. Q. (2021). The Crustal and Uppermost Mantle Structure of the Qinling-Tongbai-Dabie Orogenic belt from Integrated Geophysical Observations. Chin. J. Geophys. 64 (9), 3179–3193. doi:10.6038/cjg2021O0406
Lü, Q. T., Dong, S. W., Shi, D. N., Tang, J. T., Jiang, G. M., Zhang, Y. Q., et al. (2014). Lithosphere Architecture and Geodynamic Model of Middle and Lower Reaches of Yangtze Metallogenic Belt: A Review from SinoProbe. Acta Petrologica Sinica 30 (4), 889–906.doi:10.1016/j.oregeorev.2021.103989
Lü, Q. T., Dong, S. W., Tang, J. T., Shi, D. N., and Chang, Y. F.SinProbe-03-CJ Group (2015). Multi-scale and Integrated Geophysical Data Revealing mineral Systems and Exploring for mineral Deposits at Depth: a Synthesis from SinoProbe-03. Chin. J. Geophys. 58 (12), 4319–4343. doi:10.6038/cjg20151201
Lü, Q. T., Meng, G. X., Zhang, K., Liu, Z. D., Yan, J. Y., Shi, D. N., et al. (2021). The Lithospheric Architecture of the Lower Yangtze Metallogenic Belt, East China: Insights into an Extensive Fe–Cu mineral System. Ore Geology. Rev. 132 103989, doi:10.1016/j.oregeorev.2021.103989
Luo, S., Yao, H. J., Li, Q. S., Wang, W. T., Wan, K. S., Meng, Y. F., et al. (2019). High-resolution 3D Crustal S-Wave Velocity Structure of the Middle-Lower Yangtze River Metallogenic Belt and Implications for its Deep Geodynamic Setting. Sci. China Earth Sci. 62 (9), 1361–1378. doi:10.1007/s11430-018-9352-9
Mahmoodabadi, M., Yaminifard, F., Tatar, M., and Moradi, A. (2020) Layered Crustal Anisotropy in Eastern Iran. Proceedings of the the 19th Iranian Geophysical Conference, Tehran, 477–479.
Mao, J., Pirajno, F., and Cook, N. (2011). Mesozoic Metallogeny in East China and Corresponding Geodynamic Settings-An Introduction to the Special Issue. Ore Geology. Rev. 43 (1), 1–7. doi:10.1016/j.oregeorev.2011.09.003
McNamara, D. E., Owens, T. J., Silver, P. G., and Wu, F. T. (1994). Shear Wave Anisotropy beneath the Tibetan Plateau. J. Geophys. Res. 99, 13655–13665. doi:10.1029/93JB03406
Meng, Y. F., Yao, H. J., Wang, X. Z., Li, L. L., Feng, J. K., Hong, D. Q., et al. (2021). Crustal Velocity Structure and Deformation Features in the central-southern Segment of Tanlu Fault Zone and its Adjacent Area from Ambient Noise Tomography. Chin. J. Geophys. 62 (7), 2490–2509. doi:10.6038/cjg2019M0189
Nagaya, M., Oda, H., Akazawa, H., and Ishise, M. (2008). Receiver Functions of Seismic Waves in Layered Anisotropic media: Application to the Estimate of Seismic Anisotropy. Bull. Seismol Soc. Am. 98, 2990–3006. doi:10.1785/0120080130
Ni, P., and Wang, G. G. (2017). Multiple Episodes of Cu-Au Mineralization in the Northeastern Section of the Qin-Hang Metallogenic belt Induced by Reworking of continental Crust. Acta Petrologica Sinica 33, 3373–3394.doi:10.1016/j.lithos.2018.01.017
Niu, M. L., Zhu, G., Liu, G. S., Song, C. Z., and Wang, D. X. (2005). Cenozoic Volcanic Activities and Deep Processes in the Middle-South Sector of the Tan-Lu Fault Zone. Chin. J. Geology. 40 (3), 390–403. doi:10.1016/j.tecto.2022.229234
Ouyang, L. B., Li, H. Y., Lü, Q. T., Li, X. F., Jiang, G. M., Zhang, G. B., et al. (2015). Crustal Shear Wave Velocity Structure and Radial Anisotropy beneath the Middle-Lower Yangtze River Metallogenic belt and Surrounding Areas from Seismic Ambient Noise Tomography. Chin. J. Geophys. 58 (12), 4388–4402. doi:10.6038/cjg20151205
Savage, M. K. (1998). Lower Crustal Anisotropy or Dipping Boundaries? Effects on Receiver Functions and a Case Study in New Zealand. J. Geophys. Res. Solid Earth 103 (B7), 15069–15087. doi:10.1029/98jb00795
Savage, M. K. (1999). Seismic Anisotropy and Mantle Deformation: what Have We Learned from Shear Wave Splitting. Rev. Geophys. 37 (1), 65–106. doi:10.1029/98RG02075
Shahzad, S. M., Liu, J. X., Sun, Y., and Li, C. (2021). Crustal Structure and Deformation in southeastern China Revealed by Receiver Functions. J. Asian Earth Sci. 221, 104937. doi:10.1016/j.jseaes.2021.104937
Shi, D. N., Lü, Q. T., Xu, W. Y., Yan, J. Y., Zhao, J. H., Dong, S. W., et al. (2013). Crustal Structure beneath the Middle–Lower Yangtze Metallogenic belt in East China: Constraints from Passive Source Seismic experiment on the Mesozoic Intra-continental Mineralization. Tectonophysics 606, 48–59. doi:10.1016/j.tecto.2013.01.012
Shu, L. S. (2012). An Analysis of Principal Features of Tectonic Evolution in South China Block. Geol. Bull. China 31 (7), 1035–1053. doi:10.3969/j.issn.1671-2552.2012.07.003
Sodoudi, F., Yuan, X., Liu, Q., Kind, R., and Chen, J. (2006). Lithospheric Thickness beneath the Dabie Shan, central Eastern China from S Receiver Functions. Geophys. J. Int. 166, 1363–1367. doi:10.1111/j.1365-246X.2006.03080.x
Crampin, S., and Gao, Y. (2014). Two Species of Microcracks. Appl. Geophys. 11 (1), 1–8. doi:10.1007/s11770-014-0415-7
Tan, P., and Nie, S. T. (2021). Crustal Deformation in Eastern Margin of Tibetan Plateau from a Dense Linear Seismic Array. Phys. Earth Planet. Interiors 321, 106801. doi:10.1016/j.pepi.2021.106801
Tatham, D. J., Lloyd, G. E., Butler, R., and Casey, M. (2008). Amphibole and Lower Crustal Seismic Properties-ScienceDirect. Earth Planet. Sci. Lett. 267 (1-2), 118–128. doi:10.1016/j.epst.2007.11.04210.1016/j.epsl.2007.11.042
Teng, J. W., Zhang, Z. J., Zhang, X. K., Wang, C. Y., Gao, R., Yang, B. J., et al. (2013). Investigation of the Moho Discontinuity beneath the Chinese mainland Using Deep Seismic Sounding Profiles. Tectonophysics 609, 202–216. doi:10.1016/j.tecto.2012.11.024
Tian, X. B., and Santosh, M. (2015). Fossilized Lithospheric Deformation Revealed by Teleseismic Shear Wave Splitting in Eastern China. GSA Today 25 (2), 4–10. doi:10.1130/GSATG220A.1
Wang, C. Y., Chang, L. J., Ding, Z. F., Liu, Q. L., Liao, W. L., and Flesch, L. M. (2014). Upper Mantle Anisotropy and Crust-Mantle Deformation Pattern beneath the Chinese mainland. Sci. China Earth Sci. 57, 132–143. doi:10.1007/s11430-013-4675-5
Wang, G., Fang, H., Qiu, G. G., and Huang, J. M. (2019). The Deep Electrical Structure across Anqing-Guichi Ore Concentration Area. Geology. China 46 (4), 795–806. doi:10.12029/gc20190410
Wang, N., Montagner, J. P., Burgos, G., Capdeville, Y., and Yu, D. X. (2015). Intrinsic versus Extrinsic Seismic Anisotropy: Surface Wave Phase Velocity Inversion. Comptes Rendus Geosci. 347 (2), 66–76. doi:10.1016/j.crte.2015.02.010
Wang, Q., Niu, F. L., Gao, Y., and Chen, Y. T. (2016). Crustal Structure and Deformation beneath the NE Margin of the Tibetan Plateau Constrained by Teleseismic Receiver Function Data. Geophys. J. Int. 204 (1), 167–179. doi:10.1093/gji/ggv420
Wang, X. L., Liu, J. X., Lü, Q. T., Wang, S., Wang, D., and Chen, X. (2021). Evolution of Deep Crustal Hot Zones Constrained by the Diversity of Late Mesozoic Magmatic Rocks in SE China. Ore Geology. Rev. 134, 104143. doi:10.1016/j.oregeorev.2021.104143
Wessel, P., and Smith, W. (1998). New, Improved Version of Generic Mapping Tools Released. Eos. Trans. Am. Geophys. Union 79 (47), 579. doi:10.1029/98EO00426
Wu, C. L., Xu, T., Ai, Y. S., Dong, W. Y., Li, L., and Hou, J. (2021). Crustal Azimuthal Anisotropy in the Jiaodong Peninsula: Evidence for the Suture between the North China Craton and South China Block. Phys. Earth Planet. Interiors 314, 106705. doi:10.1016/j.pepi.2021.106705
Xu, T., Zhang, Z. J., Tian, X. B., Liu, B. F., Bai, Z. M., Lü, Q. T., et al. (2014). Crustal Structure beneath the Middle-Lower Yangtze Metallogenic belt and its Surrounding Areas: Constraints from Active Source Seismic experiment along the Lixin to Yixing Profile in East China. Acta Petrologica Sinica 30 (4), 918–930.doi:10.1016/j.tecto.2013.01.012
Yan, J. Y., Lü, Q. T., Luo, F., Cheng, S. B., Zhang, K., Zhang, Y. Q., et al. (2021). A Gravity and Magnetic Study of Lithospheric Architecture and Structures of South China with Implications for the Distribution of Plutons and mineral Systems of the Main Metallogenic Belts. J. Asian Earth Sci. 221, 104938. doi:10.1016/j.jseaes.2021.104938
Yang, X. Y., Li, H. Y., Li, Y. H., Lü, Q. T., Zhang, G. B., Jiang, G. M., et al. (2019). Seismic Anisotropy beneath Eastern China from Shear Wave Splitting. Geophys. J. Int. 218 (3), 1642–1651. doi:10.1093/gji/ggz242
Yang, X. Z., Luo, Y. H., Xu, H. R., and Zhao, K. F. (2020). Shear Wave Velocity and Radial Anisotropy Structures beneath the central Pacific from Surface Wave Analysis of OBS Records. Earth Planet. Sci. Lett. 534, 116086. doi:10.1016/j.epsl.2020.116086
Yang, Y., Yao, H. J., Zhang, P., and Chen, L. (2018). Crustal Azimuthal Anisotropy in the Trans-North China Orogen and Adjacent Regions from Receiver Functions. Sci. China Earth Sci. 61, 903–913. doi:10.1007/s11430-017-9209-9
Ye, Z., Li, Q. S., Zhang, H. S., Li, J. T., Wang, X. R., Han, R. B., et al. (2019). Crustal and Uppermost Mantle Structure across the Lower Yangtze Region and its Implications for the Late Mesozoic Magmatism and Metallogenesis, Eastern South China. Phys. Earth Planet. Interiors 297, 106324. doi:10.1016/j.pepi.2019.106324
Zhang, G. W., Guo, A. L., Wang, Y. J., Li, S. Z., Dong, Y. P., Liu, S. F., et al. (2013). Tectonics of South China Continent and its Implications. Sci. China: Earth Sci. 56, 1804–1828. doi:10.1007/s11430-013-4679-1
Zhang, M., Tao, X., Lü, Q. T., Bai, Z. M., Wu, C. L., Wu, Z. B., et al. (2015). 3D Moho Depth beneath the Middle-Lower Yangtze Metallogenic belt and its Surrounding Areas: Insight from the Wide Angle Seismic Data. Chin. J. Geophys. 58 (12), 4360–4372. doi:10.6038/cjg20151203
Zhang, Y. Q., Shi, D. N., Lü, Q. T., Xu, Y., Xu, Z. W., Yan, J. Y., et al. (2021). The Crustal Thickness and Composition in the Eastern South China Block Constrained by Receiver Functions: Implications for the Geological Setting and Metallogenesis. Ore Geology. Rev. 130 (1), 103988. doi:10.1016/j.oregeorev.2021.103988
Zhang, Y. Y., Fang, H., Qiu, G. G., Ai, Y. S., and Zhao, L. (2019). The Lithospheric Structure of the Lower Yangtze Craton and its Adjacent Regions by S Receiver Function Imaging. Geology. China 46 (4), 786–794. doi:10.12029/gc20190409
Zhao, L., Zheng, T. Y., Chen, L., and Tang, Q. S. (2007). Shear Wave Splitting in Eastern and central China: Implications for Upper Mantle Deformation beneath continental Margin. Phys. Earth Planet. Interiors 162 (1-2), 73–84. doi:10.1016/j.pepi.2007.03.004
Zheng, T. Y., Zhao, L., He, Y. M., and Zhu, R. X. (2013). Seismic Imaging of Crustal Reworking and Lithospheric Modification in Eastern China. Geophys. J. Int. 196, 656–670. doi:10.1093/gji/ggt420
Zhou, Z. B., Wen, H. J., Qin, C. J., and Liu, L. (2017). Geochemical and Isotopic Evidence for a Magmatic-Hydrothermal Origin of the Polymetallic Vein-type Zn-Pb Deposits in the Northwest Margin of Jiangnan Orogen, South China. Ore Geology. Rev. 86, 673–691. doi:10.1016/j.oregeorev.2017.03.022
Zhu, G., Jiang, D. Z., Zhang, B. L., and Chen, Y. (2012). Destruction of the Eastern North China Craton in a Backarc Setting: Evidence from Crustal Deformation Kinematics. Gondwana Res. 22, 86–103. doi:10.1016/j.gr.2011.08.005
Keywords: lower Yangtze, crustal anisotropy, H-κ-c, asthenosphere flow, Paleo-Pacific plate subduction
Citation: Han R, Yang D, Li Q, Chen H, Zhang H, Ye Z, Cheng Y and Fu W (2022) Crustal Structure and Anisotropy in the Lower Yangtze Region and its Metallogenic Implications. Front. Earth Sci. 10:849088. doi: 10.3389/feart.2022.849088
Received: 05 January 2022; Accepted: 28 January 2022;
Published: 09 March 2022.
Edited by:
Hanlin Chen, Zhejiang University, ChinaReviewed by:
Xuewei Bao, Zhejiang University, ChinaZhouchuan Huang, Nanjing Normal University, China
Copyright © 2022 Han, Yang, Li, Chen, Zhang, Ye, Cheng and Fu. This is an open-access article distributed under the terms of the Creative Commons Attribution License (CC BY). The use, distribution or reproduction in other forums is permitted, provided the original author(s) and the copyright owner(s) are credited and that the original publication in this journal is cited, in accordance with accepted academic practice. No use, distribution or reproduction is permitted which does not comply with these terms.
*Correspondence: Dinghui Yang, ydh@tsinghua.edu.cn; Qiusheng Li, lqs1958@163.com