Adsorption Characteristics and Pore Structure of Organic-Rich Shale With Different Moisture Contents
 Yan Liu1
  Qian Cao
- 1College of Energy and Resources Chengdu University of Technology, Chengdu, China
- 2Shale Gas Evaluation and Exploitation Key Laboratory of Sichuan Province, Chengdu, China
- 3Sichuan Keyuan Testing Center of Engineering Technology, Chengdu, China
- 4State Key Laboratory of Petroleum Resources and Prospecting, China University of Petroleum, Beijing, China
- 5College of Geosciences, China University of Petroleum, Beijing, China
- 6Petroleum Exploration and Production Research Institute, SINOPEC, Beijing, China
A moisture equilibration test has been designed to study the pore structure and adsorption capacity of organic-rich shale with different moisture contents. Five humidity environments were artificially controlled to obtain shale samples with different moisture contents. With the moisture equilibration test and N2 adsorption/desorption, the differences in pore structure of samples with different moisture contents were compared and analysed. The results showed that the diameter of 2–10 nm pores decreased with increasing humidity and that the moisture adsorption characteristics conformed to the GAB adsorption model. It is proposed that when moisture enters a sample, monolayer adsorption will first occur because moisture is preferentially adsorbed on the pore surface with strong hydrophilicity, filling in the relatively small pores. Mesopores and micropores play a major role in water adsorption. With increasing humidity, capillary condensation of moisture gradually occurs in pores. Based on the methane isothermal adsorption test of shale samples with different moisture contents, a quantitative linear relationship between the moisture content and methane adsorption capacity of shale samples has been established. It has been determined that the methane adsorption capacity of shale in underwater conditions is less than that of dry samples, and that the rate of decline in the adsorption capacity of different samples under dry and water balance conditions varies greatly. The distribution characteristics of clay minerals are the main controlling factor of the hydrophilicity of shale, which has a certain guiding significance for further accurate evaluation of shale adsorption gas reserves.
Introduction
With the vigorous promotion of marine shale gas exploration in the Lower Paleozoic in South China, relatively ideal industrial shale gas production capacity has been achieved in the Sichuan Basin. However, exploration and development of marine shale gas in the Sichuan Basin still face severe challenges (Dong et al., 2014; Zhang et al., 2021). Geological drilling finds many shale formations with natural gas, and the amount of adsorbed gas is considerable in laboratory experiments, but the gas content measured from drill core samples is low, or the actual gas well productivity is very low. The large difference between actual and predicted production of shale gas and the rapid decrease in gas production make it difficult to determine shale gas exploration targets.
Free gas and adsorbed gas are the main forms of gas in shale and the direct parameter to evaluate the gas-bearing property of shale (Zhang et al., 2010; Fan et al., 2017). The isothermal adsorption test is the main method for calculating the adsorbed gas content of a shale reservoir. The adsorbed gas content is calculated by modeling the adsorption capability of shale samples under different temperatures and pressures (Zhao et al., 2021).
The methane adsorption capacity of marine shale is mainly influenced by the TOC content (Sun et al., 2018; Jiao et al., 2019). At present, it is generally accepted that the adsorbed gas in shale gas complies with the isothermal adsorption mechanism of a solid-gas interface. However, shale reservoirs are generally deposited in environments like tidal flats, swamps, or deep-water basins (Wang et al., 2021). The pore surface and formation water distributions are ignored in the analysis of adsorption capacity based on isothermal adsorption test results from dry samples, which is one of the main reasons restricting the reliability of shale gas resource assessment (Behar et al., 1995; Leif and Simoneit, 2000; Wang et al., 2006; Helgeson et al., 2009).
Many researchers have studied the influence of moisture on the adsorption capacity of samples. In research on methane adsorption in coal seams, Su and Lin (2007) found that with increasing moisture content, the adsorbed gas volume in an aqueous sample may decrease by 50% compared with that of a dry sample. The adsorption capacity for methane decreases by 40–75% in organic-rich shale with moisture. The reason for this is that under moist conditions, water molecules exist in an adsorption state near polar functional groups, and water blocks some small pores, reducing adsorption capacity; meanwhile, the effect of water film in large pores changes the adsorption capacity of methane in shale. The combination of these two effects results in a significant decrease in shale adsorption capacity (Ross and Bustin, 2008; Gasparik et al., 2012; Li, 2017; Sun et al., 2021). Under stratigraphic conditions, a shale reservoir often has a certain moisture content, which poses difficulties for the evaluation of gas resources. To reasonably evaluate the adsorption capacity of shale under water-bearing conditions, it is necessary to further study the influence of water on the adsorption gas content of shale with different moisture contents, to clarify the enrichment mechanism of shale gas in organic-rich shale, and to accurately calculate the content of shale gas under actual formation conditions.
A marine organic-rich shale with high thermal evaluation in the Sichuan Basin was selected. Multiplemethods, such as scanning electron microscopy (SEM), N2 adsorption/desorption, and CH4 isothermal adsorption, were used to characterize the characteristics of microscopic storage space development and pore structure and were combined with the moisture equilibration test to quantitatively analyze the water distribution characteristics of the pore surface in shale with high evolution. This confirmed a relationship between adsorbed gas content and water content, which provided a theoretical basis for reasonable evaluation of adsorbed gas and shale reservoir productivity.
Materials and Methods
Samples
Six samples were obtainedfrom the coring well of the Lower Silurian Longmaxi formation in the southeastern Sichuan Basin. X-ray diffraction mineral analysis, porosity measurement, and total organic carbon (TOC) testing were carried out; the results are shown in Table 1.
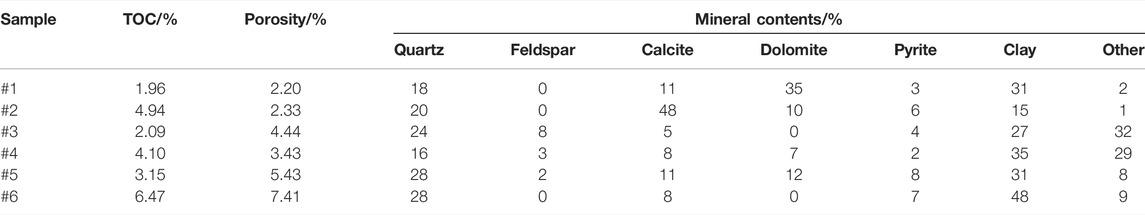
TABLE 1. Experimental results for shale samples.
Moisture Equilibration Test
The moisture equilibration test was used to study moisture distribution in the samples. By measuring the relationship between variations in moisture content and the corresponding partial pressure of water vapor (i.e., relative humidity, or RH), the isothermal adsorption curve of water vapor was obtained. An appropriate isothermal adsorption model was used to obtain parameters such as the saturated adsorption capacity of water and to further clarify the internal adsorption mechanism between shale and water.
The samples were crushed to 60–80 mesh (0.180–0.250 mm). Before the moisture equilibration test, the samples were dried at 60°C for more than 24 h to a constant weight to ensure that the adsorbed water on the sample surface was completely dried and that the structure of clay and organic matter would not be destroyed. Five kinds of saturated salt solutions were configured at a constant temperature of 25°C, the corresponding saturated vapor pressure (RH) at room temperature was determined in accordance with ASTM D1412, and the relative humidity was recorded (Table 2). After drying, each of the six samples was divided into six parts, with the weight of each part being about 20 g. One part of each sample was kept aside for comparison and kept dry in the dryer. The remaining five samples were placed above the saturated salt solution for the moisture equilibration test under different humidity conditions. To ensure the moisture balance of the test samples, each group of moisture equilibration tests lasted for 1 month, during which the ambient temperature remained stable.
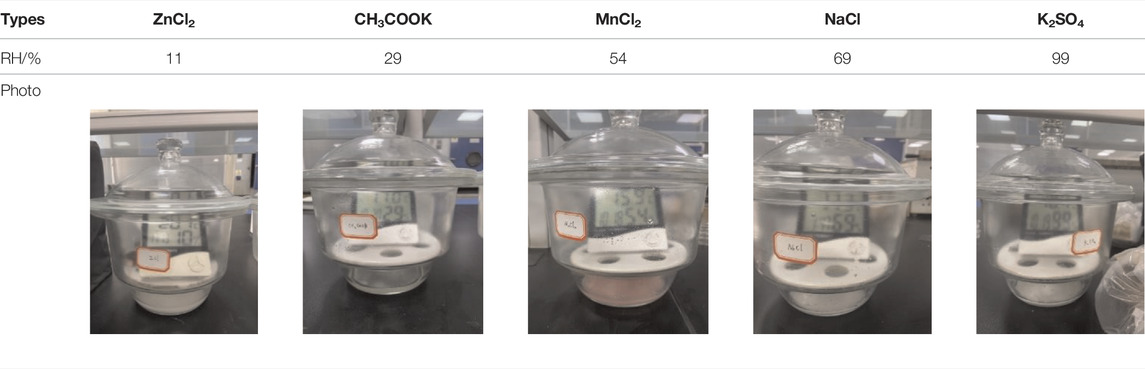
TABLE 2. Relative humidity of different saturated salt solutions.
The adsorbed moisture contents of the samples were measured by weighing. Generally, the higher the relative humidity of the saturated solution and the higher the water vapor content in the environment indicate more adsorbed moisture in the samples. The water adsorption of samples under different humidity conditions was equal to the moisture content, which was calculated by the following formula:
where M is the moisture content of the sample; mdry is the dry weight of the sample, in g; and mmoist is the sample weight after the moisture equilibration test under a certain humidity, in g.
N2 Adsorption and Desorption
N2 adsorption and desorption were used to measure the pore structure characteristics of the samples and their variation with moisture in the Key Laboratory of Shale Gas Evaluation and Exploitation of Sichuan Province, with the test standard being the “BET gas adsorption method to determine the specific surface area of solid substances (GB/T 19587-2017)”. The experimental instrument was an automatic specific surface and pore size analyzer, which can test the pore size in a range of 0.35–0.50 nm and can determine a minimum specific surface area of 0.0005 m2/g. The test temperature was 77 K (i.e., -196°C) with a relative pressure range of 0.00–0.995.
The dry sample and the aquiferous samples were placed in liquid nitrogen at a constant temperature of 77 K, and the adsorption and desorption quantities of the samples were recorded as the relative pressure was increased or decreased to draw the adsorption-desorption curves. The pore types were then determined according to the morphology of the adsorption-desorption curves. The specific surface area and pore volume of the samples were calculated by the BET and BJH models, respectively. In the process of N2 adsorption and desorption at low temperature (77 K), the adsorbed water is crystallized, and moisture evaporation can be neglected.
Methane Adsorption
The instrument used to measure methane adsorption was a Rubotherm maglev weight analyzer operating according to the “High-pressure isothermal adsorption experiment method for coal (GB/T 19560-2008)” standard in the Key Laboratory of Shale Gas Evaluation and Exploitation of Sichuan Province. The maximum experimental pressure of the instrument was 35 MPa, with a maximum temperature of 150°C.
Before the experiment, the instrument was blanked with nitrogen (as recommended) to record the mass and volume of the sample chamber. The samples were then put in for vacuum pretreatment, they were filled with helium for a buoyancy test, the sample volume was calculated, and then the adsorption test was carried out. After vacuum treatment, methane was injected into the sample chamber, the maximum pressure of 30 MPa was set, and the sample weights under different balance pressures were recorded at a constant temperature. The variations in sample weight were used to reflect the methane adsorption capacity of the sample under the test pressure. With increasing test pressure, the variations in the adsorption capacity of the sample were recorded to draw the methane adsorption isotherm. The vacuum must be drawn in a short time (≤5 min) to remove gaseous impurities from the sample chamber without releasing moisture from the sample.
Results
Pore Characteristics in SEM
The pore developments in the samples were observed by Ar-ion polishing, field emission scanning electron microscopy (FE-SEM), and energy spectrum analysis. The results indicated that matrix pores were the main pore types, followed by fractures. Matrix pores include organic matter pores and inorganic pores. Inorganic pores can be further divided into interparticle or intercrystal pores, intraparticle pores, and interparticle or intercrystal dissolved pores (Loucks et al., 2012; Cao et al., 2015).
Using argon ion polishing, a field emission scanning electron microscope, and energy spectrum analysis technology, the characteristics of pores in the sample was observed. The results show that the pore types in the test samples were mainly matrix pores, followed by fractures. Matrix pores included organic and inorganic pores. The inorganic pores were further divided into intergranular pores, intragranular pores, and intergranular dissolved pores. Intergranular (intergranular) pores were further divided into clay mineral intergranular pores, pyrite intergranular pores, intergranular dissolved pores, and other classes. The shape of the pores was mostly narrow or irregular (Figures 1A–C). Intragranular pores are developed by solution pores between clay mineral and quartz grains (Figure 1D). These pores are mainly formed by dissolution by organic acids. The pore morphology is greatly affected by inorganic mineral particles, and some dissolution pores are connected. The number of such pores is small.

FIGURE 1. Different storage space types in organic-rich shale (A) interparticle dissolution pores between clay minerals; (B) intercrystal pore of pyrite; (C) linear micropores between bedded clay mineral; (D) interparticle pores between quartzes; (E) isolated organic pores; (F) pores and fractures between clay minerals and organic matter; (G) partially connected pores; (H) elliptical and flattened pores; (I) circular organic pore.
There were a large number of organic matter pores. Some organic matter pores were isolated and randomly distributed in lumpy, banded, and other organic matter (Figure 1E). Another part of the organic matter was filled between inorganic mineral particles/crystals such as siliceous minerals, clay minerals, or pyrite. A large number of pores and microfractures were developed in the interior and along the edge of this type of organic matter. The shapes of the reservoir spaces were diverse, including circular, oval, flat, narrow, and irregular (Figures 1F,G,H). Some pores had good connectivity (Figure 1I). The pore diameter of organic matter pores was widely distributed. Organic matter pores and intergranular/intragranular pores were observed by SEM in samples #1, #2, #3, and #4. There was a large number of these pores, which are round or oval in shape. Organic matter and intergranular pores between clay minerals were developed in samples #5 and #6, and most of the pores were of the slit type.
Moisture Adsorption Characteristics With Different Humidity
Six samples were selected for the moisture equilibration test; the results are shown in Figure 2. When the relative humidity was greater than 50%, moisture adsorption increased steeply with increasing relative humidity, indicating that monolayer adsorption, multilayer adsorption, and capillary condensation occur in samples with different moisture contents (Sang et al., 2020a; Sang et al., 2020b; Yang et al., 2020; Dang et al., 2021).
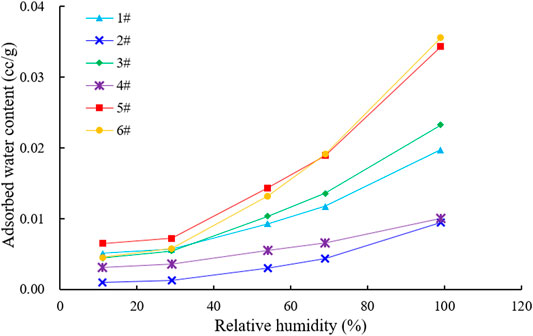
FIGURE 2. Equilibrium moisture adsorption curves of different shale samples.
Based on the multilayer adsorption theory, the BET model was proposed by Brunauer, Emmett, and Telle, which assumed that the adsorbent surface is composed of homogeneous local sites and that the adsorptions at adjacent sites do not affect each other. The BET model is widely used to determine the surface area of adsorption, usually using N2, Ar, or Kr gases. Water adsorption sites exist on the outer surfaces of pores and particles of clay minerals. Under low water content, moisture is adsorbed in the interlayer spaces of expandable clay as a monolayer of water molecules. The GAB model was proposed by Guggenheim, Anderson, and DeBoer (de Boer, 1953; Guggenheim, 1966; Arthur et al., 2018). The GAB isotherm is an extension of the BET isotherm. In the GAB model, when k = 1, the GAB model is equivalent to the BET model. Considering the different properties of monolayers and multilayers, the parameter k in the GAB model can be used to represent the different adsorption water binding capacities of multilayers, with low k reflecting lower adsorption water binding capacity. The GAB model was selected because of its greater versatility compared with the BET model:
where q is the moisture adsorption; qMg is the monolayer moisture adsorption, representing the number of surface-active adsorption sites on water molecules; C is the thermodynamic constant; K is the difference between adsorption heat and liquefaction heat; and P/P0 is the relative pressure, which is equivalent to the relative humidity during moisture adsorption.
The monolayer moisture adsorptions of the samples were calculated by the GAB model; the fitted results are shown in Table 3 and Figure 3. The moisture absorption of different samples increased at higher humidity. qmG reflects the monolayer moisture adsorption capacity of the samples, which was #3 > #4> #5> #1> #6> #2; samples #3 and #4 reached 0.0073 cm3/g and 0.00675 cm3/g, which was higher than that of the other samples over the whole humidity range. According to the statistics of the relationship between the moisture absorptions of the various samples, TOC, and clay minerals, the influence of TOC on moisture absorption is not obvious, whereas the clay minerals are positively correlated with moisture absorption. This may be the case because the surface of clay minerals usually shows strong hydrophilicity and possesses a surface electric charge. Water molecules are closely bound to clay mineral particles by hydrogen bonds, electrostatic forces, and intermolecular forces.
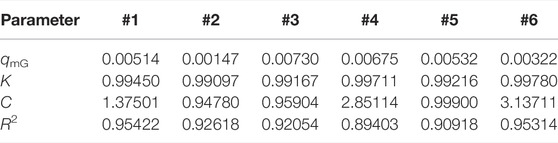
TABLE 3. Fitted results of the GAB model for the various samples.
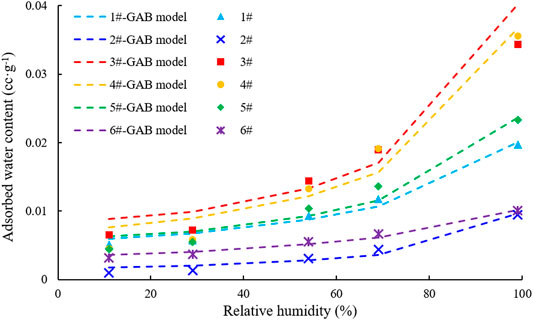
FIGURE 3. Fitted curve of the GAB model for samples with different equilibrium moisture.
Pore Structure Characteristics in N2 Adsorption/Desorption Experiments With Different Humidity
IUPAC (International Union of Pure and Applied Chemistry) divides pore types into four classes according to the characteristics of the adsorption loop formed in the N2 adsorption/desorption experiment (Sing et al., 1985). From the adsorption loop characteristics of six samples under dry conditions, the isothermal adsorption curves presented an inverse S-shape overall (Figure 4). The adsorption curves rose slowly in the early stage of the test, with a long plateau in the middle, and then rose sharply in the later stage. An obvious inflection point at lower relative pressure exists in different isothermal adsorption curve types, indicating the completion of monolayer nitrogen molecular adsorption and the formation of second and third layers of molecular adsorption with increasing relative pressure. An obvious hysteresis loop in the adsorption/desorption curve occurs when the relative pressure reaches a certain value. According to the hysteresis loop classification of IUPAC, the hysteresis loops of the six samples can be divided into two types. The hysteresis loops of samples #1, #2, #3, and #4 are close to type H2 and represent mostly lidded inkstand pores. Samples #5 and #6 have both characteristics of type H3 and type H2, reflecting wedge-shaped pores or slit-shaped pores with openings at one or both ends.

FIGURE 4. N2 adsorption/desorption isotherms of the various samples.
The distributions of pore diameters, specific surface areas, and specific pore volumes were calculated by the BET and BJH models. From the results (Table 4), the specific pore volumes of the six samples ranged from 0.0159 to 0.0324 cm3/g with an average of 0.0237 cm3/g, and the specific surface areas ranged from 18.4325 to 31.3568 m2/g with an average of 23.0948 m2/g. As for the specific surface areas and specific pore volumes of pores in different diameter ranges (micropores: < 2 nm, mesopores: 2–50 nm, macropores: >50 nm), the micropores contributed greatly to the specific surface area, with the micropores occupying 3.24% of the pore volume, but providing 13.06% of the specific surface area (Figure 5). Mesopores were the most prevalent pore size, accounting for the largest proportion of total pore volume, and the pore size distribution of different samples was basically consistent (Figure 6).

TABLE 4. Comparison of surface area and pore volume of samples.
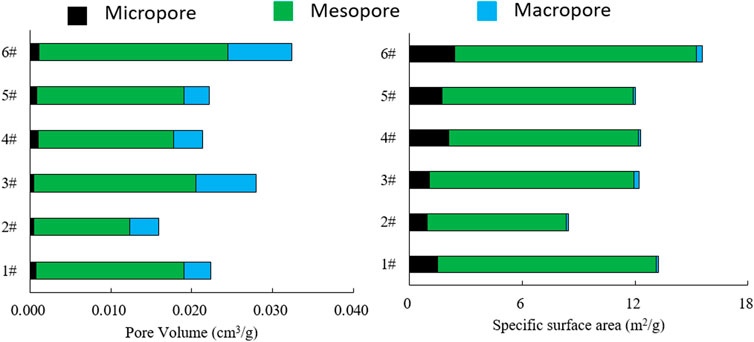
FIGURE 5. Distribution of pore volume and specific surface area of samples.

FIGURE 6. Pore size distribution characteristics of different samples.
By comparing the characteristics of the N2 adsorption/desorption curves of samples #2 and #6 at different humidity (Figure 7), it is apparent that the curves have large differences. With increasing humidity, the saturated adsorption capacity of N2 gradually decreased. For sample #6, the saturated adsorption of N2 decreased from 29.1247 cm3/g to 24.6419 cm3/g when the humidity rose from 0 to 11% and finally decreased to 19.0913 cm3/g with further increases in humidity. However, for sample #2, the variation in N2 saturated adsorption capacity was not significant with increasing humidity, but tended to decrease overall, and when the humidity increased to 99%, the adsorption capacity decreased to 15.5676 cm3/g. This phenomenon indicates that water occupies a certain pore space and that this occupied space increases at higher humidity, thus reducing N2 adsorption capacity on the pore surface. The complex pore structure of the samples makes the N2 adsorption capacity vary greatly under different humidity conditions. The mechanism may be that when water vapor adsorbs in the pores, the reaction between water molecules and the pore wall surface is dominated by the van der Waals force at relatively low pressure and humidity, and the water vapor preferentially adsorbs in small pores. At higher humidity, water molecules begin to condense in larger capillaries (Figure 8).
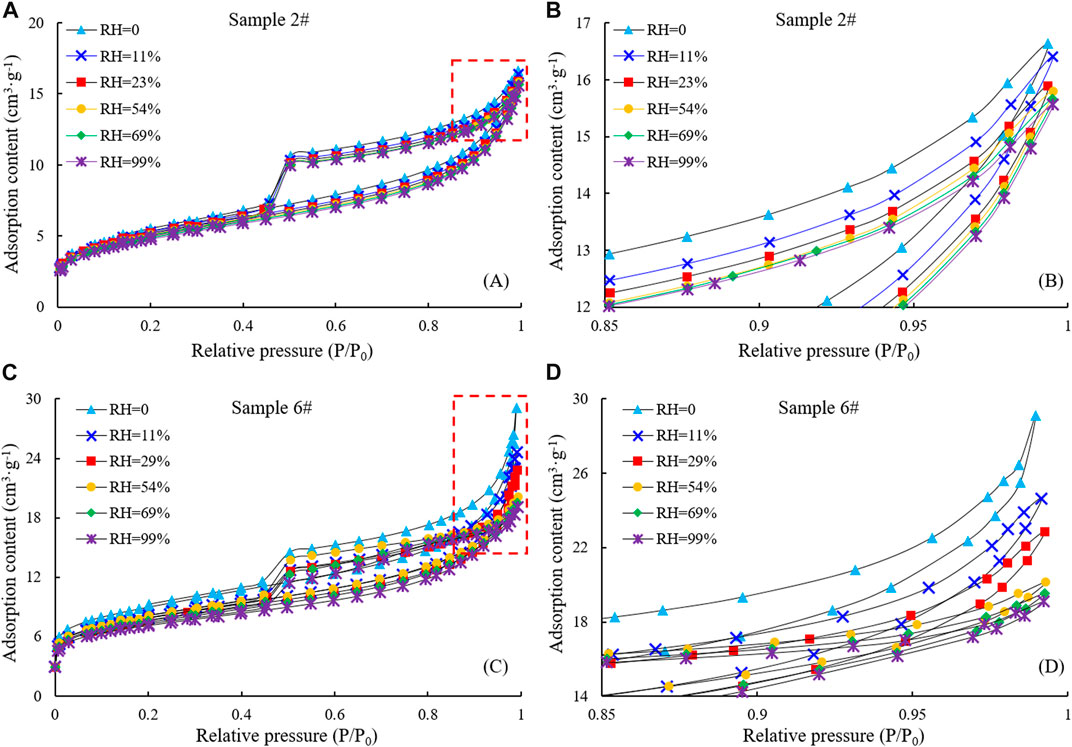
FIGURE 7. N2 adsorption/desorption curves of samples #2 and #6 with different humidity (A). N2 adsorption/desorption curves of samples #2, (B). the enlarged view of the part marked by the red dotted line in (A). (C) N2 adsorption/desorption curves of samples #6. (D) the enlarged view of the part marked by the red dotted line in (C).
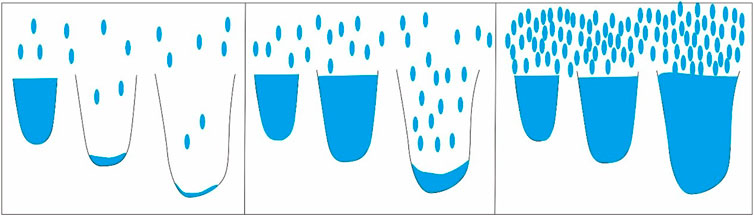
FIGURE 8. Moisture adsorption process in different pores (modified from Yang et al., 2020).
Discussion
Differences in Pore Structure Under Different Humidity
The pore structure characteristics of the samples were calculated by the BET and BJH models based on the N2 adsorption/desorption curves of samples with different humidity. In this study, shale was considered as a whole, without effectively distinguishing between the distributions of inorganic and organic pores in shales with different humidity. The results showed that under different humidity conditions, the moisture content and the distribution position were different, and the pore structure characteristics were also different, especially for pore sizes in the 2–10 nm range (Figure 9, Table 5). For samples #2 and #6, the proportion of 2–10 nm pores decreased at higher humidity. The reasons for this are that when the humidity is relatively low, monolayer adsorption occurs after water molecules enter the sample. Most of the water molecules preferentially adsorb on the pore surface with strong hydrophilicity and fill the relatively smaller pores. Mesopores and micropores play a major role in water adsorption because of their dominance in shale pores.
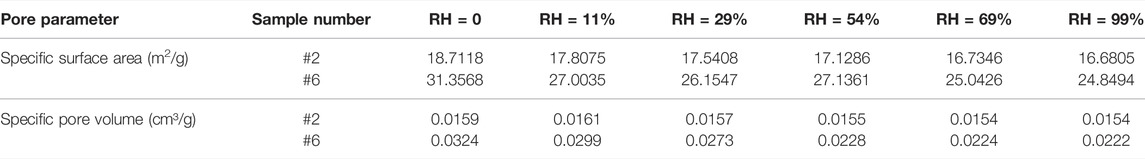
TABLE 5. Comparison of specific surface area and specific pore volume of samples #2 and #6 with different humidity.
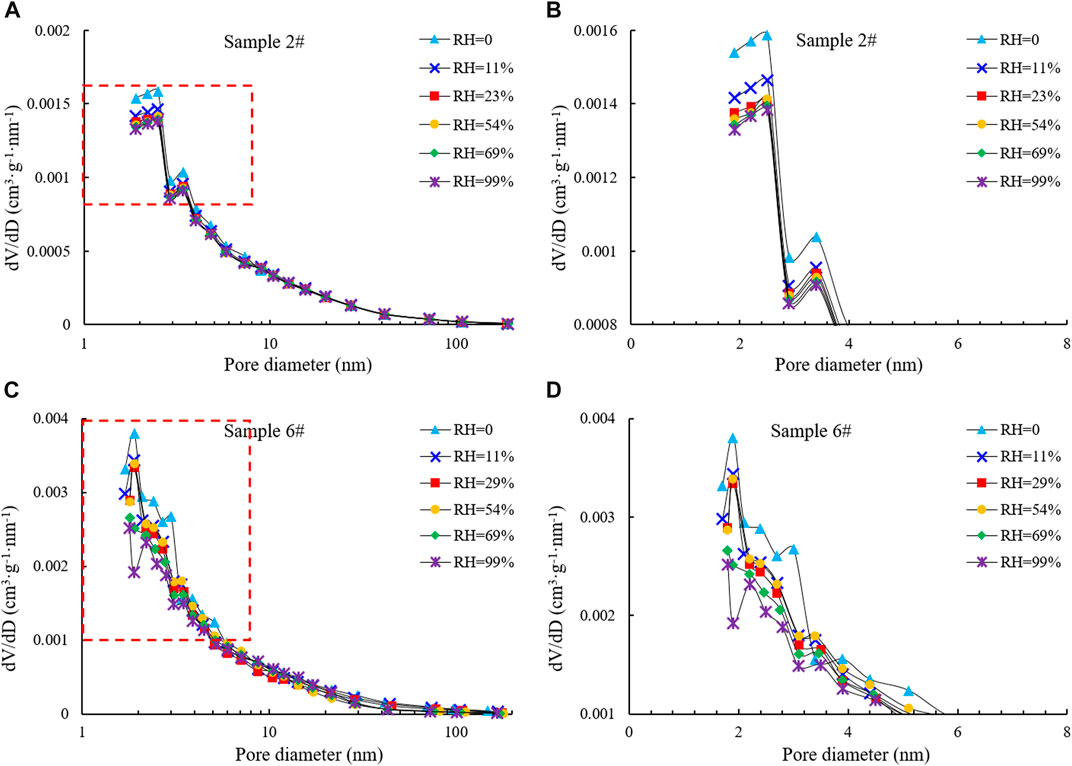
FIGURE 9. Pore size distribution characteristics of samples #2 and #6 with different humidity.
Moisture Effect on Methane Adsorption Capacity
The shale gas storage mechanism is mainly affected by fluid distribution and gas adsorption behavior in shale (Wang, 2017; Chen et al., 2021). The main fluids in a high-evolution shale reservoir are natural gas and water. The occurrence characteristics of natural gas are very important to evaluate gas adsorption. Shale gas mainly exists on the surface of organic matter or clay minerals in the form of adsorbed gas (Zhang et al., 2019).
Taking samples #2 and #6 as the research object, the moisture content and Langmuir adsorption constant at different humidity are shown in Table 6. From the methane isothermal adsorption curve under different moisture contents of samples #2 and #6 (Figure 10), the methane adsorption capacity of the sample decreased gradually after an early rise with increasing pressure. The reason for this is that after reaching maximum absolute adsorption, the adsorbed shale gas volume does not change, but the pressure increases gradually, along with the density of the adsorbed gas, resulting in a continual increase in buoyancy. As a result, the measured excess adsorption capacity decreases (Wang et al., 2015; Yu et al., 2015; Tian et al., 2018). The adsorption capacity of methane at the same pressure decreased at higher moisture content, indicating the competitive adsorption characteristics of water molecules and methane molecules. The fitted results of the three-parameter Langmuir model (Figure 10) showed that with increasing sample moisture content, the methane adsorption capacity decreased gradually.
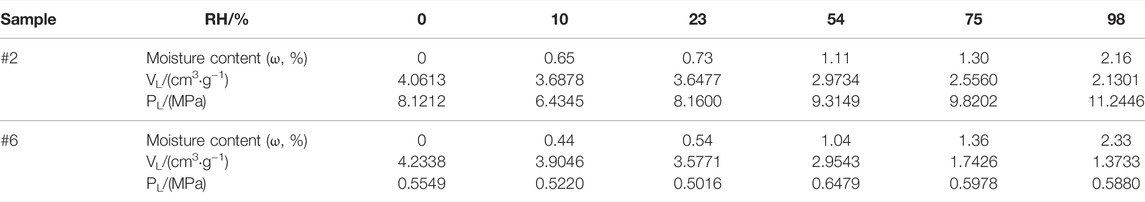
TABLE 6. Moisture content and Langmuir adsorption constant of samples #2 and #6 with different humidity.
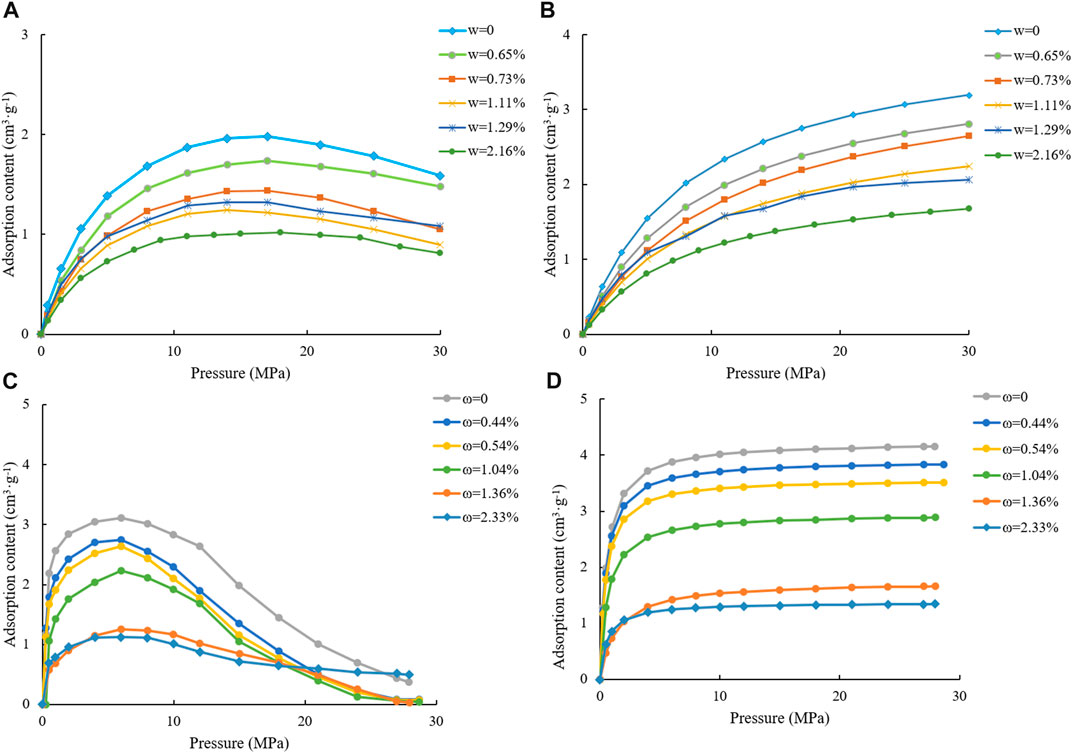
FIGURE 10. Test results of excess adsorption and Langmuir three-parameter fitted results of samples #2 and #6 at different moisture contents. [(A) Measured adsorption capacity under different water contents of sample #2; (B). Adsorption capacity under different water contents using the ternary Langmuir equation of sample #2; (C) Measured adsorption capacity under different water contents of sample #6; (D) Adsorption capacity under different water contents using the ternary Langmuir equation for sample #6.].
For sample #2, when the sample moisture content increased from 0% to 2.13%, the maximum methane adsorption capacity decreased from 4.0613 cm3/g to 2.1301 cm3/g, with a gradual increasing trend in Langmuir pressure. For sample #6, when the sample moisture content increased from 0% to 2.33%, the maximum methane adsorption capacity decreased from 4.2338 cm3/g to 1.3733 cm3/g with a gradual increasing trend in Langmuir pressure. Langmuir pressure represents the adsorption capacity of a solid surface to methane molecules, indicating that the increase in humidity weakened the adsorption of methane molecules to the pore surface.
When the variation in the maximum adsorption capacity (VL) of sample #6 with moisture content was investigated (Figure 11), the results showed that methane adsorption capacity was negatively correlated with moisture content. The relationship between moisture content and methane adsorption capacity of samples #2 and #6 were established (sample #2: VL = -0.992ω + 4.1478, R2 = 0.913; sample #6: VL = -1.3602ω + 4.2596, R2 = 0.912). The reason for this is that water is a polar molecule, and water molecules under different humidity preferentially adsorb on the pore surfaces of shale, occupying some of the adsorption sites and reducing adsorption space for methane molecules. In addition, when water enters shale pores, the original solid-gas adsorption is converted into solid-gas adsorption and liquid-gas adsorption. From the perspective of adsorption potential, the original adsorption field formed by solid shale changes into a solid adsorption field and a liquid adsorption field. The variation in adsorption field intensity and the decrease in number of adsorption sites and in adsorption potential further reduce the methane adsorption capacity of shale.
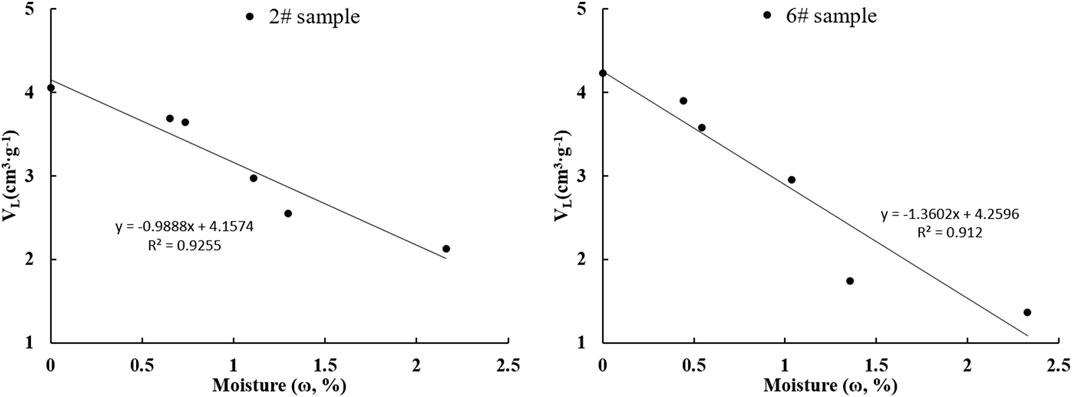
FIGURE 11. Maximum adsorption capacity and moisture content of samples #2 and #6 (A. sample #2, B. sample #6).
The methane adsorption capacity of shale samples is related to the pore structure distribution of the samples. The rate of decrease M of adsorption capacity under the condition of water balance was calculated for samples 2# and #6:
Under the water balance condition, #6the adsorption capacity of sample #6 decreased more than that of sample #2. The rate of decrease M of the adsorption capacity of sample #2 was 47.53%, and that of sample #6 was 67.56%. According to an analysis of the reasons, the #2 samples have high organic carbon content and low clay content. Organic pores and intergranular (inner) dissolution pores are developed in the samples, which were determined by SEM, and the pore shape is oval or irregular. The #6 samples have high clay content, developed microcracks, most of the pores are slit-shaped, and some of them are irregular pores. Under different water contents, the distribution characteristics of clay minerals are the main controlling factor of the hydrophilicity of shale. The higher the content of clay minerals, the greater will be the differences in the adsorption capacity of samples under different water contents, and the greater the influence of water on the adsorption capacity of samples.
Conclusion
1) Moisture equilibration tests were carried out for samples with different humidity. N2 adsorption and desorption experiments showed that the moisture content and distribution of the samples were different and resembled the pore structure characteristics. At higher humidity, the pore size distribution in the range of 2–10 nm decreased. Analysis showed that when the humidity was relatively low, water entered the sample by monolayer adsorption, and most of the water molecules preferentially adsorbed on pore surfaces with strong hydrophilicity and filled the relatively small pores.
2) Multilayer adsorption and capillary condensation occurred under different moisture conditions, which is consistent with the GAB model. Comparing the moisture adsorption versus humidity curves, when the humidity was relatively low, the van der Waals force was the main force between the water molecules and the pore wall surface. The water vapor was adsorbed in the small pores first, mainly in a monolayer, but with increasing humidity, water molecules gradually condensed in larger capillaries. Mesopores and micropores played a major role in water adsorption.
3) The methane adsorption characteristics of shale samples with different moisture contents conformed to the three-parameter Langmuir model. The methane adsorption capacities of samples with moisture were obviously less than those of dry samples. For the same sample, with increasing moisture content, water molecules occupied a certain number of the methane adsorption sites, and the maximum methane adsorption capacity decreased gradually. The higher the clay mineral content of the sample, the greater was the change in adsorption capacity under different water conditions, and the greater was the influence of water on the adsorption capacity of the sample.
Data Availability Statement
The original contributions presented in the study are included in the article/Supplementary Material, further inquiries can be directed to the corresponding author.
Author Contributions
YL: Conceptualization, Methodology, Investigation,Writing—Original draft QC: Supervision, Writing—Reviewing and Editing XY: Processing of experimental data, Writing—Reviewing, and Validation LD: Methodology, Investigation (experiment).
Funding
This research was supported by the State Key Laboratory of Shale Oil and Gas Enrichment Mechanisms and Effective Development (No: GSYKY-B09-33) and the Central Government Guide Local Science and Technology Development Special Project of 2020 (No: 2020ZYD027) to the first author YL and the second author QC.
Conflict of Interest
Author LD was employed by Petroleum Exploration and Production Research Institute, SINOPEC.
The remaining authors declare that the research was conducted in the absence of any commercial or financial relationships that could be construed as a potential conflict of interest.
Publisher’s Note
All claims expressed in this article are solely those of the authors and do not necessarily represent those of their affiliated organizations, or those of the publisher, the editors and the reviewers. Any product that may be evaluated in this article, or claim that may be made by its manufacturer, is not guaranteed or endorsed by the publisher.
References
Arthur, E., Tuller, M., Moldrup, P., Greve, M. H., Knadel, M., and de Jonge, L. W. (2018). Applicability of the Guggenheim-Anderson-Boer Water Vapour Sorption Model for Estimation of Soil Specific Surface Area. Eur. J. Soil Sci. 69 (2), 245–255. doi:10.1111/ejss.12524
Behar, F., Vandenbroucke, M., Teermann, S. C., Hatcher, P. G., Leblond, C., Lerat, O., et al. (1995). Experimental Simulation of Gas Generation from Coals and a Marine Kerogen. Chem. Geol. 126 (3-4), 247–260. doi:10.1016/0009-2541(95)00121-2
Cao, Q., Zhou, W., Chen, W., Deng, H., Yan, C., and Deng, K. (2015). Analysis of Pore Types, Sizes and Genesis in Continental Shale Gas Reservoir of Chang 7 of Yanchang Formation, Ordos Basin. J. Mineral. Petrol. 35 (02), 90–97. doi:10.19719/j.cnki.1001-6872.2015.02.011
Chen, L., Jiang, Z., Jiang, S., Guo, S., and Tan, J. (2021). Effect of Pre-adsorbed Water on Methane Adsorption Capacity in Shale-Gas Systems. Front. Earth Sci. 9, 1–9. doi:10.3389/feart.2021.757705
Dang, W., Zhang, J., Wang, F., Li, P., Dan, Z., and Wang, R. (2021). Thermodynamics and Kinetics of Water Vapor Adsorption onto Shale: A Case Study of the Permian Shanxi Formation, Ordos Basin. Oil Gas Geol. 42 (01), 173–185. doi:10.11743/ogg20210115
Dong, D., Gao, D., Huang, J., Guan, Q., Wang, S., and Wang, Y. (2014). A Discussion on the Shale Gas Exploration & Development Prospect in the Sichuan Basin. Nat. Gas. Ind. 34 (12), 1–15. doi:10.3787/j.issn.1000-0976.2014.12.001
Fan, B., Wang, X., and Wu, X. (2017). Desorption Analysis of Shale and its Geochemical Characteristics: A Case Study of the Chang 7 Member Shale in the Central South Ordos Basin. J. China Univ. Min. Technol. 46 (03), 554–562. doi:10.13247/j.cnki.jcumt.000617
Gasparik, M., Ghanizadeh, A., Bertier, P., Gensterblum, Y., Bouw, S., and Krooss, B. M. (2012). High-pressure Methane Sorption Isotherms of Black Shales from The Netherlands. Energy fuels. 26 (8), 4995–5004. doi:10.1021/ef300405g
Helgeson, H. C., Richard, L., Mckenzie, W. F., Norton, D. L., and Schmitt, A. (2009). A Chemical and Thermodynamic Model of Oil Generation in Hydrocarbon Source Rocks. Geochim. Cosmochim. Acta 73 (3), 594–695. doi:10.1016/j.gca.2008.03.004
Jiao, B., Ding, W., Gu, Y., Xiao, Z., Shi, S., Zhao, G., et al. (2019). The Reservoir Characteristics of Marine Shale and its Effect on the Adsorption of Methane in Northern Guizhou. Petroleum Sci. Technol. 37 (5), 2199–2206. doi:10.1080/10916466.2019.1629959
Leif, R. N., and Simoneit, B. R. T. (2000). The Role of Alkenes Produced during Hydrous Pyrolysis of a Shale. Org. Geochem. 31 (11), 1189–1208. doi:10.1016/S0146-6380(00)00113-3
Li, J. (2017). Study on Occurrence Mode and Gas Production Mechanism of Shale Gas. Beijing: China University of Petroleum. PhD diss.
Loucks, R. G., Reed, R. M., Ruppel, S. C., and Hammes, U. (2012). Spectrum of Pore Types and Networks in Mudrocks and a Descriptive Classification for Matrix-Related Mudrock Pores. Bulletin 96 (6), 1071–1098. doi:10.1306/08171111061
Ross, D. J. K., and Bustin, R. M. (2008). Characterizing the Shale Gas Resource Potential of Devonian-Mississippian Strata in the Western Canada Sedimentary Basin: Application of an Integrated Formation Evaluation. Bulletin 92, 87–125. doi:10.1306/09040707048
Sang, G., Liu, S., Elsworth, D., Yang, Y., and Fan, L. (2020a). Evaluation and Modeling of Water Vapor Sorption and Transport in Nanoporous Shale. Int. J. Coal Geol. 228, 103553. doi:10.1016/j.coal.2020.103553
Sang, G., Liu, S., Elsworth, D., Zhang, R., and Bleuel, M. (2020b). Pore-scale Water Vapor Condensation Behaviors in Shales: An Experimental Study. Transp. Porous Med. 135 (3), 713–734. doi:10.1007/s11242-020-01497-8
Sing, K. S. W., Everett, D. H., Haul, R. A. W., Moscou, L., Pierotti, R. A., Rouquerol, J., et al. (1985). Reporting Physisorption Data for Gas/solid Systems with Special Reference to the Determination of Surface Area and Porosity (Recommendations 1984). Pure Appl. Chem. 57 (4), 603–619. doi:10.1351/pac198557040603
Sun, Y., Ding, W., Lu, L., Li, M., Chen, P., and Ji, X. (2018). Analysis of Influence Factors of Methane Adsorption Capacity of the Lower Silurian Shale. Pet. Sci. Technol. 36 (24), 2112–2118. doi:10.1080/10916466.2018.1533862
Sun, J., Xiao, X., Wei, Q., Cheng, P., and Tian, H. (2021). Occurrence of Irreducible Water and its Influences on Gas-Bearing Property of Gas Shales from Shallow Longmaxi Formation in the Xishui Area, Guizhou, Southern China. Front. Earth Sci. 9, 1–9. doi:10.3389/feart.2021.654136
Tian, W., Deng, Z., Wang, H., Liu, H., Li, G., Liu, X., et al. (2018). Negative Adsorption in the Isotherm Adsorption Experiments of Low-Adsorption Coal and Shale. Nat. Gas. Ind. 38 (06), 19–26. doi:10.3787/j.issn.1000-0976.2018.06.003
Wang, X., Liu, W., Xu, Y., Zheng, J., and Zhang, D. (2006). Thermal Simulation Experimental Study on the Role of Water in the Formation of Organic Matter and the Evolution of Gaseous Hydrocarbons. Prog. Nat. Sci. 16 (10), 1275–1281. doi:10.3321/j.issn:1002-008X.2006.10.011
Wang, Y., Zou, L., Hu, Z., Shen, R., Xiong, W., Gao, S., et al. (2015). Experiment of Supercritical Methane Adsorption on Shale and Adsorption Modelling. J. Central South Univ. Sci. Technol. 46(11): 4129–4135. doi:10.11817/j.issn.1672-7207.2015.11.022
Wang, J., Tan, X., Tian, J., Luo, L., Gao, X., Luo, C., et al. (2021). The Effect of Diagenetic Evolution on Shale Gas Exploration and Development of the Longmaxi Formation Shale, Sichuan Basin, China. Front. Earth Sci. 9, 1–17. doi:10.3389/feart.2021.661581
Wang, Z. (2017). RETRACTED ARTICLE: Characterization of the Microscopic Pore Structure of the Lower Paleozoic Shale Gas Reservoir in the Southern Sichuan Basin and its Influence on Gas Content. Pet. Sci. Technol. 35 (23), 2165–2171. doi:10.1080/10916466.2017.1390682
Yang, R., Jia, A., He, S., Hu, Q., Dong, T., Hou, Y., et al. (2020). Water Adsorption Characteristics of Organic-Rich Wufeng and Longmaxi Shales, Sichuan Basin (China). J. Pet. Sci. Eng. 193, 107387. doi:10.1016/j.petrol.2020.107387
Yu, L., Fan, M., Chen, H., Liu, W., Zhang, W., and Xu, E. (2015). Isothermal Adsorption Experiment of Organic-Rich Shale under High Temperature and Pressure Using Gravimetric Method. Acta Pet. Sin. 36 (05), 557–563. doi:10.7623/syxb201505004
Zhang, X., Lu, X., Zhang, L., and Liu, Q. (2010). Occurrences of Shale Gas and Their Petroleum Geological Significance. Adv. Earth Sci. 25 (6), 597–604. doi:10.11867/j.issn.1001-8166.2010.06.0597
Zhang, J., Tang, Y., and Chen, D. (2019). Prediction of Methane Adsorption Content in Continental Coal-Bearing Shale Reservoir Using SLD Model. Petroleum Sci. Technol. 37 (15), 1839–1845. doi:10.1080/10916466.2019.1610773
Zhang, L., He, X., Li, X., Li, K., He, J., Zhang, Z., et al. (2021). Shale Gas Exploration and Development in the Sichuan Basin: Progress, Challenge and Countermeasures. Nat. Gas. Ind. 41 (08), 143–152. doi:10.3787/j.issn.1000-0976.2021.08.013
Keywords: moisture content, pore structure, GAB model, methane adsorption capacity, three-parameter Langmuir adsorption model
Citation: Liu Y, Cao Q, Ye X and Dong L (2022) Adsorption Characteristics and Pore Structure of Organic-Rich Shale With Different Moisture Contents. Front. Earth Sci. 10:863691. doi: 10.3389/feart.2022.863691
Received: 31 January 2022; Accepted: 21 April 2022;
Published: 12 May 2022.
Edited by:
Jing Ba, Hohai University, ChinaReviewed by:
Min Wang, China University of Petroleum, ChinaHemin Yuan, China University of Geosciences, China
Copyright © 2022 Liu, Cao, Ye and Dong. This is an open-access article distributed under the terms of the Creative Commons Attribution License (CC BY). The use, distribution or reproduction in other forums is permitted, provided the original author(s) and the copyright owner(s) are credited and that the original publication in this journal is cited, in accordance with accepted academic practice. No use, distribution or reproduction is permitted which does not comply with these terms.
*Correspondence: Qian Cao, cissiy0923@163.com