Experimental Investigation of Shale Rock Properties Altering In-Situ Gas Density and Storage
 Xuanqing Lou
 Nirjhor Chakraborty2
 - 1John and Willie Leone Family Department of Energy and Mineral Engineering, The Pennsylvania State University, University Park, PA, United States
- 2BP, Houston, TX, United States
Shale gas reservoir has become a crucial resource for the past decade to sustain growing energy needs while reducing the carbon intensity of energy systems relative to other fossil fuels. However, these reservoirs are geologically complex in their chemical composition and dominance of nano-scale pores, resulting in limited predictability of their effective storage capacity. To predict gas storage and estimate volumetric gas-in-place, in-situ gas properties need to be defined. However, only a few direct experimental measurements on in-situ gas properties are available in the literature, and the interactions between gas and the surrounding surface area of the medium remain poorly understood. In this study, gas invasion experiments were conducted in conjunction with 3D X-ray micro-CT imaging on three different shales, i.e., Bakken, Haynesville and Marcellus. Results show evidence of increased storage capacity in all cases, with different degrees of gas densification across the three shale specimens. The average of measured in-situ xenon density within the Bakken, Haynesville and Marcellus shale samples were found to be 171.53 kg/m3, 326.05 kg/m3 and 947 kg/m3, respectively. These measured densities are higher than their corresponding theoretical free gas density, though lower than the xenon density at boiling point, indicating that current practices of estimating adsorbed gas and gas in place, using boiling point liquid density, may be overestimated. The xenon densification factor in the Marcellus sample was found to be 7.4, indicating the most significant degree of localized densification. This densification factor drops to 2.6, and to 1.4, in the Haynesville and the Bakken sample, respectively. Characterization of shale composition and pore structure are presented, in order to assess the shale properties controlling in-situ gas density and storage capacity. Results indicate that the observed degree of gas densification in shales can be attributed to surface area and pore size. The findings in this work provide valuable reference for simulation to much more accurately predict gas storage in shales. More importantly, the contribution of this work lay a foundation to evaluate excess storage capacity of various gases in ranging tight formations.
Introduction
Gas production from a shale reservoir depends on gas in place (GIP), its storage capacity and transport behavior. However, the mechanisms of gas storage and transport in shale systems are still poorly understood. Unlike conventional reservoirs in which gas is stored primarily as “free” gas in pores, a considerable proportion of gas in shales is stored in the form of “sorbed” gas. Adsorption results in a high-density phase and thus increases the storage capacity of shale as compared to a conventional rock with equivalent pore volume (Gasparik et al., 2014). In addition to adsorption, other mechanisms are believed to contribute to the storage of gas in shales. Barsotti et al. (2018) claim that stronger adhesive forces in smaller pores (e.g., mesopores) would lead to more fluid molecules to attract each other and form multiple molecular layers of the adsorbed phase. As pressure increases, this multilayer adsorbed film becomes unstable and starts to collapse until a new condensed phase nucleates and propagates in nanopores (Agrawal et al., 2017; Barsotti et al., 2016; Coasne et al., 2009; Thommes, 2010). This process is known as capillary condensation or pore condensation, which represents a phenomenon whereby gas condenses to a liquid-like phase in nanopores due to fluid–wall interactions (Thommes, 2010). Some studies consider capillary condensation as a special case of adsorption (Chakraborty et al., 2020; Thommes and Cychosz, 2014). Moreover, Luo et al. (2016) investigated storage behaviors in mesoporous controlled pore diameter glasses (CPG), and found that confined fluid properties are altered toward the properties of supercritical fluids at subcritical conditions. They refer to this phenomenon as induced-supercriticality. While these mechanisms have been widely studied, there is a dearth of studies that provide sufficient evidence of what mechanism(s) is/are responsible for altering gas storage in shales. It is a difficult task to experimentally differentiate these mechanisms controlling gas storage capacity in shales. However, it is worthwhile to further examine this scientific question in search for more accurate gas storage prediction. For this reason, this study aims to shed light on how in-situ gas property changes within different shales, and what shale properties control it.
The use of advanced high-resolution scanning (e.g., scanning electron microscopy (SEM)) have revealed that the complexity of nano-scale pore systems is tightly related to their mineralogical constituents (Chalmers et al., 2012). It is now widely accepted that gas storage in shale is dominated by the organic porosity (Curtis et al., 2012; Eberle et al., 2016; Jarvie, 2012; King et al., 2015). This conclusion is inferred from the positive linear correlation of gas sorption capacity in shales with Total Organic Carbon (TOC) (Eberle et al., 2016; Ross and Bustin, 2009). On the other hand, many studies focus on the effect of pore structural properties on gas storage in shales (Chalmers and Bustin, 2008; Gasparik et al., 2014; Kang et al., 2011). Shale matrix exhibits a wide distribution of micropores (less than 2 nm) and mesopores (2–50 nm) in organic matter and clay minerals (Kuila and Prasad, 2013). The structure of these nanopores have attracted more attention because they tend to be stronger indicators of excess storage capacity (Kuila and Prasad, 2013; Liu et al., 2018; Zhang, 2018). For example, clay minerals may provide considerable storage capacity in shales due to their high internal surface area (or micropore volume) (Wang et al., 2016). In addition to surface area, confinement in nanopores has significantly impacts on the thermodynamic properties, phase equilibrium, and phase behavior of the fluid (Nojabaei et al., 2013; Singh et al., 2009; Ting et al., 2015; Travalloni et al., 2014; Zarragoicoechea and Kuz, 2004), therefore affecting gas storage capacity. These studies imply that excess gas storage in shales is mainly controlled by pore structural properties (Ambrose et al., 2012; Didar and Akkutlu, 2013; Pitakbunkate et al., 2016; Perez and Devegowda, 2017). However, it is still not clear if gas storage capacity is caused by chemical effects of mineralogical constituents or the presence of nanopores. The relationship between gas storage and compositional constituents and pore structure were not well identified in previous studies.
There is no doubt that gas storage in shales is a complex multi-parameter process, and reliable experimental data are needed in order to quantify it and correlate it with individual parameters (Gasparik et al., 2014). Unfortunately, the majority of experimental studies to characterize storage capacity used either indirect measurements on shales or nanoporous surrogates (Barsotti et al., 2018; Gasparik et al., 2012; Luo et al., 2016, 2019; Morishige and Nakamura, 2004). Only a few experimental studies available in the literature directly measured gas densities in natural shales. For example, small-angle neutron scattering (SANS) is a reliable technique to measure gas densities in shales (Eberle et al., 2016; Stefanopoulos et al., 2017; Zhang, 2018). However, the main drawback of small angle scattering techniques is that they are essentially indirect methods and mathematical models have to be applied to describe the experimental scattering curves. X-ray micro-CT is one of the only ways of visualizing and quantifying in-situ gas storage within a rock. The use of X-ray micro-CT and samples saturated with radio-opaque agents to determine the spatial distribution of gas storage in shale is not novel today. This technique was first used by Watson and Mudra (1994) to quantitatively determine xenon storage distribution in Devonian shales. They reported that high gas storage regions are associated with clay and pyrite. However, it is difficult to conclusively prove this correlation because the typical resolution of a micro-CT scanner (i.e., 20 µm-2 mm) is far larger than the size of mineral grains and discernible compositional features. More recently, to remedy this resolution limitation of micro-CT scanners, some studies attempted to combine micro-CT with other material characterization techniques, thereby facilitating the connection established between storage capacity and shale properties (Aljamaan et al., 2017; Vega et al., 2015). However, previous studies using micro-CT to quantify gas storage capacity ignore the fact that X-ray CT images are a function of material density and composition. To fill this gap, Chakraborty et al. (2022) proposed a practical approach to directly measure in-situ fluid density in shales while decoupling the overlapping effects of density and composition.
In this study, our aim is to determine which shale properties tend to be responsible for gas densification and storage capacity. We employed the approach from Chakraborty et al. (2022) to characterize gas density in shales as an expression of gas in place, or measure of storage capacity. We performed micro-CT to directly measure in-situ gas density in Bakken, Haynesville and Marcellus shale samples. We demonstrated different degrees of gas densification across Bakken, Haynesville and Marcellus shales. To our knowledge, no prior study has provided such explicit comparison of in-situ gas densities across different shales, which allows one to readily compare gas storage capacity in relation to varying shale properties. To explore which shale properties control gas densification, shale compositional and structural properties that are independently measured are presented. It is worthy to note that most phase-behavior studies on the effect of shale properties are simulations of multi-component gases. Our data is quite revealing in how it is suggesting that phase behavior of single-component systems might be affected by pore-confinement.
Materials and Methods
Three cylindrical core plugs from Bakken, Haynesville and Marcellus formations were used in this study. Table 1 lists the physical properties of the Bakken, Haynesville and Marcellus samples. Sample porosities were measured using helium porosimetry, while permeability ranges were provided by the sponsors of the different cores. Xenon gas (purity>99.5%) as a high-contrast agent was chosen to enhance image contrast.
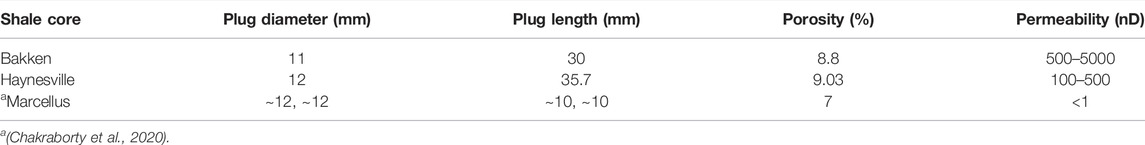
TABLE 1. Physical properties of shale core plugs used in this study.
Currently, the vast majority of studies have reported that organic content or total organic carbon (TOC) is responsible for high adsorption capacity in shales (Chalmers and Bustin, 2008; Kang et al., 2011; Merkel et al., 2016; Stra̧poć et al., 2010). Besides TOC, adsorption capacity of clay is also found to be very high (Busch et al., 2008; Heller and Zoback, 2014). Therefore, mineralogy and organic content are believed to be indicators of storage capacity. On the other hand, some authors attribute the variation of storage capacity to organic porosity, surface area and pore size (Kang et al., 2011; Rexer et al., 2014; Wang et al., 2016). In order to explore which shale properties control gas densification, compositional and pore structural properties for Bakken, Haynesville and Marcellus shales are carefully characterized.
Compositional analysis includes organic content measurement and mineralogy assessment. X-ray Diffraction (XRD) was employed to identify mineralogical composition, and TOC was measured on a Shimadzu TOC analyzer. Sample porosities were measured using helium porosimetry. Nitrogen low-pressure surface adsorption (LPSA) measurements were carried out in order to measure surface area and pore size distribution. The Brunauer–Emmett–Teller (BET) model is used to estimate surface area from adsorption data. The Barrett–Joyner–Halenda (BJH) is a popular method to obtain pore size distribution and average pore width (Aljamaan et al., 2017; Alnoaimi et al., 2016; Kuila and Prasad, 2013). This method assumes cylindrical pore geometry with a pore diameter larger than 5 nm. While for a diameter less than 10 nm, the pore size will be underestimated. Although this method is imperfect, the main purpose of this study is to assess the comparison of the pore size for Bakken, Haynesville and Marcellus shales, thereby correlating them with different degrees of gas densification.
The experimental method used in this study is a gas injection experiment in conjunction with micro-CT imaging. The experimental setup is depicted in Figure 1. The pressure vessel had one port of entry which was connected to a pressure transducer and a ball valve. The tested cylindrical core plug was placed vertically in a custom-made aluminum pressure vessel, so as to provide sufficient mechanical strength and minimize beam-hardening artifacts (Akin and Kovscek, 2014). The pressure vessel contained two hollow rubber ring-shaped spacers, separated by the tested core plug. The intent behind these spacers was to create a substantial volume within the CT scanner’s field of view (FOV), thereby observing probe gas in free space and capturing its CT numbers for analysis.
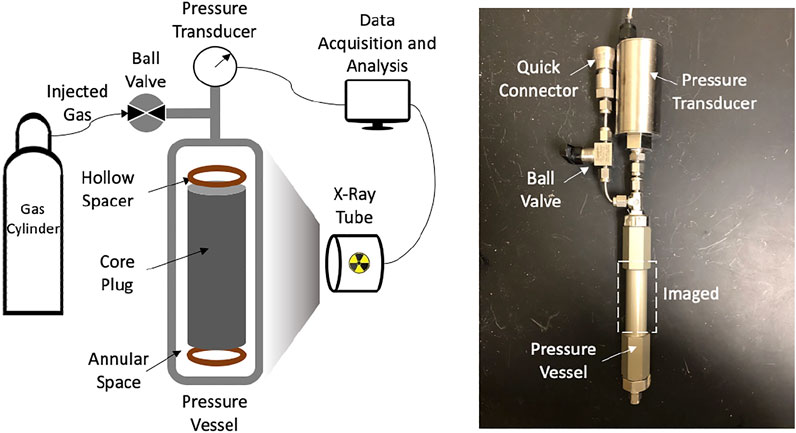
FIGURE 1. Schematic of the experimental setup for gas invasion experiment in conjunction with micro-CT imaging (left) and the actual experimental setup (right). The dashed box indicates the approximate position that is imaged.
The gas injection experiments were performed on the Bakken, Haynesville and Marcellus shale plugs at room temperature (approximately
Direct Measure of In-Situ Xenon Density in Shales Using X-Ray Micro-CT Imaging
The advantage of X-ray CT is the ability to provide three-dimensional (3D) images in a non-destructive way. It can offer fine spatial resolution for a material’s interior, and is adaptable to many types of experimental procedures. The CT images are 3D maps of the X-ray attenuation values (or CT numbers), which are inherently a function of material density and atomic number. Since shale pore sizes are far below the typical resolution of a micro-CT scanner (between 20 μm and 2 mm), it is not possible to segment pore structure and/or minerals composition. Instead, subtraction image technique is used to quantify in-situ fluid density within shales. Following the work published from Chakraborty et al. (2022), in-situ fluid density can be computed from X-ray CT images as follows,
where,
where,
Figure 2 shows vertical cross-sectional CT images of the Bakken, Haynesville and Marcellus shale samples at dry and equilibrium conditions. The subvolumes of the three shale samples are digitally extracted (i.e., orange cuboid) for analysis. In dry images, the dark regions of the sample indicate materials with low density (e.g., organic content) or low porosity regions (e.g., micro fractures), while the bright regions indicate high-density materials (e.g., minerals). The relative brightness of the equilibrium image indicates the presence of xenon in the sample. After image registration is done, the subtraction between equilibrium and dry images is carried out in order to highlight the porosity and cancel the unchanged non-porous solids. The brightness of a subtraction image (not shown) is a function of the xenon density/concentration occupying the pore space of the sample at any given voxel location. Subtraction images are then used to calculate xenon density.
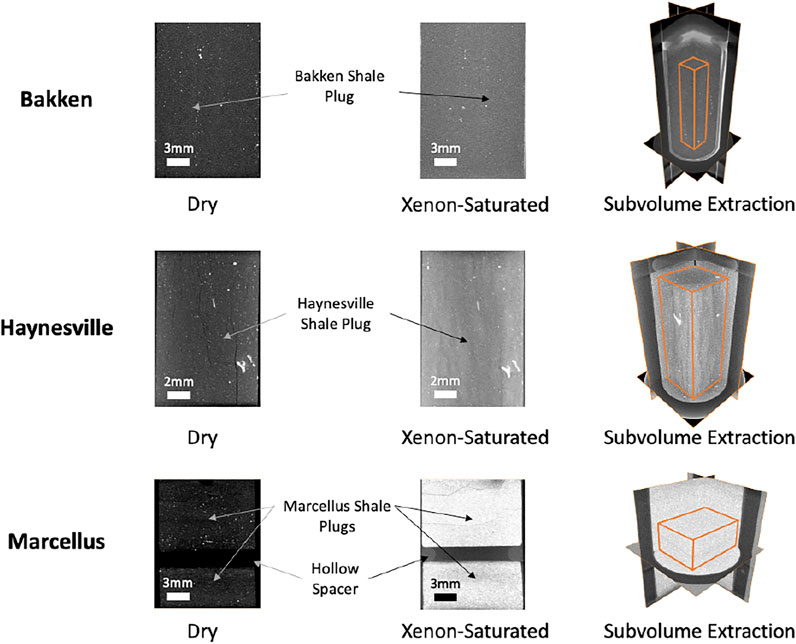
FIGURE 2. CT images of the Bakken (Top), Haynesville (Middle) and Marcellus (Bottom) shale samples. Left to right: Two-dimensional longitudinal cross-sections of the shale sample at dry conditions (before xenon injection); same cross-section at equilibrium conditions; and the indication of digitally extracted sub-volumes for further analysis.
After obtained the CT image dataset, porosity map can be calculated based on Eq. 2. Figure 3 reports the porosity distributions for the analyzed Bakken, Haynesville and Marcellus samples. The dashed vertical line indicates average porosity. It can be seen that the average porosity for the Bakken, Haynesville and Marcellus samples are 8.5, 9.03 and 7% respectively, indicating that the difference of porosity between these samples is quite small. The matrix of these three samples are relatively homogeneous, as evidenced by CT images. Eq. 2 provides a practical approach to approximate independent 3D porosity maps, thereby isolating the signal from CT attenuations that can be attributed to fluid density. Because of this, these porosity distributions should be viewed statistically, and the mean and mode of these distributions are way more important than any single point.
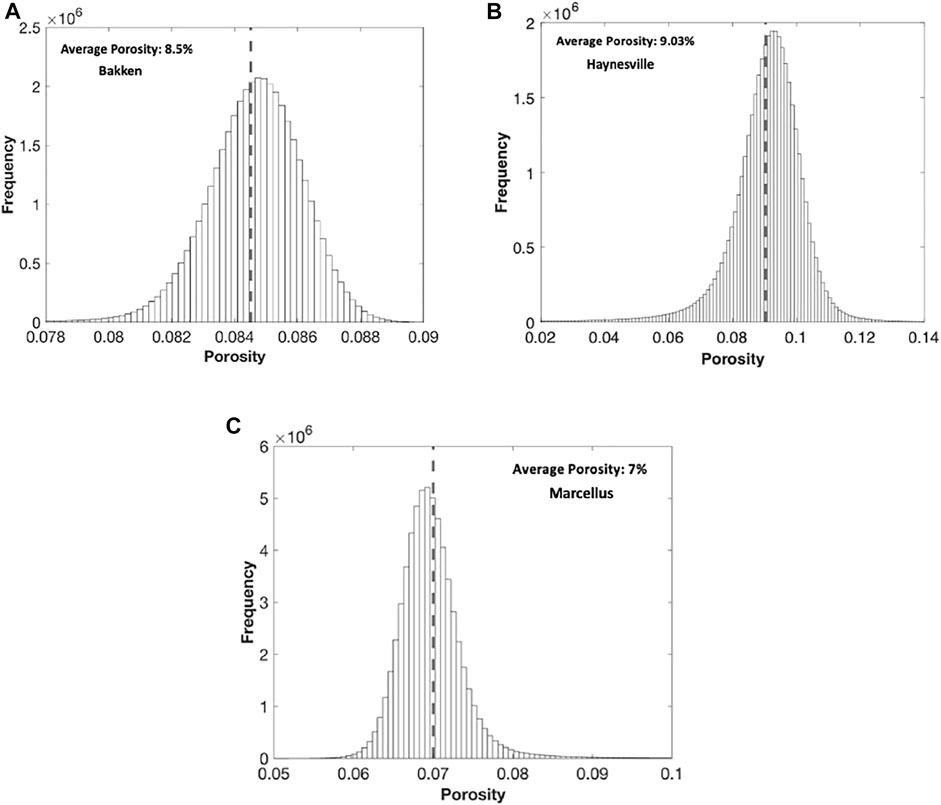
FIGURE 3. Porosity distribution for each sub-volume of the (A) Bakken, (B) Haynesville and (C) Marcellus shale sample.
Eq. 1 can then be used to calculate in-situ xenon density within shales. Figure 4 shows a comparison of in-situ xenon density distributions and 3D density maps for the Bakken, Haynesville and Marcellus samples. samples. At similar equilibrium conditions, the measured average in-situ xenon density within the Bakken, Haynesville and Marcellus samples are found to be 171.53 kg/m3, 326.05 kg/m3 and 947 kg/m3, respectively. This indicates that the Marcellus sample has the highest storage capacity, while the Bakken sample has the lowest storage capacity. The dash-dotted vertical line indicates the theoretical xenon gas density at 300 psi and
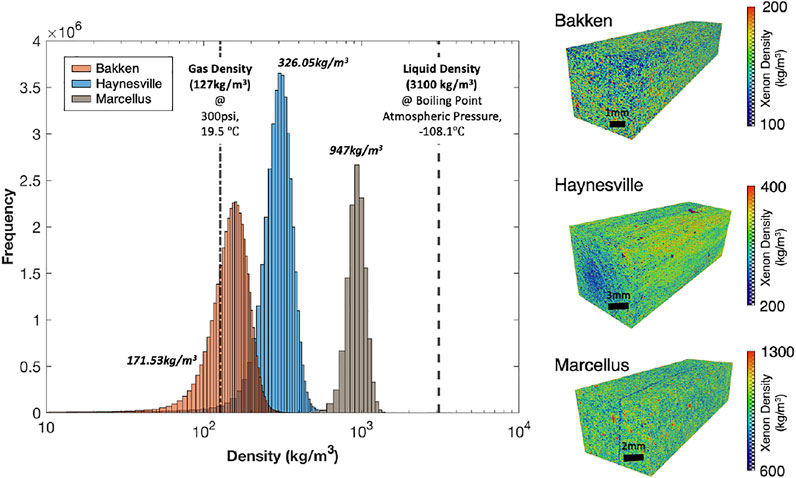
FIGURE 4. In-situ xenon density distributions (left) and corresponding 3D spatial density maps (right) for the Bakken, Haynesville and Marcellus shale samples.
Currently, accurate adsorption measurements require knowledge of either density or volume of adsorbed phase. A common approach is to approximate the adsorbed gas density as the liquid phase density of the gas. The finding of this study raises an important question as to whether the use of liquid phase density leads to a overestimation of adsorbed gas content and gas in place (Perez and Devegowda, 2017).
By having the porosity distributions and the corresponding in-situ xenon density distributions, it would be reasonable to wonder how in-situ xenon density is affected by porosity. The cross-plots of in-situ xenon density against porosity for the Bakken, Haynesville and Marcellus samples are reported in Figure 5. The overall trend of the data indicates that higher density corresponds to lower porosity, and likely smaller pores. This agrees with the literature results, which reveals that gas densification is pore size-dependent (Didar and Akkutlu, 2013; Gallego et al., 2011; Pitakbunkate et al., 2016). Note that the theoretical free gas density is different for the Haynesville because of the different final equilibrium pressure.
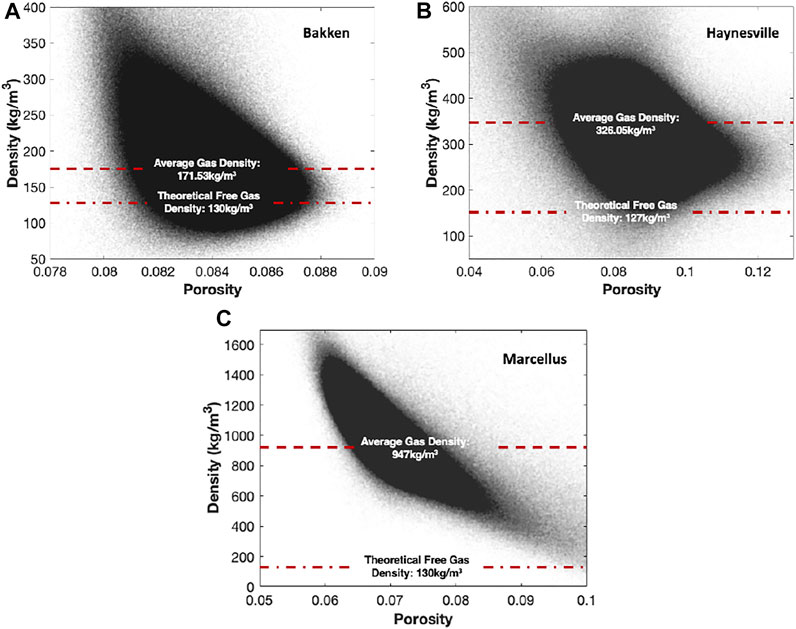
FIGURE 5. Cross-plot of computed in-situ xenon density against the corresponding porosity for the (A) Bakken, (B) Haynesville and (C) Marcellus shale samples.
To present this gas densification phenomenon more intuitively, we define the term densification factor as follows,
where
Figure 6 summarizes the results of the experiments on Bakken, Haynesville and Marcellus samples. The xenon relative critical properties (i.e.,
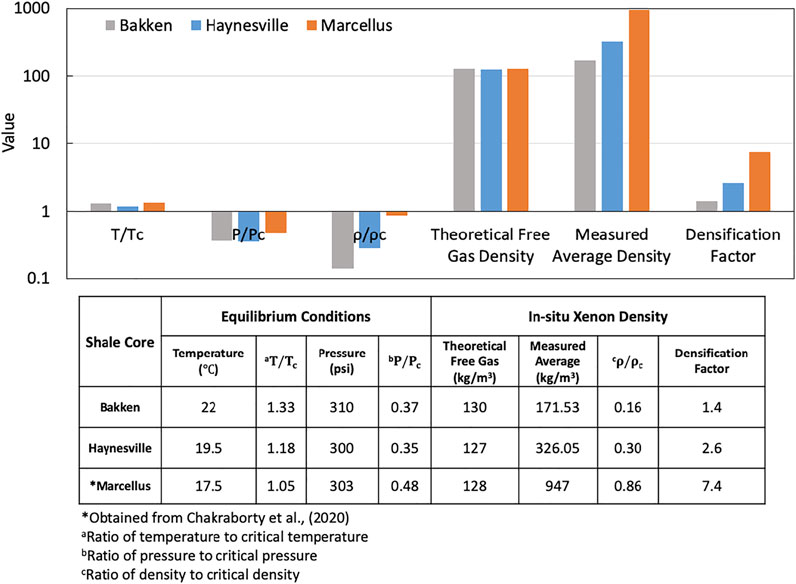
FIGURE 6. Summary of the gas invasion experiments on the Bakken, Haynesville and Marcellus samples.
Shale Properties Control on Gas Densification
All measured sample compositional and structural properties are reported in Table 2. The three shale samples used in this work are same as the samples in Chakraborty et al. (2020). It can be seen that the clay content in the Bakken, Haynesville and Marcellus samples are 23.1, 54.5 and 38.9% respectively, indicating that all of the samples are clay rich. The organic content in the Haynesville and Marcellus samples are 3.8 and 5.6%. In contrast, the Bakken sample has almost no organic content. Moreover, the Marcellus sample has a high quartz content. Quartz minerals are generally known to have low adsorption capacities (Ross and Bustin, 2009), whereas the most significant degree of xenon densification appears in the Marcellus sample. This indicates that quartz has almost no effect on xenon densification. For pore structure, the three samples have similar porosity. The Bakken sample has a very low specific surface area of only 3 m2/g. The Haynesville sample has a higher surface area of 10 m2/g, and the Marcellus has the highest surface area of 27 m2/g. In addition to the mean pore width provided in Table 2, Chakraborty et al. (2020) reported that the measured proportion of meso and small macropores (<100 nm) relative to total pore space was less than 0.1% in the Bakken, 37% in the Haynesville and 46% in the Marcellus. This offers the assessment of pore size for the three shale samples.
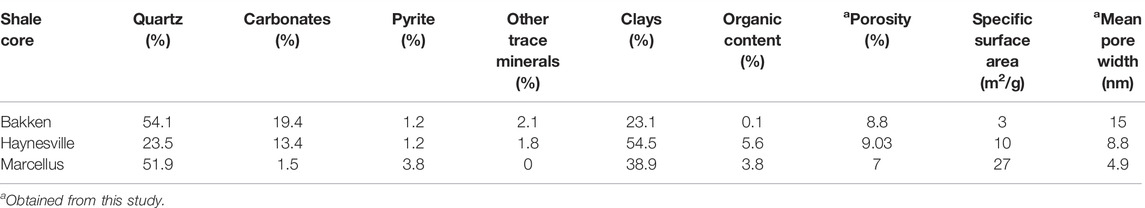
TABLE 2. Comparison of compositional and pore structural properties for the Bakken, Haynesville and Marcellus shale samples (Chakraborty et al., 2020)
All the characterized shale properties for the Bakken, Haynesville and Marcellus samples are presented as axes of the radar chart shown in Figure 7. The maximum and minimum values are best-approximation limits obtained from the literature. Warmer colors indicate higher gas densification–thus the Marcellus with the highest gas uptake is shown in red and the Bakken with the least uptake is shown in blue. It can be observed that gas densification increases with surface area and decreasing mean pore size, indicating that the degree of gas densification can be attributed to surface area and pore size. This result agrees with previous studies (Gallego et al., 2011; Li et al., 2020; Luo et al., 2016). Larger surface area can provide higher availability for gas molecules to adsorb, while smaller pores have stronger pore wall-molecules forces. It was also found that the porosity of the three shale samples had little relevance in densification due to the small dataset. Overall, no clear correlation between compositional properties and gas densification was found except for carbonate percentage. However, the carbonate data is skewed by the fact that there is very little in the Marcellus. This observation may suggest that the densification observed in our experiment is influenced by multiple parameters other than only shale compositional properties. While the dataset in this study is small due to the availability of materials and experimental cost, the result still offers a qualitative insight into the shale properties affecting gas densification, and consequently influencing gas storage behavior in shales.
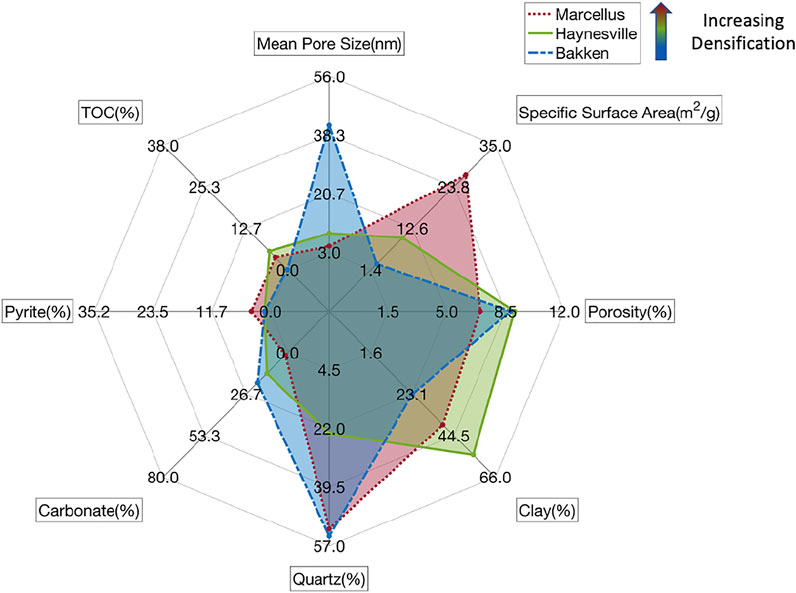
FIGURE 7. Radar chart of all characterized shale properties for the Bakken, Haynesville and Marcellus samples and their relationship to gas densification.
Conclusion
In this work, we directly measure in-situ xenon density within Bakken, Haynesville and Marcellus shales through quantification of 3D X-ray attenuation dataset. For the first time, different degrees of gas densification have been observed experimentally and documented for a group of shale samples with varying properties carefully characterized. Results show that the in-situ xenon density within the Bakken, Haynesville and Marcellus samples are 171.53 kg/m3, 326.05 kg/m3 and 947 kg/m3, respectively. These measured in-siu xenon densities are higher than their corresponding theoretical free gas density (∼127 kg/m3) and much lower than the liquid density at boiling point (3100 kg/m3). The highest xenon densification factor is found to be 7.4 in the Marcellus sample, indicating the most significant degree of localized densification. This densification factor drops to 2.6, and to 1.4, in the Haynesville and the Bakken sample, respectively. In addition, by comparing the final experimental conditions of the three samples, it is observed that xenon gas properties are quite far from critical properties in the Bakken and Haynesville samples. In contrast, xenon gas in the Marcellus sample is altered toward to a near critical state, even though it is at sub-critical pressure and temperature conditions. The shale compositional and structural properties for the three shale samples are presented in order to explore their relationship with densification. Results show that densification increases with surface area and decreasing pore size, indicating that the observed degree of gas densification in shales can be attributed to pore structural properties. This work offers a way to quantify densification over a range of porosity and surface area, at relatively low TOC.
The comparison of in-situ xenon density across the three shale samples lays a foundation to evaluate extra storage capacity for various gases in ranging tight formations. The observation in the experiment is a good first step in guiding which model is appropriate to predict gas storage for a specific shale rock. More importantly, this work offers valuable experimental data that are rarely available in the literature, thereby providing reference for simulation to much more accurately approximate in-situ gas densities and predict gas storage. In future research, the study of simulation for the observation in our experiment will be explored. Bridging simulation and our experiment will provide valuable insight into the mechanisms of gas storage and transport within shales. It is also expected that a quantitative correlation for densification as a function of pore-size distribution or gas type (gas molecule size) can be established.
Data Availability Statement
The original contributions presented in the study are included in the article/Supplementary Material, further inquiries can be directed to the corresponding author.
Author Contributions
XL was principally responsible for the concept of this manuscript and for preparing the manuscript. NC helped with the characterization data collection and analysis presented. ZK was the supervisor of the project and provided technical guidance. All authors contributed to reviewing the manuscript. All authors read and approved the final manuscript.
Conflict of Interest
Author NC is employed by BP.
The remaining authors declare that the research was conducted in the absence of any commercial or financial relationships that could be construed as a potential conflict of interest.
Publisher’s Note
All claims expressed in this article are solely those of the authors and do not necessarily represent those of their affiliated organizations, or those of the publisher, the editors, and the reviewers. Any product that may be evaluated in this article, or claim that may be made by its manufacturer, is not guaranteed or endorsed by the publisher.
Acknowledgments
The contribution of Bakken shale samples for this study by Hess Corp is gratefully acknowledged. We also thank Unconventional Natural Resources Consortium (UNRC) at Penn State U., for facilitating Marcellus shale samples for this study.
References
Agrawal, K. V., Shimizu, S., Drahushuk, L. W., Kilcoyne, D., and Strano, M. S. (2017). Observation of Extreme Phase Transition Temperatures of Water Confined inside Isolated Carbon Nanotubes. Nat. Nanotech 12 (3), 267–273. doi:10.1038/nnano.2016.254
Aljamaan, H., Ross, C. M., and Kovscek, A. R. (2017). Multiscale Imaging of Gas Storage in Shales. SPE J. 22 (6), 1760–1777. doi:10.2118/185054-pa
Alnoaimi, K. R., Duchateau, C., and Kovscek, A. R. (2016). Characterization and Measurement of Multiscale Gas Transport in Shale-Core Samples. SPE J. 21 (2), 573–588. doi:10.2118/2014-1920820-PA
Ambrose, R. J., Hartman, R. C., Diaz-Campos, M., Akkutlu, I. Y., and Sondergeld, C. H. (2012). Shale Gas-In-Place Calculations Part I: New Pore-Scale Considerations. SPE J. 17 (1), 219–229. doi:10.2118/131772-PA
Barsotti, E., Tan, S. P., Piri, M., and Chen, J.-H. (2018). Phenomenological Study of Confined Criticality: Insights from the Capillary Condensation of Propane, N-Butane, and N-Pentane in Nanopores. Langmuir 34 (15), 4473–4483. doi:10.1021/acs.langmuir.8b00125
Barsotti, E., Tan, S. P., Saraji, S., Piri, M., and Chen, J.-H. (2016). A Review on Capillary Condensation in Nanoporous media: Implications for Hydrocarbon Recovery from Tight Reservoirs. Fuel 184, 344–361. doi:10.1016/j.fuel.2016.06.123
Busch, A., Alles, S., Gensterblum, Y., Prinz, D., Dewhurst, D., Raven, M., et al. (2008). Carbon Dioxide Storage Potential of Shales. Int. J. Greenhouse Gas Control. 2 (3), 297–308. doi:10.1016/j.ijggc.2008.03.003
Chakraborty, N., Karpyn, Z., Liu, S., Yoon, H., and Dewers, T. (2020). Experimental Evidence of Gas Densification and Enhanced Storage in Nanoporous Shales. J. Nat. Gas Sci. Eng. 76 (June 2019), 103120. doi:10.1016/j.jngse.2019.103120
Chakraborty, N., Lou, X., Enab, K., and Karpyn, Z. (2022). Measurement of In-Situ Fluid Density in Shales with Sub-resolution Porosity Using X-Ray Microtomography. Transp Porous Med. 141, 607–627. doi:10.1007/s11242-021-01738-4
Chalmers, G. R., Bustin, R. M., and Power, I. M. (2012). Characterization of Gas Shale Pore Systems by Porosimetry, Pycnometry, Surface Area, and Field Emission Scanning Electron Microscopy/transmission Electron Microscopy Image Analyses: Examples from the Barnett, Woodford, Haynesville, Marcellus, and Doig Units. Bulletin 96 (6), 1099–1119. doi:10.1306/10171111052
Chalmers, G. R. L., and Bustin, R. M. (2008). Lower Cretaceous Gas Shales in Northeastern British Columbia, Part I: Geological Controls on Methane Sorption Capacity. Bull. Can. Pet. Geology. 56 (1), 1–21. doi:10.2113/gscpgbull.56.1.1
Coasne, B., Alba-Simionesco, C., Audonnet, F., Dosseh, G., and Gubbins, K. E. (2009). Adsorption and Structure of Benzene on Silica Surfaces and in Nanopores. Langmuir 25 (18), 10648–10659. doi:10.1021/la900984z
Curtis, M. E., Cardott, B. J., Sondergeld, C. H., and Rai, C. S. (2012). Development of Organic Porosity in the Woodford Shale with Increasing thermal Maturity. Int. J. Coal Geology. 103, 26–31. doi:10.1016/j.coal.2012.08.004
Eberle, A. P. R., King, H. E., Ravikovitch, P. I., Walters, C. C., Rother, G., and Wesolowski, D. J. (2016). Direct Measure of the Dense Methane Phase in Gas Shale Organic Porosity by Neutron Scattering. Energy Fuels 30 (11), 9022–9027. doi:10.1021/acs.energyfuels.6b01548
Gallego, N. C., He, L., Saha, D., Contescu, C. I., and Melnichenko, Y. B. (2011). Hydrogen Confinement in Carbon Nanopores: Extreme Densification at Ambient Temperature. J. Am. Chem. Soc. 133 (35), 13794–13797. doi:10.1021/ja202432x
Gasparik, M., Ghanizadeh, A., Bertier, P., Gensterblum, Y., Bouw, S., and Krooss, B. M. (2012). High-pressure Methane Sorption Isotherms of Black Shales from the Netherlands. Energy Fuels 26 (8), 4995–5004. doi:10.1021/ef300405g
Gasparik, M., Bertier, P., Gensterblum, Y., Ghanizadeh, A., Krooss, B. M., and Littke, R. (2014). Geological Controls on the Methane Storage Capacity in Organic-Rich Shales. Int. J. Coal Geology. 123, 34–51. doi:10.1016/j.coal.2013.06.010
Heller, R., and Zoback, M. (2014). Adsorption of Methane and Carbon Dioxide on Gas Shale and Pure mineral Samples. J. Unconventional Oil Gas Resour. 8 (C), 14–24. doi:10.1016/j.juogr.2014.06.001
Jarvie, D. M. (2012). Shale Resource Systems for Oil and GasPart 1-Shale-Gas Resource Systems. AAPG Memoir 97 (January 2012), 69–87. doi:10.1306/13321446M973489
Kang, S. M. M., Fathi, E., Ambrose, R. J. J., Akkutlu, I. Y. Y., and Sigal, R. F. F. (2011). Carbon Dioxide Storage Capacity of Organic-Rich Shales. SPE J. 16 (4), 842–855. doi:10.2118/134583-PA
King, H. E., Eberle, A. P. R., Walters, C. C., Kliewer, C. E., Ertas, D., and Huynh, C. (2015). Pore Architecture and Connectivity in Gas Shale. Energy Fuels 29 (3), 1375–1390. doi:10.1021/ef502402e
Kuila, U., and Prasad, M. (2013). Specific Surface Area and Pore-Size Distribution in Clays and Shales. Geophys. Prospecting 61 (2), 341–362. doi:10.1111/1365-2478.12028
Li, J., Rao, Q., Xia, Y., Hoepfner, M., and Deo, M. D. (2020). Confinement-Mediated Phase Behavior of Hydrocarbon Fluids: Insights from Monte Carlo Simulations. Langmuir 36 (26), 7277–7288. doi:10.1021/acs.langmuir.0c00652
Liu, K., Ostadhassan, M., Zou, J., Gentzis, T., Rezaee, R., Bubach, B., et al. (2018). Nanopore Structures of Isolated Kerogen and Bulk Shale in Bakken Formation. Fuel 226 (February), 441–453. doi:10.1016/j.fuel.2018.04.034
Luo, S., Lutkenhaus, J. L., and Nasrabadi, H. (2016). Confinement-Induced Supercriticality and Phase Equilibria of Hydrocarbons in Nanopores. Langmuir 32 (44), 11506–11513. doi:10.1021/acs.langmuir.6b03177
Luo, S., Lutkenhaus, J. L., and Nasrabadi, H. (2019). Experimental Study of Pore Size Distribution Effect on Phase Transitions of Hydrocarbons in Nanoporous media. Fluid Phase Equilibria 487, 8–15. doi:10.1016/j.fluid.2018.11.026
Merkel, A., Fink, R., and Littke, R. (2016). High Pressure Methane Sorption Characteristics of Lacustrine Shales from the Midland Valley Basin, Scotland. Fuel 182, 361–372. doi:10.1016/j.fuel.2016.05.118
Morishige, K., and Nakamura, Y. (2004). Nature of Adsorption and Desorption Branches in Cylindrical Pores. Langmuir 20 (11), 4503–4506. doi:10.1021/la030414g
Nojabaei, B., Johns, R. T. T., and Chu, L. (2013). Effect of Capillary Pressure on Phase Behavior in Tight Rocks and Shales. SPE Reservoir Eval. Eng. 16 (3), 281–289. doi:10.2118/159258-PA
Perez, F., and Devegowda, D. (2017). Estimation of Adsorbed-phase Density of Methane in Realistic Overmature Kerogen Models Using Molecular Simulations for Accurate Gas in Place Calculations. J. Nat. Gas Sci. Eng. 46, 865–872. doi:10.1016/j.jngse.2017.08.008
Pitakbunkate, T., Balbuena, P. B., Moridis, G. J., and Blasingame, T. A. (2016). Effect of Confinement on Pressure/Volume/Temperature Properties of Hydrocarbons in Shale Reservoirs. SPE J. 21 (2), 621–634. doi:10.2118/170685-PA
Rahmani Didar, B., and Akkutlu, I. Y. (2013). “Pore-size Dependence of Fluid Phase Behavior and the Impact on Shale Gas Reserves,” in Proceeding of the Unconventional Resources Technology Conference 2013, Denver, Colorado, August 2013 (URTC), 1229. doi:10.1190/urtec2013-183
Rexer, T. F., Mathia, E. J., Aplin, A. C., and Thomas, K. M. (2014). High-pressure Methane Adsorption and Characterization of Pores in Posidonia Shales and Isolated Kerogens. Energy Fuels 28 (5), 2886–2901. doi:10.1021/ef402466m
Ross, D. J. K., and Marc Bustin, R. (2009). The Importance of Shale Composition and Pore Structure upon Gas Storage Potential of Shale Gas Reservoirs. Mar. Pet. Geology. 26 (6), 916–927. doi:10.1016/j.marpetgeo.2008.06.004
Singh, S. K., Sinha, A., Deo, G., and Singh, J. K. (2009). Vapor−Liquid Phase Coexistence, Critical Properties, and Surface Tension of Confined Alkanes. J. Phys. Chem. C 113 (17), 7170–7180. doi:10.1021/jp8073915
Stefanopoulos, K. L., Youngs, T. G. A., Sakurovs, R., Ruppert, L. F., Bahadur, J., and Melnichenko, Y. B. (2017). Neutron Scattering Measurements of Carbon Dioxide Adsorption in Pores within the Marcellus Shale: Implications for Sequestration. Environ. Sci. Technol. 51 (11), 6515–6521. doi:10.1021/acs.est.6b05707
Strąpoć, D., Mastalerz, M., Schimmelmann, A., Drobniak, A., and Hasenmueller, N. R. (2010). Geochemical Constraints on the Origin and Volume of Gas in the New Albany Shale (Devonian-Mississippian), Eastern Illinois Basin. Bulletin 94 (11), 1713–1740. doi:10.1306/06301009197
Thommes, M., and Cychosz, K. A. (2014). Physical Adsorption Characterization of Nanoporous Materials: Progress and Challenges. Adsorption 20 (2–3), 233–250. doi:10.1007/s10450-014-9606-z
Thommes, M. (2010). Physical Adsorption Characterization of Nanoporous Materials. Chem. Ingenieur Technik 82 (7), 1059–1073. doi:10.1002/cite.201000064
Ting, V. P., Ramirez-Cuesta, A. J., Bimbo, N., Sharpe, J. E., Noguera-Diaz, A., Presser, V., et al. (2015). Direct Evidence for Solid-like Hydrogen in a Nanoporous Carbon Hydrogen Storage Material at Supercritical Temperatures. ACS Nano 9 (8), 8249–8254. doi:10.1021/acsnano.5b02623
Travalloni, L., Castier, M., and Tavares, F. W. (2014). Phase Equilibrium of Fluids Confined in Porous media from an Extended Peng-Robinson Equation of State. Fluid Phase Equilibria 362, 335–341. doi:10.1016/j.fluid.2013.10.049
Vega, B., Ross, C. M., and Kovscek, A. (2014). “Imaging-based Characterization of Calcite-Filled Fractures and Porosity in Shales,” in Proceeding of the Society of Petroleum Engineers - SPE/AAPG/SEG Unconventional Resources Technology Conference, August 2014. doi:10.15530/urtec-2014-1922521
Wang, Y., Zhu, Y., Liu, S., and Zhang, R. (2016). Pore Characterization and its Impact on Methane Adsorption Capacity for Organic-Rich marine Shales. Fuel 181, 227–237. doi:10.1016/j.fuel.2016.04.082
Watson, A. T., and Mudra, J. (1994). Characterization of Devonian Shales with X-ray Computed Tomography. SPE Formation Eval. 9 (3), 209–212. doi:10.2118/22943-pa
Zarragoicoechea, G. J., and Kuz, V. A. (2004). Critical Shift of a Confined Fluid in a Nanopore. Fluid Phase Equilibria 220 (1), 7–9. doi:10.1016/j.fluid.2004.02.014
Keywords: unconventional reservoirs, shale, storage capacity, gas density, x-ray CT
Citation: Lou X, Chakraborty N and Karpyn Z (2022) Experimental Investigation of Shale Rock Properties Altering In-Situ Gas Density and Storage. Front. Earth Sci. 10:877551. doi: 10.3389/feart.2022.877551
Received: 16 February 2022; Accepted: 30 March 2022;
Published: 14 April 2022.
Edited by:
Jienan Pan, Henan Polytechnic University, ChinaReviewed by:
Guochang Wang, Saint Francis University, United StatesTaoyuan Ge, China University of Geosciences, China
Copyright © 2022 Lou, Chakraborty and Karpyn. This is an open-access article distributed under the terms of the Creative Commons Attribution License (CC BY). The use, distribution or reproduction in other forums is permitted, provided the original author(s) and the copyright owner(s) are credited and that the original publication in this journal is cited, in accordance with accepted academic practice. No use, distribution or reproduction is permitted which does not comply with these terms.
*Correspondence: Xuanqing Lou, xxl234@psu.edu