Grating-Based X-Ray Computed Tomography for Improved Contrast on a Heterogeneous Geomaterial
 Rachael Leigh Moore1
  Anne Bonnin
 Bénédicte Ménez
- 1Université Paris Cité, Institut de physique du globe de Paris, Paris, France
- 2Swiss Light Source, Paul Scherrer Institute, Villigen, Switzerland
- 3ALBA Synchrotron, Cerdanyola del Vallés, Barcelona, Spain
Phase-contrast X-ray imaging has shown its potential to capture at micrometric scale and in three dimensions (3D), the structure and deformation of poorly-absorbing soft materials such as polymers and biological structures. When composed of constituents that attenuate X-rays differently, heterogeneous hard materials are often well resolved in 3D using absorption-based X-ray computed tomography (CT) techniques. As a result, phase-contrast techniques have been less frequently used to image such materials. However, many geomaterials contain similarly X-ray attenuating constituents, thereby complicating the use of absorption-based X-ray CT methods. Here we present the innovative use of grating-based synchrotron radiation computed tomography, a phase-sensitive technique, in order to better identify the distribution of constituents within geomaterials. We show that this approach enhances the contrast between similarly X-ray absorbing constituents, and can be used to identify spatially small structures such as pores or mineral grains that are typically poorly resolved with conventional absorption-based X-ray CT.
Introduction
The application of absorption-based X-ray computed tomography (CT) techniques in geoscience and material science has greatly enhanced our understanding of complex materials such as rocks (e.g., Cnudde et al., 2006; Gualda et al., 2010; Boone et al., 2011; Baker et al., 2012; Cnudde and Boone, 2013; Wildenschild and Sheppard, 2013). X-ray CT produces volumes that represent the spatial distribution of an object’s constituents (used here to refer to compositional phases within a multi-phase material). Within a reconstructed absorption-based X-ray CT volume, the gray intensity value for each volume pixel (voxel) represents the linear attenuation coefficient, µ, of the constituent that occupies that space. When a CT scan is acquired using a monochromatic X-ray source, µ is a constant that has a direct correspondence with the absorbing constituent (Cnudde et al., 2006). A heterogeneous object imaged with absorption-based X-ray CT will be well resolved (i.e., with a sufficient contrast) when its constituents’ linear attenuation coefficients are sufficiently different from both one another and the experimental background so that when the volume is reconstructed, each constituent has a unique gray intensity value (Wildenschild and Sheppard, 2013).
In general, when imaged with absorption-based X-ray CT, two classes of materials have contrast-related limitations: poorly-absorbing materials and hard materials. Poorly-absorbing materials (e.g., biological tissues, including wood, many synthetic or bio-polymers) composed of low-Z elements (where Z is the atomic number) have low µ values at the X-ray energies typically used for laboratory- or synchrotron radiation (SR)-based X-ray CT scanning (Hubbell and Seltzer, 1995). Thus, there is often minimal contrast between the experimental background and the scanned object. Hard materials, such as many geomaterials, are typically highly X-ray absorbing. However, many of them contain multiple constituents which can attenuate X-rays in a similar manner. This results in very similar µ values which complicates downstream data processing and ultimately, constituent identification and localization.
Phase-contrast X-ray imaging and phase-retrieval techniques have been developed over many years as a way to overcome contrast-related limitations (e.g., Cloetens et al., 1996; Wilkins et al., 1996; Cloetens et al., 1999). Such techniques have been employed to study soft materials including biological matter and polymers. They result in improved contrast leading to better downstream data analysis (Groso et al., 2006; Pfeiffer et al., 2008; McDonald et al., 2009; Zhu et al., 2010). In the geosciences, phase-contrast techniques have been used before to study volcanic pyroclasts with improved contrast (Zandomeneghi et al., 2010). More widespread use has been limited because most geomaterials are composed of numerous constituents and require complex phase-retrieval techniques (Wildenschild and Sheppard, 2013). Here we present grating-based synchrotron radiation computed tomography (GB-SRCT) on a geomaterial (i.e., a basaltic rock). To our knowledge grating-based phase-contrast X-ray imaging has not been documented for geomaterials. We show how GB-SRCT can be used to differentiate between constituents with similar absorption properties in a hard, highly absorbing material.
Grating-Based Synchrotron Radiation Computed Tomography on a Geomaterial
X-ray CT investigations of geomaterials often focus on elastic properties, porosity and permeability, as well as wettability and/or particle packing (e.g., Song et al., 2001; Totten et al., 2002; Naveed et al., 2013; Yang et al., 2017; Glatz et al., 2018; Ju et al., 2018; Marone et al., 2020; Chenlu et al., 2021). Since the physical and mechanical properties of an object are dictated by the nature and distribution of its constituents, it is necessary to be able to differentiate between them. With X-ray CT, image segmentation typically occurs after volume reconstruction to individualize the object’s constituents. Manual segmentation is rarely used; rather semi-automated or fully-automated classification schemes are instead employed to segment image on the basis of gray intensity values (Iassonov et al., 2009). However, automated thresholding, or other means of algorithmic classification, require sufficiently different µ-determined gray intensity values to distinguish constituents from one another. For CT scans collected at the same X-ray energy, constituents with similar chemical compositions and densities will therefore be hardly resolved. If these constituents have, for a same chemical composition, variable texture and morphologies, protocols based on texture and shape will not improve their identification (Iassonov et al., 2009). Linear attenuation coefficients are also influenced by the presence of pores. Accordingly, depending on its texture and porosity, the same constituent can have different µ values which complicates its identification and localization in heterogeneous samples.
Many minerals have similar densities or chemistries thereby producing similar or overlapping linear attenuation coefficients (Wildenschild and Sheppard, 2013; Figure 1 and Supplementary Figure S1). For example, basalt, an igneous silicate rock, is primarily composed of plagioclase feldspars and pyroxenes, with olivine and iron oxides as accessory minerals (see Supplementary Table S1 for respective formula). When weathered, these minerals alter into clays (mainly smectite), carbonates, zeolites, and other secondary minerals. Clays (ρ = 2–3 g cm-3) and plagioclase feldspar (ρ = 2.6–2.8 g cm-3) attenuate X-rays to a similar extent (Deer et al., 2013; Figure 1 and Supplementary Figure S1). Therefore, they can be nearly indistinguishable in absorption-based X-ray CT scans collected on synchrotron and laboratory-based systems (Figures 2A,B, respectively). This is a fundamental problem because plagioclase feldspar is a primary mineral, while clays are isochemically produced during low-temperature weathering.
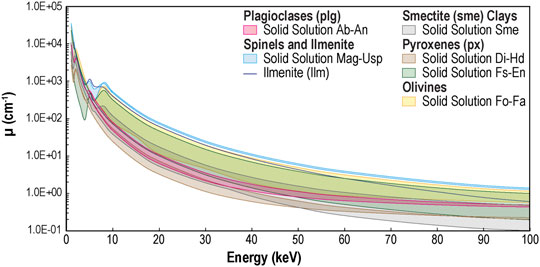
FIGURE 1. Overlapping linear attenuation coefficients, µ, of major primary minerals and the secondary smectite clay group commonly found in basalts. Minerals are typically solid solutions in between endmembers and their composition (represented by shading) can occupy a range based on the deviation from endmember chemistry. Titano-magnetite falls within the magnetite (Mag)-ulvöspinel (Usp) solid solution series. Supplementary Table S1 presents the mineral names, their abbreviations, groups, chemical formulas, and densities used in µ calculations. Individual endmember graphs are detailed in Supplementary Figure S1.
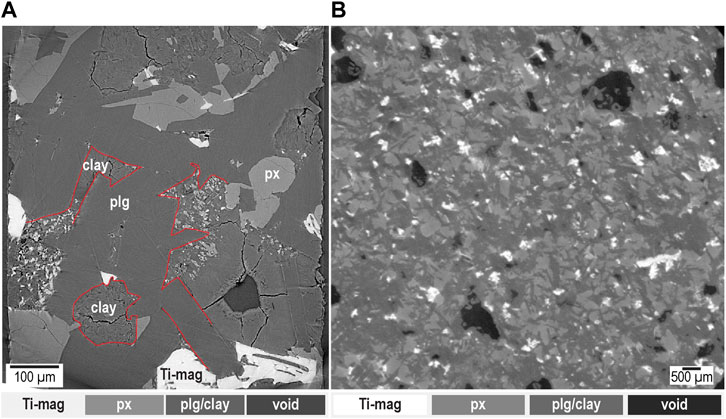
FIGURE 2. Absorption-based synchrotron radiation and laboratory X-ray CT imaging of a partially altered crystalline basalt. Ti-mag denotes titano-magnetite, px pyroxene, plg plagioclase. (A) SRCT slice collected at the TOMCAT beamline, SLS, PSI, Switzerland. Incident X-ray energy was 21 keV and voxel size is 0.325 µm. There is minimal absorption contrast between clay and plagioclase feldspar because these minerals have overlapping µ values (Figure 1 and Supplementary Figure S1), but the two phases can be identified by their structures (layered for clay versus plain crystal for plg). A red line is used to show the boundary between some clay minerals and some plagioclase crystals. (B) CT slice collected using a laboratory X-ray CT scanner; voxel size is ∼13 µm. Here it is not possible to differentiate plagioclase feldspar from clay because the layered structures of the phyllosilicate sheets are not resolved at this voxel size.
GB-SRCT can be used to elucidate constituents with poor absorption contrast. This technique has been available for many years at the TOMCAT beamline of the Swiss Light Source (SLS) at the Paul Scherrer Institute (PSI) in Switzerland (Weitkamp et al., 2005; David et al., 2007; Marone et al., 2020). To improve beamline capability for GB-SRCT, the setup was upgraded to a permanently mounted flexible interferometer named DPC2.0 (Patera et al., 2017; Supplementary Figure S2). The results presented herein are some of the first results measured using DPC2.0. The technique enables the simultaneous acquisition of three signals, thus producing three data volumes: the transmission signal (absorption) which depends on µ, the differential phase-contrast, DPC, signal (small angle refraction), and the dark-field signal (result of local scattering). The DPC signal is sensitive to the refractive properties of a constituent. In basalt, the refractive properties of the two similarly X-ray attenuating constituents (i.e., the plagioclase feldspar and the clays; Figure 1) differ due to their crystallographic structure and packing properties. Clays are made of layered, platy particles that are packed together whereas plagioclase feldspar is a plain crystalline solid (Deer et al., 2013). This theoretically allows them to be differentiated by using the DPC signal. The dark-field signal is more sensitive to abrupt changes in density within an object (Pfeiffer et al., 2008; Strobl, 2014), and can provide structural information at a sub-voxel level. Therefore, it can be used to identify small fractures and cracks, as well as interfaces between basalt constituents and pores.
Methods
Linear Attenuation Coefficient Calculations
The linear attenuation coefficients, µ, for specific mineral phases and endmembers of mineral solid solutions, composed of n constituents, were calculated following the additive equation:
where ρ is the density, wi is the weight fraction, and
Computed Tomography
To compare GB-SRCT to absorption-based X-ray CT, three different sets of data were acquired on samples of a partially altered crystalline basalt drilled in an Icelandic aquifer (Alfredsson et al., 2013; Callow et al., 2018). Laboratory-based X-ray CT scans were collected on a cone-beam instrument, the EasyTom XL Duo microtomograph set at the IC2MP (Plateforme Caractérisation de Matériaux, Université de Poitiers, France) and two types of high-resolution SRCT were performed at the TOMCAT beamline.
The EasyTom XL Duo microtomograph was used to scan a mini-core (15 mm in diameter, height of 30 mm) of basalt. Helical acquisition mode was used to generate 3,360 projections at 6 frames per second using a voltage of 86 kV. Scans were reconstructed with the Xact 8,043 v1.1 software (RX-Solutions) using a filtered rear projection method and a beam hardening correction. Reconstructed volumes were saved as tiff 16-bit uncompressed images with a final voxel size of 13.31 µm.
At the TOMCAT beamline, smaller basalt columns ( ∼ 700 μm × 700 μm × 1 cm, length × width × height) were imaged. First, basalt samples were imaged using SRCT in absorption mode at ×20 magnification to produce a voxel size of 0.325 µm. An X-ray beam energy of 21 keV was used with an exposure time of 120 ms per projection. 1,501 projections with 30 dark images and 100 flat images were generated for each scan. Data reconstruction followed in-house protocols using the Gridrec reconstruction algorithm (Marone et al., 2017). To facilitate the identification of individual constituents, a Paganin phase retrieval filter was applied to a limited number of scans during their reconstruction (Supplementary Figure S3). The filter can reduce image noise by acting as a low-pass filter (Paganin et al., 2002). When the Paganin filter was used, reconstruction was carried out in 16-bit with delta and beta parameters: 1.7 10–8 and 1.7 10–9, respectively, distance: 10.0 mm, pixel size: 0.325 µm, padding: 0, stabilizer: 0.3, Gaussian kernel width: 1.0, and a threshold comprised between 5 10–6 and 8 10–6 for all samples.
The same samples were re-imaged with GB-SRCT that was performed using the TOMCAT DPC2.0 endstation (Patera et al., 2017) (Supplementary Figure S2). The DPC2.0 endstation is positioned 30 m downstream from the 2.9 T bending magnet source. The imaging setup consists of two gratings (G1 and G2) placed at the desired fractional Talbot distance. The gratings are fabricated in house at the PSI and guarantee a visibility of up to 36%. Phase gratings for the interferometer are available for X-ray photon energies up to 25 keV and three Talbot orders, the 1st, 3rd, and 5th. G1 (the phase grating) has a period of ∼ 4 µm and is held in position by a polyvinylchloride pocket mounted on a motorized aluminum holder. This motorized holder allows for phase stepping. It has a total travel range of 195 mm along the beam path and can be moved horizontally and vertically to determine area and Talbot order. G2 (the analyzer grating) has a 2 µm period and is mounted behind G1. Its motorized holder has a travel range of 395 mm, and it is automatically tunable for variable inter-grating distances. The detector is positioned behind G2. It consists of a LuAG scintillator (CRYTUR), 300 µm thick, to convert X-rays into visible light and of a sCMOS camera with a 16-bit nominal dynamic range (PCO.Edge 5.5) attached to a 1:1 optical microscope. This configuration offers a 6.5 µm pixel size and maximum field of view of 12.6 × 4.5 mm2. The same columns of basalt were used for both SRCT and GB-SRCT, but prior to GB-SRCT experiments, vacuum forcing was used to introduce Milli-Q™ water into the basalt pore space to reduce phase-contrast artefacts due to air. Hydrated samples were then placed in an aquarium filled with Milli-Q™ water to prevent the occurrence of phase wrapping artefacts caused by out of range wave phase shift between air and the sample. Each side of the aquarium has a polyimide window that is transparent to X-rays (Supplementary Figure S2). A phase stepping procedure using the grating interferometer setup was used to separate the phase contribution from the transmission signal. Five steps over a 2 µm period were used to scan the samples. Exposure time was 160 ms and a total of 1,000 projections, 30 dark images and 100 flat images was generated. The total scan time per sample was 12 min. Absorption based SRCT scans were registered to GB-SRCT data using landmark defined affine registration with Insight Segmentation and Registration Toolkit (Kitware). Image processing was performed using Fiji (Schindelin et al., 2012) and AVIZO version 9.2 (FEI).
Scanning Electron Microscopy
Scanning electron microscopy (SEM) in backscattered electron (BSE) mode were performed on carbon coated samples using a Zeiss EVO MA 10 microscope operated at 15 kV accelerating voltage (PARI platform, Institut de physique du globe de Paris, Université de Paris, France). Elemental microanalyses and mapping were performed using energy dispersive X-ray spectrometry (EDS) using a Quanta 200 detector (Bruker). Data were processed using SmartSEM (Zeiss).
Results
Figure 3 compares high-resolution SRCT in absorption mode (Figure 3A) with GB-SRCT performed using the DPC2.0 endstation (Figures 3B–D). The voxel sizes for the two techniques are 0.325 and 6.5 µm, respectively. Three different gray intensity values associated to mineral structures can be observed in slice data from both absorption-based SRCT (Figure 3A) and the transmission signal collected using GB-SRCT (Figure 3B). The layered structure of the clay is observable in the higher resolution SRCT scan, but clays are not associated with a different gray intensity value compared to plagioclase feldspars (Figure 3A). A fourth gray intensity value appears in the DPC signal (Figure 3C) which can be associated to clay minerals. Compared to plain plagioclase minerals, the nano-scale layered structure of clays causes a higher amount of small angle refraction leading to a different distribution of gray intensity values in the DPC signal image with respect to the absorption-based signals (Supplementary Figure S4). Commonly used segmentation methods (e.g., watershed transformation, histogram-based thresholding, edge detection) failed to segment 4 constituents from both absorption-based data volumes (Supplementary Figures S5A,B). However, the DPC signal provides the ability to segment the plagioclase phase (Figure 3C, #2) from the clay phase (Figure 3C, #4) using global thresholding methods (Supplementary Figure S5C). Figure 3D presents the dark-field signal which shows, thanks to local scattering, the propagation of microfractures and cracks as well as mineral boundaries and interfaces between basalt constituents and pores. If the dark-field image is processed using only automated segmentation techniques, the detected fractures or pores will occupy a larger volume than found in higher resolution scans due to imaging constraints (i.e., signal scattering; Supplementary Figure S4D). However quantitative dark-field imaging can be performed when the autocorrelation length of the instrument setup is known (Strobl, 2014).
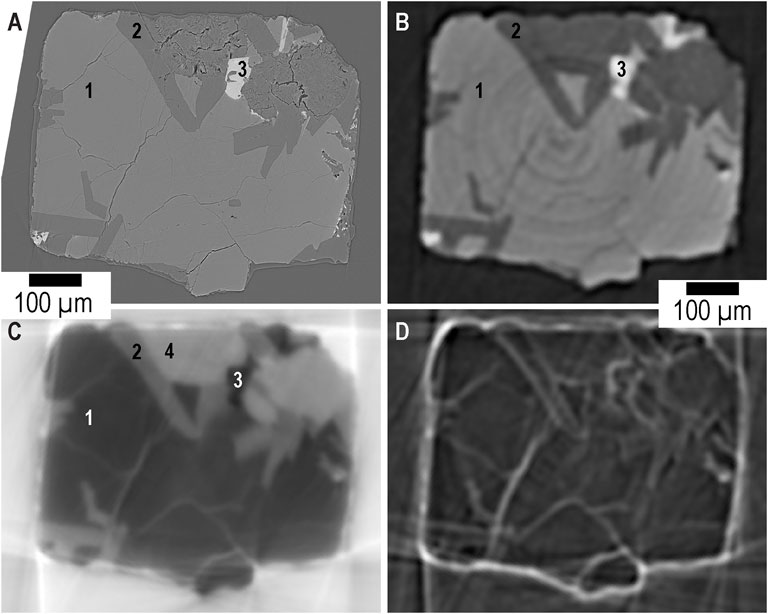
FIGURE 3. Compared absorption-based SRCT and GB-SRCT imaging of a partially altered crystalline basalt. (A) High-resolution absorption-based SRCT slice (1 voxel = 0.325 µm). Based on gray intensity values, 3 distinct constituents (labelled 1–3) can be observed. Note that Paganin phase retrieval (Paganin et al., 2002) did not led to an increase in absorption-based tomographic image quality (Supplementary Figures S3). (B) The transmission signal acquired during GB-SRCT (1 voxel = 6.5 µm) where the 3 constituents are also visible. (C) The DPC signal resulting from the small angle refraction of different constituents within the partially altered basalt. Compared to (A), one additional constituent (labelled 4) is visible. Constituent 1 is likely pyroxene, constituent 2 is plagioclase, constituent 3 is titano-magnetite, and constituent 4 is clay. (D) The dark-field signal, produced by local scattering, can be used to observe interfaces and fractures within the crystalline basalt. Associated distributions of gray intensity values and segmentation by global thresholding are provided in Supplementary Figures S5, S6, respectively.
Although samples were hydrated in the present GB-SRCT experiment, a single test scan on a sample in air showed minimal phase wrapping artefacts and produced visually comparable data quality (Supplementary Figure S6). This suggests that rock samples do not necessarily need to be hydrated and immersed in water. This is further substantiated by additional work performed using earlier versions of the DPC system (Patera et al., 2017).
Discussion and Conclusion
The partial volume effect (PVE) dictates that the gray intensity value of a voxel is an average of the linear attenuation coefficients of all constituents and air-filled or water-filled voids present in the area to which that voxel is spatially associated (Kerckhofs et al., 2008). Due to this effect, small pores, thin fractures, as well as boundaries between a spatially small constituent and its surroundings, which are the targets of many studies, are often poorly resolved using X-ray CT, unless very high resolutions are used. This can complicate the study of heterogeneous hard materials. Absorption-based SR and laboratory X-ray CT can be used to acquire scans with voxel sizes ranging from 20 to 30 nm to tens of millimeters. The DPC2.0 setup offers a voxel size limited to 3.25 µm due to the analyzer-grating period (G2; Supplementary Figure S2) and the current combination of the microscope and detector available at the TOMCAT beamline. To some extent, the lower resolution produced by the GB-SRCT technique can be made up by the dark-field signal, which shows significant promise as a technique to locate small fractures and cracks at a sub-voxel level (Supplementary Figure S5D). While grain boundaries are also highlighted together with microfractures and cracks by the dark-field signal, these two types of features can be unambiguously discriminated by combining the dark-field signal with the DPC signal that selectively images grain boundaries (Supplementary Figure S5B). Alternatively, as presented in Figure 2A, Figure 3A, small pores, thin fractures, and similarly X-ray attenuating constituents can sometimes be observed in high-resolution SRCT scans. However, they usually do not differ enough in their gray intensity values to be readily segmented (Supplementary Figures S5A,B). Such a limitation of absorption-based X-ray CT can nevertheless be overcome in some cases by the use of dual energy X-ray CT (Coenen and Maas, 1994; Van Geet et al., 2000; De Man et al., 2001; Van Geet et al., 2001), now widely used in the geosciences (e.g., Iovea et al., 2009; Purcell et al., 2009; Ghorbani et al., 2011; Tsuchiyama et al., 2013; Al-Owihan et al., 2014; Bauer et al., 2021). Dual-energy scans that make use of the energy dependence of the attenuation coefficient (Figure 1) are collected using X-ray beams of two different energies. This allow the density and effective Z of an object’s constituents to be assessed and has shown significant improvement in differentiating minerals (Coenen and Maas, 1994). Appropriate sets of standard materials for absolute interpretation of the linear attenuation coefficients and data volumes’ registration are nevertheless required with this approach (Van Geet et al., 2000) whereas the standard-free GB-SRCT technique provide the three different signals that allow identification of the similarly X-ray attenuating constituents within the same data volume.
Although they have lower spatial resolution, the three data volumes generated by GB-SRCT may ultimately be more informative than conventional SRCT when studying heterogeneous hard materials with mineralogically and/or chemically different yet similarly X-ray attenuating constituents. In the case of geomaterials, clay minerals and plagioclase feldspars are generally indistinguishable on the basis of gray intensity values in absorption-based (SR)CT scans (Figure 2, Figure 3A). Typically, phase-retrieval methods are required to differentiate between them. Since grayscale contrast between different constituents is necessary for automated segmentation techniques, the DPC signal greatly enhances the ability to study mineral distribution in crystalline basalt (Figure 3C), and other heterogeneous materials comprised of constituents with similar or overlapping µ.
Absorption-based X-ray CT allows for data to be acquired at a higher magnification than GB-SRCT. However, the additional signal information provided by GB-SRCT allows for improved segmentation, fracture identification, and enhanced grain-edge resolution. When spatial resolution increases, the impact of the PVE should decrease (Figures 3A,B) hence leading to higher resolution and reliability with regard to the real nature of the imaged material. However, for heterogeneous materials, the sample size necessary to be able to acquire absorption-based SRCT scans with a voxel size of 0.325 µm (Figure 3A) is likely not a representative elementary volume (REV). Sample size, voxel size, and what is a REV are strongly dependent on the purpose of the X-ray CT study, and should be considered on a per-study basis (Al-Raoush and Papadopoulos, 2010). Accordingly, the trade-off between high resolution and sample size must always be considered. We acknowledge that a strict comparison between GB-SRCT, absorption-based SR and laboratory X-ray CT approach would have required the use of centimetre-sized samples for all. However, the highly absorbing nature of the basalt samples used in this study does not yield sufficient resolution using the SRCT setup at the TOMCAT beamline that could not be optimised for the collection of high-quality data for samples of that size. For the purpose of this work, the same samples were used for both absorption-based and GB-SRCT. However, the field of view available on the DPC2.0 setup can accommodate samples up to 12.6 × 4.5 mm2. There are opportunities to migrate grating-based X-ray CT techniques into the laboratory where the different incident X-ray energies used may allow for increased sample size without imaging artefacts. Grating-based X-ray CT is actually being developed for laboratory-based systems (Birnbacher et al., 2016). Quantitative dark-field tomography on larger geological samples could greatly enhance porous and fractured media studies due to the identification of sub-voxel size fractures and pores in more representatively-sized samples. Fine fractures and small pores (in reference to feature versus voxel size) are often difficult to segment due to the PVE. However, with the dark-field signal they can be more readily identified and binarized (Supplementary Figure S5D), reducing the need for manual segmentation. Given that contrast-based limitations of absorption-based (SR)CT occur even with a voxel size of 0.325 µm, we suggest that GB-SRCT can represent an alternative means for phase-retrieval X-ray CT without the acquisition of many computationally heavy data sets. Further, GB-SRCT acquires the three signals–transmission, DPC, and dark-field–simultaneously. The resulting data volumes require no registration because they are already aligned on the same coordinate system.
Finally, combining chemical and/or mineralogical data with GB-SRCT data could allow for semi-quantitative to quantitative characterization in 3D. X-ray fluorescence (XRF) tomography is combined with absorption-based X-ray CT already (de Jonge and Vogt, 2010; Boone et al., 2011; Egan et al., 2015; Laforce et al., 2017), but measuring capabilities are limited below the surface of dense, X-ray absorbing materials that affect the depth at which emitted XRF can be detected. Surface XRF, SEM-EDS/BSE, or electron microprobe signals can be co-registered to the surface of the collected X-ray CT scans. Then chemical signals are correlated to gray intensity values from the CT scans. That correlation can be used to extrapolate the global 3D distribution of elements within an object. Such approaches can even be improved if, instead of chemical mapping, X-ray CT is combined with automated mineralogy (Schulz et al., 2020) that involves two dimensional mineral mapping using for example QEMSCAN, MLA, Mineralogic, TIMA, AMICS, INCA Mineral, or Q-WRMA systems (e.g., Corti et al., 2019; Wang and Miller, 2020; Warlo et al., 2021) and allows quantification of, among others, mineral composition, mineral association, and grain size distribution. However, similarly X-ray attenuating constituents can make such extrapolation difficult to impossible. Quantitative integration of X-ray CT with automated mineralogy remains challenged by the quality of X-ray CT data segmentation, especially for rocks with low porosity and complex mineralogy (Warlo et al., 2021). GB-SRCT data, with its three signals, can be more accurately compared with elemental analysis techniques such as SEM-EDS or XRF than just absorption data (Figure 4). Such comparison would allow for chemical maps to be co-registered to the DPC and transmission signals thereby improving segmentation and reducing the errors associated with extrapolating global element distribution only on the basis of gray intensity values. Material degradation, especially in the context of rock alteration, can often result in isochemical mineralogical transformations (i.e., implying primary and secondary phases with similar µ values), thus coupling elemental analysis techniques with multimodal GB-SRCT imaging can be highly informative.
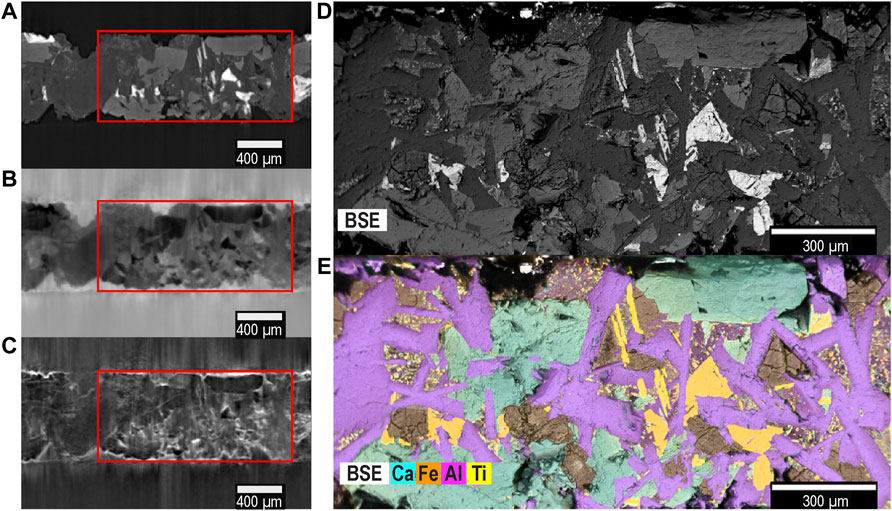
FIGURE 4. The three GB-SRCT signals compared to SEM-BSE micrograph and associated SEM-EDS map. The red boxes correspond to the location of the SEM-BSE micrograph and the SEM-EDS chemical map. (A) Transmission signal; (B) DPC signal; (C) Dark-field signal; (D) SEM-BSE micrograph; (E) false color SEM-EDS map showing the spatial distribution of Ca (cyan), Fe (orange), Al (pink), and Ti (yellow) overlain on the SEM-BSE (white) micrograph.
Partially altered Icelandic basalt was the geomaterial selected for this study, in part because of its high content in plagioclase and clay. Yet many geo- and engineered materials (e.g., cement) are composed of similarly X-ray attenuating constituents, thus limiting the usefulness of absorption-based X-ray CT in the geosciences. Many of the benefits observed when GB-SRCT is used to image hard and soft materials such as laser-welded joints and biological samples are also present when it is used to image a heterogeneous hard material such as basalt (Herzen, 2010). The DPC signal can enhance contrast between similarly X-ray attenuating constituents, while the dark-field signal can be used to examine spatially sub-voxel features such as pores, voids as well as small fractures and cracks. The possibility of applying this technique to other geomaterials or heterogeneous hard materials opens up new possibilities in particular for rock alteration, as well as porous and fractured media studies.
Data Availability Statement
The data supporting the findings of this study are available within the paper and its Supplementary Material. The datasets generated and analysed in this study are available from the corresponding author upon reasonable request.
Author Contributions
RLM and AP conceived and designed the experiment. RLM and BM wrote the manuscript. All authors participated to the experiment and commented on the drafts of the manuscript.
Funding
The research leading to these results has received funding from the People Programme (Marie Curie Actions) of the European Union’s Seventh Framework Programme FP7/2007-2013/ under REA–Grant Agreement No. 608001 ABYSS and the European Union’s Horizon 2020 research and innovation program under Grant No. 764810 S4CE. RLM was also supported by a Deep Life Modelling and Visualisation Fellowship from the Deep Carbon Observatory (Sloan Foundation).
Conflict of Interest
The authors declare that the research was conducted in the absence of any commercial or financial relationships that could be construed as a potential conflict of interest.
Publisher’s Note
All claims expressed in this article are solely those of the authors and do not necessarily represent those of their affiliated organizations, or those of the publisher, the editors and the reviewers. Any product that may be evaluated in this article, or claim that may be made by its manufacturer, is not guaranteed or endorsed by the publisher.
Acknowledgments
We acknowledge the Paul Scherrer Institut, Villigen, Switzerland for provision of synchrotron radiation beamtime at the TOMCAT beamline. We would like to thank our colleagues Aurélien Lecoeuvre (IPGP), Hélène Bouquerel (IPGP), Richard Wessels (Université Pierre-et-Marie-Curie) and Anouk Beniest (Vrije Universiteit Amsterdam) for their help during data acquisition, as well as Arnaud Mazurier (IC2MP) for its support for X-ray CT acquisitions at the Plateforme Caractérisation de Matériaux, Université de Poitiers, France. CarbFix partners and US National Science Foundation are acknowledged for access to the KB-01 core samples of basalt from the Hellisheiði aquifer. This study contributes to the IdEx Université de Paris ANR-18-IDEX-0001.
Supplementary Material
The Supplementary Material for this article can be found online at: https://www.frontiersin.org/articles/10.3389/feart.2022.878738/full#supplementary-material
References
Al-Owihan, H., Al-Wadi, M., Thakur, S., Behbehani, S., Al-Jabari, N., Dernaika, M., et al. (2014). “Advanced Rock Characterization by Dual Energy CT Imaging: A Novel Method in Complex Reservoir Evaluation,” in International Petroleum Technology Conference. doi:10.2523/IPTC-17625-MS
Al-Raoush, R., and Papadopoulos, A. (2010). Representative Elementary Volume Analysis of Porous Media Using X-Ray Computed Tomography. Powder Technol. 200, 69–77. doi:10.1016/j.powtec.2010.02.011
Alfredsson, H. A., Oelkers, E. H., Hardarsson, B. S., Franzson, H., Gunnlaugsson, E., and Gislason, S. R. (2013). The Geology and Water Chemistry of the Hellisheidi, SW-Iceland Carbon Storage Site. Int. J. Greenh. Gas Control 12, 399–418. doi:10.1016/j.ijggc.2012.11.019
Baker, D. R., Mancini, L., Polacci, M., Higgins, M. D., Gualda, G. A. R., Hill, R. J., et al. (2012). An Introduction to the Application of X-Ray Microtomography to the Three-Dimensional Study of Igneous Rocks. Lithos 148, 262–276. doi:10.1016/j.lithos.2012.06.008
Bauer, C., Wagner, R., Orberger, B., Firsching, M., Ennen, A., Garcia Pina, C., et al. (2021). Potential of Dual and Multi Energy XRT and CT Analyses on Iron Formations. Sensors 21, 2455. doi:10.3390/s21072455
Birnbacher, L., Willner, M., Velroyen, A., Marschner, M., Hipp, A., Meiser, J., et al. (2016). Experimental Realisation of High-Sensitivity Laboratory X-Ray Grating-Based Phase-Contrast Computed Tomography. Sci. Rep. 6, 24022. doi:10.1038/srep24022
Boone, M., Dewanckele, J., Boone, M., Cnudde, V., Silversmit, G., Van Ranst, E., et al. (2011). Three-Dimensional Phase Separation and Identification in Granite. Geosphere 7, 79–86. doi:10.1130/GES00562.1
Callow, B., Falcon-Suarez, I., Ahmed, S., and Matter, J. (2018). Assessing the Carbon Sequestration Potential of Basalt Using X-Ray Micro-CT and Rock Mechanics. Int. J. Greenh. Gas Control 70, 146–156. doi:10.1016/j.ijggc.2017.12.008
Chenlu, S., Shinichiro, N., Ryunosuke, K., Hideaki, Y., and Kiyoshi, K. (2021). Short- and Long-Term Observations of Fracture Permeability in Granite by Flow-Through Tests and Comparative Observation by X-Ray CT. Int. J. Geomech. 21, 4021151. doi:10.1061/(ASCE)GM.1943-5622.0002114
Cloetens, P., Barrett, R., Baruchel, J., Guigay, J.-P., and Schlenker, M. (1996). Phase Objects in Synchrotron Radiation Hard X-Ray Imaging. J. Phys. D. Appl. Phys. 29, 133–146. doi:10.1088/0022-3727/29/1/023
Cloetens, P., Ludwig, W., Baruchel, J., Van Dyck, D., Van Landuyt, J., Guigay, J. P., et al. (1999). Holotomography: Quantitative Phase Tomography with Micrometer Resolution Using Hard Synchrotron Radiation X Rays. Appl. Phys. Lett. 75, 2912–2914. doi:10.1063/1.125225
Cnudde, V., and Boone, M. N. (2013). High-Resolution X-Ray Computed Tomography in Geosciences: A Review of the Current Technology and Applications. Earth-Sci. Rev. 123, 1–17. doi:10.1016/j.earscirev.2013.04.003
Cnudde, V., Masschaele, B., Dierick, M., Vlassenbroeck, J., Hoorebeke, L. V., and Jacobs, P. (2006). Recent Progress in X-Ray CT as a Geosciences Tool. Appl. Geochem. 21, 826–832. doi:10.1016/j.apgeochem.2006.02.010
Coenen, J. C. G., and Maas, J. G. (1994). “Material Classification by Dual-Energy Computerised X-Ray Tomography,” in Proceedings International Symposium on Computerized Tomography for Industrial Applications (Berlin, Germany: Deutsche Gesellschaft für Zerstörungsfreie Pröfung e.v.), 120–127.
Corti, L., Zucali, M., Visalli, R., Mancini, L., and Sayab, M. (2019). Integrating X-Ray Computed Tomography with Chemical Imaging to Quantify Mineral Re-Crystallization from Granulite to Eclogite Metamorphism in the Western Italian Alps (Sesia-Lanzo Zone). Front. Earth Sci. 7, 327. doi:10.3389/feart.2019.00327
David, C., Weitkamp, T., Pfeiffer, F., Diaz, A., Bruder, J., Rohbeck, T., et al. (2007). Hard X-Ray Phase Imaging and Tomography Using a Grating Interferometer. Spectrochim. Acta Part B At. Spectrosc. 62, 626–630. doi:10.1016/j.sab.2007.03.001
de Jonge, M. D., and Vogt, S. (2010). Hard X-Ray Fluorescence Tomography-An Emerging Tool for Structural Visualization. Curr. Opin. Struct. Biol. 20, 606–614. doi:10.1016/j.sbi.2010.09.002
De Man, B., Nuyts, J., Dupont, P., Marchal, G., and Suetens, P. (2001). An Iterative Maximum-Likelihood Polychromatic Algorithm for CT. IEEE Trans. Med. Imaging 20, 999–1008. doi:10.1109/42.959297
Deer, W. A., Howie, R. A., and Zussman, J. (2013). An Introduction to the Rock-Forming Minerals. Chantilly, Virginia: The Mineralogical Society.
Egan, C. K., Jacques, S. D. M., Wilson, M. D., Veale, M. C., Seller, P., Beale, A. M., et al. (2015). 3D Chemical Imaging in the Laboratory by Hyperspectral X-Ray Computed Tomography. Sci. .Rep. 5, 15979. doi:10.1038/srep15979
Ghorbani, Y., Becker, M., Petersen, J., Morar, S. H., Mainza, A., and Franzidis, J.-P. (2011). Use of X-Ray Computed Tomography to Investigate Crack Distribution and Mineral Dissemination in Sphalerite Ore Particles. Miner. Eng. 24, 1249–1257. doi:10.1016/j.mineng.2011.04.008
Glatz, G., Lapene, A., Castanier, L. M., and Kovscek, A. R. (2018). An Experimental Platform for Triaxial High-Pressure/High-Temperature Testing of Rocks Using Computed Tomography. Rev. Sci. Instrum. 89, 045101. doi:10.1063/1.5030204
Groso, A., Abela, R., and Stampanoni, M. (2006). Implementation of a Fast Method for High Resolution Phase Contrast Tomography. Opt. Express 14, 8103–8110. doi:10.1364/OE.14.008103
Gualda, G. A. R., Pamukcu, A. S., Claiborne, L. L., and Rivers, M. L. (2010). Quantitative 3D Petrography Using X-Ray Tomography 3: Documenting Accessory Phases with Differential Absorption Tomography. Geosphere 6 (6), 782–792. doi:10.1130/GES00568.1
Herzen, J. (2010). A Grating Interferometer for Materials Science Imaging at a Second-Generation Synchrotron Radiation Source. [PhD Thesis]. Universität Hamburg, Germany: IAEA.
Hubbell, J. H., and Seltzer, S. M. (1995). Tables of X-Ray Mass Attenuation Coefficients and Mass Energy-Absorption Coefficients 1 keV to 20 MeV for Elements Z= 1 to 92 and 48 Additional Substances of Dosimetric Interest. Gaithersburg, Maryland: National Institute of Standards and Technology, Ionizing Radiation Div. doi:10.6028/nist.ir.5632
Iassonov, P., Gebrenegus, T., and Tuller, M. (2009). Segmentation of X-Ray Computed Tomography Images of Porous Materials: A Crucial Step for Characterization and Quantitative Analysis of Pore Structures. Water Resour. Res. 45, W09415. doi:10.1029/2009WR008087
Iovea, M., Oaie, G., Ricman, C., Mateiasi, G., Neagu, M., Szobotka, S., et al. (2009). Dual-Energy X-Ray Computer Axial Tomography and Digital Radiography Investigation of Cores and Other Objects of Geological Interest. Eng. Geol. 103, 119–126. doi:10.1016/j.enggeo.2008.06.018
Ju, Y., Sun, H., Xing, M., Wang, X., and Zheng, J. (2018). Numerical Analysis of the Failure Process of Soil-Rock Mixtures through Computed Tomography and PFC3D Models. Int. J. Coal Sci. Technol. 5, 126–141. doi:10.1007/s40789-018-0194-5
Kerckhofs, G., Schrooten, J., Van Cleynenbreugel, T., Lomov, S. V., and Wevers, M. (2008). Validation of X-Ray Microfocus Computed Tomography as an Imaging Tool for Porous Structures. Rev. Sci. Instrum. 79, 013711. doi:10.1063/1.2838584
Laforce, B., Masschaele, B., Boone, M. N., Schaubroeck, D., Dierick, M., Vekemans, B., et al. (2017). Integrated Three-Dimensional Microanalysis Combining X-Ray Microtomography and X-Ray Fluorescence Methodologies. Anal. Chem. 89, 10617–10624. doi:10.1021/acs.analchem.7b03205
Marone, F., Schlepütz, C. M., Marti, S., Fusseis, F., Velásquez-Parra, A., Griffa, M., et al. (2020). Time Resolved In Situ X-Ray Tomographic Microscopy Unraveling Dynamic Processes in Geologic Systems. Front. Earth Sci. 7, 346. doi:10.3389/feart.2019.00346
Marone, F., Studer, A., Billich, H., Sala, L., and Stampanoni, M. (2017). Towards On-The-Fly Data Post-Processing for Real-Time Tomographic Imaging at TOMCAT. Adv. Struct. Chem. Imag. 3, 1. doi:10.1186/s40679-016-0035-9
McDonald, S. A., Marone, F., Hintermüller, C., Mikuljan, G., David, C., Pfeiffer, F., et al. (2009). Advanced Phase-Contrast Imaging Using a Grating Interferometer. J. Synchrotron Radiat. 16, 562–572. doi:10.1107/S0909049509017920
Naveed, M., Moldrup, P., Arthur, E., Wildenschild, D., Eden, M., Lamandé, M., et al. (2013). Revealing Soil Structure and Functional Macroporosity along a Clay Gradient Using X-Ray Computed Tomography. Soil Sci. Soc. Am. J. 77, 403–411. doi:10.2136/sssaj2012.0134
Paganin, D., Mayo, S. C., Gureyev, T. E., Miller, P. R., and Wilkins, S. W. (2002). Simultaneous Phase and Amplitude Extraction from a Single Defocused Image of a Homogeneous Object. J. Microsc. 206, 33–40. doi:10.1046/j.1365-2818.2002.01010.x
Patera, A., Bonnin, A., Jefimovs, K., Stampanoni, M., Kagias, M., Steigmeier, T., et al. (2017). “DPC2.0: A New Flexible Design for Grating Interferometry at the TOMCAT Beamline of the Swiss Light Source,” in Abstract retrieved from Abstracts in 4th Conference on X-ray and Neutron Phase Imaging with Gratings.
Pfeiffer, F., Bech, M., Bunk, O., Kraft, P., Eikenberry, E. F., Brönnimann, C., et al. (2008). Hard-X-ray Dark-Field Imaging Using a Grating Interferometer. Nat. Mater 7, 134–137. doi:10.1038/nmat2096
Purcell, C., Harbert, W., Soong, Y., McLendon, T. R., Haljasmaa, I. V., McIntyre, D., et al. (2009). Velocity Measurements in Reservoir Rock Samples from the SACROC Unit Using Various Pore Fluids, and Integration into a Seismic Survey Taken before and after a CO2 Sequestration Flood. Energy Procedia 1, 2323–2331. doi:10.1016/j.egypro.2009.01.302
Schindelin, J., Arganda-Carreras, I., Frise, E., Kaynig, V., Longair, M., Pietzsch, T., et al. (2012). Fiji: An Open-Source Platform for Biological-Image Analysis. Nat. Methods 9, 676–682. doi:10.1038/nmeth.2019
Schulz, B., Sandmann, D., and Gilbricht, S. (2020). SEM-Based Automated Mineralogy and its Application in Geo- and Material Sciences. Minerals 10 (11), 1004. doi:10.3390/min10111004
Song, S.-R., Jones, K. W., Lindquist, B. W., Dowd, B. A., and Sahagian, D. L. (2001). Synchrotron X-Ray Computed Microtomography: Studies on Vesiculated Basaltic Rocks. Bull. Volcanol. 63, 252–263. doi:10.1007/s004450100141
Strobl, M. (2014). General Solution for Quantitative Dark-Field Contrast Imaging with Grating Interferometers. Sci. Rep. 4, 7243. doi:10.1038/srep07243
Totten, M. W., Hanan, M. A., Knight, D., and Borges, J. (2002). Characteristics of Mixed-Layer Smectite/Illite Density Separates during Burial Diagenesis. Am. Min. 87 (11-12), 1571–1579. doi:10.2138/am-2002-11-1207
Tsuchiyama, A., Nakano, T., Uesugi, K., Uesugi, M., Takeuchi, A., Suzuki, Y., et al. (2013). Analytical Dual-Energy Microtomography: A New Method for Obtaining Three-Dimensional Mineral Phase Images and its Application to Hayabusa Samples. Geochim. Cosmochim. Acta 116, 5–16. doi:10.1016/j.gca.2012.11.036
Van Geet, M., Swennen, R., and Wevers, M. (2000). Quantitative Analysis of Reservoir Rocks by Microfocus X-Ray Computerised Tomography. Sediment. Geol. 132, 25–36. doi:10.1016/S0037-0738(99)00127-X
Van Geet, M., Swennen, R., and Wevers, M. (2001). Towards 3-D Petrography: Application of Microfocus Computer Tomography in Geological Science. Comput. Geosci. 27, 1–9. doi:10.1016/S0098-3004(00)00154-0
Wang, Y., and Miller, J. D. (2020). Current Developments and Applications of Micro-CT for the 3D Analysis of Multiphase Mineral Systems in Geometallurgy. Earth-Sci. Rev. 211, 103406. doi:10.1016/j.earscirev.2020.103406
Warlo, M., Bark, G., Wanhainen, C., Butcher, A. R., Forsberg, F., Lycksam, H., et al. (2021). Multi-Scale X-Ray Computed Tomography Analysis to Aid Automated Mineralogy in Ore Geology Research. Front. Earth Sci. 9, 789372. doi:10.3389/feart.2021.789372
Weitkamp, T., Diaz, A., David, C., Pfeiffer, F., Stampanoni, M., Cloetens, P., et al. (2005). X-ray Phase Imaging with a Grating Interferometer. Opt. Express 13, 6296–6304. doi:10.1364/OPEX.13.006296
Wildenschild, D., and Sheppard, A. P. (2013). X-ray Imaging and Analysis Techniques for Quantifying Pore-Scale Structure and Processes in Subsurface Porous Medium Systems. Adv. Water Resour. 51, 217–246. doi:10.1016/j.advwatres.2012.07.018
Wilkins, S. W., Gureyev, T. E., Gao, D., Pogany, A., and Stevenson, A. W. (1996). Phase-Contrast Imaging Using Polychromatic Hard X-Rays. Nature 384, 335–338. doi:10.1038/384335a0
Yang, B.-H., Wu, A.-X., Narsilio, G. A., Miao, X.-X., and Wu, S.-Y. (2017). Use of High-Resolution X-Ray Computed Tomography and 3D Image Analysis to Quantify Mineral Dissemination and Pore Space in Oxide Copper Ore Particles. Int. J. Min. Metall. Mat. 24, 965–973. doi:10.1007/s12613-017-1484-4
Keywords: synchrotron radiation, grating-based tomographic microscopy, heterogeneous geomaterials, basalt, improved contrast
Citation: Moore RL, Patera A, Bonnin A and Ménez B (2022) Grating-Based X-Ray Computed Tomography for Improved Contrast on a Heterogeneous Geomaterial. Front. Earth Sci. 10:878738. doi: 10.3389/feart.2022.878738
Received: 18 February 2022; Accepted: 26 May 2022;
Published: 06 July 2022.
Edited by:
Duncan Pirrie, University of South Wales, United KingdomCopyright © 2022 Moore, Patera, Bonnin and Ménez. This is an open-access article distributed under the terms of the Creative Commons Attribution License (CC BY). The use, distribution or reproduction in other forums is permitted, provided the original author(s) and the copyright owner(s) are credited and that the original publication in this journal is cited, in accordance with accepted academic practice. No use, distribution or reproduction is permitted which does not comply with these terms.
*Correspondence: Bénédicte Ménez, menez@ipgp.fr