Cirque Floor Altitude of the Gangdise Mountains and its Controlling Factors
- 1College of Geography and Environment, Shandong Normal University, Jinan, China
- 2State Key Laboratory of Loess and Quaternary Geology, Institute of Earth Environment, Chinese Academy of Sciences, Xi′an, China
The cirque floor altitude (CFA) was used to indicate the patterns of paleoprecipitation, paleocloudiness, palaeoglaciation, and paleo-equilibrium line altitude (ELA). However, CFA is also affected by non-climatic factors, which limits its efficacy of being a paleoclimatic indicator. This study focuses on the Gangdise Mountains with an aim to investigate the controlling factors on CFA and test the CFA efficiency as an indicator of paleoclimate. A total of 1652 cirques were identified, and their CFAs were analysed in this study. The results show that the lowest CFA is in the eastern part of the Gangdise Mountains, followed by the western and central parts. This spatial distribution is in contrast with that of precipitation. This means that the development of the cirque is favoured by high precipitation. The high CFA values on southern and western slopes are due to effects of solar radiation and wind. The weak correlation between the cirque height and CFA and their different spatial distributions imply that cirque deepening is not the main factor affecting CFA. Various bedrocks of cirques manifest different CFA values, while the spatial patterns of the CFAs in the western, central and eastern parts can be partly explained by their bedrock types. The CFA values of the Gangdise Mountains are higher than those of the central Tibetan Plateau (TP). The CFA spatial distribution of the central TP is in contrast with that of precipitation, highlighting that precipitation is the primary control of the CFA. The relief and glacier type significantly control the CFAs. These findings lead to the conclusion that CFA is not always an actual indicator of paleoclimate on a large regional scale.
Introduction
Cirque floor altitude (CFA) is the minimum floor altitude or the minimum cirque threshold altitude (Barr and Spagnolo, 2015a). The CFA is regulated by paleoclimate and is believed to serve as a paleoclimatic indicator (Linton, 1959; Davies, 1967; Principato and Lee, 2014). For example, as precipitation controls the glacier development, CFA has been used to reflect paleoprecipitation patterns during the period of glaciations (Peterson and Robinson, 1969; Hassinen, 1998; Principato and Lee, 2014; Barr and Spagnolo, 2015b); aspect-related CFA variations reflect the level of paleocloudiness, as aspect-related solar radiation contrast is greatest under clear skies (i.e., low cloudiness), and thus produces a significant CFA aspect asymmetry (Evans, 2006); the glacial asymmetry decreases as the glacial coverage increases (Evans, 1977), therefore, aspect-related CFA variations indicate the extent of paleoglaciation (Barr and Spagnolo, 2015a). The CFA has also been used as an indicator for paleo-equilibrium line altitude (ELA) and can indicate the characteristics of the paleoclimate (e.g., Porter, 1964; Williams, 1975; Porter, 1989; Pelto, 1992). As 1) cirque has developed over several glacial-interglacial cycles and 2) determining the age of a cirque is a challenge (Barr and Spagnolo, 2015a), it is difficult to assign CFA values to any specific period (Principato and Lee, 2014). As a result, the CFA can be used as the ‘paleo-ELA composite’ produced by several glacial cycles (Flint, 1957; Porter, 1964; Barr and Spagnolo, 2015a). However, 1) CFA is also ruled by non-climatic factors, e.g., geology and topography (Barr and Spagnolo, 2015a), and 2) different climates may play different roles in CFA, as a comparison of cirques in the Gangdise Mountains and the central Tibetan Plateau (TP) revealed that a reinforced monsoon promotes the expansion of cirques, but also limits their enlargement when the strength of the monsoon exceeds a certain range (Zhang et al., 2021). One possible reason for this is that a strong monsoon promotes cirque-type glaciers change to valley-type glaciers (Zhang et al., 2021). This process leads to glacial erosion focusing downvalley beyond the cirque boundary and makes the glacial ELA lower than the CFA (Barr and Spagnolo, 2015a). These findings imply that in some cases, the CFA may not adequately indicate the information on paleoclimate. A study in the Kamchatka Peninsula disclosed that moisture level is the main control on CFAs, whilst the effects of non-climatic factors (e.g., aspect, topography, geology and neo-tectonics) are limited (but not insignificant) (Barr and Spagnolo, 2015b). The Kamchatka Peninsula is located in the Northwest Pacific Ocean and is dominated by the Siberian High in winter and the North Pacific High in summer. Ocean humidity plays an important role in cirques on the Kamchatka Peninsula (Barr and Spagnolo, 2015b). No such studies have been conducted in other regions, so it is unclear whether CFA is an appropriate paleoclimatic indicator in a different climate. This research focuses on the CFA patterns in the Gangdise Mountains. The eastern and central parts of the Gangdise Mountains are dominated by the Indian summer monsoon (ISM) whereas the continental climate is dominant in the western part (Figure 1, Section 2), which is different from the one on the Kamchatka Peninsula (Barr and Spagnolo, 2015b). The purpose of this study is to 1) analyse the CFA controlling factors in the Gangdise Mountains; and 2) test the efficiency of CFA as an indicator of paleoclimate by comparing our results with those of the central TP.
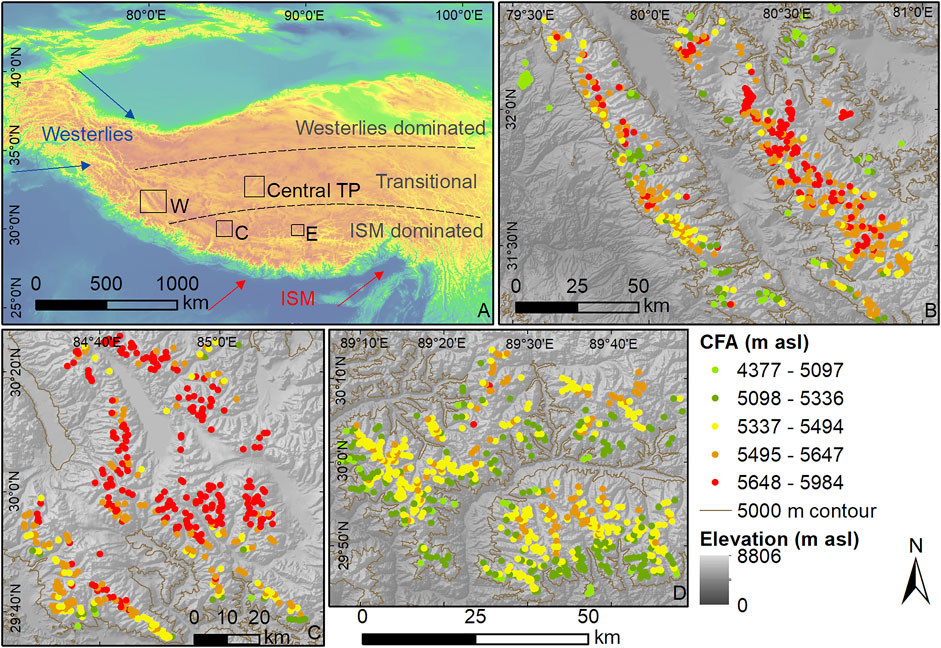
FIGURE 1. Map of the study area: (A) Atmospheric circulations domains of the eastern (E), central (C) and, western (W) parts of the Gangdise Mountains (Thompson et al., 2018; Zhang et al., 2020), and the central Tibetan Plateau (TP) (Zhang et al., 2021); and (B) Cirque floor altitudes (CFAs) in the Gangdise Mountains’ western, central (C), and eastern (D) parts.
Study Area
The Gangdise Mountains are situated in the south of the TP (Figure 1), extending ∼1200 km from NW to SE. They are one of the earliest locations on the TP to reach the cryosphere, having been raised to 3000–4000 m above sea level (asl) by Late Cretaceous (Liu et al., 2016). There are currently 4188 modern glaciers in the Gangdise Mountains, the majority of which are cirque/hanging glaciers (accounting for 67.9%) (Zhang et al., 2018). From the eastern and southern parts (∼5670–5880 m asl) to the central and northwest parts (>5950 m asl), modern ELA increases (Zhang et al., 2018). A total of 1,652 cirques in the western, central and eastern parts of the Gangdise Mountains were considered in the study. The ISM, which originates in the Bay of Bengal, dominates the central and eastern parts of the Gangdise Mountains (Figure 1). The transition zone between the ISM and the Westerlies is where the western part is located. The monsoonal moisture that reaches the Gangdise Mountains is limited due to the rain shadow effect of the Himalayas Mountains. In the Gangdise Mountains, the temperature is lowest in the central part and increases in the eastern and western parts (Figures 2A–C). The reason for this phenomenon is the highest elevation of the central part (Table 1) and the difficulty of the Indian monsoon zone of influence reaching the central part. Whilst the annual precipitation decreases from the eastern part (∼233–413 mm) to the central (∼136–305 mm) and western parts (∼84–833 mm) (Figures 2D–F).
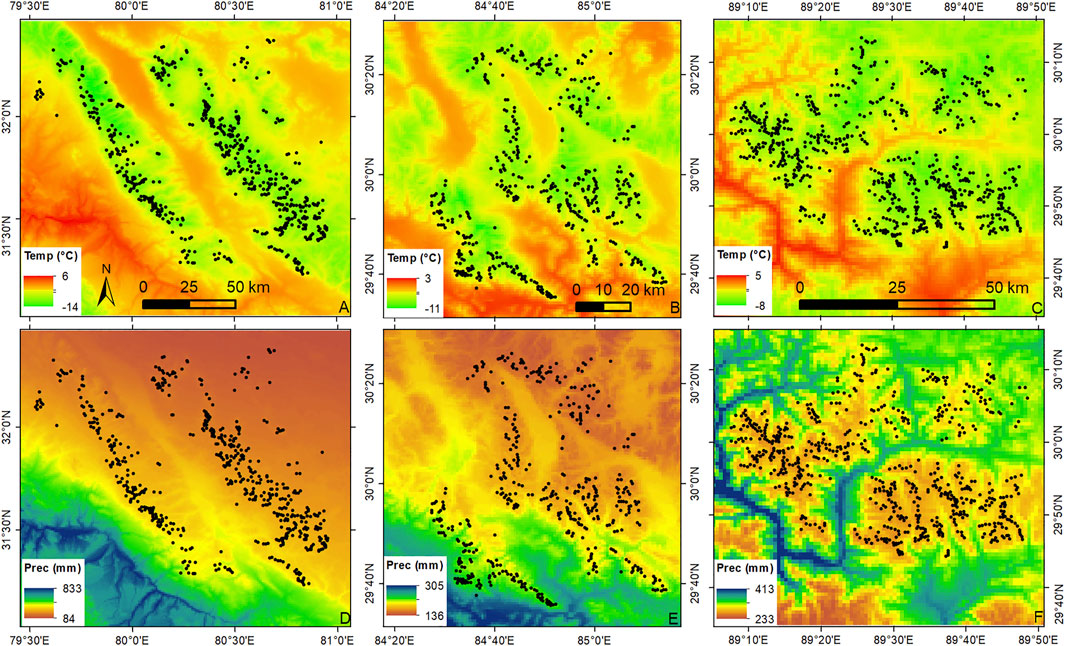
FIGURE 2. Annual temperatures and precipitations in the Gangdise Mountains’ western (A,D), central (B,E) and eastern (C,F) parts. Cirque locations are shown by black dots. Data from https://www.worldclim.org/data/worldclim21.html (Fick et al., 2017)
Zhang et al. (2020) looked at 1652 ice-free cirques in the western, central, and eastern parts of the Gangdise Mountains. The study noticed that moisture promoted glaciers change to valley-type glaciers and limited cirque enlargement. The cirque growth is also influenced by the non-climatic elements, such as slope, aspect, lithology and mountain orientation.
Data and Methods
In this study, the cirque floor is defined as the basin within the cirque with a slope of ≤27° (Evans and Cox, 1974). Due to the existence of sediments in cirques, extracting the CFAs (m asl) directly from the digital elevation model (DEM) may lead to overestimations (Barr and Spagnolo, 2015a). As a result, the CFA in this study was defined as the cirque floor’s minimal altitude. The dataset of Zhang et al. (2020) obtained cirque height (the difference between the highest and lowest elevation of the cirque; H in m), mean altitude (Zmean; in m asl), profile closure (the difference between max and min slopes that can explain the development degree of the cirque; in °) and mean aspect. The global digital elevation model (GDEM) v2 (∼30 m grid; https://www.usgs.gov/) of the Advanced Spaceborne Thermal Emission and Reflection Radiometer (ASTER) was used for all calculations.
On the basis of downscaled 30-s temperature and precipitation data (Fick et al., 2017; https://www.worldclim.org/data/worldclim21.html), the climatic controls on the CFA were investigated (Figure 2). Zhang et al. (2020) classified fifteen forms of bedrock types, while the effect of lithology on CFA was analysed using the Welch’s test, a reliable alternative to the traditional analysis of variance (ANOVA) (Reed and Stark, 1988). In this study, the Welch’s test was used to analyse the effect of lithology on CFA.
Results
The elevation of the CFA varies from 4377 to 5984 m asl (mean is 5485 m asl). The CFAs range from 4377 to 5890 m asl (mean is 5509 m asl), 4829 to 5984 m asl (mean is 5613 m asl) and 4827 to 5658 m asl (mean is 5372 m asl) for the western, central and eastern parts of the Gangdise Mountains, respectively (Figure 1 and Table 1).
Cirque Floor Altitude Variations With Temperature and Precipitation
The highest CFA values are found in the central part of the Gangdise Mountains, where both temperature and precipitation are low. CFA values decrease further westward and eastward, but temperature and precipitation increase (Figures 2, 3). The topography of the western part is defined by a low feature surrounded by two high mountain ranges from northwest to southeast. The southernmost part of the western Gangdise Mountains, as well as the low altitudes in the midst of the two mountain ranges, has low CFA values (Figure 1B). Their spatial distribution corresponds to a relatively high degree of precipitation. The north-eastern region of the western Gangdise Mountains has a number of low CFA values. These figures coincide with high temperatures. In the central part, low CFA values in the southernmost area coincide with high temperature and precipitation. High CFA values are generally located along the ridgeline of the mountain ranges, where low temperature and low precipitation dominate. In the eastern part, high CFA values are present along the mountain ridges and these places are characterised by low temperatures and low precipitations (Figures 2D–F and Figure 3).

FIGURE 3. Maps showing the western CFA (A), central CFA (B) and eastern CFA (C) using a standard kriging interpolation.
Cirque Floor Altitude Variations With Location and Topography
CFAs are highest in the central Gangdise Mountains and decline eastward and westward. CFAs peak at ∼80.4°E, ∼84.8°E and ∼89.5°E in the three parts (Figure 4A). The CFAs of the cirques in the western and central parts decrease to the north and south, with peaks at ∼31.7°N and ∼30.1°N (Figure 4B), respectively. CFAs in the eastern part tend to increase northward. Regression models can be used to describe these spatial tendencies (p < 0.01; Figure 4 and Table 2).
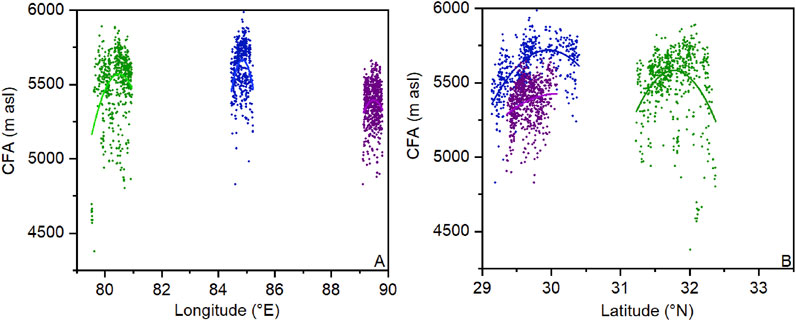
FIGURE 4. Scatter plots of longitude (A) and latitude (B) and CFA. Green, blue and purple represent the western, central and eastern parts of the Gangdise Mountains, respectively.

TABLE 2. The CFA variations against latitude (ϕ; °) and longitude (λ; °) in the western, central, and eastern parts of the Gangdise Mountains.
Regardless of the western, central and eastern parts, CFA is negatively correlated with cirque height. The eastern part (r = −0.55, p < 0.05) has the strongest correlation, followed by the central part (r = −0.54, p < 0.05) and the western part (r = −0.28, p < 0.05) (Table 3). CFA and cirque mean elevation have a substantial positive correlation (r = 0.96, p < 0.05) (Table 3). In the western Gangdise Mountains, profile closure is positively connected with CFA (r = 0.26, p < 0.05), whereas in the central part, profile closure is negatively correlated with CFA (r = −0.16, p < 0.05). Profile closure has no association with CFA in the eastern part (r = 0.002, p > 0.05) (Table 3).
The CFA is lowest when facing north (mean is 5429 m asl), and the highest when facing southeast (mean is 5518 m asl) (Figure 5A), considering the complete dataset. In the western part of the Gangdise Mountains, the CFA is the highest when the aspect is southwest (mean is 5574 m asl) and lowest when the aspect is south (mean is 5452 m asl) (Figure 5B). In the W-E direction, the CFA on the eastern slope is higher than that on the western slope. The cirques facing E have the highest CFA values (mean is 5649 m asl) in the central part, while those facing SW have the lowest values (mean is 5531 m asl). In the central part, those facing S have higher CFA values than those facing N and those facing E have higher CFA values than those facing W (Figure 5C). The CFA of the north slope is the lowest in the eastern part (mean is 5326 m asl), followed by the northwest aspect (mean is 5327 m asl), while the southeast aspect is the highest (mean 5426 m asl), and the CFA is much higher on the south slope than it is on the north slope (Figure 5D).
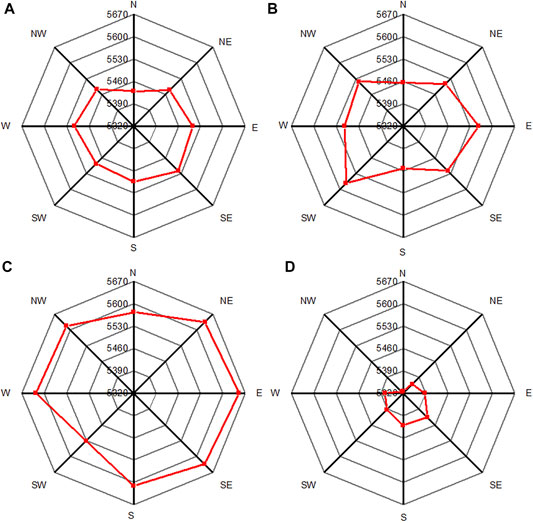
FIGURE 5. Cirque aspects for (A) the entire dataset, (B) the western (n = 562), (C) central (n = 454) and (D) eastern (n = 636) parts of the Gangdise Mountains.
Cirque Floor Altitude Variations With Bedrock Types
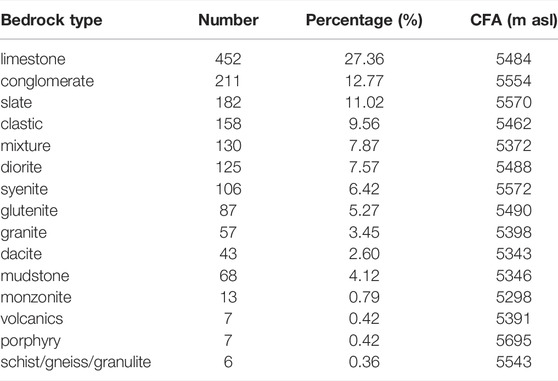
Fifteen bedrock sets have been identified. The CFA Welch statistic between bedrock types is 27.827 (p = 0.000), indicating that the CFA differences among various bedrock types are statistically significant. The cirques on porphyry have the highest CFA (mean is 5695 m asl) in the Gangdise Mountains, followed by those on syenite (mean is 5572 m asl) and slate (mean is 5570 m asl). The lowest CFA is found in monzonite cirques (mean is 5298 m asl), followed by cirques on dacite (mean is 5343 m asl) and mudstone (mean is 5346 m asl) (Table 4).
Discussion
Climatic Controls on CFAs
A previous study demonstrated that CFA is substantially governed by the regional or climatic snow line and entirely influenced by the climatic gradient (Peterson and Robinson, 1969). The low CFA in the eastern part of the Gangdise Mountains is due to the relatively high precipitation of the ISM, compared to the central and western parts. Zhang et al. (2018) discovered this feature while researching glacier changes in the Gangdise Mountains since the Little Ice Age. The low CFA near the valley in the eastern part may be attributed to the abundance of water vapor (Figure 1B). Nonetheless, the ISM diminishes as it reaches the central part, resulting in a higher CFA value. More precipitation in the southwest of the western part of the Gangdise Mountains may be related to a few valleys and low passes in the Himalayas south of the Gangdise Mountains, allowing monsoonal moisture to reach the west of the Gangdise Mountains (Zhang et al., 2018, 2020). This leads to lower CFA values in several regions in the west. The high temperature usually does not support the extension of glaciers or cirques to low altitudes. Low CFAs, however, seem to occur at higher temperatures, according to this study. For instance, the eastern part of the Gangdise Mountains is warmer than the central and western parts, and its CFAs are lower (Figures 2, 3). Low CFAs are also associated with relatively high temperatures in the north-east of the western part and the southernmost point of the central part (Figures 1, 2). One argument for this is that low altitudes result in high temperatures, which coincides with low CFA. Another explanation is that high temperatures intensify freeze-thaw, and cirque is eroded to accelerate development, leading to low CFA.
Cirque aspect can influence the amount of precipitation and solar radiation received at the surface of the glacier (Qureshi et al., 2017; Zhang et al., 2018). The higher CFAs for the S-facing cirques in the Gangdise Mountains may be due to their elevated solar radiation. The CFA is higher on the eastern slope than on the western slope in the western and central parts. Moreover, in the eastern part, the CFA on the southeast slope is significantly higher than on the northwest slope. Because snow on the windward slope can be moved to the leeward slope, cirques tend to form on the leeward slope (Evans, 1990; Zhang et al., 2020). This is in line with the interpretation of Zhang et al. (2020). The southwest slope has the highest CFA in the western part, which may be due to the combined effect of solar radiation and ISM, which crosses the low valleys and passes of Himalayas Mountains.
Non-climatic Controls on CFAs
The negative correlations between CFA and H suggest that cirque deepening has an impact on CFA value. However, there are two findings that contradict this claim. First, there is a weak relation between CFA and H for the western part cirques (r = −0.28, p < 0.05) (Table 3). This implies that cirque deepening is not a main control on CFAs (at least in the western part). The average cirque H in the western and central parts are about identical (367 and 365 m, respectively), while the eastern part has a small cirque H (330 m) (Zhang et al., 2020). However, the central part has the highest CFA values, followed by the western and eastern parts (Table 1). The spatial patterns of cirque H and CFA are different, implying that cirque deepening may not be significantly determining the CFA pattern.
The effect of slope gradient on glacier dynamics may vary due to distinct glacier evolution (Li et al., 2016). Glaciers with smaller surface slopes were more sensitive to climate change than glaciers with steep slopes according to studies by Oerlemans (1992) and Chinn (1996). Haeberli (1995) and Kirkbride and Winkler (2012), on the other hand, claimed that a steeper slope resulted in a shorter response time. Other studies revealed that there is no link between slope and glacier change (Granshaw and Fountain, 2006; Paul and Andreassen, 2009). In this study, the impact of profile closure (i.e., slope gradient) on CFA varied in the eastern, central and western parts, indicating that profile closure is not the primary factor affecting CFA.
The bedrock types of cirques are mainly slate (n = 158), clastic (n = 115), syenite (n = 99) and diorite (n = 92) in the western Gangdise Mountains. The primary rock types in the central part are conglomerate (n = 145), limestone (n = 143) and glutenite (n = 72), whereas the central and western parts are predominantly “hard” rocks. Limestone (n = 309), mixed rock (n = 80), mudstone (n = 50) and conglomerate (n = 50), as relatively “soft” rocks, prevail in the eastern part (Table 5). Soft bedrock is more prone to erosion than hard bedrock in general. Softer bedrock of the eastern part is one of the reasons for the lower CFA than on the central and western parts. In contrast, the lowest CFA occurs in monzonite and dacite, which are rather “hard” rocks. This means that combination of lithological and non-lithological factors influences CFA.
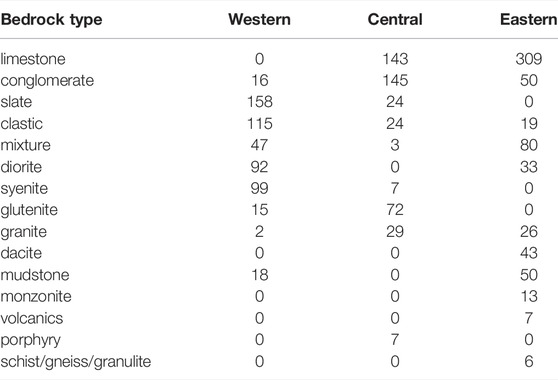
TABLE 5. Statistics of cirque bedrock types in the western, central, and eastern parts of the Gangdise Mountains.
The Efficacy of Cirque Floor Altitude as a Paleoclimatic Indicator by a Comparison With the Cirque Floor Altitude of the Central Tibetan Plateau
The central TP is located in the climatic transitional region, and its climate type is similar to that of the western Gangdise Mountains. A total of 70 cirques in the central TP were mapped and analysed by Zhang et al. (2021). They found that the CFAs of the central TP range from 4803 to 5742 m asl, with a mean value of 5352 m asl. In the central TP, the mean value of CFAs is lower than that of the Gangdise Mountains, but its standard deviation is higher (231.206 vs. 204.86), indicating that the CFAs of central TP have a wider range. The CFAs of the central TP are declining from northwest to southeast, contrary to the spatial distribution of precipitation (Zhang et al., 2021). This is in line with the finding of the Gangdise Mountains. It was argued by Barr and Spagnolo (2015a) that regional variations of CFA can represent the paleo-precipitation levels from previous glacial periods. The distribution of CFA is highest in the central part of the Gangdise Mountains, second in the western part and lowest in the eastern part (Table 1), which could reflect the fact that former precipitation was the highest in the eastern part, second in the western part, and lowest in the central part. Paleoclimate reconstructed by Zhang et al. (2021) in the central TP shows that the precipitation of the Last Glacial period decreased from southeast to the northwest. This suggests that CFA can represent the paleo-precipitation levels throughout previous glacial times. However, non-climatic elements (crest altitude, lithology, etc.) also have an impact on CFA. For example, CFA has a strong correlation with crest altitude (r = 0.86, p < 0.05) (Zhang et al., 2021). This indicates that CFA cannot adequately represent the precipitation of former glacial periods in some cases. In both regions, the CFA of the southern slope is higher than that of the northern slope, indicating that the aspect has a considerable effect on CFA, regardless of their climate. The asymmetry of the cirque aspect can reflect the information of paleo-cloud cover (Barr and Spagnolo, 2015a). There are significant differences in the presence of CFA on different aspects in the Gangdise Mountains (Figure 5), indicating that there was less cloud cover during the former glacial periods. This is consistent with the findings of Zhang et al. (2020). The CFA is highest in SE and lowest in SW in the central TP, reflecting the asymmetry of the aspect and indicating that the central TP was sunny during the former glacial periods. This means that the CFA could provide information on paleo-cloud cover. Monsoons, on the other hand, can have a variety of effects on CFA. ISM comes from southeastern slope to northwestern slope in the Gangdise Mountains, resulting in lower CFA on the northwestern slope (Figure 1). This demonstrates that the CFA does not always accurately reflect the paleo-cloud cover. Different bedrock types also have similar impacts on CFA in both regions, i.e., ‘softer’ rocks are more favourable to CFA growth, but their effect on CFA is limited. Cirque height and CFA did not have a significant correlation in the central TP (r = 0.017, p > 0.05), which supports this study’s conclusion that cirque deepening is not a main control on CFA. Despite the fact that the western Gangdise Mountains and the central TP have a continental climate, their mean CFA differs by 218 m (5570 m asl vs. 5352 m asl). The eastern part of the Gangdise Mountains, on the contrary, has a similar mean CFA to the central TP (5389 m asl vs. 5352 m asl), while having a greater average temperature and annual precipitation than the central TP. As a result, CFA is also determined by local factors and may not always reflect regional climatic patterns, which controls the patterns of ELAs. This implies that the CFAs are not always appropriate for usage as ELAs. We propose three possible explanations for this: 1) CFAs are strongly correlated to crest altitudes in the Gangdise Mountains and the central TP, which indicates that CFA is heavily influenced by its relief. Relatively low relief, with altitudes ranging from 4400 to 6200 m asl, is typical for the central TP (Zhang et al., 2021), but the Gangdise Mountains reach up to ∼7000 m asl. Since cirques tend to form near the summits, the CFAs of Gangdise Mountains are higher than those of central TP. This has no relations with the climate; 2) Cirque formation occurred during the times when cirque-type glaciers were present (Barr and Spagnolo, 2015a). Glaciers may extend beyond cirque boundaries in a cold and wet climate. As a result of this process, the ELAs of glaciers are reduced, but cirque development is restricted (and thus lowers the CFAs). In this circumstance, CFA is not an adequate indicator of ELA; and 3) Cirques formed during several glacial eras of the Quaternary (Flint, 1957; Porter, 1964). The CFAs of different regions do not reflect the glacial patterns of the same period; hence they should be considered with caution when indicating paleoclimate on a regional scale.
Conclusion
To explore the patterns of CFA and its regulating factors, we looked at 1652 cirques in the Gangdise Mountains and extracted their CFA. The CFAs are highest in the central part of the Gangdise Mountains, followed by the western and eastern parts, which is in contrast with the spatial distribution of precipitation. This implies that precipitation stimulates cirque development. The presence of high CFA values on southern and western slopes is due to the effect of solar radiation and wind. Cirque H and CFA have weak correlations, and their spatial distributions differ, implying that cirque deepening is not a main factor affecting CFA. The correlations between cirque profile closure (slope gradient) and CFA in the western, central, and eastern parts show different characteristics, which implies that the effect of slope gradient on cirque development is controlled by the local topoclimatic factors. Cirques tend to develop on soft bedrocks, and the spatial patterns of CFAs in the western, central and eastern parts can be partly explained by their bedrock types. However, this effect may be limited because the low CFA values are from the cirques developed on relatively hard bedrocks. The CFA values of the Gangdise Mountains are higher than those of the central TP. In these two regions, the spatial distribution of CFAs is in contrast to precipitation. This emphasises the fact that precipitation is a main control on CFA. Relief and glacier type also have a significant impact on CFA. Because of these factors, the CFA is not necessarily a reliable indicator for paleoclimate on a large regional scale.
Data Availability Statement
The original contributions presented in the study are included in the article, further inquiries can be directed to the corresponding author.
Author Contributions
JD: study design, data preparing and analysis, writing—original draft, writing—revision and editing; JM: data analysis, writing—revision and editing; QZ: study design, data preparing and analysis, supervision, writing—original draft.
Conflict of Interest
The authors declare that the research was conducted in the absence of any commercial or financial relationships that could be construed as a potential conflict of interest.
The handling editor DC declared a past co-authorship with the author QZ.
Publisher’s Note
All claims expressed in this article are solely those of the authors and do not necessarily represent those of their affiliated organizations, or those of the publisher, the editors and the reviewers. Any product that may be evaluated in this article, or claim that may be made by its manufacturer, is not guaranteed or endorsed by the publisher.
Acknowledgments
This study was funded by the National Natural Science Foundation of China (Grant No. 41901003), the State Key Laboratory of Loess and Quaternary Geology, Institute of Earth Environment, Chinese Academy of Sciences (Grant No. SKLLQG2038) and the Project for Outstanding Youth Innovation Team in the Universities of Shandong Province (Grant No. 2019KJH011). We thank the editor and the reviewers for their editing and constructive comments.
References
Barr, I. D., and Spagnolo, M. (2015a). Glacial Cirques as Palaeoenvironmental Indicators: Their Potential and Limitations. Earth-Science Rev. 151, 48–78. doi:10.1016/j.earscirev.2015.10.004
Barr, I. D., and Spagnolo, M. (2015b). Understanding Controls on Cirque Floor Altitudes: Insights from Kamchatka. Geomorphology 248, 1–13. doi:10.1016/j.geomorph.2015.07.004
Chinn, T. J. (1996). New Zealand Glacier Responses to Climate Change of the Past Century. N. Z. J. Geol. Geophys. 39, 415–428. doi:10.1080/00288306.1996.9514723
Davies, J. L. (1967). “Tasmanian Landforms and Quaternary Climates,” in Landform Studies from Australia and New Guinea. Editors J. N. Jennings, and J. A. Mabbutt (Canberra: Australian National University Press), 1–25.
Evans, I. S. (1990). Climatic Effects on Glacier Distribution across the Southern Coast Mountains. B.C., Canada. A. Glaciol. 14, 58–64. doi:10.1017/s0260305500008272
Evans, I. S., and Cox, N. (1974). Geomorphometry and the Operational Definition of Cirques. Area 6, 150–153.
Evans, I. S. (2006). Local Aspect Asymmetry of Mountain Glaciation: A Global Survey of Consistency of Favoured Directions for Glacier Numbers and Altitudes. Geomorphology 73, 166–184. doi:10.1016/j.geomorph.2005.07.009
Evans, I. S. (1977). World-wide Variations in the Direction and Concentration of Cirque and Glacier Aspects. Geogr. Ann. Ser. A, Phys. Geogr. 59, 151–175. doi:10.1080/04353676.1977.11879949
Fick, S. E., and Hijmans, R. J. (2017). WorldClim 2: New 1-km spatial resolution climate surfaces for global land areas. Int. J. Climatol. 37, 4302–4315.
Granshaw, F. D., and G. Fountain, A. (2006). Glacier Change (1958-1998) in the North Cascades National Park Complex, Washington, USA. J. Glaciol. 52 (177), 251–256. doi:10.3189/172756506781828782
Haeberli, W. (1995). Glacier Fluctuations and Climate Change Detection. Geogr. Fis. Din. Quaternaria 18, 191–199.
Hassinen, S. (1998). A Morpho-Statistical Study of Cirques and Cirque Glaciers in the Senja-Kilpisjärvi Area, Northern Scandinavia. Norsk Geografisk Tidsskrift - Nor. J. Geogr. 52, 27–36. doi:10.1080/00291959808552381
Kirkbride, M. P., and Winkler, S. (2012). Correlation of Late Quaternary Moraines: Impact of Climate Variability, Glacier Response, and Chronological Resolution. Quat. Sci. Rev. 46, 1–29. doi:10.1016/j.quascirev.2012.04.002
Li, Y., Li, Y., Lu, X., and Harbor, J. (2016). Geomorphometric Controls on Mountain Glacier Changes since the Little Ice Age in the Eastern Tien Shan, Central Asia. Ann. Am. Assoc. Geogr. 107, 284–298. doi:10.1080/24694452.2016.1248552
Linton, D. L. (1959). “Morphological Contrasts between Eastern and Western Scotland,” in Geographical Essays in Memory of Alan G. Ogilvie. Nelson. Editors R. Miller, and J. W. Watson (Edinburgh), 16–45.
Liu, X., Xu, Q., and Ding, L. (2016). Differential Surface Uplift: Cenozoic Paleoelevation History of the Tibetan Plateau. Sci. China Earth Sci. 59, 2105–2120. doi:10.1007/s11430-015-5486-y
Oerlemans, J. (1992). Climate Sensitivity of Glaciers in Southern Norway: Application of an Energy-Balance Model to Nigardsbreen, Hellstugubreen and Alfotbreen. J. Glaciol. 38, 223–232. doi:10.3189/s0022143000003634
Paul, F., and Andreassen, L. M. (2009). A New Glacier Inventory for the Svartisen Region, Norway, from Landsat ETM+ Data: Challenges and Change Assessment. J. Glaciol. 55, 607–618. doi:10.3189/002214309789471003
Pelto, M. S. (1992). Equilibrium Line Altitude Variations with Latitude, Today and during the Late Wisconsin. Palaeogeogr. Palaeoclimatol. Palaeoecol. 95, 41–46. doi:10.1016/0031-0182(92)90164-z
Peterson, J. A., and Robinson, G. (1969). Trend Surface Mapping of Cirque Floor Levels. Nature 222, 75–76. doi:10.1038/222075a0
Porter, S. C. (1964). Composite Pleistocene Snow Line of Olympic Mountains and Cascade Range, Washington. Geol. Soc. Am. Bull. 75, 477–482. doi:10.1130/0016-7606(1964)75[477:cpsloo]2.0.co;2
Porter, S. C. (1989). Some Geological Implications of Average Quaternary Glacial Conditions. Quat. Res. 32, 245–261. doi:10.1016/0033-5894(89)90092-6
Principato, S. M., and Lee, J. F. (2014). GIS Analysis of Cirques on Vestfirðir, Northwest Iceland: Implications for Palaeoclimate. Boreas 43, 807–817. doi:10.1111/bor.12075
Qureshi, M. A., Yi, C., Xu, X., and Li, Y. (2017). Glacier Status during the Period 1973-2014 in the Hunza Basin, Western Karakoram. Quat. Int. 444, 125–136. doi:10.1016/j.quaint.2016.08.029
Reed, J. F., and Stark, D. B. 1988. Robust Alternatives to Traditional Analysis of Variance: Welch W∗, James JI∗, James JII∗, Brown-Forsythe BF∗. Comput. methods programs Biomed., 26(3), 233–237.doi:10.1016/0169-2607(88)90003-x
Thompson, L. G., Yao, T., Davis, M. E., Mosley-Thompson, E., Wu, G., Porter, S. E., et al. (2018). Ice Core Records of Climate Variability on the Third Pole with Emphasis on the Guliya Ice Cap, Western Kunlun Mountains. Quatern. Sci. Rev. 188, 1–14.
Williams, L. D. (1975). The Variation of Corrie Elevation and Equilibrium Line Altitude with Aspect in Eastern Baffin Island, N. W. T., Canada. Arct. Alp. Res. 7, 169–181. doi:10.2307/1550319
Zhang, Q., Dong, W., Dou, J., Dong, G., and Zech, R. (2021). Cirques of the Central Tibetan Plateau: Morphology and Controlling Factors. Palaeogeogr. Palaeoclimatol. Palaeoecol., 582, 110656 doi:10.1016/j.palaeo.2021.110656
Zhang, Q., Fu, P., Yi, C., Wang, N., Wang, Y., Capolongo, D., et al. (2020). Palaeoglacial and Palaeoenvironmental Conditions of the Gangdise Mountains, Southern Tibetan Plateau, as Revealed by an Ice-free Cirque Morphology Analysis. Geomorphology 370. doi:10.1016/j.geomorph.2020.107391
Keywords: cirque floor altitude, glaciation, Gangdise Mountains, topography, climate
Citation: Dou J, Mou J and Zhang Q (2022) Cirque Floor Altitude of the Gangdise Mountains and its Controlling Factors. Front. Earth Sci. 10:900141. doi: 10.3389/feart.2022.900141
Received: 20 March 2022; Accepted: 26 April 2022;
Published: 27 May 2022.
Edited by:
Domenico Capolongo, University of Bari Aldo Moro, ItalyCopyright © 2022 Dou, Mou and Zhang. This is an open-access article distributed under the terms of the Creative Commons Attribution License (CC BY). The use, distribution or reproduction in other forums is permitted, provided the original author(s) and the copyright owner(s) are credited and that the original publication in this journal is cited, in accordance with accepted academic practice. No use, distribution or reproduction is permitted which does not comply with these terms.
*Correspondence: Qian Zhang, qian.zhang@sdnu.edu.cn
 Jiahui Dou
 Juan Mou
 Qian Zhang

