Summer Temperature Reconstruction for the Source Area of the Northern Asian Great River Basins, Northern Mongolian Plateau Since 1190 CE and its Linkage With Inner Asian Historical Societal Changes
 Feng Chen
 Youping Chen1
 - 1Yunnan Key Laboratory of International Rivers and Transboundary Eco-Security, Institute of International Rivers and Eco-Security, Yunnan University, Kunming, China
- 2Institute of Desert Meteorology, China Meteorological Administration/Key Laboratory of Tree-ring Physical and Chemical Research of China Meteorological Administration, Urumqi, China
- 3Department of Environmental Science, William Paterson University, Wayne, NJ, United States
- 4Tree-Ring Laboratory, Lamont-Doherty Earth Observatory, Palisades, NY, United States
Mid-to-high latitudes of Asia and its adjacent Arctic area are some of the most sensitive regions to climate warming in Eurasia, but spatio-temporal temperature variation over this region is still limited by a lack of long-term temperature records. Here, June-July temperature reconstructions are developed from a Larix sibirica composite chronology that presents a stable positive linkage with large-scale recorded temperatures and spans 1190–2019 CE for the source area of the Northern Asian great river Basins, northern Mongolian Plateau, Inner Asia. The warmest reconstructed period and low summer sea ice extent in the Arctic Ocean over the past 830 years was estimated to occur in the late twentieth century (1990s–present), with a mean temperature (15.2°C) higher than the long-term mean (13.9°C) of 1190–2019 CE, which is linked with the rapid increase in global temperature. A relationship also exists between the reconstructed temperature and the AMO index, suggesting that the atmospheric patterns over the Arctic and North Atlantic Oceans influence the temperature variations of northern Mongolian Plateau. In addition, we also propose that the warm climate promoted high vegetation productivity and favored the formation of power of the nomadic tribes in the Mongolian Plateau, such as the warm periods 1210s–1250s and 1400s–1430s. Our temperature reconstruction provides us with an opportunity to understand the regional effects of climate warming from multiple perspectives.
Introduction
As the homeland of the nomadic people in Inner Asia, climate change on the Mongolian Plateau has some vital influences on the historical progress in Eurasia and has become an important research topic (Pederson et al., 2014; Büntgen et al., 2016; Hessl et al., 2018). Modern instrumental climate records show that the Mongolian Plateau is undergoing significant climatic shifts (Jiang et al., 2016; Wang et al., 2016; Zhang et al., 2020). Based on tree-ring records, climatic shifts include unprecedented climate warming synchronized with similar temperature increases in Eurasia (D'Arrigo et al., 2001; Davi et al., 2015; Büntgen et al., 2016; Zhang et al., 2020), and wetting-warming trends have been particularly pronounced in the Altai Mountains (Chen et al., 2014; Chen et al., 2016); in contrast, the warm-dry trends are more pronounced in central-southern Mongolian Plateau (Li et al., 2009; Liu et al., 2019; Zhang et al., 2020). How regional climate change will affect large-scale water and energy transports in the future is difficult to forecast, as climate forcings in the Mongolian Plateau are highly complex (Jiang et al., 2016; Hessl et al., 2018). As the Mongolian Plateau is a source area for the great northern Asian rivers, such as the Yenisei, Lena, and Ob rivers, climate change in this area is affected by a variety of climate systems, including the Asian monsoon, Siberian High and mid-latitude westerlies (Iwao and Takahashi, 2006; Wang and Feng, 2013; Luo and Wang, 2019). There is only limited understanding of how climate change in this area will affect the exchange of water and energy in mid- and high-latitude Asia. This lack of understanding is in part due to poor temporal coverage of instrumental data.
Over the past 20 years, the Mongolian Plateau has become a hot spot for tree-ring studies in Asia. A large number of climate and streamflow reconstructions have been established based on tree rings (D'Arrigo et al., 2001; Davi et al., 2010; Myglan et al., 2012; Pederson et al., 2013; Davi et al., 2013; Chen et al., 2014; Davi et al., 2015; Chen et al., 2016) and have provided some valuable information for revealing regional climate change and its influences (Pederson et al., 2014; Büntgen et al., 2016; Hessl et al., 2018). As a wide-spread species in northern and Central Asia, Siberian larch (Larix sibirica) has played an important role in these studies (Hantemirov and Shiyatov, 2002; Briffa et al., 2013; Davi et al., 2015; Büntgen et al., 2016), revealing the relationships between temperature and volcanic and solar activities over the past 1000–2000 years. The upper tree line of this area is covered by widespread larch forests, which have high sensitivity to summer temperature (Chen et al., 2012; Davi et al., 2015). Although the region is an important source region for the major rivers in northern Asia, as mentioned above, there is still a need to better understand the role of regional climate on the hydrothermal interactions in mid- and high-latitude Asia. Meanwhile, tree-ring evidences revealed that extreme climate events in Mongolian Plateau have had some important impacts on the historical process of Eurasia (Pederson et al., 2014; Büntgen et al., 2016; Di Cosmo et al., 2017; Hessl et al., 2018). However, our understanding about the impacts of climate change on the rise and fall of Mongolian Plateau’s nomadic empire is still limited.
Here, we use tree-ring width data from Siberian larch from four sites (Table 1) to create a mean June–July temperature reconstruction for the northern Mongolian Plateau since 1190 CE. Our aim is to develop a composite chronology and subsequent temperature reconstruction that minimizes uncertainty to evaluate large-scale temperature variations in the northern Mongolian Plateau, examine linkages between large-scale atmospheric circulation and reconstructed temperature, and temperature influences on hydrological systems in northern Asia. In particular, we focus on possible impacts of past temperature variation on Inner Asian historical societal changes.
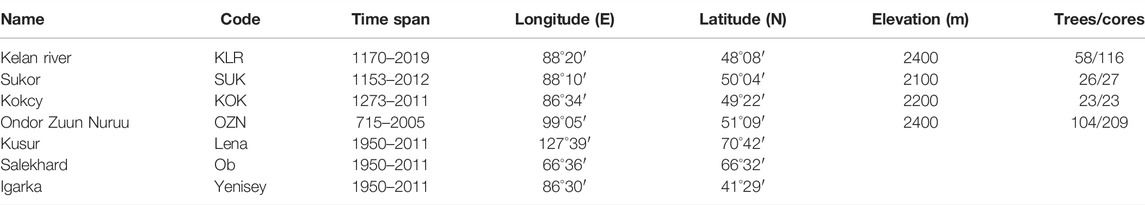
TABLE 1. Information about the sampling sites, meteorological and gauge stations in the northern Mongolian Plateau.
Materials and Methods
Tree-Ring Data and Climate Data
The Kelan River (KLR) Siberian larch (Larix sibirica) tree-ring width data are composed of 116 radii from 58 living trees growing at the sparsely populated rubble pile on either side of the ridge line of the Altay Mountains, China, and span 1170–2019 CE (850 years). This site represents the highest larch treeline in China’s Altay Mountains (Figure 1). Standard dendrochronology techniques were used to develop the cross-dated and tree-ring width chronology (Cook and Kairiukstis, 1990). After air drying, mounting and progressively polishing to >600 grit with abrasive papers, the ring widths of the tree-ring samples from the KLR site were measured to an accuracy of 0.001 mm using a LINTAB measuring system and the cross-dating quality was controlled using the TSAP software package (Rinn 2003). Previous studies have shown that larch tree-ring records from the KOK, SUK, and OZN sites (Table 1) contribute knowledge related to the temperature variations in the northern Mongolian Plateau (Figure 1), including the Altay Mountains (Myglan et al., 2012; Davi et al., 2015). First, each individual tree-ring width series was detrended using the negative exponential curve, and the detrended sequences were combined into two regional chronologies for the Altay Mountains (KLR, KOK, and SUK) and the northern Mongolian Plateau (OZN). All sequences of the four sites (KLR, KOK, SUK, and OZN) were then combined into a new composite chronology (standard version) for regional temperature reconstruction of the northern Mongolian Plateau using the “signal-free” approach (Melvin and Briffa, 2008). By using a signal-free data-adaptive curve-fitting method where the detrending functions subsequently are forced to the same average as the local mean (Björklund et al., 2013), the composite chronology retained the long-term, centennial scale signals in excess of the segment lengths of the individual series as possible while removed non-climate signals.
FIGURE 1. Map of study area showing the locations of the main rivers (Yenisei, Lena and Ob) in norther Asia and the locations of the four tree-ring sampling sites (KLR, KOK, SUK, and OZN). See text for additional details.
The chronology reliability over time was assessed based on the running average correlation between the tree-ring width series (Rbar) and the expressed population signal (EPS) (computed over 50 years lagged by 25 years). The tree-ring width chronologies that started with fewer than 3 trees were truncated to ensure the stability of climate signals. In general, an EPS value greater than or equal to 0.85 is a widely accepted threshold value for an adequate sample depth in reliable tree-ring chronologies, and thus, our composite chronology used in the temperature reconstructions below was truncated at 1190 CE (Figure 2). The common period for the two regional chronologies of the Altay Mountains and the northern Mongolian Plateau (Tree number >4) is 1190–2005 CE. To guarantee the length of the calibration period, the temperature reconstruction sequence is still extended from 2012 to 2019 by using the KLD tree-ring data.
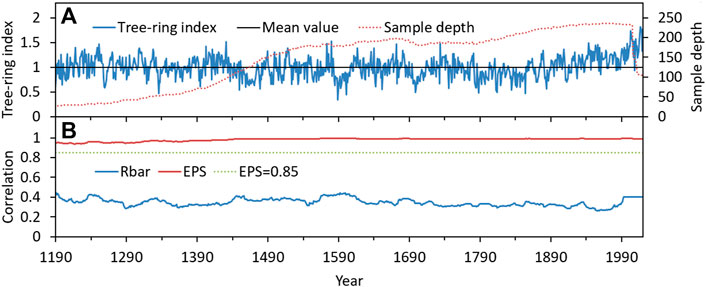
FIGURE 2. Plots of (A) the composite chronology (bule line) and sample depth (red dotted line), and (B) running expressed population signal (EPS, blue line) and Rbar (mean correlation between ring-width series, red line) statistics.
To verify that our composite chronology has large-scale temperature signals, we also used gridded temperature data for the same period in analysis. The monthly temperature data from the Climatic Research Unit (0.5 ° × 0.5 °; Harris et al., 2014) were obtained from the KNMI Climate Explorer (http://climexp.knmi.nl/) for the northern Mongolian Plateau (averaged over 45–55°N, 85–105°E) for the period from 1901 to 2018. At the same time, station temperature records from the Altay city (47°26′ N, 88°03′ E, 735.3 m a.s.l.) were compared herein to the composite chronology (Figure 1). The Altay station data cover the years 1955–2019. Thus, we performed analyses over a 64-year calibration period.
We assessed the strength of the resulting linear regression models based on adjusted r2, F-values and the PRESS statistic (Weisberg, 1985). The temperature reconstruction for the northern Mongolian Plateau was created using the most appropriate model (Cook and Kairiukstis, 1990) from 1955 to 2018. We used a split calibration-verification scheme (Cook and Kairiukstis, 1990) to assess the reliability of the temperature reconstruction, that is, calibration (1955–1986) and verification (1987–2018), as well as calibration (1987–2018) and verification (1955–1986). The test statistics [the coefficient of efficiency (CE), the reduction of error (RE) and the sign test] for the temperature reconstruction are presented in Table 2. Meanwhile, to verify the reliability of the temperature reconstruction, we also correlated the temperature reconstruction with the station data (1955–2019) and CRU data (1901–1954).
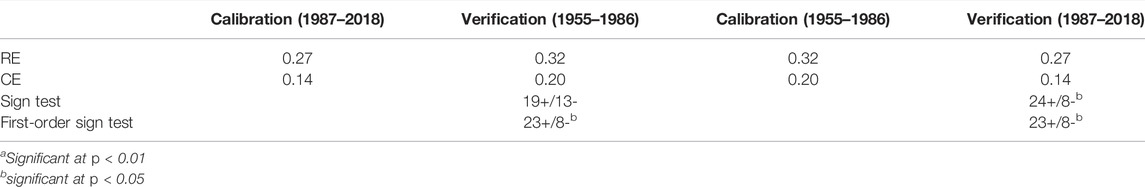
TABLE 2. Calibration and verification statistics for the June-July temperature reconstruction.
To assess the stability of the temperature-tree-growth relationship in terms of the long-term climate, moving correlation calculations were calculated. To further explore the links between our temperature reconstructions and large-scale atmospheric circulations, we also correlated the temperature reconstruction with sea surface temperature (SST) data (1854–2019, Smith and Reynolds, 2005) and their related atmospheric-oceanic circulation patterns, such as the El Niño-Southern Oscillation (ENSO, NINO3.4, 1870–2019, Rayner et al., 2003), Atlantic Multidecadal Oscillation (AMO, 1900–2019, Enfield et al., 2001), sea ice cover (1870–2019, Rayner et al., 2003) and the AMO reconstruction (2017). We used instrumental streamflow data from the Salekhard, Igarka, and Kyusyur stations at the three large river catchments with at least 62 (1950–2011, Supplementary Figure S1), the streamflow data is provided by Global Runoff Data Centre (GRDC, https://www.bafg.de) years of streamflow measurements to reveal the effects of temperature changes in river source areas on the streamflow processes in northern Asia.
Results
Climate Signals in Larch and Temperature Reconstruction
Although the distance between the sampling sites is over 800 km (Figure 1; Table 1), the two regional chronologies from the Altay Mountains and northern Mongolian Plateau are significantly positive correlated (r = 0.42, p< 0.01) over the common period 1190–2005 CE, and this result reflected the similar growth patternsat the upper tree line in this area. Consequently, we combined the detrended series of all cores from the four sites into a composite chronology. Figure 3 shows the response of the radial growth of larch trees in the northern Mongolian Plateau to the mean temperature (CRU) from January to December in terms of Pearson correlation coefficients. Some significant positive correlations with temperatures from June to September were observed, with the strongest correlation appearing in June, which is the warmest season in the region (Figure 3). Similar responses of ring width to June-July temperature of the current growth year were found in larch trees from the northern Mongolian Plateau (Chen et al., 2012; Davi et al., 2015; Büntgen et al., 2016), indicating that warm season temperatures primarily control the radial growth of larch in the northern Mongolian Plateau.
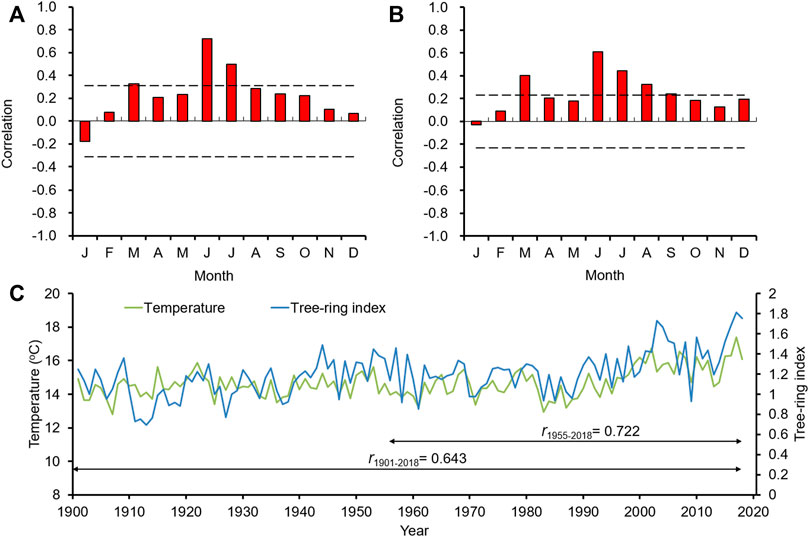
FIGURE 3. Simple correlations of the composite chronology with the monthly CRU mean temperature (A) (1955–2018; (B) (1901–2018) from January to current December. The dash lines indicate significant variables (p < 0.01). (C) CRU mean June–July temperature and the composite chronology during their common period 1901–2018.
After screened the composite chronology in correlation analysis with several seasonal mean temperature subsets from January to December of the current growth year, the highest correlation (r = 0.722, p < 0.01) was found between the composite chronology and mean June–July temperature (CRU) for the gridcells from 45 to 55° N to 85–105° E during the period 1955–2018. The model between the composite chronology and mean June–July temperature for the 1955–2018 calibration period was significant (F = 67.46, p < 0.001, adjusted r2 = 0.513, PRESS = 28.32, Durbin-Watson = 1.463).
The model obtained was:
where Y is mean June–July temperature and X is the composite chronology.
During the period (1955–2018) of the temperature data and tree-ring widths, the temperature reconstruction accounted for 52.1% of the actual temperature variance. As shown in Figure 4, the temperature reconstruction fits very well with the actual temperature series, and the first differences in the tree-ring series can also explain 23.4% of the actual temperature variances. Although the meteorological stations were relatively sparse before 1955, the correlation between the temperature reconstruction and CRU temperature decreased from 1901–1954, the tree-ring series still explained 41.3% of the actual temperature variances from 1901–2018, and at the same time, the correlation between the temperature reconstruction and station temperature records from the Altay city reached 0.54 (p < 0.01) during the period from 1955–2019. Both RE and CE were positive, and the results of the sign tests were significant (p < 0.05), except for the sign test of the original values during the 1955–1986 period (Table 2), and these results demonstrate the validity of the temperature reconstruction model.
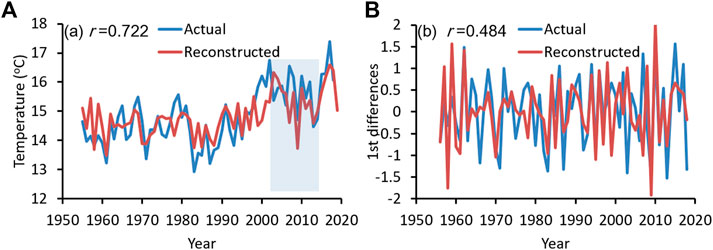
FIGURE 4. (A) Comparison between the acutal and reconstructed mean June–July temperature for the period 1955–2018. (B) Comparison between the first differences of acutal and reconstructed mean June–July temperature for the period 1955–2018. The blue shadow indicates the recent warming hiatus.
Temperature History
Figure 5 shows the reconstructed temperature of the northern Mongolian Plateau for the 1190–2019 period, with its average being 13.9°C cooler than that measured for the 1901–2018 period (14.7°C). The coldest summers are in 1589 (11.8°C) and 1601 (12.2°C), and the warmest summers are in 2017 (16.6°C), 2018 (16.4°C), and 2003 (16.3°C). Evidence of a pronounced Medieval Warm Period (MWP, 1190s–1430s), Little Ice Age (LIA, 1440s–1850s), and modern warm period (1850s–2010s) is revealed by our temperature reconstruction (Mann et al., 2009; Davi et al., 2015). For the MWP, high temperatures in the 1210s–1250s, 1270s–1320s, 1380s, and 1400s–1430s and low temperatures in the 1190s–1200s, 1260s, 1330s–1370s, and 1390s are recorded, with some fluctuations within a narrow range. During the LIA, the temperature reconstruction shows strong downward fluctuations (1440s–1510s, 1580s–1600s, 1680s–1720s, and 1760s–1850s) through a generally cold period from the 1440s–1850s. The temperatures showed a ladder-like, upward trend and discontinuously increased since the 1860s with notable depressions in the 1870s–1890s, 1910s–1920s, and 1960s–1980s. Meanwhile, correlations of this study with Russian Altai and European Alps (Büntgen et al., 2016), computed over the common periods are 0.32 and 0.72, and two remarkably warming episodes (1940s–1950s and 1990s–present) were found in the northern Mongolian Plateau, which resembles other findings in the European Alps and suggests the influence of similar large-scale forcings on the Eurasian climate. Undoubtedly, the last 30 years (1990s–present, 15.2°C) was the warmest period over the past 830 years in the northern Mongolian Plateau, and our temperature reconstruction also captures large-scale temperature signals for Central and northern Asia (Figure 6A).
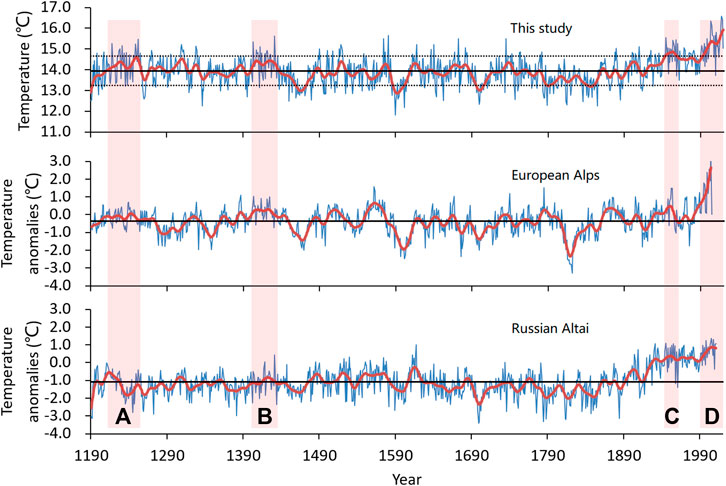
FIGURE 5. Original (Thick) and 20-year low-pass filtered (thin) temperature reconstruction for northern Mongolian Plateau, the European Alps, and Russian Altai. The long-term average of the temperature reconstruction of northern Mongolian Plateau during 1190–2019 CE (13.9°C). The boxes mark important Asian historical landmarks: (A) Mongol conquests (1210s–1250s), (B) The rise of Oirat Mongols (1400s–1430s), (C) the warm period 1940s–1950s and (D) the warm period 1990s–present.
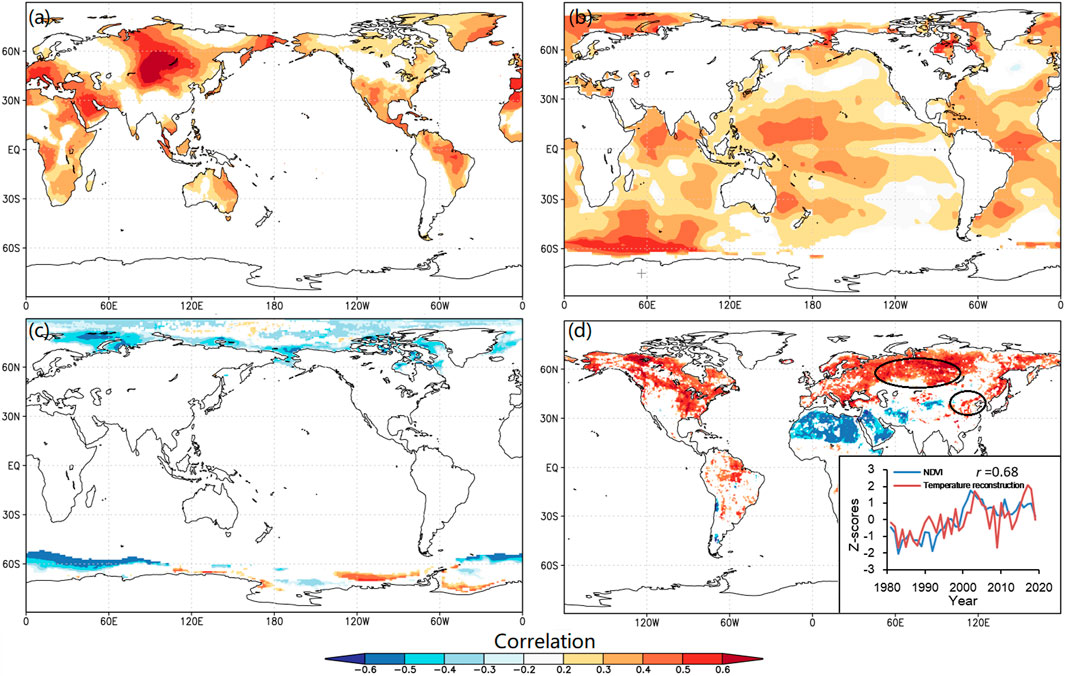
FIGURE 6. Spatial correlation patterns of temperature reconstruction with CRU temperature (A), (1955–2018), SSTs (B), (1854–2019), sea ice (C), 1870–2019) and NDVI (D), 1981–2019) for the common periods. Note that only correlations (p < 0.05) are shown in this figure. Comparison between the Normalized (z-score) NDVI series and the temperature reconstruction is shown in the inside panel of (D).
Spatial correlations of the temperature reconstruction with June-July SSTs (1854–2019) show that positive correlations are located in the North Atlantic and equatorial Indian and Pacific Oceans (Figure 6B), and the trend exhibit good synchronization with the global annual average SSTs during 1870–2000 (Rayner et al., 2003). Significant negative correlations are found with the Hadley Centre sea ice cover (Rayner et al., 2003) in the Arctic Ocean, with the highest correlations occurring on the Arctic coast of northern Asia, especially in the Ob estuary (Figure 6C), and this may means that the recent temperature variability in the study area may have strong associations with unprecedented low summer sea ice extent in the Arctic Ocean (Kinnard et al., 2011).
To reveal the influences of large-scale temperature variations on vegetation productivity change and the water cycle in Central and northern Asia, we analyzed multiple correlations of our temperature reconstruction with various lags of monthly and seasonal combinations of the normalized difference vegetation index (NDVI, Tucker et al., 2005) and streamflow data (Yenisei, Lena and Ob) for the common period. Due to the flat topography and relatively uniform climate in Siberia, our temperature reconstructions are closely related (r = 0.68) to a NDVI field north of approximately 45–70° latitude with a large east-west expansion during the 1981–2019 period (Figure 6D). Meanwhile, the temperature reconstruction is negatively correlated (r = -0.40, p < 0.01) with the July-August streamflow data from the Salekhard, Igarka, and Kyusyur stations during the 1950–2011 period and is positively correlated (r = 0.40, p < 0.01) with streamflow from January-May of the previous year (Figures 7A,B). The temperature reconstruction is positively correlated with the average April-July NINO3.4 (5°N-5°S 170°W-120°W) SST index (r = 0.20, p < 0.05) over the 1870–2019 period, and a significant correlation (r = 0.40, p < 0.01) was found between the temperature reconstruction and previous September-July AMO over the 1900–2019 period (Figures 7C,D). Meanwhile, a strong correlation (r = 0.43, p < 0.01) was also found between the temperature reconstruction and August-April AMO over the 1900–2019 period. Interestingly, most of the cycles fall within the range of AMO variability based on the results of the multi-taper method (MTM) spectral analysis (Figure 8A), and correlation between this study and the AMO reconstruction (Wang et al., 2017), computed over the 1190–2010 common period is 0.30, and increase to 0.58 after 20-yr smoothing, and suggesting strong teleconnections between AMO and the temperature variability in the source area of the Northern Asian great river Basins.

FIGURE 7. Comparison of the temperature reconstruction (thin lines) and its 20-year low-pass filtered values (thick lines) with (A) July-August streamflow, (B) January-May streamflow, (C) April-July NINO3.4 SST index and (D) August-April AMO index.
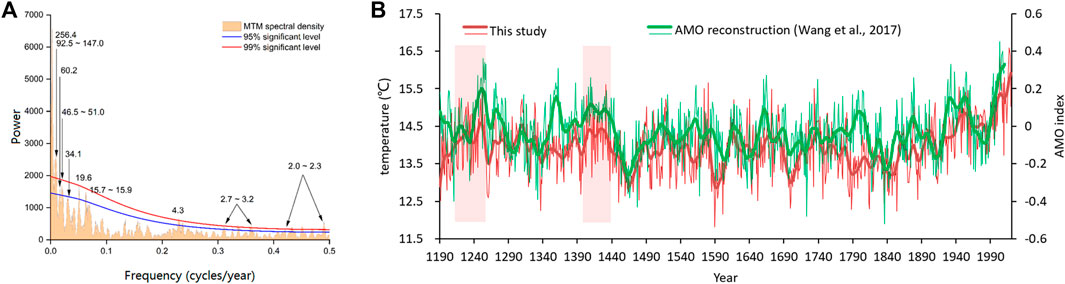
FIGURE 8. (A) Power spectrum of June–July temperature (1190–2019). (B) Comparison between the reconstructed mean June–July temperature and reconstructed AMO (Wang et al., 2017) for the period 1190–2010. The thick lines are the 20-year low-pass filtered values. The boxes mark important Asian historical landmarks: Mongol conquests and the rise of Oirat Mongols.
Testing for Tree-Ring Divergence in the Northern Mongolian Plateau
The earth’s climate is always changing, and the reliability of tree-ring records, especially their ability to record low-frequency signals, has been questioned (Büntgen et al., 2008). Since the 1960s, due to the influence of global warming and its associated regional environmental/climate changes, the temporal stability of the relationship between tree rings and temperature has weakened in some parts of the world (D'Arrigo et al., 2008). Meanwhile, global warming has not shown a linear upward trend, and the recent global warming slowdown, which started after 1997/1998 and has lasted for nearly 15 years related to equatorial Pacific surface cooling (Kosaka and Xie, 2013; Medhaug et al., 2017). Both global warming and warming hiatuses are likely to have had some significant impacts on larch tree growth; however, whether they will have an impact on the stability of the reconstruction is worth further discussion. To investigate the stability of the temperature-growth relationship, a 31-year correlation was observed between the temperature reconstruction and CRU June–July temperatures during the 1901–2018 period (Figure 9A). The correlations throughout the whole period were greater than 0.34 (p < 0.05), and there were relatively high correlations (p < 0.01) with the CRU June–July temperatures in the warm periods 1940s–1950s and 1980s–2010s over the past 80 years (Figure 9A). Meanwhile, no significant correlations between tree-ring series and precipitation were revealed (not shown). The results revealed that old larch trees could effectively record the temperature changes without precipitation restrictions at the upper tree line in the northern Mongolian Plateau. The temperature-sensitive tree-ring width series of larch trees did not continue to increase, and the growth rate slowed during the 2000–2015 period (Figure 4A and Figure 9B), and suggesting a possible connection between regional temperature and the recent global warming hiatus. These results indicate that summer temperature variations over the past 100 years have had some stable positive impacts on the radial growth of larch trees in the northern Mongolian Plateau. Despite this slowdown in growth, the upward trend has not changed and regional temperatures remain significantly warmer.
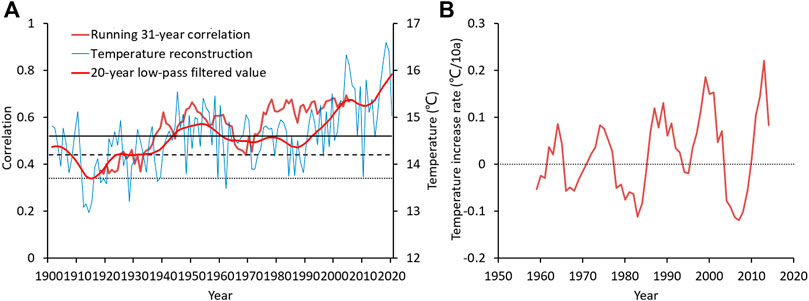
FIGURE 9. (A) Comparison of temperature reconstruction with running 31-year correlation between the composite chronology and CRU June–July temperatures. The dash and dotted lines indicate the 95 and 99% significance level, respectively. (B) The moving ten-years increase rate of temperature reconstruction.
Discussion
Linkages With Water and Atmospheric-Oceanic Circulations
Considering the distance from the ocean and the possibility of being affected by other climatic forcings, the low correlation between the temperature reconstruction and ENSO is not surprising. The eastern equatorial Pacific has some of the warmest SSTs and plays an important role in global temperature change (Kosaka and Xie, 2013; Chen and Jin, 2018; Koutavas, 2018). Although SSTs in this area do not directly affect the temperature of the study area, recent SST fluctuations through global ocean–atmosphere–land processes has shown impacts in this study, and as a result, the temperature reconstruction is synchronized with global warming and the recent warming slowdown. More importantly, climate anomalies in the adjacent Arctic and North Atlantic Oceans will more than likely lead to the unusually high summer temperatures in Eurasia (Serreze and Barry, 2011; Cohen et al., 2014). Although the season of our reconstruction is relatively short, our results indicate that the SSTs in the adjacent Arctic and North Atlantic Oceans have a significant positive effect on summer temperature variations in Eurasia (Figure 6B), and showed that high SSTs that cause high temperature in one year also tend to carry over their effect on the climate of the subsequent cold season. The Atlantic Multidecadal Oscillation (AMO) is defined as the fluctuation pattern of North Atlantic SSTs, and has a 60–80 years cycle (Enfield et al., 2001; Wang et al., 2017; Zhang et al., 2019), and the linkages to the North Atlantic SSTs suggest the connection of regional temperature variations to the large-scale circulations (Figure 7D). Meanwhile, as the AMO has some important influences on the winter and summer monsoon intensity in East Asia, the temperature variations in the northern Mongolian Plateau affect the climate of the whole Eurasian continent through the interaction of water and energy over Asia (Lu et al., 2006; Wang et al., 2017; Nagaraju et al., 2018; Huang et al., 2019; Fang et al., 2019; Monerie et al., 2019). The linkages may suggest a framework for the relationship of the temperature and NDVI anomaly in the northern Mongolian Plateau with the SST anomalies in surrounding oceans and the atmospheric circulation anomalies (Figure 7). During the positive phase of the AMO, the Asian winter monsoon is weakening and warmer over most of the Mongolian Plateau (Wang et al., 2009; Chylek et al., 2014), which reduces the risk of freeze injury and promotes vegetation growth in our study area (Liu et al., 2015; Peng et al., 2020), and while the southern Mongolian Plateau can be affected by the enhanced Asian summer monsoon and lead to the NDVI increase at the northern fringe of the East Asian summer monsoon in China (Wang et al., 2009; Wang et al., 2011), the climate condition has improved, and during the cold phase of the AMO, the opposite pattern occurs.
Eurasia is an important heat source for the Arctic in summer, and the temperature in Eurasia may also have some feedback effects on the Arctic climate change (Matsumura et al., 2014). Studies have shown that rivers flowing into the Arctic Ocean provide warm water that accelerates the rate of sea ice melt (Ekwurzel et al., 2001; Adam and Lettenmaier, 2008; Shu et al., 2017; Lesack et al., 2014). However, unlike glacier-fed rivers, the streamflow of the headwaters area mostly depends on precipitation variation in the study area, including the Yenisei, Lena and Ob rivers (Davi et al., 2013; Chen et al., 2016). In the three great river basins, all of which originate from the northern Mongolian Plateau, the correlation coefficients are greater than 0.73 (Supplementary Figure S1), indicating that there are strong common signals between them. Although the Siberian forests provide a stable supply of water for rivers, streamflow variation is still likely related to precipitation or drought changes (Troy et al., 2012). Therefore, the increase in regional evaporation and the decrease in regional water supply under relatively high temperature conditions (IPCC AR5, 2013; Huang et al., 2016; Zhang et al., 2020) will lead to a decrease in streamflow from the source area of the Northern Asian great river Basins and increase in warm water temperature from Eurasia to the Arctic Ocean (Liu et al., 2005; Georgiadi et al., 2017), and causing the changes in Arctic sea ice melt onset, freezeup, and melt season length (Markus et al., 2009; Nummelin et al., 2016; Lambert et al., 2019). In addition, due to the advance of snowmelt season results from climate warming, the high-level warm water transport from the Eurasian continent during the cold season (January–May) of previous year, which also should provide relatively abundant warm water that will affect the water and energy balance in the Arctic and cause Arctic sea ice anomalies and summer temperatures for the next year (Park et al., 2017; Durocher et al., 2019; Lambert et al., 2019; Park et al., 2020). Seen together, these results suggest significant relationships between the temperature change and the water circulation of Northern Asian great river basins. However, the mechanism how these circulations interact and how they influence on the climate change in the Arctic needs to be further studied, especially for the Arctic sea ice.
Possible Impacts on Regional Environment and Human Activity
In the context of the modern climate, the unprecedented warming may have led to abrupt shift to hotter and drier climate occurred at Mongolian Plateau and a continued increase in evaporation, causing water stress for the vegetation growth during the growing season, and has some serious impacts for Mongolian Plateau’s ecosystems (Hessl et al., 2018; Zhang et al., 2020). Based on observational data and climate reconstructions, the recent 30 years may have been one of the worst drought periods in the Mongolian Plateau in the last century (Li et al., 2009; Davi et al., 2010; Fang et al., 2010; Pederson et al., 2014; Tong et al., 2018; Zhang et al., 2020). According to the climate prediction results, drought in the Mongolian region will intensify under continued warming (Intergovernmental Panel on Climate Change Fifth Assessment Report (IPCC AR5), 2013; Hessl et al., 2018). However, our research showed that the impacts of climate warming on different parts of Mongolian Plateau vary greatly due to complex geographical environment and spatial differences in local temperature and vegetation growth. The climate is relatively humid in the upper treeline of the study area and its northern area, and at high elevation, summer temperature is the dominant growth factor. Under warm climate conditions, tree growth and its related vegetation productivity rapidly increase for the source area of the Northern Asian great river Basins, northern Mongolian Plateau (Figure 6D). In the modern period, Siberia (Russia) and Xinjiang (China) will benefit from increased vegetation production (Yao et al., 2018; Iegorova et al., 2019), whereas Mongolia will be threatened by drought (IPCC AR5; Rao et al., 2015; Hessl et al., 2018). Some studies have indicated that climate change drove the migration of Mongolian Plateau nomads and that the Mongol Empire’s expansion (1219–1260 CE) was based on ample material resources in the longer historical context (Pederson et al., 2014; Büntgen et al., 2016; Ganiev and Kukarskih, 2018). Based on the climate patterns, distribution of the correlations with vegetation productivity and the transfer function between temperature reconstruction and NDVI (Figure 6D), it is possible that one of the targets of the Mongol conquests during the warm period 1210s–1250s (with positive AMO) was to obtain better grassland in northern and eastern Asia, and the increased NDVI (+2.3%) also provided a better material basis for the conquests (Pederson et al., 2014). Similarly, during the warm period 1400s–1430s, with high NDVI (+2.7%) and wet condition (Pederson et al., 2014; Hessl et al., 2018), the Oirat Mongols (leader: Toghon Taishi) completed the unification of the Mongolian Plateau in 1438 CE, and the Oirat Mongols (leader: Esen Taishi) attacked the northern part of the Ming Empire and captured the Zhengtong Emperor during the Tumu crisis (1449 CE) (Mote, 1998; Harris, 2015) (Figure 8). With the onset of the Little Ice Age, Mongolian Plateau was once again divided, and no strong unified regime has ever been established in the region.
The AMO-dominated framework shown earlier probably played an important role in these historical processes. However, our study reveals a positive contribution of climate warming to the vegetation productivity in northern Mongolian Plateau, we also should recognize that the impact of this unprecedented warming on the ecosystem is highly uncertain (Hessl et al., 2018; Zhang et al., 2020), and this unprecedented temperature and high evaporation in the study area and its northern area also may lead to reduced tree growth and transboundary river runoff significantly when climate warm beyond a physiological threshold, causing irreversible damage to the ecosystem. More importantly, as the melting of Arctic sea ice accelerates under unprecedented warming conditions, it could make Arctic shipping lanes possible and lengthen the sailing time, making it easier to transport material and energy across northern Asia (Khon et al., 2010; Stroeve et al., 2012; Aksenov et al., 2017). As can be seen above, the effects of climate change are not limited by national boundaries, we must therefore strengthen international collaboration to address climate change.
Conclusion
We have shown the June-July temperature variations for the northern Mongolian Plateau since 1190 CE based on tree-ring width data of larch trees. The final reconstruction indicates relatively warm summers in the 13–14th and twentieth centuries divided by prolonged cooling from the 1440s–1850s. The warmest period occurred during the late 20th century and early 21st century. Temperature reconstruction is negatively correlated with streamflow and Arctic sea ice, meaning that during warmer summers, low streamflow tends to occur over northern Asia. Some links between AMO and northern Asian temperature are also revealed. More studies are needed to better understand the feedback of temperature in the hinterland of Eurasia to large-scale oceanic and atmospheric circulations and the impacts of climate change on water systems. Grasslands with higher vegetation productivity under the consistently warm and wet conditions attracted nomads and strengthened the power of Inner Asian steppe empires.
Given the rapid warming of Northern Eurasia over the past 40 years, a more comprehensive picture of past and potential climate change impacts is essential for developing appropriate risk management strategies. At present, there is great uncertainty in the prediction of temperature changes in Northeast Asia. According to the results of the climate observations (Intergovernmental Panel on Climate Change Fifth Assessment Report (IPCC AR5), 2013), the temperature in the Arctic region is rising. Understanding of the climate dynamics of Northern and Central Asia has been limited, in part because of the lack of instrumental records and the complexity of the climatic change in the region and because it is difficult to describe the effects and feedbacks of many possible forcing effects. The temperature reconstruction described here, combined with existing instrumental climate and hydrographic data, provides an important tool for a better understanding of climate-driven mechanisms in the region.
Data Availability Statement
The original contributions presented in the study are included in the article/Supplementary Material, further inquiries can be directed to the corresponding author.
Author Contributions
FC contributed to conception and design of the study. FC, HZ, and YC organized the database. FC performed the statistical analysis. FC wrote the first draft of the manuscript. FC, HZ, YC, and ND wrote sections of the manuscript. All authors contributed to manuscript revision, read, and approved the submitted version.
Funding
This research was supported by NSFC (U1803341) and the National Key R&D Program of China (2018YFA0606401).
Conflict of Interest
The authors declare that the research was conducted in the absence of any commercial or financial relationships that could be construed as a potential conflict of interest.
Publisher’s Note
All claims expressed in this article are solely those of the authors and do not necessarily represent those of their affiliated organizations, or those of the publisher, the editors and the reviewers. Any product that may be evaluated in this article, or claim that may be made by its manufacturer, is not guaranteed or endorsed by the publisher.
Supplementary Material
The Supplementary Material for this article can be found online at: https://www.frontiersin.org/articles/10.3389/feart.2022.904851/full#supplementary-material
References
Adam, J. C., and Lettenmaier, D. P. (2008). Application of New Precipitation and Reconstructed Streamflow Products to Streamflow Trend Attribution in Northern Eurasia. J. Clim. 21 (8), 1807–1828. doi:10.1175/2007jcli1535.1
Aksenov, Y., Popova, E. E., Yool, A., Nurser, A. J. G., Williams, T. D., Bertino, L., et al. (2017). On the Future Navigability of Arctic Sea Routes: High-Resolution Projections of the Arctic Ocean and Sea Ice. Mar. Policy 75, 300–317. doi:10.1016/j.marpol.2015.12.027
Björklund, J. A., Gunnarson, B. E., Krusic, P. J., Grudd, H., Josefsson, T., Östlund, L., et al. (2013). Advances towards Improved Low-Frequency Tree-Ring Reconstructions, Using an Updated Pinus Sylvestris L. MXD Network from the Scandinavian Mountains. Theor. Appl. Climatol. 113, 697–710. doi:10.1007/s00704-012-0787-7
Briffa, K. R., Melvin, T. M., Osborn, T. J., Hantemirov, R. M., Kirdyanov, A. V., Mazepa, V. S., et al. (2013). Reassessing the Evidence for Tree-Growth and Inferred Temperature Change during the Common Era in Yamalia, Northwest Siberia. Quat. Sci. Rev. 72, 83–107. doi:10.1016/j.quascirev.2013.04.008
Büntgen, U. L. F., Frank, D., Wilson, R. O. B., Carrer, M., Urbinati, C., and Esper, J. A. N. (2008). Testing for Tree-Ring Divergence in the European Alps. Glob. Change Biol. 14 (10), 2443–2453. doi:10.1111/j.1365-2486.2008.01640.x
Büntgen, U., Myglan, V. S., Ljungqvist, F. C., McCormick, M., Di Cosmo, N., Sigl, M., et al. (2016). Cooling and Societal Change during the Late Antique Little Ice Age from 536 to Around 660 AD. Nat. Geosci. 9 (3), 231–236. doi:10.1038/ngeo2652
Chen, F., Yuan, Y.-j., Wei, W.-s., Fan, Z.-a., Zhang, T.-w., Shang, H.-m., et al. (2012). Climatic Response of Ring Width and Maximum Latewood Density of Larix Sibirica in the Altay Mountains, Reveals Recent Warming Trends. Ann. For. Sci. 69 (6), 723–733. doi:10.1007/s13595-012-0187-2
Chen, F., Yuan, Y.-j., Wei, W.-s., Zhang, T.-w., Shang, H.-m., and Zhang, R. (2014). Precipitation Reconstruction for the Southern Altay Mountains (China) from Tree Rings of Siberian Spruce, Reveals Recent Wetting Trend. Dendrochronologia 32 (3), 266–272. doi:10.1016/j.dendro.2014.06.003
Chen, F., Yuan, Y., Davi, N., and Zhang, T. (2016). Upper Irtysh River Flow since AD 1500 as Reconstructed by Tree Rings, Reveals the Hydroclimatic Signal of Inner Asia. Clim. Change 139 (3-4), 651–665. doi:10.1007/s10584-016-1814-y
Chen, Y. Y., and Jin, F. F. (2018). Dynamical Diagnostics of the SST Annual Cycle in the Eastern Equatorial Pacific: Part I a Linear Coupled Framework. Clim. Dyn. 50 (5-6), 1841–1862. doi:10.1007/s00382-017-3725-7
Chylek, P., Klett, J. D., Lesins, G., Dubey, M. K., and Hengartner, N. (2014). The Atlantic Multidecadal Oscillation as a Dominant Factor of Oceanic Influence on Climate. Geophys. Res. Lett. 41 (5), 1689–1697. doi:10.1002/2014gl059274
Cohen, J., Screen, J. A., Furtado, J. C., Barlow, M., Whittleston, D., Coumou, D., et al. (2014). Recent Arctic Amplification and Extreme Mid-latitude Weather. Nat. Geosci. 7 (9), 627–637. doi:10.1038/ngeo2234
D'Arrigo, R., Jacoby, G., Frank, D., Pederson, N., Cook, E., Buckley, B., et al. (2001). 1738 Years of Mongolian Temperature Variability Inferred from a Tree-Ring Width Chronology of Siberian Pine. Geophys. Res. Lett. 28 (3), 543–546. doi:10.1029/2000gl011845
D'Arrigo, R., Wilson, R., Liepert, B., and Cherubini, P. (2008). On the ‘Divergence Problem’in Northern Forests: a Review of the Tree-Ring Evidence and Possible Causes. Global and planetary change 60, 289–305.
Davi, N., Jacoby, G., Fang, K., Li, J., D'Arrigo, R., Baatarbileg, N., et al. (2010). Reconstructing Drought Variability for Mongolia Based on a Large-Scale Tree Ring Network: 1520–1993. J. Geophys. Res. Atmos. 115 (D22), 1520–1993. doi:10.1029/2010jd013907
Davi, N. K., D'Arrigo, R., Jacoby, G. C., Cook, E. R., Anchukaitis, K. J., Nachin, B., et al. (2015). A Long-Term Context (931-2005 C.E.) for Rapid Warming over Central Asia. Quat. Sci. Rev. 121, 89–97. doi:10.1016/j.quascirev.2015.05.020
Davi, N. K., Pederson, N., Leland, C., Nachin, B., Suran, B., and Jacoby, G. C. (2013). Is Eastern Mongolia Drying? A Long-Term Perspective of a Multidecadal Trend. Water Resour. Res. 49 (1), 151–158. doi:10.1029/2012wr011834
Di Cosmo, N., Oppenheimer, C., and Büntgen, U. (2017). Interplay of Environmental and Socio-Political Factors in the Downfall of the Eastern Türk Empire in 630 CE. Clim. change 145 (3-4), 383–395. doi:10.1007/s10584-017-2111-0
Durocher, M., Requena, A. I., Burn, D. H., and Pellerin, J. (2019). Analysis of Trends in Annual Streamflow to the Arctic Ocean. Hydrol. Process. 33 (7), 1143–1151. doi:10.1002/hyp.13392
Ekwurzel, B., Schlosser, P., Mortlock, R. A., Fairbanks, R. G., and Swift, J. H. (2001). River Runoff, Sea Ice Meltwater, and Pacific Water Distribution and Mean Residence Times in the Arctic Ocean. J. Geophys. Res. 106 (C5), 9075–9092. doi:10.1029/1999jc000024
Enfield, D. B., Mestas-Nuñez, A. M., and Trimble, P. J. (2001). The Atlantic Multidecadal Oscillation and its Relation to Rainfall and River Flows in the Continental US. Geophys. Res. Lett. 28 (10), 2077–2080. doi:10.1029/2000gl012745
E. R. Cook, and L. Kairiukstis (Editors) (1990). Methods of Dendrochronology: Applications in the Environmental Sciences (Netherland: Kluwer), 408.
Fang, K., Davi, N., Gou, X., Chen, F., Cook, E., Li, J., et al. (2010). Spatial Drought Reconstructions for Central High Asia Based on Tree Rings. Clim. Dyn. 35 (6), 941–951. doi:10.1007/s00382-009-0739-9
Fang, K., Guo, Z., Chen, D., Wang, L., Dong, Z., Zhou, F., et al. (2019). Interdecadal Modulation of the Atlantic Multi-Decadal Oscillation (AMO) on Southwest China’s Temperature over the Past 250 Years. Clim. Dyn. 52 (3-4), 2055–2065. doi:10.1007/s00382-018-4244-x
Ganiev, R., and Kukarskih, V. (2018). Climate Extremes and the Eastern Turkic Empire in Central Asia. Clim. change 149 (3-4), 385–397. doi:10.1007/s10584-018-2236-9
Georgiadi, A. G., Kashutina, E. A., and Milyukova, I. P. (2017). Long-term Changes of Water Flow, Water Temperature and Heat Flux of the Largest Siberian Rivers. Polarforschung 87 (2), 167–176. doi:10.2312/polarforschung.87.2.167
Hantemirov, R. M., and Shiyatov, S. G. (2002). A Continuous Multimillennial Ring-Width Chronology in Yamal, Northwestern Siberia. The Holocene 12 (6), 717–726. doi:10.1191/0959683602hl585rp
Harris, I., Jones, P. D., Osborn, T. J., and Lister, D. H. (2014). Updated High-Resolution Grids of Monthly Climatic Observations - the CRU TS3.10 Dataset. Int. J. Climatol. 34 (3), 623–642. doi:10.1002/joc.3711
Harris, L. J. (2015). Into the Frontiers: the Relay System and Ming Empire in the Borderlands, 1368-1449. Ming Stud. 2015 (72), 3–23. doi:10.1179/0147037x15z.00000000044
Hessl, A. E., Anchukaitis, K. J., Jelsema, C., Cook, B., Byambasuren, O., Leland, C., et al. (2018). Past and Future Drought in Mongolia. Sci. Adv. 4 (3), e1701832. doi:10.1126/sciadv.1701832
Huang, D., Dai, A., Yang, B., Yan, P., Zhu, J., and Zhang, Y. (2019). Contributions of Different Combinations of the IPO and AMO to Recent Changes in Winter East Asian Jets. J. Clim. 32 (5), 1607–1626. doi:10.1175/jcli-d-18-0218.1
Huang, J., Yu, H., Guan, X., Wang, G., and Guo, R. (2016). Accelerated Dryland Expansion under Climate Change. Nat. Clim. Change 6 (2), 166–171. doi:10.1038/nclimate2837
Iegorova, L. V., Gibbs, J. P., Mountrakis, G., Bastille-Rousseau, G., Paltsyn, M. Y., Ayatkhan, A., et al. (2019). Rangeland Vegetation Dynamics in the Altai Mountain Region of Mongolia, Russia, Kazakhstan and China: Effects of Climate, Topography, and Socio-Political Context for Livestock Herding Practices. Environ. Res. Lett. 14 (10), 104017. doi:10.1088/1748-9326/ab1560
Intergovernmental Panel on Climate Change Fifth Assessment Report (IPCC AR5) (2013). Summary for Policymakers: The Physical Science Basis. Contribution of Working Group I to the IPCC Fifth Assessment Report Climate Change. Available at: http://en.wikipedia.org/wiki/IPCC_Fifth_Assessment_Report (Accessed May 15, 2022).
Iwao, K., and Takahashi, M. (2006). Interannual Change in Summertime Precipitation over Northeast Asia. Geophys. Res. Lett. 33 (16), L16703. doi:10.1029/2006gl027119
Jiang, L., Yao, Z., and Huang, H. (2016). Climate Variability and Change on the Mongolian Plateau: Historical Variation and Future Predictions. Clim. Res. 67 (1), 1–14. doi:10.3354/cr01347
Khon, V. C., Mokhov, I. I., Latif, M., Semenov, V. A., and Park, W. (2010). Perspectives of Northern Sea Route and Northwest Passage in the Twenty-First Century. Clim. change 100 (3-4), 757–768. doi:10.1007/s10584-009-9683-2
Kinnard, C., Zdanowicz, C. M., Fisher, D. A., Isaksson, E., de Vernal, A., and Thompson, L. G. (2011). Reconstructed Changes in Arctic Sea Ice over the Past 1,450 Years. Nature 479 (7374), 509–512. doi:10.1038/nature10581
Kosaka, Y., and Xie, S.-P. (2013). Recent Global-Warming Hiatus Tied to Equatorial Pacific Surface Cooling. Nature 501 (7467), 403–407. doi:10.1038/nature12534
Koutavas, A. (2018). Temperature Correlations between the Eastern Equatorial Pacific and Antarctica over the Past 230,000 Years. Earth Planet. Sci. Lett. 485, 43–54. doi:10.1016/j.epsl.2017.12.041
Lambert, E., Nummelin, A., Pemberton, P., and Ilıcak, M. (2019). Tracing the Imprint of River Runoff Variability on Arctic Water Mass Transformation. J. Geophys. Res. Oceans 124 (1), 302–319. doi:10.1029/2017jc013704
Lesack, L. F. W., Marsh, P., Hicks, F. E., and Forbes, D. L. (2014). Local Spring Warming Drives Earlier River-Ice Breakup in a Large Arctic Delta. Geophys. Res. Lett. 41 (5), 1560–1567. doi:10.1002/2013gl058761
Li, J., Cook, E. R., D’arrigo, R., Chen, F., and Gou, X. (2009). Moisture Variability across China and Mongolia: 1951–2005. Clim. Dyn. 32 (7-8), 1173–1186. doi:10.1007/s00382-008-0436-0
Liu, B., Yang, D., Ye, B., and Berezovskaya, S. (2005). Long-term Open-Water Season Stream Temperature Variations and Changes over Lena River Basin in Siberia. Glob. Planet. Change 48, 96–111. doi:10.1016/j.gloplacha.2004.12.007
Liu, Y., Cai, W., Sun, C., Song, H., Cobb, K. M., Li, J., et al. (2019). Anthropogenic Aerosols Cause Recent Pronounced Weakening of Asian Summer Monsoon Relative to Last Four Centuries. Geophys. Res. Lett. 46, 5469–5479. doi:10.1029/2019gl082497
Liu, Y., Li, Y., Li, S., and Motesharrei, S. (2015). Spatial and Temporal Patterns of Global NDVI Trends: Correlations with Climate and Human Factors. Remote Sens. 7 (10), 13233–13250. doi:10.3390/rs71013233
Lu, R., Dong, B., and Ding, H. (2006). Impact of the Atlantic Multidecadal Oscillation on the Asian Summer Monsoon. Geophys. Res. Lett. 33 (24), L24701. doi:10.1029/2006gl027655
Luo, X., and Wang, B. (2019). How Autumn Eurasian Snow Anomalies Affect East Asian Winter Monsoon: a Numerical Study. Clim. Dyn. 52 (1-2), 69–82. doi:10.1007/s00382-018-4138-y
Mann, M. E., Zhang, Z., Rutherford, S., Bradley, R. S., Hughes, M. K., Shindell, D., et al. (2009). Global Signatures and Dynamical Origins of the Little Ice Age and Medieval Climate Anomaly. Science 326 (5957), 1256–1260. doi:10.1126/science.1177303
Markus, T., Stroeve, J. C., and Miller, J. (2009). Recent Changes in Arctic Sea Ice Melt Onset, Freeze up, and Melt Season Length. J. Geophys. Res. Oceans 114 (C12), C12024. doi:10.1029/2009jc005436
Matsumura, S., Zhang, X., and Yamazaki, K. (2014). Summer Arctic Atmospheric Circulation Response to Spring Eurasian Snow Cover and its Possible Linkage to Accelerated Sea Ice Decrease. J. Clim. 27 (17), 6551–6558. doi:10.1175/jcli-d-13-00549.1
Medhaug, I., Stolpe, M. B., Fischer, E. M., and Knutti, R. (2017). Reconciling Controversies about the ‘global Warming Hiatus’. Nature 545 (7652), 41–47. doi:10.1038/nature22315
Melvin, T. M., and Briffa, K. R. (2008). A “Signal-free” Approach to Dendroclimatic Standardisation. Dendrochronologia 26 (2), 71–86. doi:10.1016/j.dendro.2007.12.001
Monerie, P. A., Robson, J., Dong, B., Hodson, D. L. R., and Klingaman, N. P. (2019). Effect of the Atlantic Multidecadal Variability on the Global Monsoon. Geophys. Res. Lett. 46 (3), 1765–1775. doi:10.1029/2018gl080903
Mote, F. W. (1998). The Cambridge History of China: The Ming Dynasty, 2. Cambridge, UK:: Cambridge University Press.
Myglan, V. S., Oidupaa, O. C., and Vaganov, E. A. (2012). A 2367-Year Tree-Ring Chronology for the Altai-Sayan Region (Mongun-Taiga Mountain Massif). Archaeol. Ethnology Anthropol. Eurasia 40 (3), 76–83. doi:10.1016/j.aeae.2012.11.009
Nagaraju, C., Ashok, K., Balakrishnan Nair, T. M., Guan, Z., and Cai, W. (2018). Potential Influence of the Atlantic Multi-Decadal Oscillation in Modulating the Biennial Relationship between Indian and Australian Summer Monsoons. Int. J. Climatol. 38 (14), 5220–5230. doi:10.1002/joc.5722
Nummelin, A., Ilicak, M., Li, C., and Smedsrud, L. H. (2016). Consequences of Future Increased Arctic Runoff on Arctic Ocean Stratification, Circulation, and Sea Ice Cover. J. Geophys. Res. Oceans 121 (1), 617–637. doi:10.1002/2015jc011156
Park, H., Watanabe, E., Kim, Y., Polyakov, I., Oshima, K., Zhang, X., et al. (2020). Increasing Riverine Heat Influx Triggers Arctic Sea Ice Decline and Oceanic and Atmospheric Warming. Sci. Adv. 6 (45), eabc4699. doi:10.1126/sciadv.abc4699
Park, H., Yoshikawa, Y., Yang, D., and Oshima, K. (2017). Warming Water in Arctic Terrestrial Rivers under Climate Change. J. Hydrometeorol. 18 (7), 1983–1995. doi:10.1175/jhm-d-16-0260.1
Pederson, N., Hessl, A. E., Baatarbileg, N., Anchukaitis, K. J., and Di Cosmo, N. (2014). Pluvials, Droughts, the Mongol Empire, and Modern Mongolia. Proc. Natl. Acad. Sci. U.S.A. 111 (12), 4375–4379. doi:10.1073/pnas.1318677111
Pederson, N., Leland, C., Nachin, B., Hessl, A. E., Bell, A. R., Martin-Benito, D., et al. (2013). Three Centuries of Shifting Hydroclimatic Regimes across the Mongolian Breadbasket. Agric. For. meteorology 178-179, 10–20. doi:10.1016/j.agrformet.2012.07.003
Peng, X., Zhang, T., Frauenfeld, O. W., Wang, S., Qiao, L., Du, R., et al. (2020). Northern Hemisphere Greening in Association with Warming Permafrost. J. Geophys. Res. Biogeosciences 125 (1), e2019JG005086. doi:10.1029/2019jg005086
Rao, M. P., Davi, N. K., D’Arrigo, R. D., Skees, J., Nachin, B., Leland, C., et al. (2015). Dzuds, Droughts, and Livestock Mortality in Mongolia. Environ. Res. Lett. 10 (7), 074012. doi:10.1088/1748-9326/10/7/074012
Rayner, N. A. A., Parker, D. E., Horton, E. B., Folland, C. K., Alexander, L. V., Rowell, D. P., et al. (2003). Global Analyses of Sea Surface Temperature, Sea Ice, and Night Marine Air Temperature since the Late Nineteenth Century. J. Geophys. Res. Atmos. 108 (D14), 4407. doi:10.1029/2002jd002670
Rinn, F. (2003). TSAPWin: Time Series Analysis and Presentation for Dendrochronology and Related Applications, Version 0.55 User Reference. Heidelberg: Rinntech, 76.
Serreze, M. C., and Barry, R. G. (2011). Processes and Impacts of Arctic Amplification: A Research Synthesis. Glob. Planet. change 77 (1-2), 85–96. doi:10.1016/j.gloplacha.2011.03.004
Shu, Q., Qiao, F., Song, Z., and Xiao, B. (2017). Effect of Increasing Arctic River Runoff on the Atlantic Meridional Overturning Circulation: a Model Study. Acta Oceanol. Sin. 36 (8), 59–65. doi:10.1007/s13131-017-1009-z
Smith, T. M., and Reynolds, R. W. (2005). A Global Merged Land-Air-Sea Surface Temperature Reconstruction Based on Historical Observations (1880-1997). J. Clim. 18 (12), 2021–2036. doi:10.1175/jcli3362.1
Stroeve, J. C., Kattsov, V., Barrett, A., Serreze, M., Pavlova, T., Holland, M., et al. (2012). Trends in Arctic Sea Ice Extent from CMIP5, CMIP3 and Observations. Geophys. Res. Lett. 39 (16), L16502. doi:10.1029/2012gl052676
Tong, S., Lai, Q., Zhang, J., Bao, Y., Lusi, A., Ma, Q., et al. (2018). Spatiotemporal Drought Variability on the Mongolian Plateau from 1980-2014 Based on the SPEI-PM, Intensity Analysis and Hurst Exponent. Sci. of the Total Environ. 615, 1557–1565. doi:10.1016/j.scitotenv.2017.09.121
Troy, T. J., Sheffield, J., and Wood, E. F. (2012). The Role of Winter Precipitation and Temperature on Northern Eurasian Streamflow Trends. J. Geophys. Res. Atmos. 117 (D5), DO5131. doi:10.1029/2011jd016208
Tucker, C. J., Pinzon, J. E., Brown, M. E., Slayback, D. A., Pak, E. W., Mahoney, R., et al. (2005). An Extended AVHRR 8-km NDVI Dataset Compatible with MODIS and SPOT Vegetation NDVI Data. Int. J. Remote Sens. 26 (20), 4485–4498. doi:10.1080/01431160500168686
Wang, J., Yang, B., Ljungqvist, F. C., Luterbacher, J., Osborn, T. J., Briffa, K. R., et al. (2017). Internal and External Forcing of Multidecadal Atlantic Climate Variability over the Past 1,200 Years. Nat. Geosci. 10 (7), 512–517. doi:10.1038/ngeo2962
Wang, L., Yao, Z.-J., Jiang, L.-G., Wang, R., Wu, S.-S., and Liu, Z.-F. (2016). Changes in Climate Extremes and Catastrophic Events in the Mongolian Plateau from 1951 to 2012. J. Appl. Meteorology Climatol. 55 (5), 1169–1182. doi:10.1175/jamc-d-14-0282.1
Wang, W., and Feng, Z. (2013). Holocene Moisture Evolution across the Mongolian Plateau and its Surrounding Areas: A Synthesis of Climatic Records. Earth-Science Rev. 122, 38–57. doi:10.1016/j.earscirev.2013.03.005
Wang, X., Brown, P. M., Zhang, Y., and Song, L. (2011). Imprint of the Atlantic Multidecadal Oscillation on Tree-Ring Widths in Northeastern Asia since 1568. PloS one 6 (7), e22740. doi:10.1371/journal.pone.0022740
Wang, Y., Li, S., and Luo, D. (2009). Seasonal Response of Asian Monsoonal Climate to the Atlantic Multidecadal Oscillation. J. Geophys. Res. Atmos. 114 (D2), DO2112. doi:10.1029/2008jd010929
Yao, J., Chen, Y., Zhao, Y., Mao, W., Xu, X., Liu, Y., et al. (2018). Response of Vegetation NDVI to Climatic Extremes in the Arid Region of Central Asia: a Case Study in Xinjiang, China. Theor. Appl. Climatol. 131 (3-4), 1503–1515. doi:10.1007/s00704-017-2058-0
Zhang, P., Jeong, J.-H., Yoon, J.-H., Kim, H., Wang, S.-Y. S., Linderholm, H. W., et al. (2020). Abrupt Shift to Hotter and Drier Climate over Inner East Asia beyond the Tipping Point. Science 370 (6520), 1095–1099. doi:10.1126/science.abb3368
Keywords: dendrochronology, Northern Mongolian Plateau, temperature reconstruction, streamflow variation, Atlantic Multidecadal Oscillation
Citation: Chen F, Chen Y, Davi N and Zhang H (2022) Summer Temperature Reconstruction for the Source Area of the Northern Asian Great River Basins, Northern Mongolian Plateau Since 1190 CE and its Linkage With Inner Asian Historical Societal Changes. Front. Earth Sci. 10:904851. doi: 10.3389/feart.2022.904851
Received: 28 March 2022; Accepted: 09 May 2022;
Published: 20 May 2022.
Edited by:
Claudio Fabian Szlafsztein, Federal University of Pará, BrazilReviewed by:
Eduardo Zorita, Helmholtz Centre for Materials and Coastal Research (HZG), GermanyOlga Solomina, Institute of Geography (RAS), Russia
Copyright © 2022 Chen, Chen, Davi and Zhang. This is an open-access article distributed under the terms of the Creative Commons Attribution License (CC BY). The use, distribution or reproduction in other forums is permitted, provided the original author(s) and the copyright owner(s) are credited and that the original publication in this journal is cited, in accordance with accepted academic practice. No use, distribution or reproduction is permitted which does not comply with these terms.
*Correspondence: Feng Chen, feng653@163.com