Relationships Between Rapid Urbanization and Extreme Summer Precipitation Over the Sichuan–Chongqing Area of China
 Hao Wang
 Yilin Yan
 Keji Long
 Qingqing Chen
 Xingang Fan5
 - 1College of Atmospheric Sounding, Chengdu University of Information Technology, Chengdu, China
- 2Key Laboratory of Atmosphere Sounding, China Meteorological Administration, Chengdu, China
- 3Sichuan Province Meteorological Observatory, Chengdu, China
- 4Heavy Rain and Drought-Flood Disasters in Plateau and Basin Key Laboratory of Sichuan Province, Chengdu, China
- 5Department of Earth, Environmental, and Atmospheric Sciences, Western Kentucky University, Bowling Green, KY, United States
China has undergone rapid urbanization over the past few decades, and accordingly, changes have occurred in the extreme precipitation events. However, few studies have focused on the relationships between rapid urbanization and extreme precipitation events in southwest China, particularly in the Sichuan–Chongqing area, which has a complex topography and has experienced rapid urbanization over the past few decades. This is the first study to analyze the impact of urbanization on the amount, frequency, and intensity of extreme summer (June–August) precipitation events over the past 30 years. Our results indicate that extreme precipitation events primarily occurred in the urban-dominated Sichuan basin, particularly during the fast urbanization development stage (FUDS) of 1994–2015. Extreme precipitation amounts and intensities increased during the FUDS, implying the greater probability of individual precipitation events developing into heavy or extreme events in a particular area. In addition, the probability distribution functions of the occurrence and volume of strong convective events significantly increased during the FUDS. Finally, the annual increase in urban-scale land surface air temperature, increase in wet convection, and changes in wind speed are identified as essential factors leading to extreme precipitation events in this region.
1 Introduction
Increasing evidence reveals that the urbanization can remarkably affect the composition of the Earth’s surface as well as the thermal properties of the overlying atmosphere, thereby changing the local climate (Huff and Changnon, 1972; Changnon, 1979; Changnon et al., 1991; Zhang, 2020). Numerous observations and numerical simulations reveal that extreme precipitation events have become increasingly frequent with global warming (Madsen et al., 2014) to which the urban heat island (UHI) effect is a contributor (Baik et al., 2006). In urban areas, the feedback effect of local surface processes on precipitation is crucial. Regional land use and land cover changes can alter mesoscale convection, thereby affecting the occurrence and development of precipitation (Pielke et al., 2007; Niyogi et al., 2017). Previous studies have revealed that the UHI effect can result in the instability of atmospheric stratification (Baik, 2006; Su et al., 2019), thereby triggering thunderstorms under favorable thermodynamic conditions (Schroeder et al., 2016) and leading to significantly higher downwind precipitation amounts and frequencies than in surrounding areas (Ackerman et al., 1978; Zahrani, 2018). Simultaneously, urbanization changes the ground roughness, which triggers turbulence and uplift, enhances wind convergence, and, consequently, increases the amount and frequency of precipitation in urban areas (Su et al., 2019; Yan et al., 2020; Xiao et al., 2021). Moreover, abundant condensation nuclei in urban areas can promote water vapor condensation and precipitation formation (Zhong et al., 2015).
Relationships between urbanization and precipitation in megacity agglomerations have been recently studied in China, such as Beijing (Zhang et al., 2013; Li et al., 2015), Shanghai (Liang and Ding, 2017), and Guangzhou (Yin et al., 2020). Most of these studies have revealed that urbanization increases precipitation in urban areas; however, variations may occur among urban agglomerations due to variable local circulation feedback effects, topography, and underlying surface conditions. As the leading economic development area in western China, the Sichuan–Chongqing area (97–110°E, 26–34°N) is a critical geographical link between the east and the west, as well as the driver for the north and the south of China (Figure 1). In the past 30 years, the Sichuan–Chongqing area has experienced rapid urbanization, with rapid increases in the developed land area since the beginning of the fast urbanization development stage (FUDS) in 1994 (Figure 2); this area is now considered the fourth megacity agglomeration in China.
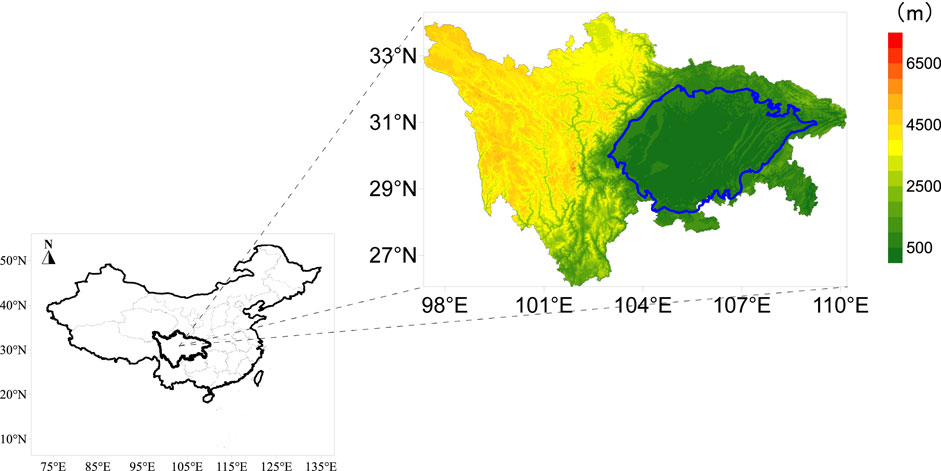
FIGURE 1. Geographical location of the Sichuan–Chongqing area in China and its elevation (m). The area surrounded by the blue border is the Sichuan basin.
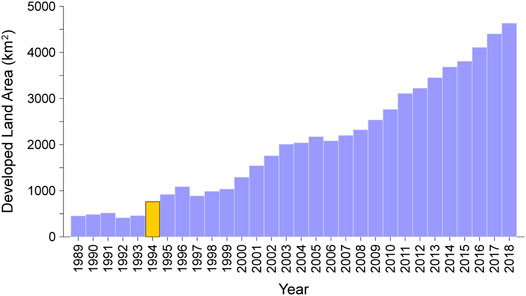
FIGURE 2. Changes in the developed land area of the Sichuan–Chongqing area (1989–2018). The data are from the statistical yearbooks of Sichuan Province and Chongqing Municipality. The yellow column (1994) indicates the beginning of the fast urbanization development stage (FUDS).
Urban agglomerations in the Sichuan–Chongqing area are primarily concentrated in the Sichuan basin (Figure 3). This area has a humid subtropical monsoon climate, which experiences an annual precipitation of ≥1,000 mm, with more than 50% of the precipitation occurring in summer. Because this region is located in the transition zone between the eastern China monsoon region and the Qinghai–Tibet Plateau alpine region, the climate is affected by both the plateau climate and the humid subtropical monsoon climate. Consequently, extreme precipitation events have a high likelihood of occurring in this area (Huang et al., 2012; Wang et al., 2013; Wang and He, 2017). Recent records show that heavy precipitation events have occurred more frequently, particularly in urban areas, where the cumulative precipitation amount and intensity have typically exceeded historical extremes. For example, during August 10–18, 2020, a continuous regional rainstorm occurred in the Sichuan basin during which the hourly precipitation intensity (HPI) recorded at most stations reached or exceeded the historical extreme, with the maximum HPI exceeding 150 mm/h, resulting in severe urban waterlogging.
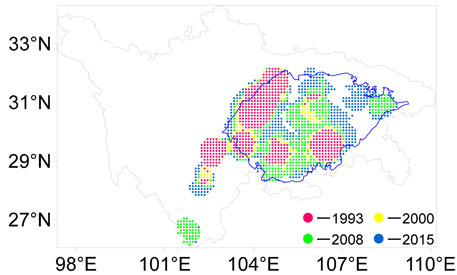
FIGURE 3. Spatial expansion of Sichuan–Chongqing urban areas at four representative stages in 1993, 2000, 2008, and 2015.
Many recent studies have been conducted on extreme heavy precipitation in eastern and southern China; however, studies on the western region, particularly the Sichuan–Chongqing area, with its complex topography and climatic conditions, are relatively rare. Moreover, studies in this area are more typically focused on analyzing the sources of perceptible water vapor (Wang et al., 2013, 2020) and the evolutionary trends (Hu et al., 2009), formation mechanisms (Luo et al., 2019; Liu. et al., 2020), and other aspects of individual events. In comparison, the distribution of extreme precipitation events, their evolutionary characteristics, and the influences of rapid urbanization have rarely been discussed. Thus, to the best of our knowledge, this is the first study to quantitatively explore the development and evolutionary trends of extreme precipitation events in urban and non-urban areas in this region during slow and fast stages of urbanization and at various spatiotemporal scales. In addition, we comprehensively analyzed the correlation between extreme summer precipitation and rapid urbanization based on a range of meteorological factors. The remainder of this article is organized as follows: Section 2 (Data and Methods) introduces the research datasets, evaluation indices, and research methods; Section 3 (Results and Discussion) discusses the spatial distribution, temporal evolution, probability, and causal analysis of extreme summer precipitation events in the Sichuan–Chongqing area; finally, the last section (Conclusions and Future Research) summarizes the study and provides our research outlook.
2 Data and Methods
2.1 Datasets
2.1.1 Meteorological Dataset
Meteorological data were obtained from the China Meteorological Forcing Dataset (CMFD) (1979–2015), which is the first land surface meteorological dataset with a temporal resolution of 3 h and a spatial resolution of 0.1° developed for studying land surface processes in China. The high-resolution temporal and spatial coverage of this dataset has made it one of China’s most widely used climate datasets (He et al., 2020). We also merged meteorological observation data from the China Meteorological Administration with the Princeton reanalysis dataset (Sahoo et al., 2015), the Global Land Data Assimilation System forcing dataset (Rodell et al., 2004), the Global Energy and Water Cycle Experiment–Surface Radiation Budget forcing dataset (Pinker et al., 1992), and precipitation data from the Tropical Rainfall Measuring Mission (Rosenfeld, 1999; Chen et al., 2020). These data contained reanalysis datasets for seven major land surface meteorological elements. Comparing the accuracies of the observation results of independent stations, the CMFD provides superior data quality than the Global Land Data Assimilation System, particularly in areas with sparse weather stations (He et al., 2020). Therefore, the CMFD enables accurate analysis of meteorological elements under the complex topography of the Sichuan–Chongqing area.
2.1.2 Urbanization Dataset
The urbanization data for the Sichuan–Chongqing area are based on land cover types from the Land Cover Classification System (LCCS) of the United Nations Food and Agriculture Organization (Hansen et al., 1998, 2000), which we used to determine the urban and non-urban areas of the region for each year between 1992 and 2015. To consider data quality in terms of reliability and continuity, we compared the annual LCCS data with the land cover data released by the European Space Agency’s Climate Change Initiative (Poulter et al., 2015). Because this dataset covers 22 different land types, exhibits long-term consistency, is updated annually, and has a global horizontal resolution as high as 300 m, it has been widely applied in land assessments, forest and desertification monitoring, and many other fields. However, notably, as LCCS data prior to 1992 are not available, the 1979–1991 LCCS data range was considered equivalent to that of 1992 for land cover type during the slow urbanization development stage (SUDS, 1979–1993).
2.2 Methodology
Six precipitation indices recommended by the Expert Team on Climate Change Detection and Indices (Table 1) (Zhao et al., 2014) were adopted to quantitatively evaluate the precipitation amount and frequency as well as the intensity of summer precipitation and extreme precipitation events in the Sichuan–Chongqing area during the period 1979–2015. The specific procedures for calculating the extreme precipitation indices are as follows. For each of the 5,384 meteorological grid points in the Sichuan–Chongqing area, precipitation events with a daily precipitation amount of ≥1 mm during the 1979–2015 period were sorted in the ascending order (Zhai et al., 2005; Zhang et al., 2013; Wu et al., 2019), and the 95th percentile was estimated as the extreme precipitation threshold. When the precipitation amount of a given day exceeded this threshold, an extreme precipitation event was considered to have occurred. Accordingly, we defined “PRCPTOT95” as the extreme precipitation amount, “RD95” as the extreme precipitation frequency, and “SDII95” as the extreme precipitation intensity.
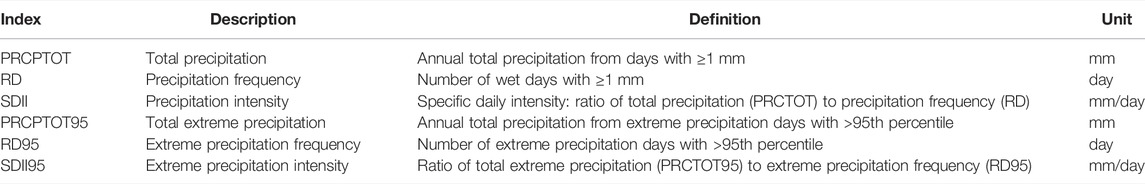
TABLE 1. Precipitation indices and definitions recommended by the Expert Team on Climate Change Detection and Indices.
Sen’s slope estimation method (Sen, 1968) was employed to evaluate the linear trends of all grid points in the Sichuan–Chongqing area during the study period that passed the Mann–Kendall trend test (Mann, 1945; Kendall, 1975; Yue and Pilon, 2004). When the calculated Z-score of each grid point was greater than the critical value of the standard normal distribution at the 90% confidence level, a statistically significant positive or negative trend in the data series was identified (Da Silva et al., 2015; Zhang et al., 2016; Gu et al., 2017a, 2017b).
3 Results and Discussion
3.1 Spatial Distribution of Extreme Precipitation Events
Figure 4 shows the annual average distribution of all precipitation events and extreme precipitation events in the Sichuan–Chongqing area. These events are consistent in the high-value areas of precipitation amount, frequency, and intensity, indicating that extreme precipitation events are affected to some extent by the long-term climate background. Moreover, the high-value areas of PRCPTOT, PRCPTOT95, SDII, and SDII95 are all located on the west side of the basin where cold air and warm air mix in the transitioning mountainous area between the plateau and basin. This region is a prominent rainy area in China (Wang et al., 2013; Wang and He, 2017). The areas with high precipitation frequency are primarily located on the western edge of the basin, whereas plateau areas occur at relatively high altitudes. This characteristic is consistent with typical plateau summer precipitation (Liu and Yin, 2001). By analyzing the ratios of PRCPTOT95: PRCPTOT, RD95: RD, and SDII95: SDII (Figures 4C,F,I), we found that the Sichuan basin is primarily dominated by extreme precipitation events in terms of precipitation amount, frequency, and intensity. Notably, strong convection events in the basin are more common in most urbanized areas.
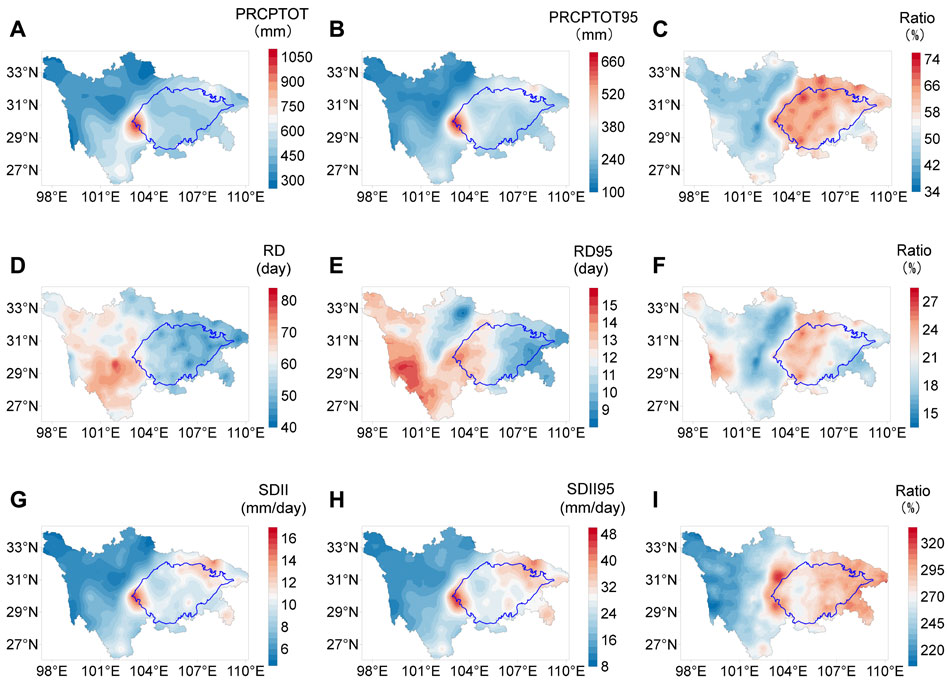
FIGURE 4. Annual average distribution of all precipitation and extreme precipitation events in the Sichuan–Chongqing area: (A,D, and G) show all precipitation events; (B,E, and H) show extreme precipitation events; and (C,F, and I) show the ratios of extreme precipitation events to all precipitation events.
We divided urbanization into the SUDS (1979–1993) and FUDS (1994–2015) stages for comparison. During these two stages, the high-value areas of the three precipitation indices exhibited no significant differences (Figure 5). However, after calculating the differences in each grid between the two stages, we observed that during the FUDS, the means of PRCPTOT95, RD95, and SDII95 in the basin area increased by ∼120 mm, 5 days, and more than 4 mm/d, respectively.
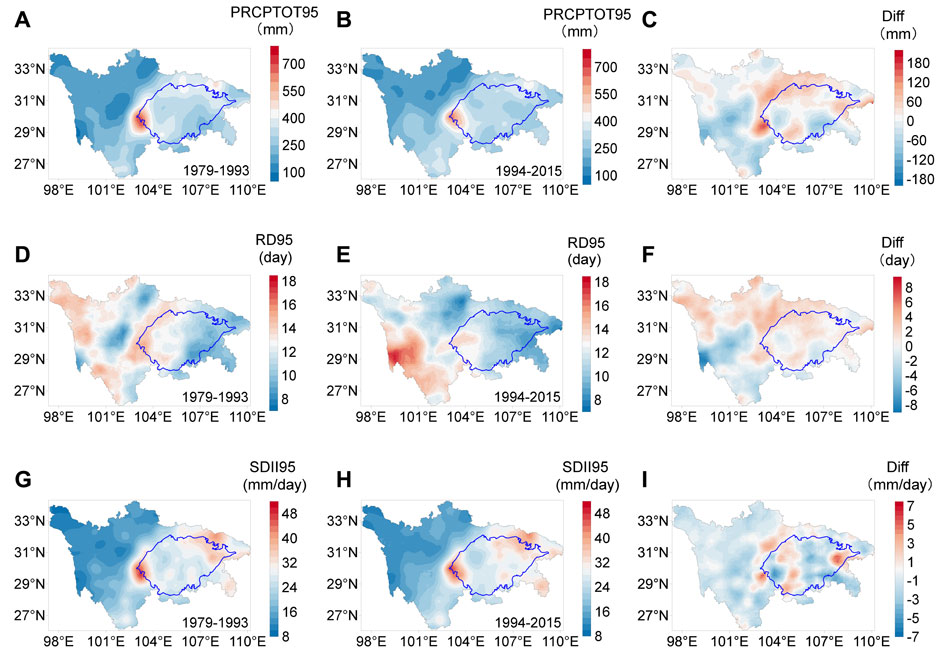
FIGURE 5. Distribution of average annual extreme precipitation amount (PRCTOT95), extreme precipitation frequency (RD95), and extreme precipitation intensity (SDII95) in the Sichuan–Chongqing area: (A,D, and G) show the slow urbanization development stage (SUDS, 1979–1993); (B,E, and H) show the fast urbanization development stage (FUDS, 1994–2015); and (C,F, and I) show the differences in each grid between these two stages.
Based on our analysis, extreme precipitation events in the Sichuan–Chongqing area were primarily concentrated in the Sichuan basin, which is dominated by urban areas. Furthermore, urban areas were more likely to experience extreme precipitation during the FUDS.
3.2 Temporal Evolution of Extreme Precipitation Events
Because the CMFD and LCCS have different spatial resolutions, we adopted the processing method of Su et al. (2019) to evaluate the temporal evolution of extreme precipitation events. On a CMFD grid, if the LCCS urban grids occupy more than 50% of its area, the land cover type is defined as urban; otherwise, it is defined as non-urban. For the statistical analysis of the urban and non-urban grids, only those with a significant trend that passed the MK test at the 90% confidence level were considered. The proportions of grid points that passed the MK test for the PRCPTOT95, RD95, and SDII95 thresholds were 22.55, 18.93, and 46.92%, respectively. To avoid the influence of climate and topography on the comparative analysis between urban and non-urban areas, we used the precipitation anomaly percentage difference (PAP-DIFF) to account for the influence of extreme precipitation (Nazeri et al., 2020). It should be noted, however, that the urbanized and non-urbanized grid points were not fixed in each year.
Figures 6A,C,E show the trends in the precipitation anomaly percentage difference (PAP-DIFF) for PRCPTOT95, RD95, and SDII95, respectively, in urban and non-urban areas during the period 1979–2015. The PAP-DIFF for both PRCPTOT95 and SDII95 exhibited an overall increasing trend, and the difference between urban and non-urban areas began to increase after 1994 when urbanization became more intense. However, the PAP-DIFF of RD95 showed no significant trend, indicating that the extreme precipitation frequencies in urban and non-urban areas were not significantly different.
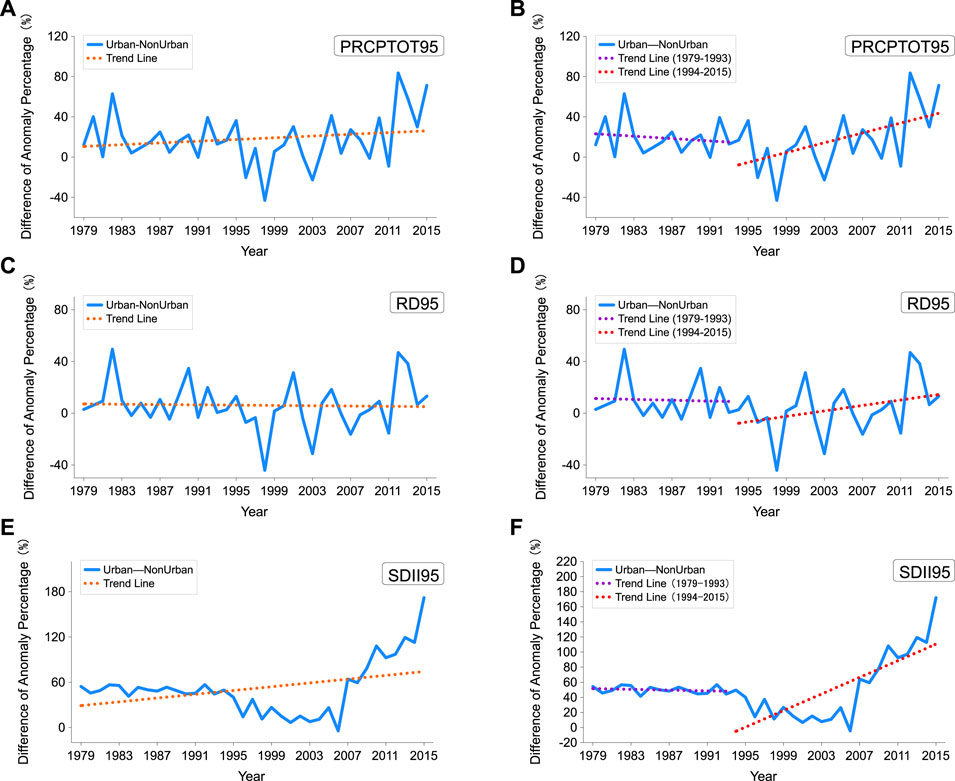
FIGURE 6. Precipitation anomaly percentage difference (PAP-DIFF) trends of the annual average PRCPTOT95 (A,B), RD95 (C,D), and SDII95 (E,F) between urban and non-urban areas in the Sichuan–Chongqing area. PRCPTOT95 is the extreme precipitation amount, RD95 is the extreme precipitation frequency, and SDII95 is the extreme precipitation intensity. Only grid points that passed the Mann−Kendall trend test at the 90% confidence level were included in the PAP-DIFF trends.
Figure 6B shows that the PRCPTOT95 PAP-DIFF from the SUDS to FUDS increased from −0.58 to 2.44%/year. The average trend of the PRCPTOT95 PAP-DIFF in urban and non-urban areas reached 0.42%/year throughout the study period. Similarly, Figure 6D shows that the PAD-DIFF between the urban and non-urban areas exhibits no significant change between 1979 and 1993, and there is no trend in the RD95 PAP-DIFF between urban and non-urban areas, with an average of 0.05%/year, increasing to 1.05%/year in the 1994–2015 period. Figures 6E,F show that the SDII95 PAP-DIFF exhibited a similar trend to the PRCPTOT95 PAP-DIFF; between 1979 and 1993, the PAP-DIFF between the urban and non-urban areas showed no evident decrease, whereas between 1994 and 2015, this trend substantially increased, with an average increase of 5.5%/year. The trends in extreme precipitation during each urbanization stage are further summarized in Table 2.
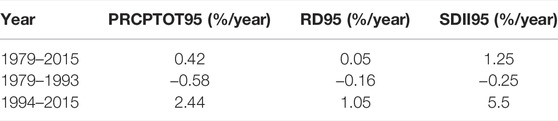
TABLE 2. Comparison of the evolution of precipitation anomaly percentage difference during different stages of urbanization in the Sichuan–Chongqing area. “PRCPTOT95” is the extreme precipitation amount, “RD95” is the extreme precipitation frequency, and “SDII95” is the extreme precipitation intensity.
The changes in PRCPTOT95 and RD95 revealed that extreme precipitation in the Sichuan–Chongqing area is primarily reflected by an increase in the amounts of individual precipitation events, which is consistent with the SDII95 data. Based on the PAP-DIFF between urban and non-urban areas throughout the study period, rapid urbanization since 1994 has been associated with an increase in extreme summer precipitation in the Sichuan–Chongqing area.
3.3 Probability Analysis of Extreme Precipitation Events
To further explore the impact of urbanization on the probability of extreme summer precipitation events, we followed the “Technical Specifications for Rainstorm and Flood Disastrous Risk Mapping” of the CMA. Given the large disparities in extreme precipitation between location, different levels of precipitation intensity were defined as weak precipitation (<25 mm/d), heavy precipitation (25–35 mm/d), torrential rain (35–45 mm/d), and a downpour (≥45 mm/d). Thus, we calculated and compared the probability distribution function (PDF) by occurrence (PDFc) and the PDF by volume (PDFv) of daily precipitation under the various precipitation intensities (R) during the SUDS and FUDS stages (Guo et al., 2016; Wang et al., 2020). Overall, the PDFc of weak precipitation events during the FUDS was lower than during the SUDS (Figure 7A), whereas the PDFc of heavy precipitation events during the FUDS was higher than during the SUDS (Figure 7B). In the case of PDFv, the volume of weak precipitation events decreased during the FUDS (Figure 7C), but the volume of heavy precipitation events substantially increased (Figure 7D).
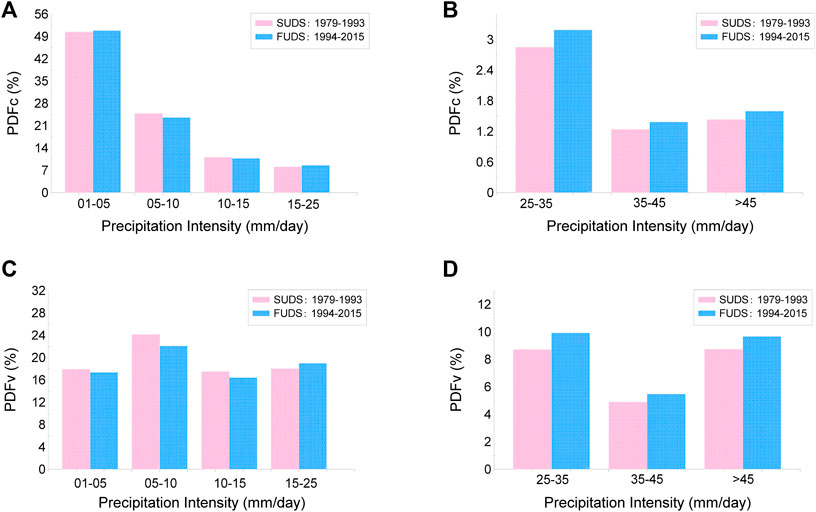
FIGURE 7. Probability distribution functions (PDFs) by occurrence [PDFc; (A,B)] and volume [PDFv; (C,D)] for different intensities of summertime precipitation events during the slow urbanization development stage (SUDS) and fast urbanization development stage (FUDS) in the Sichuan–Chongqing area.
Further analysis revealed that the PDFc of weak precipitation events (<1 mm) was excluded during the FUDS, with no noticeable changes during this stage. In contrast, the PDFc of heavy rain, torrential rain, and downpour events increased by 11.97, 11.45, and 11.50%, respectively, which is consistent with the precipitation frequencies previously discussed. In addition, the changes in PDFv during the FUDS were more noticeable, with heavy rain, torrential rain, and downpour events increasing significantly by 13.84, 12.06, and 10.71%, respectively. This indicates that strong convective events have occurred more frequently during the FUDS (Karl and Knight, 1998; Fujibe et al., 2005; Liao et al., 2011).
3.4 Causal Analysis of Extreme Precipitation Events
The atmospheric environment and circulation are primarily affected by two types of disturbances related to urbanization, i.e., the change in land cover type and the increase in anthropogenic pollutant emissions (Zhong et al., 2015). The UHI circulation and the reduction in surface wind speeds in the urban environments leads to unstable atmospheric stratification, favoring the generation of thermal convection and the production of convective precipitation. The UHI effect might, therefore, be an important component of the influence of urbanization on extreme summer precipitation in the Sichuan–Chongqing area. Indeed, large amounts of carbon dioxide and other greenhouse gases released by human activities coupled with the heat released from anthropogenic sources typically result in higher temperatures in cities compared to non-urban areas. As shown in Figures 8A,B, urban surface temperatures have been increasing annually in our study area relative to non-urban areas, particularly during the FUDS.
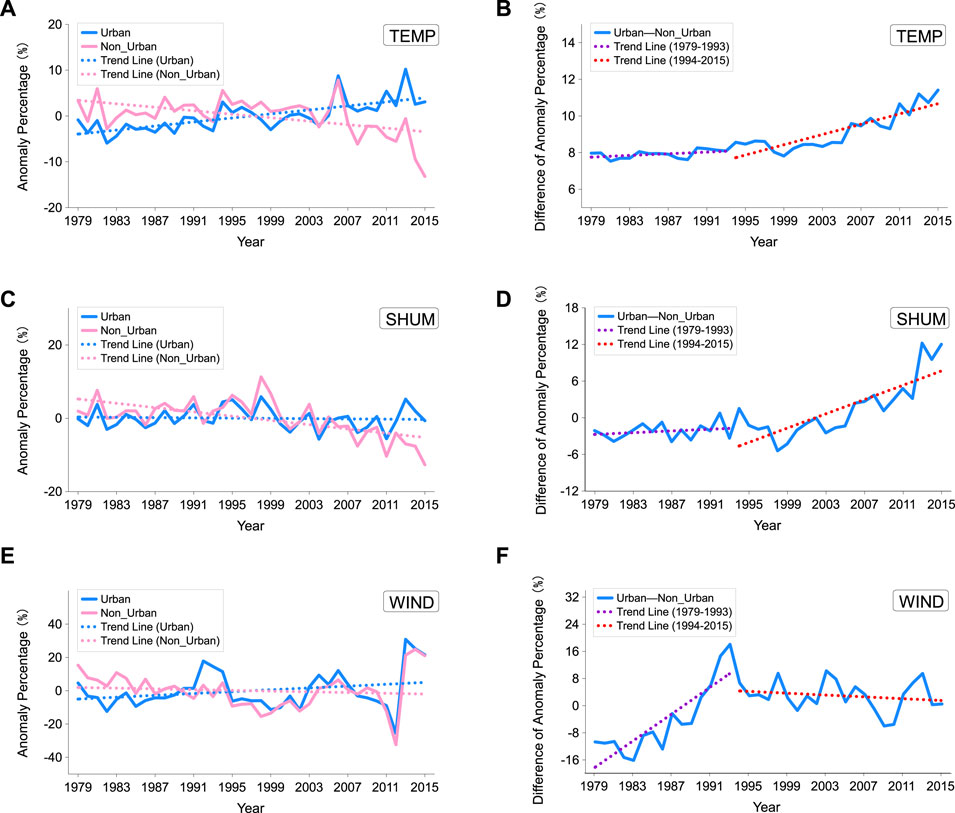
FIGURE 8. Comparison of annual average temperature (TEMP), specific humidity (SHUM), and wind speed (WIND) in the Sichuan–Chongqing area in urban and non-urban areas between 1979 and 2015: (A,C, and E) show anomaly trends (%), and (B,D, and F) show anomaly differences (%).
In addition, the difference in atmospheric humidity between urban and non-urban areas has increased annually (Figures 8C,D). The relatively high roughness of urban surfaces coupled with the UHI circulation leads to greater mechanical and thermal turbulence relative to the suburbs. Moreover, the amount of water vapor transported vertically to the upper layer through turbulence is more significant in urban areas than in non-urban areas. This results in a stronger upward motion, leading to more moist convections that supply water vapor for heavy summer precipitation. In addition, the uneven heights of city buildings can act as mechanical obstacles to airflow, triggering turbulence and uplift, and affecting vertical airflow. Due to the relatively high surface roughness of cities, airflow tends to decelerate on approach, which can also increase the duration of precipitation event. Indeed, as shown in Figures 8E,F, the annual mean wind speed in the Sichuan–Chongqing urban areas decreased overall between 1979 and 2015. Air masses can be blocked by cities, converging in downwind areas and resulting in upward air motion (Cotton and Pielke, 2007). This further enhances atmospheric convergence (Bornstein and Lin, 2000) and alters momentum, heat, and water exchanges between the land surface and atmosphere (Crutzen, 2004). Collectively, these factors likely contributed to the observed increases in precipitation during the FUDS in the Sichuan–Chongqing region.
4 Conclusion and Future Research
We provide the first analysis of changes in precipitation events in the Sichuan–Chongqing area as a consequence of rapid urbanization based on high-spatiotemporal-resolution meteorological reanalysis data and land cover between 1979 and 2015. We adopted six precipitation evaluation indices alongside spatiotemporal, probability, and mechanism analyses to analyze the distribution and evolution of extreme precipitation events before and during urbanization. Based on our results, we draw the following main conclusions:
1) In terms of spatial characteristics, extreme precipitation events in the Sichuan–Chongqing area were primarily concentrated in the highly urbanized Sichuan basin, and extreme precipitation occurred more frequently in urban areas during the FUDS.
2) Between 1979 and 2015, the impact of urbanization on summertime precipitation trends was prominent. In particular, rapid urbanization since 1994 has been associated with increases in the amount and intensity of extreme summer precipitation events.
3) In addition to large-scale climate change, the UHI effect and changes in underlying urban surface characteristics caused by rapid urbanization may have played critical roles in enhancing extreme summer precipitation in the Sichuan–Chongqing area.
Overall, our results highlight how urbanization can lead to changes in precipitation characteristics, having impacts on local climates and altering extreme precipitation trends. This implies that with the continuous growth in the global urban population, an increasing number of urban agglomerations and their associated impacts on land use and land cover changes will result in the widespread alteration of precipitation patterns.
Extreme precipitation events have an increasing impact on natural climate factors and human social and economic activity. However, studies on the impact of urbanization on extreme precipitation have primarily been focused at the local scale, whereas the understanding of regional-scale influences is still lacking. Furthermore, while we focused on the relationships between extreme summer precipitation and rapid urbanization, the mechanisms underpinning urban thermal, dynamic, and water vapor dynamics and extreme precipitation still need to be established. This could be achieved using numerical simulation and verification based on regional climate models. Finally, we suggest that the understanding of physical cloud-formation processes in urban areas needs to be deepened to establish reliable early warning and forecasting schemes for extreme regional-scale precipitation events.
Data Availability Statement
The original contributions presented in the study are included in the article/Supplementary Material, further inquiries can be directed to the corresponding author.
Author Contributions
HW and YY conceived the study and designed the study. HW wrote the manuscript. QC, FZ, and LT processed the data. KL and XF interpreted the study’s implications and provided discussion and future research suggestions.
Funding
This work was supported by a Project of the Sichuan Department of Science and Technology (2022YFS0541), the Key Laboratory of Atmospheric Sounding Program of China Meteorological Administration (2021KLAS02M), the National Key R&D Program of China (2018YFC1506104), Special Funds for the Central Government to Guide Local Technological Development (2020ZYD051), and Application Basic Research of Sichuan Department of Science and Technology (2019YJ0316).
Conflict of Interest
The authors declare that the research was conducted in the absence of any commercial or financial relationships that could be construed as a potential conflict of interest.
Publisher’s Note
All claims expressed in this article are solely those of the authors and do not necessarily represent those of their affiliated organizations, or those of the publisher, the editors, and the reviewers. Any product that may be evaluated in this article, or claim that may be made by its manufacturer, is not guaranteed or endorsed by the publisher.
Acknowledgments
The authors would like to express their sincere thanks to the National Tibetan Plateau Data Center and the Climate Data Store for providing the research data used in this study.
References
Ackerman, B., Changnon, S. A., Dzurisin, G., Gatz, D. L., Grosh, R. C., Hilbers, S. D., et al. (1978). Summary of METROMEX, Volume 2. in Causes of Precipitation Anomalies. Urbana, Illinois: Illinois State Water Survey Bulletin.
Al-Zahrani, M. A. (2018). Assessing the Impacts of Rainfall Intensity and Urbanization on Storm Runoff in an Arid Catchment. Arab. J. Geosci. 11, 1–14. doi:10.1007/s12517-018-3569-4
Baik, J.-J., Kim, Y.-H., Kim, J.-J., and Han, J.-Y. (2006). Effects of Boundary-Layer Stability on Urban Heat Island-Induced Circulation. Theor. Appl. Climatol. 89, 73–81. doi:10.1007/s00704-006-0254-4
Bornstein, R., and Lin, Q. (2000). Urban Heat Islands and Summertime Convective Thunderstorms in Atlanta: Three Case Studies. Atmos. Environ. 34, 507–516. doi:10.1016/s1352-2310(99)00374-x
Changnon, S. A., Shealy, R. T., and Scott, R. W. (1991). Precipitation Changes in Fall, Winter, and Spring Caused by St. Louis. J. Appl. Meteor. 30, 126–134. doi:10.1175/1520-0450(1991)030<0126:pcifwa>2.0.co;2
Changnon, S. A. (1979). What to Do about Urban-Generated Weather and Climate Changes. J. of Am. Plan. Assoc. 45, 36–47. doi:10.1080/01944367908976937
Chen, S., Zhang, L., Zhang, Y., Guo, M., and Liu, X. (2020). Evaluation of Tropical Rainfall Measuring Mission (TRMM) Satellite Precipitation Products for Drought Monitoring over the Middle and Lower Reaches of the Yangtze River Basin, China. J. Geogr. Sci. 30, 53–67. doi:10.1007/s11442-020-1714-y
Cotton, W. R., and Pielke, R. A. S. (2007). Human Impacts on Weather and Climate. Cambridge:: Cambridge University Press. doi:10.1017/CBO9780511808319Human Impacts on Weather and Climate
Crutzen, P. (2004). New Directions: The Growing Urban Heat and Pollution ?island? Effect?impact on Chemistry and Climate*1. Atmos. Environ. 38, 3539–3540. doi:10.1016/j.atmosenv.2004.03.032
Da Silva, R. M., Santos, C. A. G., Moreira, M., Corte-Real, J., Silva, V. C. L., and Medeiros, I. C. (2015). Rainfall and River Flow Trends Using Mann-Kendall and Sen's Slope Estimator Statistical Tests in the Cobres River Basin. Nat. Hazards 77, 1205–1221. doi:10.1007/s11069-015-1644-7
Fujibe, F., Yamazaki, N., Katsuyama, M., and Kobayashi, K. (2005). The Increasing Trend of Intense Precipitation in Japan Based on Four-Hourly Data for a Hundred Years. Sola 1, 41–44. doi:10.2151/sola.2005-012
Gu, X., Zhang, Q., Singh, V. P., and Shi, P. (2017a). Non-stationarities in the Occurrence Rate of Heavy Precipitation across China and its Relationship to Climate Teleconnection Patterns. Int. J. Climatol. 37, 4186–4198. doi:10.1002/joc.5058
Gu, X., Zhang, Q., Singh, V. P., and Shi, P. (2017b). Nonstationarity in Timing of Extreme Precipitation across China and Impact of Tropical Cyclones. Glob. and Planet. Change 149, 153–165. doi:10.1016/j.gloplacha.2016.12.019
Guo, H., Chen, S., Bao, A., Behrangi, A., Hong, Y., Ndayisaba, F., et al. (2016). Early Assessment of Integrated Multi-Satellite Retrievals for Global Precipitation Measurement over China. Atmos. Res. 176-177, 121–133. doi:10.1016/j.atmosres.2016.02.020
Hansen, M. C., DeFries, R. S., Townshend, J. R. G., and Sohlberg, R. (2000). Global Land Cover Classification at 1 Km Spatial Resolution Using a Classification Tree Approach. Int. J. of Remote Sens. 21, 1331–1364. doi:10.1080/014311600210209
Hansen, M., DeFries, R., Townshend, J., and Sohlberg, R. (1998). UMD Global Land Cover Classification, 1 Kilometer, 1.0. University of Maryland:: Department of Geography, University of Maryland. Available at http//www.glcf.umd.edu/data/landcover/ (Accessed August 26th, 2021).
He, J., Yang, K., Tang, W., Lu, H., Qin, J., Chen, Y., et al. (2020). The First High-Resolution Meteorological Forcing Dataset for Land Process Studies over China. Sci. Data 7, 25. doi:10.1038/s41597-020-0369-y
Hu, H. R., Mao, X. L., and Liang, L. (2009). Temporal and Spatial Variations of Extreme Precipitation Events of Flood Season over Sichuan Basin in Last 50 Years. Acta Geogr. Sin. 64, 278–288. doi:10.11821/xb200903003
Huang, R. H., Yong, L., Wang, L., and Wang, L. (2012). Analysis of the Causes of Severe Drought Occurring in Southwest China from the Fall of 2009 to the Spring of 2010. Chin. J. Atmos. Sci. 36, 443–457. doi:10.3878/j.issn.1006-9895.2011.11101
Huff, F. A., and Changnon, S. A. (1972). Climatological Assessment of Urban Effects on Precipitation at St. Louis. J. Appl. Meteor. 11, 823–842. doi:10.1175/1520-0450(1972)011<0823:caoueo>2.0.co;2
Karl, T. R., and Knight, R. W. (1998). Secular Trends of Precipitation Amount, Frequency, and Intensity in the United States. Bull. Amer. Meteor. Soc. 79, 231–241. doi:10.1175/1520-0477(1998)079<0231:stopaf>2.0.co;2
Li, Z., Yan, Z., Tu, K., and Wu, H. (2015). Changes of Precipitation and Extremes and the Possible Effect of Urbanization in the Beijing Metropolitan Region during 1960-2012 Based on Homogenized Observations. Adv. Atmos. Sci. 32, 1173–1185. doi:10.1007/s00376-015-4257-x
Liang, P., and Ding, Y. (2017). The Long-Term Variation of Extreme Heavy Precipitation and its Link to Urbanization Effects in Shanghai during 1916-2014. Adv. Atmos. Sci. 34, 321–334. doi:10.1007/s00376-016-6120-0
Liao, J. B., Wang, X. M., Li, Y. X., and Xia, B. C. (2011). An Analysis Study of the Impacts of Urbanization on Precipitation in Guangzhou. J. Meteorol. Sci. 31, 384–390. doi:10.3969/j.issn.1009-0827.2011.04.004
Liu, F., Ouyang, Y., Wang, B., Yang, J., Ling, J., and Hsu, P.-C. (2020). Seasonal Evolution of the Intraseasonal Variability of China Summer Precipitation. Clim. Dyn. 54, 4641–4655. doi:10.1007/s00382-020-05251-0
Liu, X., and Yin, Z.-Y. (2001). Spatial and Temporal Variation of Summer Precipitation over the Eastern Tibetan Plateau and the North Atlantic Oscillation. J. Clim. 14, 2896–2909. doi:10.1175/1520-0442(2001)014<2896:satvos>2.0.co;2
Luo, Y., Chen, C., Ma, Z., Liu, J., Li, X., and Yang, R. (2019). Characteristics and Causes of Regional Extreme Precipitation Events in Summer over Sichuan Basin. J. Southeast Univ. Nat. Sci. Ed. 41, 128–138. (in Chinese)
Madsen, H., Lawrence, D., Lang, M., Martinkova, M., and Kjeldsen, T. R. (2014). Review of Trend Analysis and Climate Change Projections of Extreme Precipitation and Floods in Europe. J. of Hydrology 519, 3634–3650. doi:10.1016/j.jhydrol.2014.11.003
Mann, H. B. (1945). Nonparametric Tests against Trend. Econometrica 13, 245–259. doi:10.2307/1907187
Nazeri Tahroudi, M., Ramezani, Y., De Michele, C., and Mirabbasi, R. (2020). A New Method for Joint Frequency Analysis of Modified Precipitation Anomaly Percentage and Streamflow Drought Index Based on the Conditional Density of Copula Functions. Water Resour. Manage 34, 4217–4231. doi:10.1007/s11269-020-02666-6
Niyogi, D., Lei, M., Kishtawal, C., Schmid, P., and Shepherd, M. (2017). Urbanization Impacts on the Summer Heavy Rainfall Climatology over the Eastern United States. Earth Interact. 21, 1–17. doi:10.1175/ei-d-15-0045.1
Pielke, R. A., Adegoke, J., BeltraáN-Przekurat, A., Hiemstra, C. A., Lin, J., Nair, U. S., et al. (2007). An Overview of Regional Land-Use and Land-Cover Impacts on Rainfall. Tellus B Chem. Phys. Meteorology 59, 587–601. doi:10.1111/j.1600-0889.2007.00251.x
Pinker, R. T., and Laszlo, I. (1992). Modeling Surface Solar Irradiance for Satellite Applications on a Global Scale. J. Appl. Meteor. 31, 194–211. doi:10.1175/1520-0450(1992)031<0194:mssifs>2.0.co;2
Poulter, B., MacBean, N., Hartley, A., Khlystova, I., Arino, O., Betts, R., et al. (2015). Plant Functional Type Classification for Earth System Models: Results from the European Space Agency's Land Cover Climate Change Initiative. Geosci. Model Dev. 8, 2315–2328. doi:10.5194/gmd-8-2315-2015
Rodell, M., Houser, P. R., Jambor, U., Gottschalck, J., Mitchell, K., Meng, C.-J., et al. (2004). The Global Land Data Assimilation System. Bull. Amer. Meteor. Soc. 85, 381–394. doi:10.1175/bams-85-3-381
Rosenfeld, D. (1999). TRMM Observed First Direct Evidence of Smoke from Forest Fires Inhibiting Rainfall. Geophys. Res. Lett. 26, 3105–3108. doi:10.1029/1999GL006066
Sahoo, A. K., Sheffield, J., Pan, M., and Wood, E. F. (2015). Evaluation of the Tropical Rainfall Measuring Mission Multi-Satellite Precipitation Analysis (TMPA) for Assessment of Large-Scale Meteorological Drought. Remote Sens. of Environ. 159, 181–193. doi:10.1016/j.rse.2014.11.032
Schroeder, A., Basara, J., Shepherd, J. M., and Nelson, S. (2016). Insights into Atmospheric Contributors to Urban Flash Flooding across the United States Using an Analysis of Rawinsonde Data and Associated Calculated Parameters. J. Appl. Meteorol. Climatol. 55, 313–323. doi:10.1175/JAMC-D-14-0232.1
Sen, P. K. (1968). Estimates of the Regression Coefficient Based on Kendall's Tau. J. of Am. Stat. Assoc. 63, 1379–1389. doi:10.1080/01621459.1968.10480934
Su, L., Li, J., Shi, X., and Fung, J. C. H. (2019). Spatiotemporal Variation in Presummer Precipitation over South China from 1979 to 2015 and its Relationship with Urbanization. J. Geophys. Res. Atmos. 124, 6737–6749. doi:10.1029/2019JD030751
Wang, H., and He, J. (2017). Temporal and Spatial Evolution Features of Precipitable Water in China during a Recent 65-Year Period (1951-2015). Adv. Meteorology 2017, 1, 11. doi:10.1155/2017/9156737
Wang, H., Wang, L., He, J., Ge, F., Chen, Q., Tang, S., et al. (2020). Can the GPM IMERG Hourly Products Replicate the Variation in Precipitation during the Wet Season over the Sichuan Basin, China. Earth Space Sci. 7, e2020EA00. doi:10.1029/2020ea001090
Wang, H., Wei, M., Li, G., Zhou, S., and Zeng, Q. (2013). Analysis of Precipitable Water Vapor from GPS Measurements in Chengdu Region: Distribution and Evolution Characteristics in Autumn. Adv. Space Res. 52, 656–667. doi:10.1016/j.asr.2013.04.005
Wu, M., Luo, Y., Chen, F., and Wong, W. K. (2019). Observed Link of Extreme Hourly Precipitation Changes to Urbanization over Coastal South China. J. Appl. Meteorol. Climatol. 58, 1799–1819. doi:10.1175/jamc-d-18-0284.1
Xiao, F., Zhu, B., and Zhu, T. (2021). Inconsistent Urbanization Effects on Summer Precipitation over the Typical Climate Regions in Central and Eastern China. Theor. Appl. Climatol. 143, 73–85. doi:10.1007/s00704-020-03404-z
Yan, M., Chan, J. C. L., and Zhao, K. (2020). Impacts of Urbanization on the Precipitation Characteristics in Guangdong Province, China. Adv. Atmos. Sci. 37, 696–706. doi:10.1007/s00376-020-9218-3
Yin, J., Zhang, D.-L., Luo, Y., and Ma, R. (2020). On the Extreme Rainfall Event of 7 May 2017 over the Coastal City of Guangzhou. Part I: Impacts of Urbanization and Orography. Mon. Weather Rev. 148, 955–979. doi:10.1175/mwr-d-19-0212.1
Yue, S., and Pilon, P. (2004). A comparison of the power of thettest, Mann-Kendall and bootstrap tests for trend detection / Une comparaison de la puissance des teststde Student, de Mann-Kendall et du bootstrap pour la détection de tendance. Hydrological Sci. J. 49, 21–37. doi:10.1623/hysj.49.1.21.53996
Zhai, P., Zhang, X., Wan, H., and Pan, X. (2005). Trends in Total Precipitation and Frequency of Daily Precipitation Extremes over China. J. Clim. 18, 1096–1108. doi:10.1175/jcli-3318.1
Zhang, D.-L., Lin, Y., Zhao, P., Yu, X., Wang, S., Kang, H., et al. (2013). The Beijing Extreme Rainfall of 21 July 2012: “Right Results” but for Wrong Reasons. Geophys. Res. Lett. 40, 1426–1431. doi:10.1002/grl.50304
Zhang, D.-L. (2020). Rapid Urbanization and More Extreme Rainfall Events. Sci. Bull. 65, 516–518. doi:10.1016/j.scib.2020.02.002
Zhang, Q., Gu, X., Singh, V. P., Sun, P., Chen, X., and Kong, D. (2016). Magnitude, Frequency and Timing of Floods in the Tarim River Basin, China: Changes, Causes and Implications. Glob. Planet. Change 139, 44–55. doi:10.1016/j.gloplacha.2015.10.005
Zhao, Y., Zou, X., Cao, L., and Xu, X. (2014). Changes in Precipitation Extremes over the Pearl River Basin, Southern China, during 1960-2012. Quat. Int. 333, 26–39. doi:10.1016/j.quaint.2014.03.060
Keywords: urbanization, fast development, extreme precipitation event, meteorological factors, Sichuan basin
Citation: Wang H, Yan Y, Long K, Chen Q, Fan X, Zhang F and Tan L (2022) Relationships Between Rapid Urbanization and Extreme Summer Precipitation Over the Sichuan–Chongqing Area of China. Front. Earth Sci. 10:909547. doi: 10.3389/feart.2022.909547
Received: 31 March 2022; Accepted: 09 May 2022;
Published: 15 June 2022.
Edited by:
Xiefei Zhi, Nanjing University of Information Science and Technology, ChinaReviewed by:
Yi Fan, Nanjing University of Information Science and Technology, ChinaShenghui Zhou, Henan University, China
Copyright © 2022 Wang, Yan, Long, Chen, Fan, Zhang and Tan. This is an open-access article distributed under the terms of the Creative Commons Attribution License (CC BY). The use, distribution or reproduction in other forums is permitted, provided the original author(s) and the copyright owner(s) are credited and that the original publication in this journal is cited, in accordance with accepted academic practice. No use, distribution or reproduction is permitted which does not comply with these terms.
*Correspondence: Keji Long, longkeji945@163.com