Seismic Risk Assessment of Multiple Cities: Biases in the Vulnerability Derivation Methods for Urban Areas With Different Hazard Levels
 Maria Camila Hoyos
 Andres Felipe Hernandez
- 1Independent Seismic Risk Consultant, Bogota, Colombia
- 2Institut des Sciences de la Terre, Université Grenoble Alpes, Grenoble, France
Previously, it has been shown that probabilistic seismic risk assessments (PSRAs) at urban scale present important discrepancies when compared with analyses conducted using methodologies from regional or national PSRA. However, conducting site-specific urban-scale analyses for a considerable number of cities may not be feasible due to limitations in time, resources, and in some cases availability of information, and thus more general models or methodologies are used. This brings into the picture the importance of identifying and quantifying the possible biases, discrepancies, and uncertainties when using different methods, both in the hazard and vulnerability components. Regarding the latter, several sources of uncertainty and biases have been identified in 1) the selection of ground motion records, either by using a general pool of records such as the ones from FEMA P695 or by performing a site- or hazard-specific analysis that requires a significant effort, especially in areas with a poor history of seismic instrumentation and even more in regions with no evidence of previous PSRA at all; and 2) the fragility or vulnerability derivation nonlinear dynamic methods: incremental dynamic analysis [IDA], cloud analysis [CA], and multi-stripe Analysis [MSA], among others. Focusing on these sources of uncertainty and bias, and with the challenge to bring solutions for places with scarce information, in this study, we aim to explore the use of different vulnerability derivation assumptions for the three principal cities of Colombia: Bogota, Medellin, and Cali, where most of the economic growth is concentrated. This considers the different seismic hazard levels and tectonic environment contributions in each city. Afterward, a comparison between the results of the analysis without the hazard-specific record selection and the site-specific one for each city is performed to establish the cases in which the former is applicable without adding more biases or uncertainties in the process.
1 Introduction
Probabilistic seismic risk assessment (PSRA) at the urban scale has become a critical tool for local governments, disaster risk reduction offices, and insurers in the definition of long-term actions for risk management in cities such as the response planning after an event, the definition of city-specific insurance plans, and the overall urban planning. This considering that cities concentrate 80% of the GDP generation worldwide and 56% of the global population, with an estimation to increase to 68% by mid-century (United Nations, 2019).
In recent decades, earthquake disaster risks in cities have increased mainly due to the high rate of urbanization, lack of urban planning, and inadequate or uncontrolled construction practices, among others. Because of this, special attention has been given to the analysis of urban environments with the inclusion of specific targets, indicators, or goals for urban resilience in the sustainable development goals (Goal 11), the Sendai framework for disaster risk reduction (Indicator E2), and The New Urban Agenda (United Nations, 2015; United Nations Office for Disaster Risk Reduction, 2015; United Nations, 2016).
Considering this new demand for urban-specific models, many studies have downsized the methodologies followed for global, regional, or national PSRAs, without much consideration of the implications and biases generated in the process. From the three main inputs of a seismic risk model, hazard, exposure, and vulnerability, this is particularly true for the vulnerability component. As stated by Kohrangi et al. (2017b), when deriving vulnerability models for portfolios in multiple cities, even if they have different hazard characteristics, the common engineering practice is to use a pool of general records regardless of their consistency with the hazard at each site, which has been shown to lead to potentially biased risk estimates, even under a “sufficient” intensity measure (IM). For this reason, some studies have proposed methods to reduce this bias by improving the record selection (Jayaram et al., 2011; Lin et al., 2013b) by modifying the general pool of records to include in some way the expected spectral shape of the site (Haselton et al., 2011) or by using more “sufficient” and “efficient” IMs as the average spectral acceleration—AvgSa (De Biasio et al., 2014; Eads et al., 2015; Kohrangi et al., 2017a).
Among those studies, Kohrangi et al. (2017b) established that identical buildings should be characterized by different vulnerability functions at different sites because the magnitude of the earthquakes around the site and the distance to the nearby faults, among others, can modify the type of ground motions that could occur at each site. In this regard, there has been an ever-growing group of studies comparing the results in terms of fragility or vulnerability curves or even risk estimates between analyses considering general pools of records such as the FEMA P-695 far-field set (Federal Emergency Management Agency, 2009) with the ones using more detailed site-specific record selection methodologies (Lin et al., 2013a; Kohrangi et al., 2017a; Kohrangi et al., 2020). Overall, it has been shown that there is no general rule to follow and that the use of a general pool of records or a specific one should be based on more careful consideration of the characteristics of the hazard in the site, the expected ground motions, the structures to analyze, and the availability of resources.
Another important source of uncertainty comes from using different fragility derivation methodologies as each one considers different assumptions, follows different methodologies, and needs specific inputs that could add to the uncertainties of the fragility derivation process. Among the nonlinear dynamic models that use time-history analyses within the analytical fragility derivation methods, incremental dynamic analysis, multi-stripe analysis, and cloud analysis have been given much attention. As in the previous case, some studies have conducted comparisons between the different derivation methods, illustrating the variabilities that can be encountered in the process and giving recommendations on when each one should be considered based on the limitations and benefits of each method (Jalayer, 2003; Mackie and Stojadinovi, 2005; Baker, 2015; Jalayer et al., 2017). However, as with its ground motion selection counterpart, many studies are based on specific case studies and thus their considerations apply only in similar scenarios to those that have been studied. For this reason, there is a need to study in more regions and under different assumptions if the conditions to use one or the other are fulfilled or if there needs to be special care under some circumstances when using one procedure over the other.
Considering this and the small number of studies that have been presented analyzing nonengineered structures located in urban environments exposed to different hazard levels and with different tectonic regime contributions, we aim to provide a reference to establish if the methods currently used in the engineering practice are applicable under these conditions. For the case study, we will derive fragility functions for the three archetype buildings previously presented in Hoyos and Hernández (2021) for the three principal cities of Colombia, Bogota, Medellin, and Cali, where each one is exposed to a different hazard level and different tectonic regime contributions. In the following sections, we will present the methodologies that will be used and compared within the scope of this research, followed by the specifics of the case study included in a more detailed manner, the characteristics of the sites, and the structures to be analyzed. Later, the record selection process is described, and the fragility curves derived following the different record selection procedures and nonlinear dynamic fragility derivation methodologies are shown and compared, establishing the biases incurred in each case and giving some recommendations on when the analyses of some of the structures should be performed.
2 Methodology
2.1 Record Selection
A set of records must be used to perform the fragility analysis and for this, two different approaches were determined, using a hazard-specific selection through the conditioned spectrum (CS) as well as using the most common set of records from the FEMA P695 (Federal Emergency Management Agency, 2009).
2.1.1 Conditioned Spectrum
The CS method (Jayaram et al., 2011) was used to select the ground motion records by computing the mean scenario (i.e., mean magnitude, M, mean distance, R, and mean epsilon, ε) that best represents the site of analysis for the selected intensity measure level types (Harmsen, 2001) and tectonic regimes. There are several variations of this approach (Lin et al., 2013), but what we followed is the so-called “approximate” method where the CS is estimated using the mean values of magnitude and distance as well as the logic-tree weights of the ground motion prediction models. To perform this method, correlation models for the tectonic regimes of active shallow crust and subduction were considered (Jayaram and Baker, 2009; Jaimes and Candia, 2019).
The advantage of this method is the definition not only of the target intensities but also the spectral shape of all the records selected, which in comparison to other scaling methods provides a much more accurate and realistic spectral shape.
2.1.2 FEMA
The site-independent far-field set of 44 records from the FEMA P695 was used as a comparison method because it is a common practice to perform nonlinear dynamic analysis with them, but without the proper assessment of which cases, these scenarios are suitable to be used.
2.2 Nonlinear Dynamic Methods for Fragility Curve Derivation
Among the literature on the topic, there are three main nonlinear dynamic methods for the derivation of analytical fragility models: the incremental dynamic analysis—IDA (Vamvatsikos and Cornell, 2002), the multi-stripe analysis—MSA (Jalayer, 2003; Jalayer and Cornell, 2009), and the cloud analysis—CA (Cornell et al., 2002) which are the ones considered in this study, clarifying that the adaptative IDA version—AIDA (Lin and Baker, 2013) was considered instead of the IDA when the CS selected set of records was used, and the Bayesian CA (Jalayer et al., 2015) following the procedure reported in Martins and Silva (2020) was used instead of the original CA. For the derivation of fragility curves, the IDA considers a fixed suite of records scaled successively to higher intensity levels, where each ground motion in the suite is scaled until it causes structural collapse. This method was the one followed when deriving the fragility curves using the FEMA P695 far-field record set. The AIDA follows a similar principle but considers different suites of records that are scaled to multiple IMs while they fulfill the hazard characteristics at said IM level, and thus not one but many curves are generated across the multiple bins selected by connecting the records that are repeated from one level to the other.
The MSA, on the other hand, establishes some discrete intensity levels and includes in each a different set of ground motions selected based on site-specific characteristics considering methods such as the CS. This is done since the representative ground motions (and thus their properties) change at each IM level and with the objective to avoid one of the criticisms of the IDA methodology, the over-scaling of the records. This consideration of the local hazard characteristics makes it the most accurate or reliable method if a significant number of records is available for each IM level. Finally, the CA considers performing a regression fitting between the IM and the engineering demand parameter—EDP—in the logarithmic space. Its updated Bayesian version goes one step ahead and includes a differentiation in the regression between the cases where the structure exceeds the collapse limit state and indeed collapses and where it does not.
3 Case Study
Colombia is located in the northwestern part of South America where the interaction between the tectonic plates of Nazca, the Caribbean, and South American, as well as the Panama and North Andes blocks produces deformations that trigger events in the country of different characteristics, some of them with destructive consequences in the past. This complex tectonic environment generates several geologic faults along the three branches of the Andes Mountains from Ecuador to Venezuela.
Then, to study the effect of different hazard intensity levels and the contributions of different tectonic regimes and thus different hazard scenarios, the three main cities in Colombia, Bogotá, Medellín, and Cali, are included in the case study (Figure 1). These are the cities with the largest contribution to the GDP in the country and account for more than 20% of the total population of the country (DANE, 2018). All of them are located in the central part of the country; Bogota is in the eastern Cordillera, while Medellin and Cali are between the central and western branches. The proximity of these cities with some traces of active shallow faults as well as the subduction events generated on the Pacific coast, and the history of destructive events in the past such as the Mw 6.1 Armenia earthquake on 25 January 1999, is sufficient enough to develop and execute plans for the prevention and mitigation of seismic risk in the country.

FIGURE 1. Location of Bogota, Medellin, and Cali as well as some characteristics of the seismicity in the country. Dash-dotted lines: active faults traces. Continuous lines: boundary tectonic plates.
The seismic hazard model (SHM) used is provided by the Colombian Geological Survey which was made in collaboration with the Global Earthquake Model Foundation and takes into account the seismological and geologic studies in the country as well as a homogeneous earthquake catalog from the national seismological network updated until 2020. A detailed study of the intensity levels registered by the national accelerometric network allowed the authors of the SHM to establish a selection of ground motion prediction models that, using a logic tree, take into account the uncertainty in the intensity levels estimation. The SHM has four different tectonic regimes that contribute to the seismic hazard levels in the country: active shallow crust, subduction interface, subduction intraslab, and deep seismicity. However, for the cities of Bogota, Medellin, and Cali, the seismic sources of active shallow crust and subduction are the most relevant. For more details on the seismic hazard model, the reader could refer to (SGC, 2018; Arcila et al., 2020).
Three different structural types, representative of some of the most common vulnerable building classes in Colombia and ranging from the short to the medium structural period, are considered in the case study: the two-storey unreinforced masonry structures (MUR-H2) and the four-storey (CR-H4) and eight-storey (CR-H8) pre-code reinforced concrete buildings. The structural characteristics of the archetype buildings were taken considering the local 1 type of structures reported in Hoyos and Hernández (2021), which are presented in Table 1.
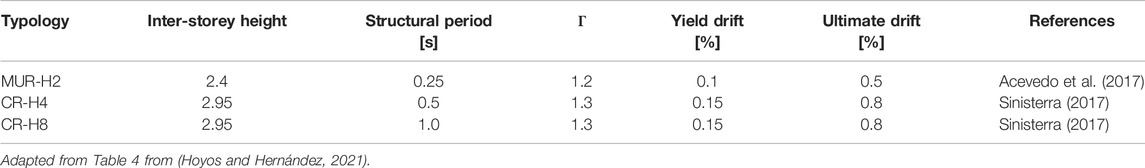
TABLE 1. Main characteristics of the different typologies considered in the analysis.
Taking the values of the characteristics reported in Table 1 and using Eqs 1, 2 taken from Villar-Vega et al., (2017), the capacity curves of the equivalent single degree of freedom—SDOF—model in terms of Sa and Sd were derived. These curves are presented in Figure 2.
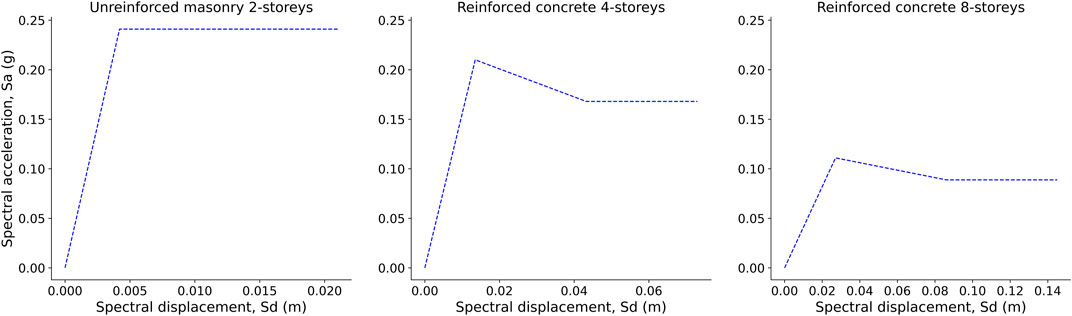
FIGURE 2. Capacity curves for the three typologies considered. Left: unreinforced masonry two-storeys (MUR-H2). Center: reinforced concrete four-storeys (CR-H4). Right: reinforced concrete eight-storeys (CR-H8).
(adapted Villar-Vega et al., 2017)where C = 1.0 for the two-story masonry structure and C = 0.8 for the concrete structures.
4 Record Selection
The seismic hazard levels or target levels used to scale the ground motion records were computed for the three cities using the seismic hazard model by Arcila et al. (2020), which is developed in OpenQuake software (Pagani et al., 2014; Silva et al., 2014). The contributions per tectonic environment were estimated for the sites of analysis at different return periods, and as a result, the dominant sources that contribute to the hazard of those cities come from the active shallow crust and subduction (interface and intraslab) tectonic environments. Figure 3 presents the contribution to the hazard for each city and structural period studied at ten different intensity measure levels or return periods (from 73 to 100,000 years). As it can be seen, the contribution of deep seismicity sources is minimum for all cities; so from now on, it will not be taken into account in further analysis. Likewise, in Bogota, only sources of the active shallow crust will be considered because they represent almost all the contributions to the hazard. On the contrary, in Cali, the higher contribution comes from the subduction sources, but a small proportion of the active shallow crust is still present. Medellin, on the other hand, presents a balanced proportion between sources of active shallow crust and subduction.
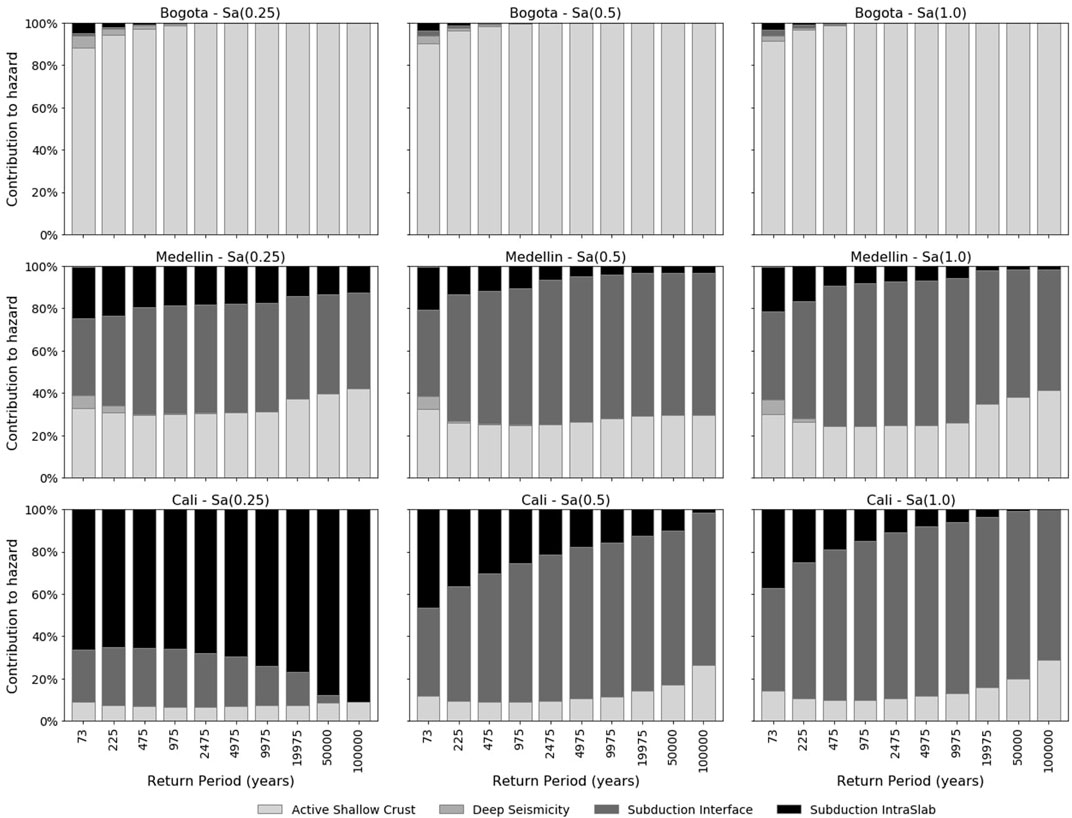
FIGURE 3. Tectonic regime contribution in the three cities: Bogotá (top), Medellín (center), and Cali (bottom) for the three-building types: two-story unreinforced masonry (left), four-story reinforced concrete (center), and eight-story reinforced concrete (right), for different return periods.
Ten different intensity measure levels (IMLs) were established to obtain the target intensity values at the intensities measured close to the fundamental periods, T1, of the systems presented in Table 1, to increase the efficiency and ensure lower uncertainties in the response predictions (Luco and Cornell, 2007). Figure 4 shows the hazard curves of the three cities for the intensity measures (IMs) considered, Sa(0.25s), Sa(0.5s), and Sa(1.0s). The figure depicts in each case the total hazard curve as well as the contribution of active shallow crust (ASC), subduction interface (SUB Interface), and subduction intraslab (SUB Inslab). As it can be seen, Cali is the city with the highest hazard levels for all the IMs due to the proximity to subduction sources on the Pacific coast, while Bogota as stated before only has an important contribution of active shallow sources.
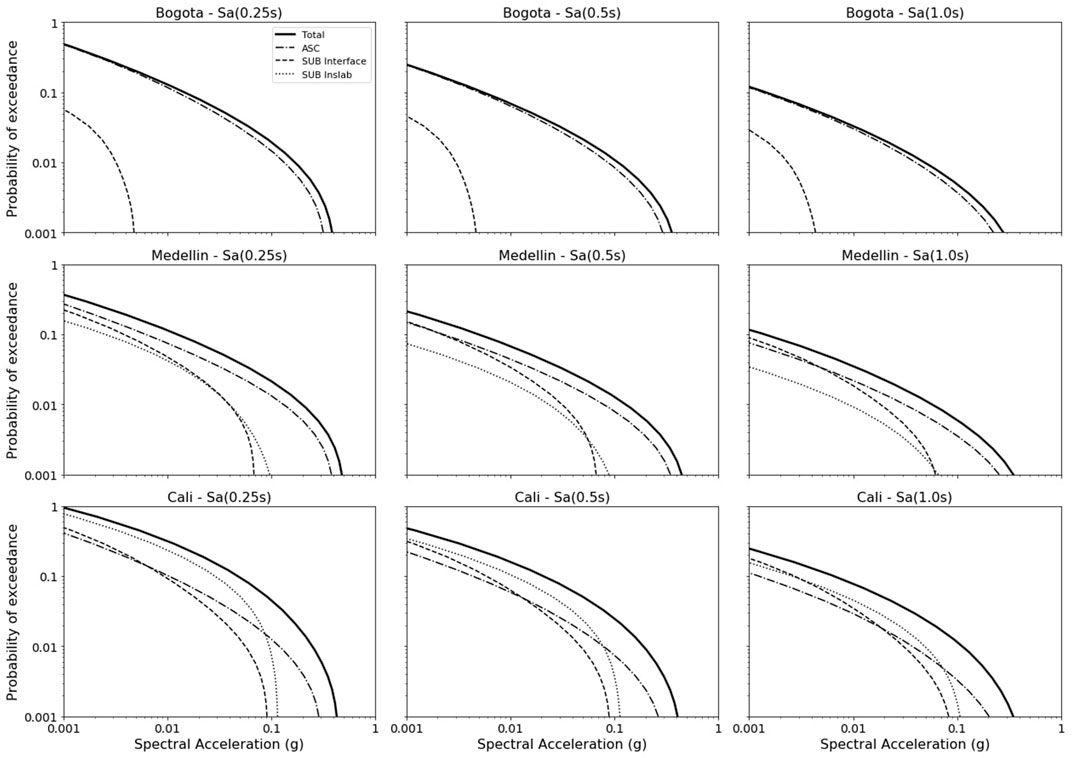
FIGURE 4. Uniform hazard spectra for 10% probability of exceedance (poe) for Sa (0.25 s) left, Sa (0.5 s) center, and Sa (1.0 s) right for the three cities: Bogotá (top), Medellín (center), and Cali (bottom).
It is worth mentioning that the target intensity levels were estimated per each case for the different tectonic environments and not for the total hazard, as well as considering a response on rock (soil type B). In the view of the authors, using target values much higher than that could occur according to the hazard model, leading to an overestimation of the intensity levels in the records selected. Therefore, the record selection was performed independently for active shallow crust and subduction (interface and intraslab).
The accelerograms were collected from several ground motion databases worldwide that include events for the tectonic environments presented in the analysis, such as Pacific Earthquake Engineering Research (PEER) NGA-West2 (Ancheta et al., 2014), NGA-Sub (Bozorgnia, 2020), Colombian Geological Survey (SGC, 2022), K-NET and KiK-net networks (NIED, 2022), National Seismological Service of Mexico (SSN-UNAM, 2022), and the SIBER-RISK strong motion database of Chilean earthquakes (Castro et al., 2020). A set of about 200 records was found per each case (i.e., city and structural period), ensuring that when no records were available for a particular target intensity value, a maximum scaling factor of 5.0 was set as a threshold. Then, to unify all the records, we used the contributions of the hazard excluding the deep seismicity sources to create a set of about 1800 records in total for all the cases. Table 2 presents the proportion of the number of events selected per case.
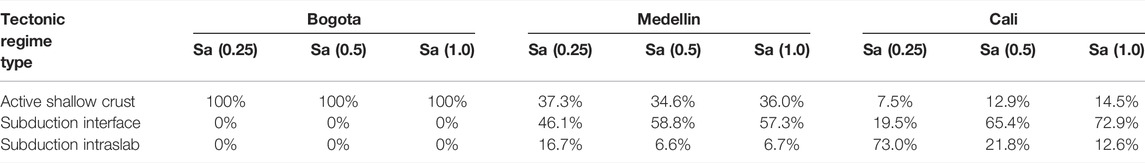
TABLE 2. Percentages of the number of events selected for each city, structural period, and tectonic regime type.
4.1 Conditioned Spectra
Figure 5 shows the response spectrum from the records selected and scaled for the intensity measure level of 10% probability of exceedance (i.e., 475 years return period) in Bogota, Medellin, and Cali for the active shallow crust tectonic regime type, on each of the three intensity measures of interest, Sa (0.25 s), Sa (0.5 s), and Sa (1.0 s). As it can be seen from the figure, all the response spectra follow the shape of the conditioned spectrum (CS) and more or less are between the 2.5 to 97.5 percentiles of the CS. Figures 6 and 7 present the same results as Figure 5 but for the cases of subduction intraslab and subduction interface. In those cases, only records from Medellin and Cali were selected.
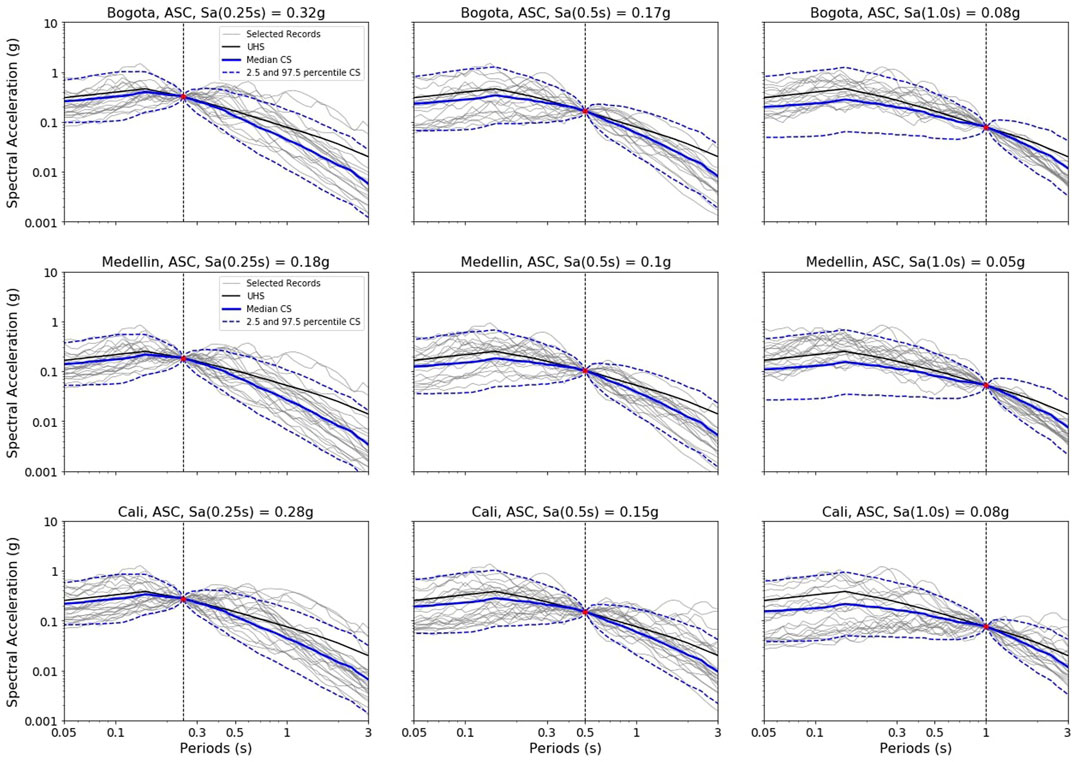
FIGURE 5. Conditioned spectra (CS), response spectra from the records selected, and uniform hazard spectra (UHS) for active shallow crust at the intensity measure level of 10% probability of exceedance in 50 years for Sa (0.25 s) left, Sa (0.5 s) center, and Sa (1.0 s) right for the three cities: Bogotá (top), Medellín (center), and Cali (bottom). Continuous blue thick line: median CS. Dash-lines: 2.5 and 97.5 CS percentiles. Continuous grey thin lines: records selected.
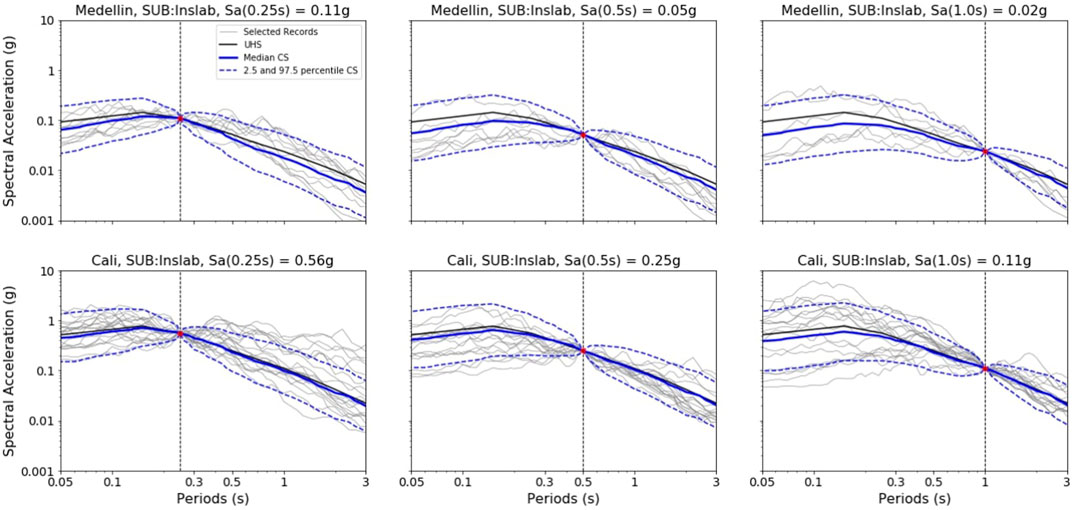
FIGURE 6. Conditioned spectra (CS), response spectra from the records selected, and uniform hazard spectra (UHS) for subduction intraslab at the intensity measure level of 10% probability of exceedance in 50 years for Sa (0.25 s) left, Sa (0.5 s) center, and Sa (1.0 s) right for the cities: Medellín (top) and Cali (bottom). Continuous blue thick line: median CS. Dash-lines: 2.5 and 97.5 CS percentiles. Continuous gray thin lines: records selected.
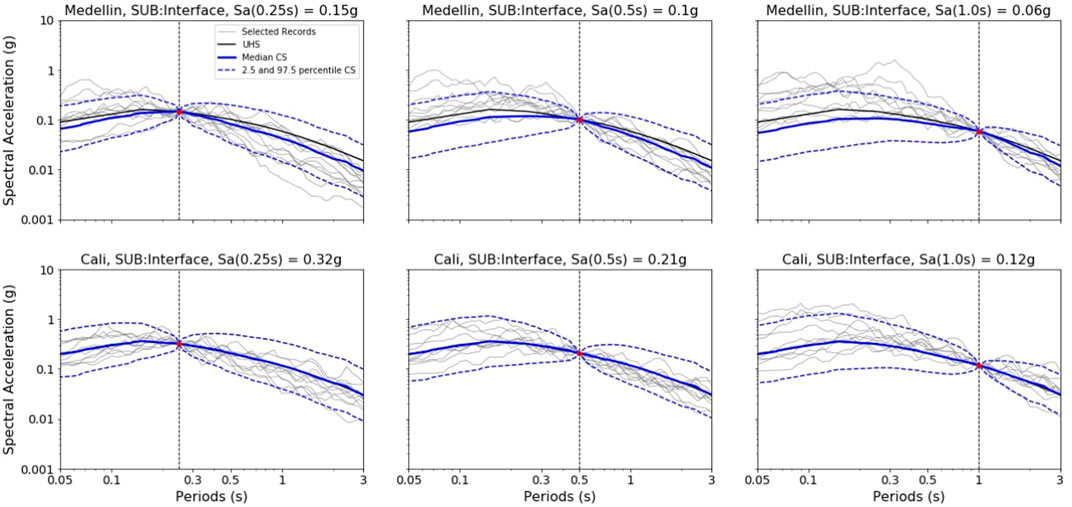
FIGURE 7. Conditioned spectra (CS), response spectra from the records selected, and uniform hazard spectra (UHS) for subduction interface at the intensity measure level of 10% probability of exceedance in 50 years for Sa (0.25 s) left, Sa (0.5 s) center, and Sa (1.0 s) right for the cities: Medellín (top) and Cali (bottom). Continuous blue thick line: median CS. Dash-lines: 2.5 and 97.5 CS percentiles. Continuous grey thin lines: records selected.
4.2 FEMA
The FEMA records were scaled by the mean of all the 44 ground motion records to different target intensity levels. Figure 8 shows the response spectra of all the records scaled and the mean spectrum scaled to an intensity level of 0.45 g for the different intensity measures of Sa (0.25 s), Sa (0.5 s), and Sa (1.0 s). This procedure was repeated ten times from 0.15 to 1.5 g with increments of 0.15 g.
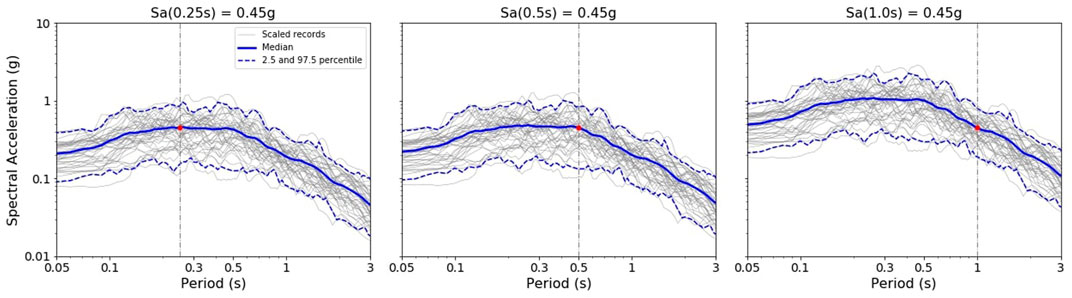
FIGURE 8. Scaled records from FEMA to the intensity level of 0.45 g for the three different intensity measures of Sa (0.25 s) left, Sa (0.5 s) center, and Sa (1.0 s) right. Gray lines: scaled records. Continuous blue line: mean. Dashed blue lines: 2.5 and 9.7 percentiles.
5 Fragility Derivation
The SDOF models for each of the structural types whose capacity curves are presented in Figure 2 were then subjected to two nonlinear time history analyses—NLTHA; the first used input ground motions those of the FEMA P695 far-field record set described in Section 2.1.2 and the second one using the CS record set for each structural type and each city as described in Section 2.1.1. The maximum IM and EDP measures for each record were then recorded and later used to derive fragility functions using the methods explained in Section 2.2, considering the damage states reported in Figure 6 by Martins and Silva (2020), which are presented in Table 3.
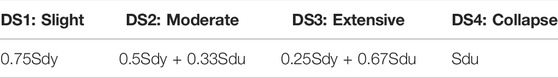
TABLE 3. Damage states used in the derivation of fragility curves.
For each method, a different procedure was followed. For the cloud analysis, a linear regression is conducted between an IM and EDP values in the logarithmic space, differentiating the noncollapse and collapse cases by censoring the last ones. The median and standard deviation of each damage state can be calculated using the procedure described in Martins and Silva (2020), which is available in the Vulnerability Modelers Toolkit open code (Martins et al., 2021). On the other hand, the IDA procedure follows the derivation of IDA curves that also provide an IM–EDP relationship. For calculating the mean and standard deviation, following an IM-based procedure, Eqs 3, 4 can be used for each damage state
where DCR is the ratio between the recorded EDP over the DS. Finally, for the MSA procedure, considering the damage matrix, for each IM used as the target, it is possible to establish how many records can cause collapse (or for other damage states how many exceed the value) and using the maximum likelihood estimator, it is possible to fit lognormal parameters for each damage state. The comparison of the fragility curves obtained from each of the methods, for each structural type in each city, is presented in Figure 9. Additionally, the comparison of the MSA curves between the three cities is presented in Figure 10. The comparison of the fragility curves obtained from each of the methods, for each structural type in each city, is presented in Figure 9. Additionally, the comparison of the MSA curves between the three cities is presented in Figure 10.
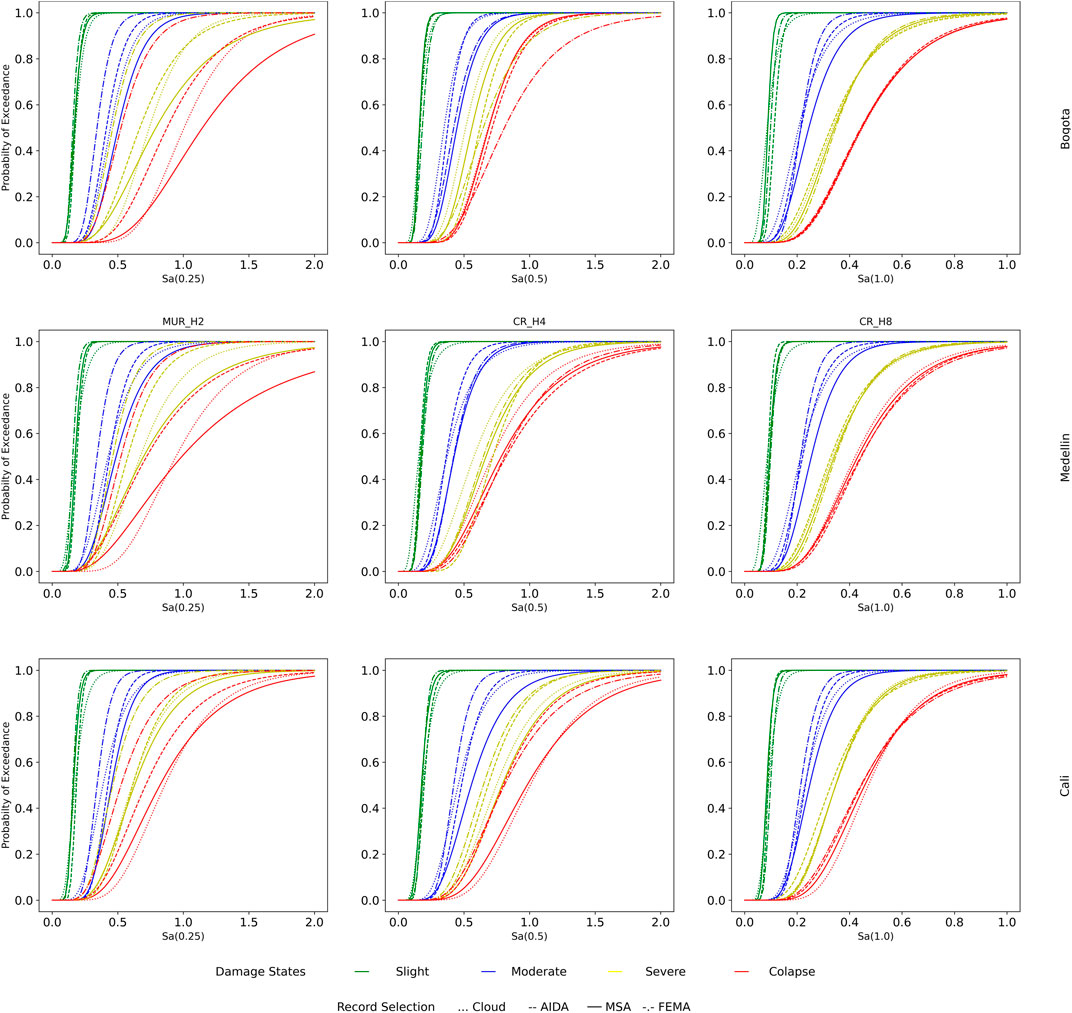
FIGURE 9. Fragility curves derived using different methods: cloud (dotted), AIDA (dashed line), MSA (continuous line), and FEMA (dotted-dashed line); in the three cities: Bogotá (top), Medellín (center), and Cali (bottom); for the three-building types: two-story unreinforced masonry (left), four-story reinforced concrete (center), and eight-story reinforced concrete (right).
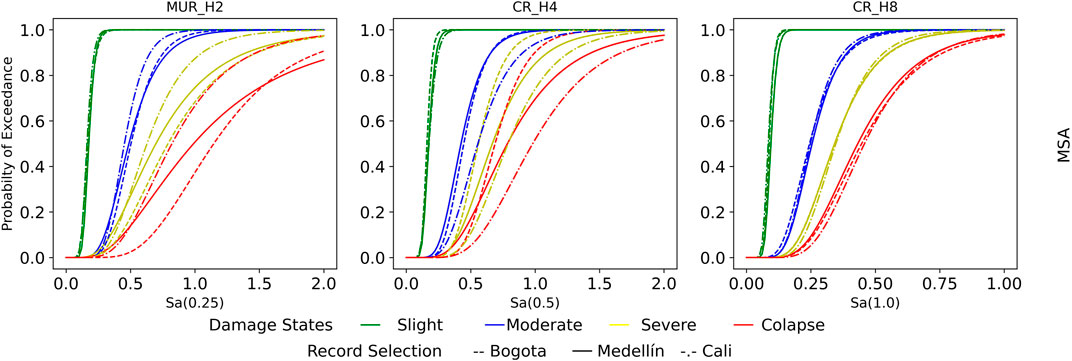
FIGURE 10. Comparison of the MSA fragility curves between the three cities: Bogotá (dashed line), Medellín (continuous line), and Cali (dotted-dashed line) for the three-building types: two-story unreinforced masonry (left), four-story reinforced concrete (center), and eight-story reinforced concrete (right).
6 Analysis of Results
There is an important variability in the results obtained for the three studied building types shown in Figures 9 and 10. In the case of the eight-story reinforced concrete building (CR-H8), the derived fragilities seem to be unaffected by the record selection approach as can be observed in the right plot of Figure 10. In this case, the differences between the curves for the three cities compared with the one derived with the FEMA P695 records are insignificant, and also the differences between the fragility derivation methods are minimal, as shown in the three plots on the right of Figure 9. Thus, for this particular building type, it could be said that the site-specific record selection, which can be more time-consuming, could be neglected as the general pool of records will give accurate results.
On the opposite side, however, the results for the two-story unreinforced masonry structure (MUR-H2) are shown to be extremely sensitive to both the record selection procedure and the fragility curve derivation methodology. Considering the former, for the three cities under study, the fragilities derived using the FEMA P695 record set largely underestimate the capacity of the structures and thus can cause extremely conservative risk results, as they are the most fragile curves in the left plots of Figure 9. On the other hand, regarding the fragility curve derivation method, there is a large dispersion in the results in particular for the severe and collapse damage states. For all cases, the MSA method gives the less conservative fragilities, while the AIDA method tends to give the most conservative ones, having the CA landing usually between both. It is interesting to see that even when the AIDA and not the original IDA is used, the results still tend to be more conservative when using this procedure than the other two methods. However, at this point, it is important to mention that given the large IMs at which the records needed to be scaled to reach collapse, there can be a considerable reduction in the number of available records that can be used for these high IMs without reaching the limit of 5 in the scale factors, and thus the results were expected to produce larger variabilities for the final damage states.
Regarding the four-story reinforced concrete structure CR-H4, there is considerable variability in the fragility curves derived using different methods for all damage states but the slight one, however, not as pronounced as in the MUR-H2 case. In this case, there is not an overall behavior present among all cities when comparing the site-specific curves with those derived from FEMA (as in the case of MUR-H2 and CR-H8). As it can be appreciated in the center plots of Figure 9, there is a similarity with the FEMA fragilities for the Medellin case; however, for Cali, the IDA using FEMA P695 far-field records tends to overestimate the capacity of the structures, while in Bogotá it underestimates it.
Considering this last point, an interesting result could be seen in the comparison between cities. As previously stated, both the MUR-H2 and the CR_H4 buildings present very different fragilities among cities (see Figure 10). In the CR-H4 case, this behavior seems to be counterintuitive when looking at the total hazard curves presented in Figure 4, as the total hazard in Cali is shown to be higher than that of Bogotá and Medellín. At this point, it is important to mention that within the selection of records using the CS procedure, given that tectonic regime-specific records were searched for, the conditioning intensity from the spectrum was that of the specific tectonic regime spectrum and not the one from the total spectrum. This considering that within the hazard model that was used, the sources of each tectonic regime cannot experience or produce values above those specifically calculated from them, and thus using the total hazard spectrum instead of the tectonic regime specific one could cause an overestimation of the demand of the site when compared with its known hazard. In this way, based on the percentages of records by the contribution of the tectonic regime in each city, that were obtained considering the disaggregation in each site and that are presented in Table 2 and looking at Figure 4, it can be seen that in some cases, the contribution of the modeled active shallow crust in Bogotá can be higher than any of the contributions of a specific regime type in Medellin and Cali. Considering this issue, further studies should be conducted to see the sensitivity and accuracy of fragility curves derived in regions with contributions of multiple sources to see if there is a considerable overestimation when assuming the total hazard spectra instead of that of each specific source.
Finally, to try to understand the overall behavior of the fragility curves, an analysis of the mean conditional spectra for the site-specific record sets and the FEMA recordset was conducted, looking into the spectral shapes of the mean response for each. Figure 11 shows the mean conditional spectra representing 10% of exceedance in 50 years for all cases. It is very interesting to see that the spectral shape of the CS in all cities for the CR-H8 structure is very similar to that of the FEMA P695 far-field recordset. This agreement in the spectra can be the cause of the similarities of the fragility curves in this case and brings up a possible analysis that can be conducted to see if the FEMA P695 recordset can indeed be used in the derivation of fragility curves at a site.
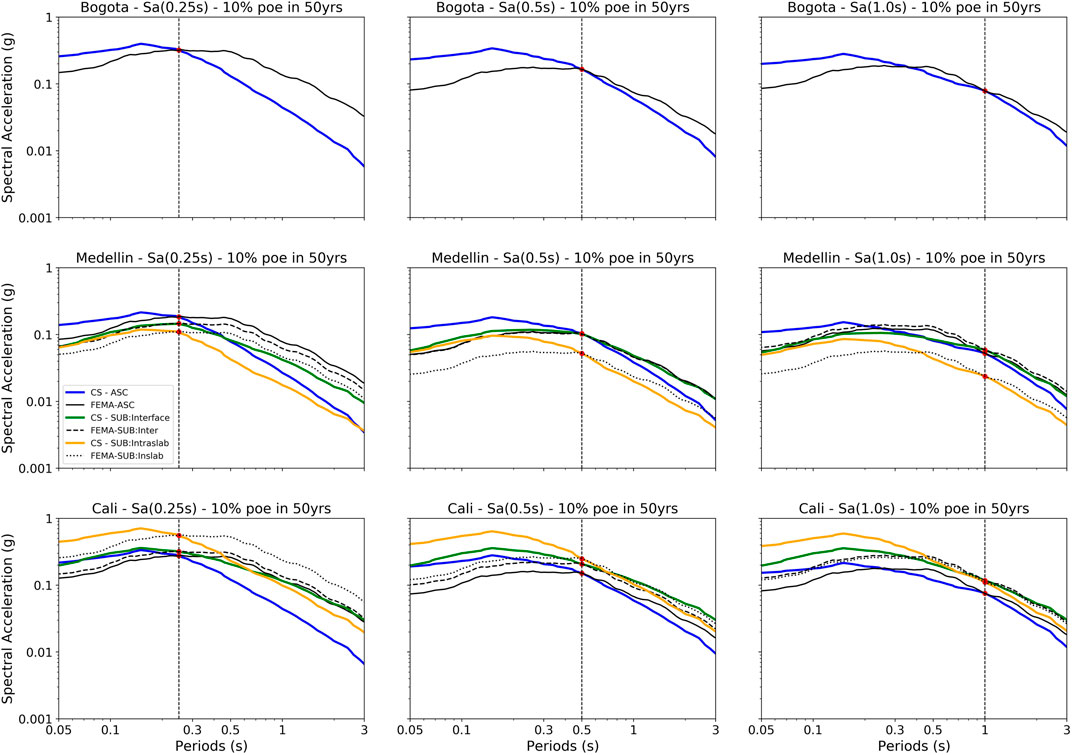
FIGURE 11. Comparison of the CS and mean FEMA spectra for 10% probability of exceedance in 50 years for Sa (0.25 s) left, Sa (0.5 s) center, and Sa (1.0 s) right for the three cities: Bogotá (top), Medellín (center), and Cali (bottom).
Continuing with the analyses of Figure 11, for the MUR-H2 case, it can be seen that in all cases, the mean spectra from the FEMA dataset differ in spectral shape from that of any of the site-specific CS in the cities and tend to be higher after the structural period of analysis (0.25s). This is why for the larger damage states, when the structures start to present cracks and elongate their period, the FEMA fragilities are more fragile than the other ones. Finally considering the CR-H4 case, a very similar spectral shape can be seen for the Medellin case (the reason why the fragilities were also so similar in that case), while for Bogotá, the mean for the FEMA records after the structural period (0.5 s) tends to fall while the ones in Cali rise.
7 Conclusion
There is no general rule to follow to choose either a record selection approach or a fragility derivation method as it should be evaluated in every specific case based on a more careful consideration of the characteristics of the hazard at the site, the expected ground motions, the structures to analyze, and the availability of resources. However, it could be seen that the spectral shape does seem to be an important parameter in the record selection method and the set of records that should be included in the analysis. Likewise, the ground motion prediction model (GMPM) plays an important role in the spectral shape of the CS and should be given more attention; in particular in sites where there is no locally derived GMPM. In this way, the use of a general set of records such as the FEMA P-695 far-field set seems appropriate for the fragility analysis of structures with medium-to-high fundamental periods. On the contrary, for a short fundamental period of vulnerable building types, a more detailed record selection should be performed as the FEMA P-695 most likely underestimates the capacity of the structures.
The use of target values much higher than what could occur according to the hazard model leads to an overestimation of the intensity levels in the records selected. Based on the hazard model used, the sources of each tectonic regime cannot experience or produce values above those specifically calculated from them, and thus using the total hazard spectrum instead of the tectonic regime specific one could cause an overestimation of the demand of the site when compared with its known hazard.
With all of these in mind, further studies should be conducted to see the sensitivity and accuracy of 1) fragility curves derived in regions with contributions from multiple sources to see if there is a considerable overestimation when assuming the total hazard spectra instead of that of each specific source; 2) the use of different GMPM to compute the conditioned spectra and the impact on the spectral shape in the record selection; 3) the consideration of using different methods in the computation of the conditioned spectra, with one or multiple GMPMs, different logic tree weights, different disaggregation weights, and by including all the possible scenarios (magnitudes and distances).
Data Availability Statement
The original contributions presented in the study are included in the article; further inquiries can be directed to the corresponding author.
Author Contributions
AH CS, record selection 50% MH NLTHA, Derivation fragility curves 50%.
Funding
This work was funded by the EU Horizon 2020 program under Grant Agreement Number 813137, ITN-MSCA URBASIS project.
Conflict of Interest
The authors declare that the research was conducted in the absence of any commercial or financial relationships that could be construed as a potential conflict of interest.
Publisher’s Note
All claims expressed in this article are solely those of the authors and do not necessarily represent those of their affiliated organizations, or those of the publisher, the editors, and the reviewers. Any product that may be evaluated in this article, or claim that may be made by its manufacturer, is not guaranteed or endorsed by the publisher.
Acknowledgments
The authors thank the Colombian Geological Survey for sharing the National Seismic Hazard Model of Colombia.
References
Acevedo, A. B., Jaramillo, J. D., Yepes, C., Silva, V., Osorio, F. A., and Villar., M. (2017). Evaluation of the Seismic Risk of the Unreinforced Masonry Building Stock in Antioquia, Colombia. Nat. Hazards 86 (S1), 31–54. doi:10.1007/s11069-016-2647-8
Ancheta, T. D., Darragh, R. B., Stewart, J. P., Seyhan, E., Silva, W. J., Chiou, B. S.-J., et al. (2014). NGA-West2 Database. Earthq. Spectra 30 (3), 989–1005. doi:10.1193/070913EQS197M
Arcila, M., Garcia, J., Montejo, J., Eraso, J., Valcacer, J., Mora, M., et al. (2020). Modelo Nacional De Amenaza Sísmica Para Colombia. Servicio Geológico Colombiano. doi:10.32685/9789585279469
Baker, J. W. (2015). Efficient Analytical Fragility Function Fitting Using Dynamic Structural Analysis. Earthq. Spectra 31 (1), 579–599. doi:10.1193/021113EQS025M
Bozorgnia, Y. (2020). Data Resources for NGA-Subduction Project. NGA-Subduction Principal Investigator. Pacific Earthquake Engineering Research Center.
Castro, S., Benavente, R., Crempien, J. G., Candia, G., and de la Llera, J. C. (2020). A Consistently Processed Strong‐Motion Database for Chilean Earthquakes. Seismol. Res. Lett.
Cornell, C. A., Jalayer, F., Hamburger, R. O., and FoutchFoutch, D. A. (2002). Probabilistic Basis for 2000 SAC Federal Emergency Management Agency Steel Moment Frame Guidelines. J. Struct. Eng. 128 (4), 526–533. doi:10.1061/(asce)0733-9445(2002)128:4(526)
DANE (2018). Censo Nacional de Población y Vivienda – CNPV. Base de Datos. Departamento Administrativo Nacional de Estadistica. Available at: https://www.datos.gov.co/Estad-sticas-Nacionales/Censo-Nacional-de-Poblaci-n-y-Vivienda-CNPV-2018/qzc6-q9qw (Accessed February 15, 2022).
De Biasio, M., Grange, S., Dufour, F., Allain, F., and Petre-Lazar, I. (2014). A Simple and Efficient Intensity Measure to Account for Nonlinear Structural Behavior. Earthq. Spectra 30 (4), 1403–1426. doi:10.1193/010614EQS006M
Eads, L., Miranda, E., and Lignos, D. G. (2015). Average Spectral Acceleration as an Intensity Measure for Collapse Risk Assessment. Earthq. Eng. Struct. Dyn. 44 (12), 2057–2073. doi:10.1002/eqe.2575
Federal Emergency Management Agency (2009). Quantification of Building Seismic Performance Factors. Available at: www.ATCouncil.org (Accessed January 31, 2022).
Harmsen, S. C. (2001). Mean and Modal in the Deaggregation of Probabilistic Ground Motion. Bull. Seismol. Soc. Am. 91 (6), 1537–1552. doi:10.1785/0120000289
Haselton, C. B., Baker, J. W., Liel, A. B., and Deierlein, G. G. (2011). Accounting for Ground-Motion Spectral Shape Characteristics in Structural Collapse Assessment through an Adjustment for Epsilon. J. Struct. Eng. 137 (3), 332–344. doi:10.1061/(asce)st.1943-541x.0000103
Hoyos, M. C., and Hernández, A. F. (2021). Impact of Vulnerability Assumptions and Input Parameters in Urban Seismic Risk Assessment. Bull. Earthq. Eng. 19 (11), 4407–4434. doi:10.1007/s10518-021-01140-x
Jaimes, M. A., and Candia, G. (2019). Interperiod Correlation Model for Mexican Interface Earthquakes. Earthq. Spectra 35 (3), 1351–1365. doi:10.1193/080918EQS200M
Jalayer, F., and Cornell, C. A. (2009). Alternative Non-linear Demand Estimation Methods for Probability-Based Seismic Assessments. Earthq. Eng. Struct. Dyn. 38 (8), 951–972. doi:10.1002/eqe.876
Jalayer, F., De Risi, R., and Manfredi, G. (2015). Bayesian Cloud Analysis: Efficient Structural Fragility Assessment Using Linear Regression. Bull. Earthq. Eng. 13 (4), 1183–1203. doi:10.1007/s10518-014-9692-z
Jalayer, F., Ebrahimian, H., Miano, A., Manfredi, G., and Sezen, H. (2017). Analytical Fragility Assessment Using Unscaled Ground Motion Records. Earthq. Eng. Struct. Dyn. 46 (15), 2639–2663. doi:10.1002/eqe.2922
Jalayer, F. (2003). Direct Probability Seismic Analysis: Implementing Non-linear Dynamic Assessment. Stanford University.
Jayaram, N., and Baker, J. W. (2009). Correlation Model for Spatially Distributed Ground-Motion Intensities. Earthq. Eng. Struct. Dyn. 38 (15), 1687–1708. doi:10.1002/eqe.922
Jayaram, N., Lin, T., and Baker, J. W. (2011). A Computationally Efficient Ground-Motion Selection Algorithm for Matching a Target Response Spectrum Mean and Variance. Earthq. Spectra 27 (3), 797–815. doi:10.1193/1.3608002
Kohrangi, M., Bazzurro, P., Vamvatsikos, D., and Spillatura, A. (2017a). Conditional Spectrum-Based Ground Motion Record Selection Using Average Spectral Acceleration. Earthq. Eng. Struct. Dyn. 46 (10), 1667–1685. doi:10.1002/eqe.2876
Kohrangi, M., Vamvatsikos, D., and Bazzurro, P. (2017b). Site Dependence and Record Selection Schemes for Building Fragility and Regional Loss Assessment. Earthq. Eng. Struct. Dyn. 46 (10), 1625–1643. doi:10.1002/eqe.2873
Kohrangi, M., Vamvatsikos, D., and Bazzurro, P. (2020). Multi-Level Conditional Spectrum-Based Record Selection for IDA. Earthq. Spectra 36 (4), 1976–1994. doi:10.1177/8755293020919425
Lin, T., and Baker, J. W. (2013). “Introducing Adaptive Incremental Dynamic Analysis: A New Tool for Linking Ground Motion Selection and Structural Response Assessment,” in 11th International Conference on Structural Safety & Reliability, New York, NY, 805–811.
Lin, T., Harmsen, S. C., Baker, J. W., and Luco, N. (2013). Conditional Spectrum Computation Incorporating Multiple Causal Earthquakes and Ground-Motion Prediction Models. Bull. Seismol. Soc. Am. 103 (2A), 1103–1116. doi:10.1785/0120110293
Lin, T., Haselton, C. B., and Baker, J. W. (2013a). Conditional Spectrum-Based Ground Motion Selection. Part II: Intensity-Based Assessments and Evaluation of Alternative Target Spectra. Earthq. Eng. Struct. Dyn. 42, 1867–1884. doi:10.1002/eqe.2303
Lin, T., Haselton, C. B., and Baker, J. W. (2013b). Conditional Spectrum-Based Ground Motion Selection. Part I: Hazard Consistency for Risk-Based Assessments. Earthq. Eng. Struct. Dyn. 42 (12), 1847–1865. doi:10.1002/eqe.2301
Luco, N., and Cornell, C. A. (2007). Structure-Specific Scalar Intensity Measures for Near-Source and Ordinary Earthquake Ground Motions. Earthq. Spectra 23 (2), 357–392. doi:10.1193/1.2723158
Mackie, K. R., and Stojadinovi, B. (2005). “Comparison of Incremental Dynamic, Cloud, and Stripe Methods for Computing Probabilistic Seismic Demand Models,” in Structures Congress 2005 (ASCE Library). doi:10.1061/40753(171)184
Martins, L., and Silva, V. (2020). Development of a Fragility and Vulnerability Model for Global Seismic Risk Analyses. Bull. Earthq. Eng. 19, 6719–6745. doi:10.1007/s10518-020-00885-1
Martins, L., Silva, V., Crowley, H., and Cavalieri, F. (2021). Vulnerability Modellers Toolkit, an Open-Source Platform for Vulnerability Analysis. Bull. Earthq. Eng. 19 (13), 5691–5709. doi:10.1007/s10518-021-01187-w
NIED (2022). NIED K-NET, KiK-Net. Available at: https://www.doi.org/10.17598/NIED.0004 (Accessed November 15, 2021).
Pagani, M., Monelli, D., Weatherill, G., Danciu, L., Crowley, H., Silva, V., et al. (2014). OpenQuake Engine: An Open Hazard (And Risk) Software for the Global Earthquake Model. Seismol. Res. Lett. 85 (3), 692–702. doi:10.1785/0220130087
SGC (2018). Modelo de Amenaza Sismica de Colombia. Available at: https://amenazasismica.sgc.gov.co/ (Accessed November 15, 2021).
Silva, V., Crowley, H., Pagani, M., Monelli, D., and Pinho, R. (2014). Development of the OpenQuake Engine, the Global Earthquake Model's Open-Source Software for Seismic Risk Assessment. Nat. Hazards 72 (3), 1409–1427. doi:10.1007/s11069-013-0618-x
Sinisterra, H. (2017). Determinación Del Desempeño Sísmico Para Edificios En Pórticos de Concreto Reforzado Diseñados Bajo La Norma de Diseño Sismo Resistente C.C.C.S.R-84. Cali: Universidad Javeriana.
United Nations Office for Disaster Risk Reduction (2015). Sendai Framework for Disaster Risk Reduction 2015-2030. Geneva, Switzerland: UNDRR.
United Nations (2015). Transforming Our World: The 2030 Agenda for Sustainable Development. New York, United States: General Assembly September 25, 2015.
United Nations (2016). New Urban Agenda. Available at: http://uploads.habitat3.org/hb3/NUA-English.pdf (Accessed February 20, 2022).
United Nations (2019). World Urbanization Prospects the 2018 Revision. New York, United States: Department of Economic and Social Affairs.
Vamvatsikos, D., and Cornell, C. A. (2002). Incremental Dynamic Analysis. Earthq. Eng. Struct. Dyn. 31 (3), 491–514. doi:10.1002/eqe.141
Keywords: seismic risk assessment, fragility function derivation, record selection, multi-site analysis, urban risk
Citation: Hoyos MC and Hernandez AF (2022) Seismic Risk Assessment of Multiple Cities: Biases in the Vulnerability Derivation Methods for Urban Areas With Different Hazard Levels. Front. Earth Sci. 10:910118. doi: 10.3389/feart.2022.910118
Received: 31 March 2022; Accepted: 17 June 2022;
Published: 04 August 2022.
Edited by:
Dimitris Pitilakis, Aristotle University of Thessaloniki, GreeceReviewed by:
Anastasia Nekrasova, Institute of Earthquake Prediction Theory and Mathematical Geophysics (RAS), RussiaM. Amin Hariri-Ardebili, National Institute of Standards and Technology (NIST), United States
Copyright © 2022 Hoyos and Hernandez. This is an open-access article distributed under the terms of the Creative Commons Attribution License (CC BY). The use, distribution or reproduction in other forums is permitted, provided the original author(s) and the copyright owner(s) are credited and that the original publication in this journal is cited, in accordance with accepted academic practice. No use, distribution or reproduction is permitted which does not comply with these terms.
*Correspondence: Maria Camila Hoyos, mc.hoyos.ramirez@gmail.com