Drought- and heatwave-associated compound extremes: A review of hotspots, variables, parameters, drivers, impacts, and analysis frameworks
 Mahnaz Afroz
 Gang Chen1
  Aavudai Anandhi
- 1Department of Civil and Environmental Engineering, FAMU FSU College of Engineering, Tallahassee, FL, United States
- 2Biological System Engineering Program, Florida A&M University, Tallahassee, FL, United States
Droughts and heatwaves are rising concerns with regard to the frequent formation of the compound or concurrent extremes (CEs), which can cause greater havoc than an individual event of a higher magnitude. Recently, they have been frequently detected to form CEs together or with other events (e.g., floods, aridity, and humidity events) concurrently or with spatiotemporal lags. Therefore, this systematic review assesses these CEs by reviewing the following aspects: CE hotspots, events, and variable combinations that form CEs; frequently analyzed CE parameters (e.g., frequency and severity); large-scale modes of climate variability (CV) as drivers alongside the approaches to relate them to CEs; and CE impacts (e.g., yield loss and fire risk) alongside the impact integration approaches from 166 screened publications. Additionally, three varied analysis frameworks of CEs are summarized to highlight the different analysis components of drought- and heatwave-associated CEs, which is the novelty of this study. The analysis frameworks vary with regard to the three major assessment objectives: only CE parameters (event–event), driver association (event–driver), and impacts (event–impact). According to this review, the most frequently reported hotspots of these CEs in global studies are southern Africa, Australia, South America, and Southeast Asia. In regional studies, several vital hotspots (e.g., Iberian Peninsula, Balkans, and Mediterranean Basin) have been reported, some of which have not been mentioned in global studies because they usually report hotspots as broader regions. In addition, different event combinations (e.g., drought and heatwave; and heatwave and stagnation) are analyzed by varying the combination of variables, namely, temperature, precipitation, and their derived indices. Thus, this study presents three major analysis frameworks and components of drought- and heatwave-associated CE analysis for prospective researchers.
1 Introduction
Concurrent or compound extremes (CEs), which can be defined as the simultaneous or sequential occurrence of more than two extremes at a single or multiple locations, may cause greater havoc than a single extreme of a higher magnitude (Kopp et al., 2017; Hao et al., 2018c). Although the primary idea of the joint probability of multiple extremes emerged decades ago, the explicit research on CEs has surged in the last few years (2018–2021). Especially on the verge of potential climate change, along with the plausible changes in meteorological variables such as temperature, precipitation, evapotranspiration, and wind speed, this research area has drawn more attention (Naveendrakumar et al., 2019). Examples of CEs may include drought and heatwave, drought and flood, temperature and precipitation extremes, and floods from storm surges and river discharges. Among these various combinations of CEs, one of the most explored is compound drought and heatwave. In addition, other combinations of CEs include either drought (dry event) or heatwave (hot event), for example, subsequent wet and dry events, concurrent day and nighttime heatwaves, and compound heatwave and stagnation.
Drought- and heatwave-associated CEs are among the most studied events and have significantly increasing temporal and spatial trends across various parts of the world. For instance, the global land and cropland areas affected by dry and hot CEs have reportedly increased 1.7–1.8 times in the last 50 years of the 20th and 21st centuries across different seasons, mostly in summer (Wu et al., 2021d). Such claims of increasing trends have also frequently been reported in many regional- and national-scale studies (Russo et al., 2019; Xu and Luo, 2019; Kong et al., 2020; Geirinhas et al., 2021). In China, hot and dry CEs have increased 2.3 times between 1957 and 2018, with 90% of the dry events being associated with hot events in 2010 (Ye et al., 2019b; Kong et al., 2020; Feng et al., 2021c). Similarly, Mishra et al. (2021) predicted a fivefold increase in the frequency of hot and dry CEs in India by the end of the 21st century compared with the 1951–2016 baseline. In the past 150 years, an increasing frequency of dry and hot months has been reported in Southeast Australia (Kirono et al., 2017). Additionally, the association of droughts with other events, such as pluvial floods, was reported in 5.9%–7.6% of global land areas between 1950 and 2016, with pluvial floods following approximately 11% of droughts during boreal spring–summer or fall–winter (He and Sheffield, 2020). For event combinations of heatwave and ozone (O3), Ban et al. (2022) predicted an increase of 34.6 in annual mean CE days under high-emission scenarios (shared socioeconomic pathways (SSP): 3–7.0) in 2071–2090 compared with the historical baseline of 1995–2004 in a global analysis (Ban et al., 2022). Mukherjee and Mishra (2018) reported an increase of 2–12 times in the concurrent day and nighttime heatwaves using various representative concentration pathways (RCPs), namely, RCP 2.6–8.5 (Mukherjee and Mishra, 2018). Based on an analysis of the 2020 heatwave (concurrent day and nighttime temperatures) in central South America, the high magnitude and duration of this recent heatwave have been reported in many parts of South American countries, such as southeastern Brazil, northern Argentina, southeastern Paraguay, eastern Bolivia, and Pantanal wetland (Marengo et al., 2022). In addition, in a global analysis of the 1955–2014 period, the increasing frequency of compound day and nighttime warm-dry and warm-humid events caused by greenhouse gases have been reported to be elevated by 1.5–5 and 2–9 times, respectively (Chiang et al., 2022a).
Drought- and heatwave-associated CEs have not only been expanding in spatiotemporal extents across various parts of the world but have also severely affected impact variables and aspects such as crop yields, fire risk, vegetation productivity, air quality, and human health. A noticeable impact on global maize yield has been reported in compound drought and heatwave scenarios (31% decrease), whereas heatwaves (4% decrease) or drought (7% decrease) alone has a significantly lower impact (Feng et al., 2019). Feng and Hao (2020) associated the yield loss across the United States and France in 61% of cases with compound dry and hot conditions in a global study across top maize-growing countries (Feng and Hao, 2020). In another global study, He et al. (2022) reported that in each wheat-growing season, more than 92% of the global wheat-growing regions have faced at least one dry and hot CE during 1981–2020, along with increases of 28.2% and 33.2% in the CE frequency and duration, respectively. Furthermore, among the wheat-producing regions, Europe, eastern China, western United States, and northern Argentina have been identified as hotspots (He et al., 2022). The increasing frequency of hot and dry CEs in the top maize-producing regions has also been reported in a multi-index global analysis for the periods 1949–1980 and 1981–2012 (Feng et al., 2021a). Additionally, fire weather and burned areas have been associated with drought, heatwave, or both in global (Richardson et al., 2022) and several regional studies (e.g., Greece and Brazil) (Gouveia et al., 2016; Libonati et al., 2022), where fire risk may increase with increasing drought- and heatwave-associated CEs. In the case of vegetation productivity, an absence of extremes increased tree coverage by 10% compared with the control scenario in a global analysis (Tschumi et al., 2022b). A 26-fold increase in population exposure to the compound heatwave and ozone scenarios in the 1980s (under high emission scenario) compared with the 1995–2014 baseline has also been reported in another global study (Ban et al., 2022). Urbanization and population (e.g., exposure and mortality) have been reported to be significantly associated with CEs in China, indicating the need for potentially similar associations and research in other parts of the world (Wang et al., 2021; Zong et al., 2022).
The analysis frameworks of drought- and heatwave-associated CEs usually vary with the different objectives of determining some of the direct spatial/temporal parameters (e.g., frequency, spatial extent, and probability) considering only event–event combinations, association with large-scale modes of climate variabilities (CVs) as drivers considering event–driver combinations, or the impact of such CEs on various aspects considering event–impact combinations. For example, while some studies reported the probability of joint occurrence of several event variables or indices, others reported the likelihood of large-scale CV or atmospheric circulation (AC), such as the El Niño–Southern Oscillation (ENSO), or agricultural impact indicators, such as the Standardized Crop Yield Index (SCI), given the occurrences of CEs. In these cases, the frameworks mainly varied due to variable types (event, driver, or impact variables), target parameters to be calculated, and associated methods (Hao et al., 2018b; Feng and Hao, 2020; Wu et al., 2021d).
A previous review on CE has addressed four categories of CEs: 1) preconditioned, in which the impact of hazard is worsened by a weather- or climate-driven precondition; 2) multivariate, in which the impact is aggravated by multiple hazards; 3) temporally compounding, in which the impact is aggravated by successive hazards; and 4) spatially compounding, in which the impact is worsened by hazards in multiple connected locations (Zscheischler et al., 2020). These categories mostly have common analysis frameworks and methods with slight variations in which temporally or spatially compounding data are used as inputs, other than in the case of concurrent multivariate events (Hao et al., 2018b; De Luca et al., 2020b; Sutanto et al., 2020). Furthermore, Zhang W. et al. 2021a discussed the drivers, mechanisms, and methods associated with these categories.
The quantitative methods to assess CEs parameters vary from a simple percentile-based peaks-over-threshold (POT) or an empirical approach to complex copula-based joint probability (JP) analysis, conditional probability (CP) analysis, pair copula construction (PCC), or developing a standardized compound event indicator (SCEI) (Hao et al., 2018a; 2020b; Cheraghalizadeh et al., 2018; Ribeiro et al., 2020b; Slater et al., 2020; Mishra et al., 2021). Some basic parameters used to convey the outcome of CE analysis are frequency, spatial extent, probability, duration, correlation, and severity. Occasionally, these same parameters are analyzed by separating the data using land cover (e.g., croplands and forests) and seasons (e.g., growing season) or by including an impact variable such as crop yield to assess the impacts in terms of several spatiotemporal extents or variables of interest, respectively (Lu et al., 2018; Manning et al., 2018; Wang et al., 2018; Feng et al., 2021c).
To date, various review articles have covered different aspects of CEs, such as definition, involved statistical procedures, upcoming CEs, dependence structure, and suggested framework (Leonard et al., 2014; Kopp et al., 2017; Hao et al., 2018c; Hao and Singh, 2020). For instance, Hao et al. (2018c) discussed the processes associated with the statistical characterization and modeling of extremes in the hydroclimatic domain by discussing approaches such as multivariate distribution, empirical approach, Markov Chain Model, and quantile regression approach. Approaches for detecting and predicting hydroclimatic extremes (non-stationary cases) and the associated drivers and matrices were also discussed by Slater et al. (2020). In addition, some review articles focused on the potential CEs in the warming world, the associated drivers influencing the extremes, the potential risk associated with the extremes, and their frequency (Goodess, 2013; Kopp et al., 2017; AghaKouchak et al., 2020). While AghaKouchak et al. (2020) focused on most potential extremes (e.g., heatwaves, wildfires, extreme precipitation, and flooding), their interactions as compound events, associated drivers, and risk, Kopp et al. (2017) directly discussed various potential CEs such as simultaneous heat and drought, wildfires associated with hot and dry conditions, and flooding associated with high precipitation, as well as their associated risks and impacts of several shared large-scale modes of CVs along with atmospheric forcing factors such as ENSO and tipping elements such as Atlantic Meridional Overturning Circulation. In another review, CEs were mainly classified into four categories: preconditioned, multivariate, temporally compounding, and spatially compounding (Zscheischler et al., 2020). Most review articles have focused on associated analytical approaches, classification, driver assessment, and risk assessment, among others. In contrast, Raymond et al. (2020) primarily focused on a multidisciplinary (climatic, societal, and economic) argument for the concept of related extreme events, their impacts, and potential anthropogenic impacts on CEs (Raymond et al., 2020).
Despite covering many aspects of CEs, previous review articles have not discussed the analysis frameworks that vary with regard to analysis objectives. In addition, the already discovered hotspots, which are the most impacted or CE-frequent regions in the corresponding study area as claimed in many previous publications, have not been summarized in previous reviews (Ridder et al., 2020; Chiang et al., 2022b; He et al., 2022). Thus, this study aims to provide an overview of three major analysis frameworks, along with several aspects of CEs related to drought- and/or heatwave-associated events. This review focuses on the following aspects: 1) the already reported hotspots in previous publications; 2) the event combinations and associated variables to form CEs; and 3) three analysis frameworks that vary according to the objectives of assessing basic CE parameters (event–event), association with large-scale modes of CVs as drivers (event–driver), and impact on several aspects (event–impact) to showcase an overall breakdown of CE analysis focused on drought- and heatwave-associated CEs.
2 Methodology
2.1 Article selection process
This systematic review includes 166 articles out of initially identified 701 records from the following sources: 1) “Web of Science” (WoS) on 2 September 2022 (642 records) and 2) “experts” and “Google Scholar” (59 records) for various timelines since September 2020. Herein, the term “experts” refers to colleagues, faculties, and reviewers in the field with whom the topic was discussed or consulted during the initial topic selection stage. Systematic literature identification, screening, eligibility, and exclusion/inclusion process are detailed in the PRISMA diagram (Figure 1).
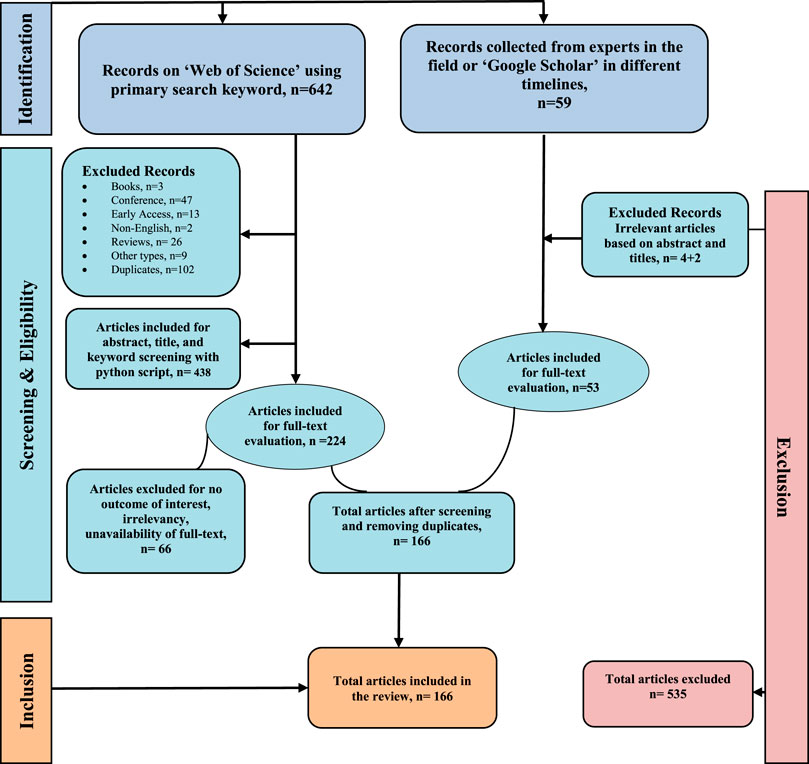
FIGURE 1. PRISMA diagram for article inclusion/exclusion in this systematic review.
The identification phase involves searching the WoS using search keywords. This phase results in 642 records for the following eight search keywords: “compound extremes” (73 records), “compound extreme” (75 records), “concurrent extremes” (22 records), “concurrent extreme” (31 records), “compound events” (200 records), “compound event” (81 records), “concurrent events” (124 records), and “concurrent event” (36 records). Herein, the advanced search option “topic” (including the title, abstract, and keywords in the published literature) has been used for the last 10 years (1 January 2013 to 2 September 2022). Additionally, 59 records are identified from “Google Scholar” by searching the database and from discussions with “experts” at various timelines.
In the eligibility and screening phase of the systematic review, the WoS search records are directly exported to Excel files for processing with a Python script in the subsequent evaluation phase. The script is used to automate the subsequent evaluations, reducing eligible records to 540 articles. The filtering records’ criteria for the excel files are “Language = English,” “Publication Type = J,” and “Document Type = Article.” In this process, non-English language records (2), conference proceedings (47), books (3), review articles (26), early access (13), and other records (9)—all non-journal records and review articles—are screened. After excluding duplicates within WoS, the number of records decreases to 438. Subsequently, the titles, abstracts, and keywords of these 438 articles from WoS are screened with a Python code to check for the presence of two sets of keywords of interest: set 1 comprises CE-defining words (“compound,” “concurrent,” “concurrently,” “combined,” “copula,” “dependence,” “dependences,” “multivariate,” “multi-variate,” “multi,” and “joint”) and set 2 comprises drought- and heatwave-identifying words (“hot,” “heat,” “heatwave,” “heatwaves,” “heat waves,” “heat wave,” “warm,” “dry,” “dryness,” “drought,” “droughts,” and “aridity”). These keywords are obtained from the 59 articles collected from “experts” and “Google Scholar” searches at different times from September 2020. Evidently, the aforementioned words are more likely to be present in the title, abstract, or keywords of an article if relevant to our topic of interest. During this process, the number of articles decreases to 224.
Subsequently, the full texts of 224 articles are reviewed to check relevancy and further eligibility criteria, with 10 articles unavailable to download with the available resources and 66 articles either irrelevant to the topic of interest or not containing adequate information on the targeted fields of this review. Eligible and relevant articles must have information about drought- and heatwave-associated CEs, mainly relevant to the domain of agriculture, hydrology, and topics of the review (hotspots, variables, parameters, drivers, impacts, and analysis framework).
Furthermore, the details of the percentage of excluded articles from WoS, where 148 articles are included after applying eligibility and inclusion criteria on 214 available full texts, are as follows:
- The article is written in a foreign language other than English (0.31%).
- The document type is not an article but a book, a report, or other (9.2%).
- The document is a review paper, not an original article (4.05%).
- The article is an early access version (2.02%).
- The article is simply a duplicated version of another article from the search (15.88%).
- The title, abstract, and keywords showcase no significant relevance to the topic of interest as per screening with CE-defining words and drought-heatwave relevant words (33.33%).
- The full-text article is unobtainable using the available access and resources, and only the title and abstract are accessible (1.56%).
- The overall article is not related to a topic of interest or does not contain significant data on the topics of review (10.30%).
Among the 59 records from “Google Scholar” and “experts,” 6 records are excluded based on the evaluation criteria incorporated after the screening and eligibility phase and 35 records are deemed as duplicates based on WoS. This results in 18 new articles.
The inclusion phase contains articles after the identification, screening and eligibility, and evaluation phases. A total of 166 (148 + 18) full-text articles are included in the final stage of the review by following the standard literature inclusion process for systematic reviews (Anandhi et al., 2018; Peng et al., 2020).
2.2 Data collection and processing
Based on the 166 collected articles, a data collection table is prepared, comprising 14 fields related to CEs, namely, “studied region,” “study year,” “study timeline,” “hotspots,” “studied event combinations of CE,” “variable combinations,” “scale of the data,” “CE detection methods,” “analyzed CE parameters or CE characteristics,” “thresholds,” “assessed impacts” (if any analyzed), “impact integration approach” (if applicable), “CVs as drivers” (if analyzed), and “methods to connect CVs and CEs” (if applicable). Subsequently, the collected data fields are organized into several sections, tables, and figures to represent the results associated with the objectives of this systematic review. The hotspot map (Section 3.1) is drawn in a GIS environment using the symbology option, namely, the “graduated symbol.” Separate point shapefiles for each CE combination with hotspots reported in global studies are digitized using GIS. The number of studies that report a region as a hotspot is manually counted in the attribute table. After digitizing all reported hotspots and their counts in the attribute tables, the final dot density map is plotted by assigning different colors to different event combinations and by assigning different sizes of dots based on the number of studies that report a certain region as a hotspot. Data are obtained only from global studies (44) that report hotspots. The hotspots reported in the regional studies are plotted as stacked bar plots. Regional hotspots are not plotted on the map as different regions involve varying numbers of studies, and unlike global studies, the extents of the study areas are not similar. Consequently, regions with a higher number of studies reporting hotspots have higher dot densities, irrespective of whether a hotspot is more impacted by CEs compared to other regions of the world. The regional hotspots, distribution of publications by year, types of extreme studied for various study regions, and other figures and tables are prepared in the word processor.
Thus, the overall reviewed contents on drought- and heatwave-associated CEs are organized in the following workflow: 1) the hotspots of CEs found in reviewed publications; 2) the event combinations to form drought- and heatwave-associated CEs; 3) variables, associated data types, and thresholds to define different CEs; 4) CE analysis framework with frequently analyzed parameters, the association of large-scale modes of CVs as drivers, and the assessment of impacts with regard to several aspects; 5) interrelation of CEs with ecosystems; 6) assumption and limitations; and 7) research gaps and potential future work. The major objectives, associated data fields used to produce the results, associated sections, and related graphics (tables and figures) are represented as a workflow diagram of the review strategies in Figure 2.
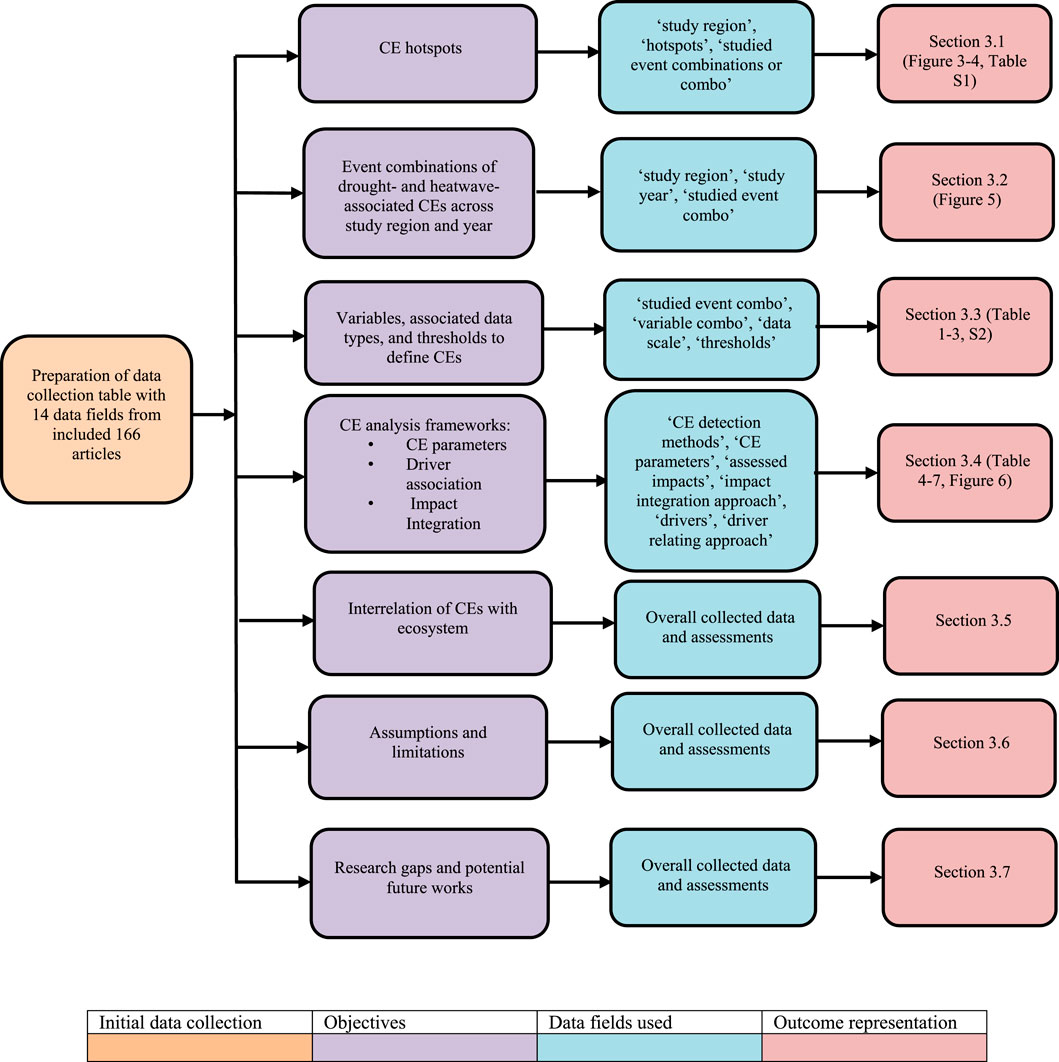
FIGURE 2. Workflow to represent the outcome of the review from the collected data.
3 Results and discussions
3.1 CE hotspots in reviewed publications
Most studies on CEs are conducted on global or national scales, with China, the United States, and India being the most studied countries. In global studies, South Africa, South America, Australia, southeastern Asia, South Asia, and the United States are evidently regarded as significantly impacted zones with regard to various CE combinations, especially compound drought and heatwave (Feng et al., 2019; Zhan et al., 2020; Wu et al., 2021d). In addition, hotspots for eight other drought- and heatwave-associated CEs (i.e., drought and fire risk, precipitation and temperature, wet and dry, warm and wet, warm and humid, heatwave and ozone, heatwave following cyclones, and drought and aridity) are included as reported in the global studies. Among these event combinations, drought and fire risk hotspots are situated in the western United States, various parts of South America, Australia, and Southeast Asia (Ridder et al., 2020; Richardson et al., 2022). A single hotspot for heat followed by a tropical cyclone has been reported in Australia (Matthews et al., 2019). For warm and humid events, hotspots are prevalent in various parts of the United States, South America, Southeast Asia, and Australia (Li et al., 2020; Raymond et al., 2021; Chiang et al., 2022a). These hotspots for the aforementioned CE combinations are represented in Figure 3, where the dot densities indicate the number of publications that have reported the places as CE hotspots in 44 global studies. The associated data are listed in Supplementary Table S1 in the supplementary document.
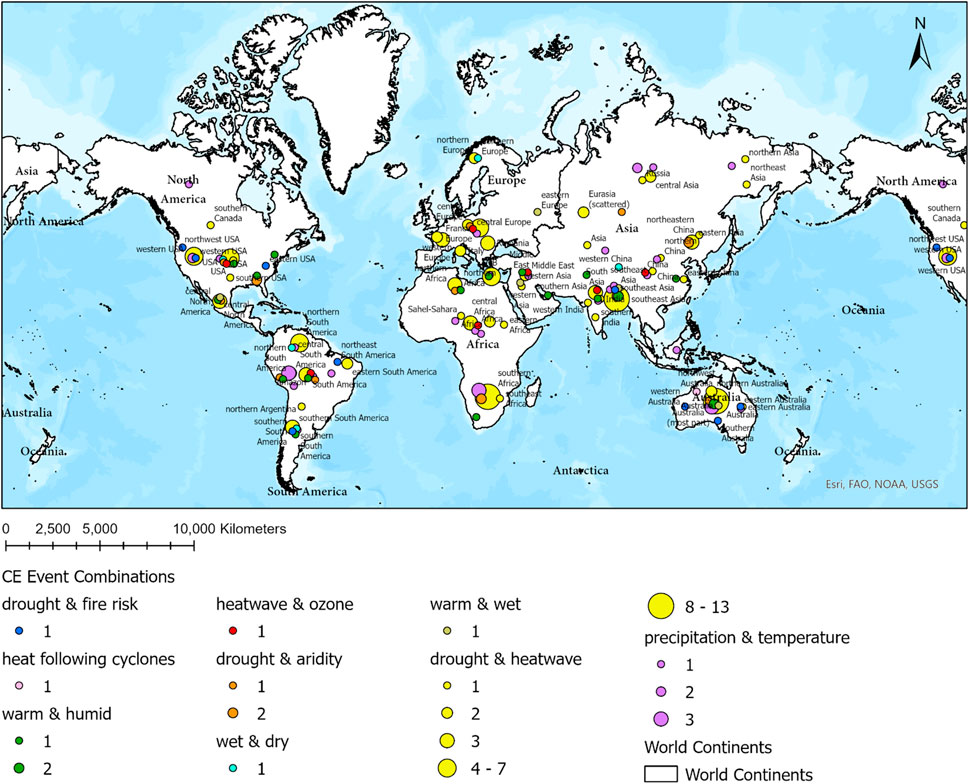
FIGURE 3. Graduated symbol plot to represent the hotspots detected in the 44 global publications. The number below each CE event combination indicates the number of studies that mentioned the location as a hotspot. The graduated point symbols are intended to represent the approximate locations of the broad regions found as hotspots in the global map, not the exact locations. The size of the graduated dot symbol is proportional to the count of global publications claiming a region as a hotspot.
In regional studies, various event combinations are assessed in different regions. Furthermore, the regions with higher numbers of studies (e.g., China and the United States) report the hotspots within such regions more frequently, even if the hotspots are not that frequently mentioned across the global studies. However, some important hotspots (e.g., Iberian Peninsula, Balkans, Mediterranean Basin, Pantanal, and Amazon) have significantly increasing trends concerning CEs in regional studies, whereas most global studies do not explicitly mention some of them and rather report the hotspots as broader regions (Bezak and Mikoš, 2020; Vogel et al., 2021; Bento et al., 2022; Marengo et al., 2022). Figure 4 showcases the stacked bar plots that represent the regional hotspots across different event combinations. In these plots, the number of studies that report a regional hotspot is biased by the frequency of studies in the region.
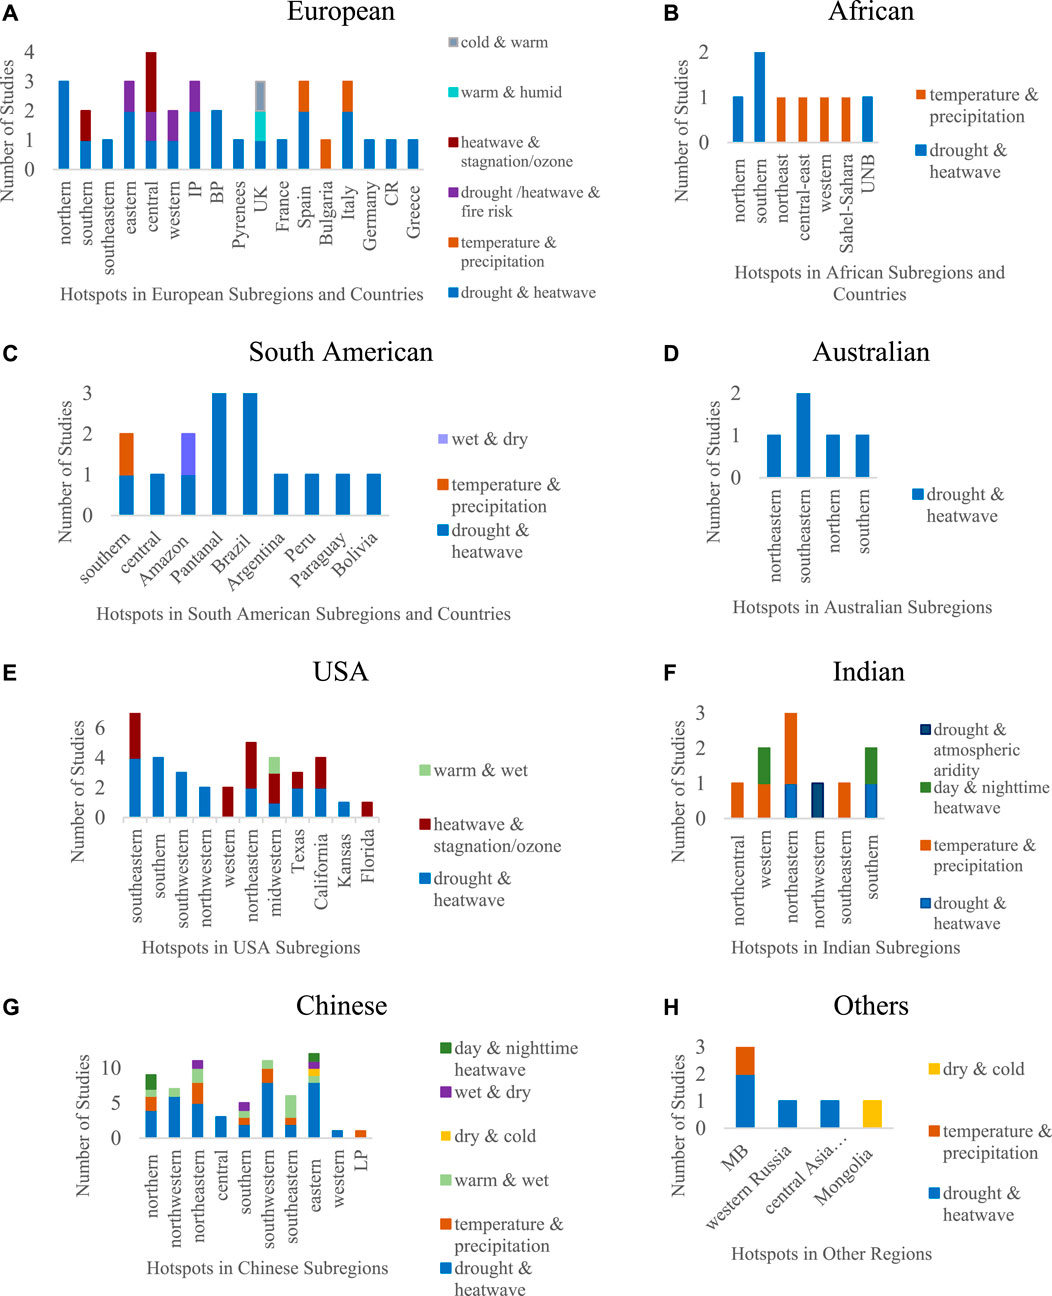
FIGURE 4. (A-H) Hotspots found in the regional studies. The vertical axis represents the number of regional studies where the region was seen as hotspot of CEs. The study numbers are not proportional to the severity of the hotspots compared to the other areas but indicate how frequently they were studied. The horizontal axis represents the regions found as hotspots in regional studies. IP: Iberian Peninsula, BP: Balkan Peninsula, MB: Mediterranean Basin, CR: Czech Republic, LP: Loess Plateau, UNB: Upper Nile Basin.
3.2 Event combinations of drought- and heatwave-associated CEs with region and publication year distributions
In the reviewed studies, various combinations of several types of drought- and heatwave-associated CEs are found. The corresponding region-based distribution is presented in Figure 5A, representing the study gaps and the combinations of CEs explored in each region. In addition, for the event combinations mentioned in Figure 5A, a few other combinations of CEs are observed that have been rarely studied (one case). These include hot, dry, and windy events; drought and wind; and concurrent fire drivers (Ridder et al., 2020; Tavakol et al., 2020). Among the several temperature-, precipitation-, or drought-related extremes, compound drought and heatwave is the most studied joint extreme. Other types or combinations of CEs have been studied in different reviewed publications using several variables, indices, and thresholds to define them. In addition to hot and dry conditions, any of the other three combinations of temperature and precipitation extremes (cool and dry; hot and wet; and cool and wet) have been studied together in some studies (22 studies) (Wu et al., 2019c; Zhan et al., 2020; Camara et al., 2022).
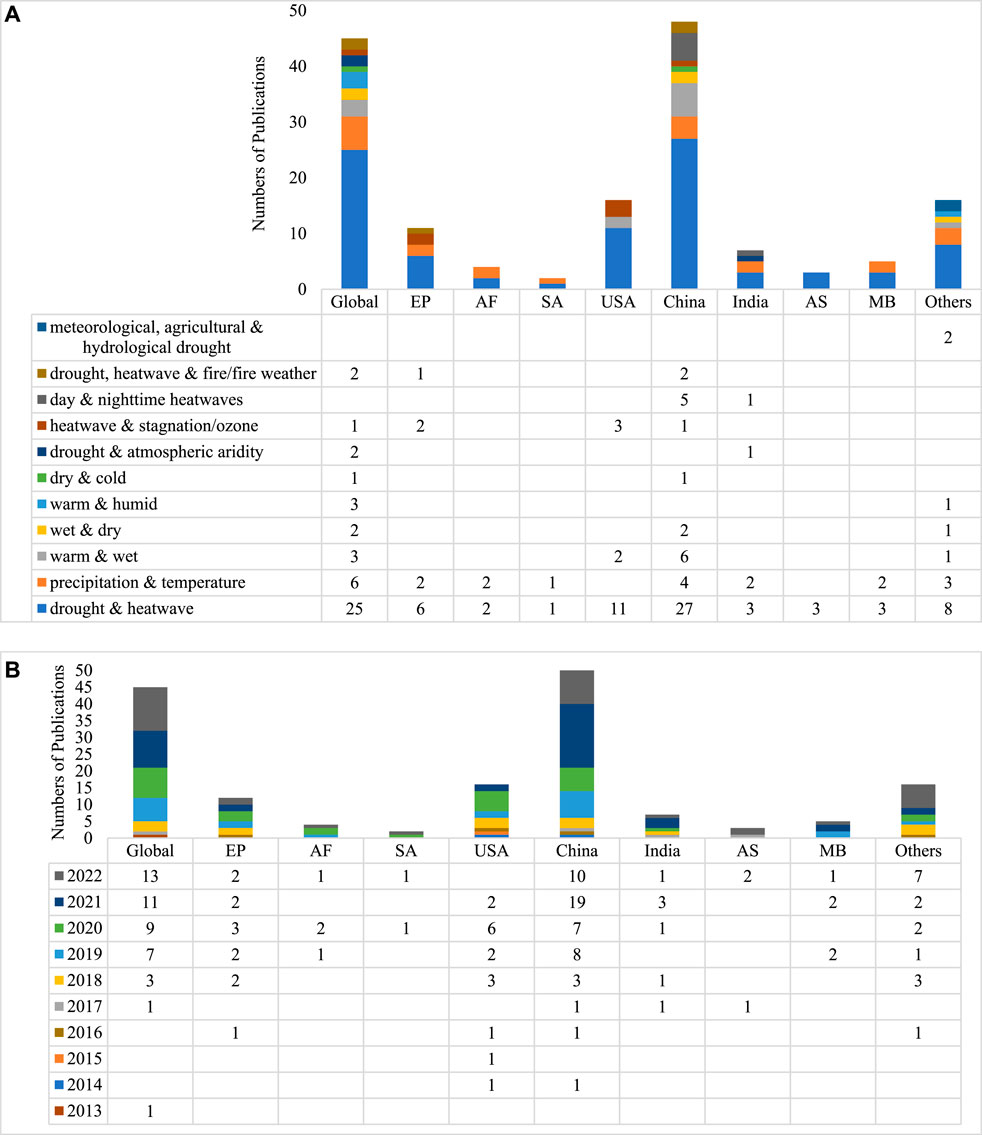
FIGURE 5. (A) Distribution of papers listing event combinations of drought and heatwave-associated extremes by study regions. (B) Distribution of papers listing publication years by the study regions (EP: Europe; AF: South Africa/Southern Africa/Africa; SA: South America; AS: Australia; MB: Mediterranean Basin; others: Germany, France, Canada, Mongolia, Nigeria, Russia, Upper Nile Basin, etc.).
Evidently, most studies on CEs, including drought- and heatwave-associated CEs, have been conducted since 2018 (Figure 5B). Many studies have been conducted on a global scale to focus on the frequency of CEs in different parts of the world and on various global issues (Feng et al., 2019; Mukherjee et al., 2020). In addition, more studies have been conducted in China and the United States.
3.3 Variables with associated datatypes and thresholds to define different CEs
Various publications have qualitatively and quantitatively explained compound drought- and heatwave-related extremes and their impacts with several variables and indices (Hao et al., 2018a; 2020c; Cheraghalizadeh et al., 2018; Brunner et al., 2021). However, the most common variables for assessing these CEs are temperature (maximum, minimum, and average) and precipitation, whereas the most widely used indices are the Standardized Precipitation Index (SPI) and Standardized Temperature Index (STI) derived from the corresponding variables (Zscheischler and Seneviratne, 2017; Mukherjee and Mishra, 2018; Hao et al., 2019a; Brunner et al., 2021). Stream flow and soil moisture are the most commonly used variables for predicting hydrological and agricultural droughts, respectively (Cheraghalizadeh et al., 2018; Zhou et al., 2019a; Mishra et al., 2021). Based on the study objective, various previous drought- and heatwave-associated CE articles have discussed the following variables: other climate variables, such as relative humidity (RH), vapor pressure, wind speed, and evapotranspiration; large-scale modes of ACs or CVs, such as ENSO and Pacific Decadal Oscillation (PDO); impacted variables and aspects, such as crop yields, land use, vegetation vulnerability, and fire risk (Manning et al., 2018; Zhou et al., 2019b; Coffel et al., 2019; Hao et al., 2020c; Feng et al., 2021c; Vogel et al., 2021). In several cases, the following different indices have been used: single-variable dependent indices, such as SPI, STI, and SCI; multi-variable dependent indices, such as Standardized Precipitation Evapotranspiration Index (SPEI) and Palmer Drought Severity Index (PDSI); and copula-based compound event indicators, such as SCEI (Hao et al., 2018a; Cheraghalizadeh et al., 2018; De Luca et al., 2020b). The standardized indices and their defined ranges can illuminate the severity level of extreme events (e.g., drought) irrespective of the weather conditions in a region, enabling the severity in different regions to be compared. However, direct percentiles applied over variables are generally suitable for temporal comparison in a region, as the variables are compared with different percentiles of variables in the same region (Mishra et al., 2021). The variables or indices used to define drought, heatwave, and other associated CEs studied in the reviewed publications are summarized in Tables 1, 2, respectively. Herein, the impacted variables (i.e., SCI) or CVs (i.e., ENSO) are not included because the objective is to represent the participating variables/indices (meteorological, hydrological, and agricultural) as components of each combination of CEs. The variables/indices/aspects associated with the impacts and driving forces are explained in Section 3.4.
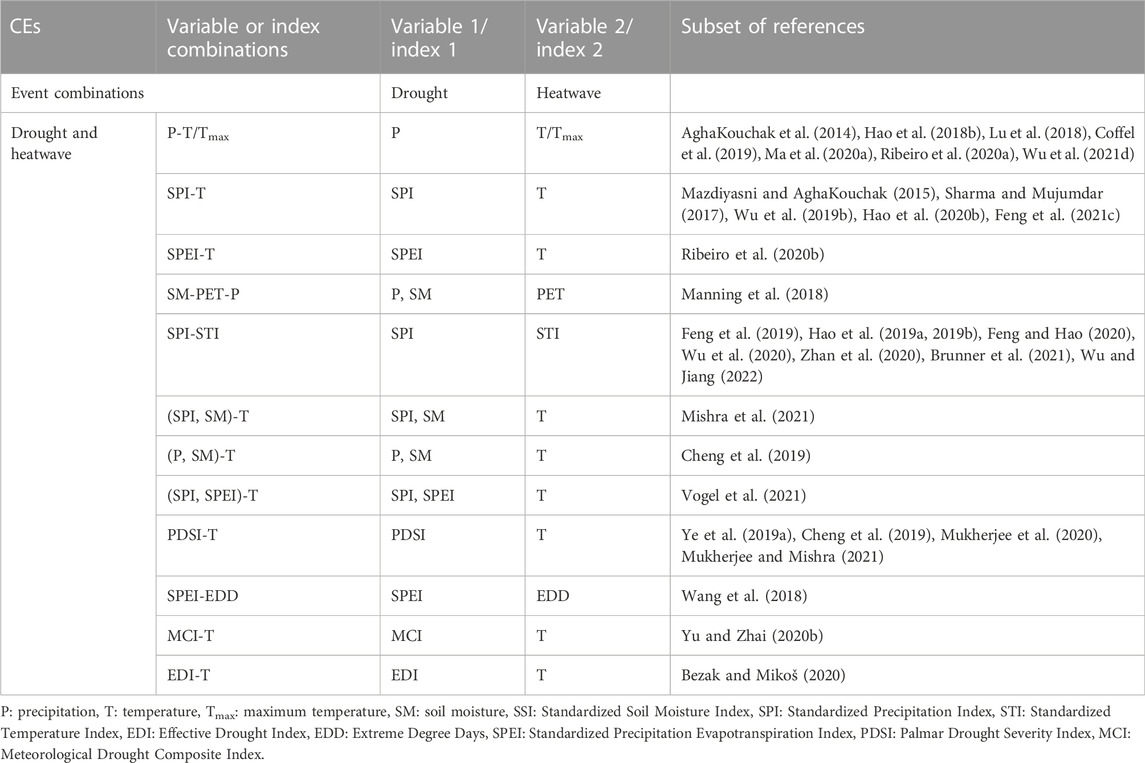
TABLE 1. Variable (or index) combinations to be used to define drought (dry) and heatwave (hot) events.
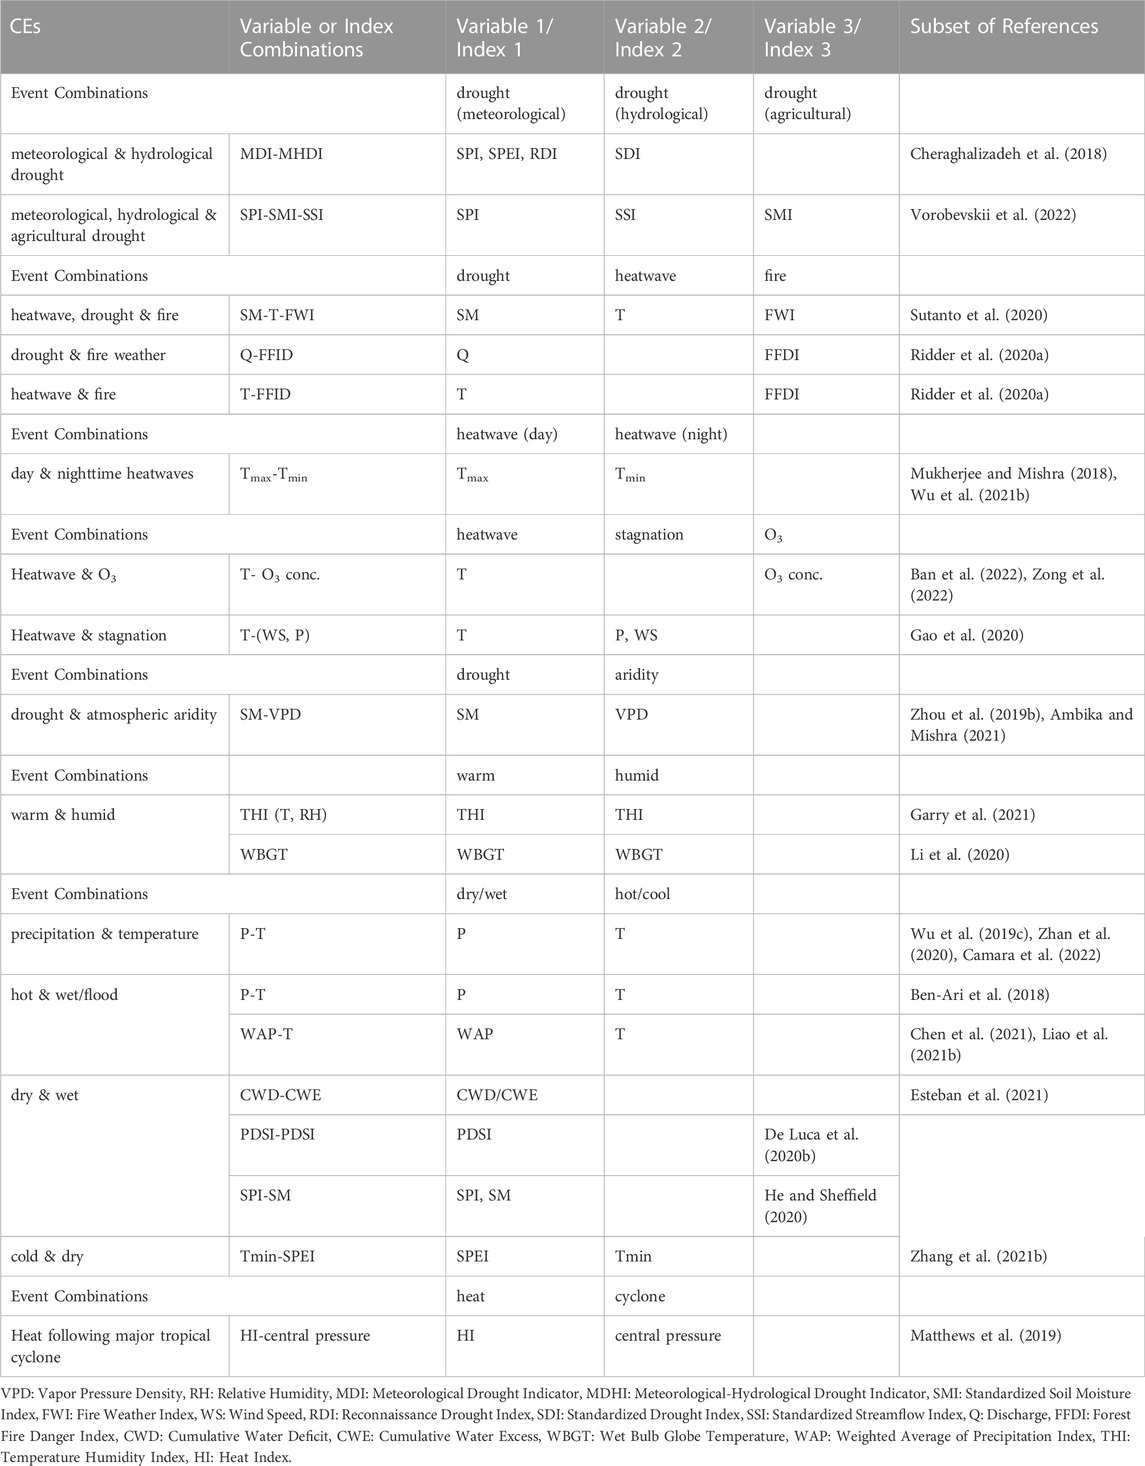
TABLE 2. Variable (or index) combinations to be used to define other drought and heatwave associated CE combinations.
In a few instances, drought and heatwaves are explained with other inter-related variables such as RH and vapor pressure density (VPD) as well as temperature and precipitation. Chiang et al. (2018) proposed that drought, temperature, RH, and VPD are interdependent (Chiang et al., 2018). In the case of CEs with opposing phenomena, such as drought and pluvial flood in the same location, the lagged occurrences can be considered as the CE, and they may be indicated with the same dry/wet condition indices (PDSI and SPI) or variables (SM) (He and Sheffield, 2020).
In most cases, the articles use monthly data followed by daily data. Many articles use mixed cases, such as daily, monthly, or annual data, for different variables (Supplementary Table S2). A typical mixed case is the use of daily temperature data and either monthly precipitation total or SPI (Mazdiyasni and AghaKouchak, 2015; Wu et al., 2019c). Usually, in these cases, the days crossing a temperature threshold and falling within the same month, which crosses the precipitation threshold, are considered CE days. The most commonly used impacted variable (yield) data are always collected on an annual scale. In these cases, the growing season means or totals of other event variables (such as temperature and precipitation) are used as annual data points along with the annual yield data (Coffel et al., 2019; Feng and Hao, 2020). The variables are either handled as direct data or converted into indices.
In most articles, thresholds are defined beyond which variables/indices are considered extreme. A threshold is associated with the conditions linked to the framework for each variable. The threshold justification is attributed to “measurable” and “extreme,” where a higher threshold may result in very few events being detected, and a lower threshold may result in too many events (Wu et al., 2019b). Therefore, different articles incorporate various levels of thresholds based on their objectives (Hao et al., 2018b; Wu et al., 2019b; Mukherjee et al., 2020). In an article, direct data of the variable, their derived standardized indices, or both can be used, which have been tagged as D type, I type, or D-I type, respectively, in this review article (Table 3). For direct data-based thresholds, percentile-based statistics are most commonly used, for example, the 90th percentile of June, July, and August daily temperatures for all baseline years (Wu et al., 2019a) or the 10th percentile of growing season precipitation of wet days during baseline years (Lu et al., 2018). For index-based fixed thresholds, standardized values of different severity levels are most commonly used; for example, Brunner et al. (2021) used SPI values of −1, −1.5, and −2 to define moderate, severe, and extreme conditions, respectively (Brunner et al., 2021). The collected information on data types and example thresholds for different event combinations is presented in Table 3, respectively.
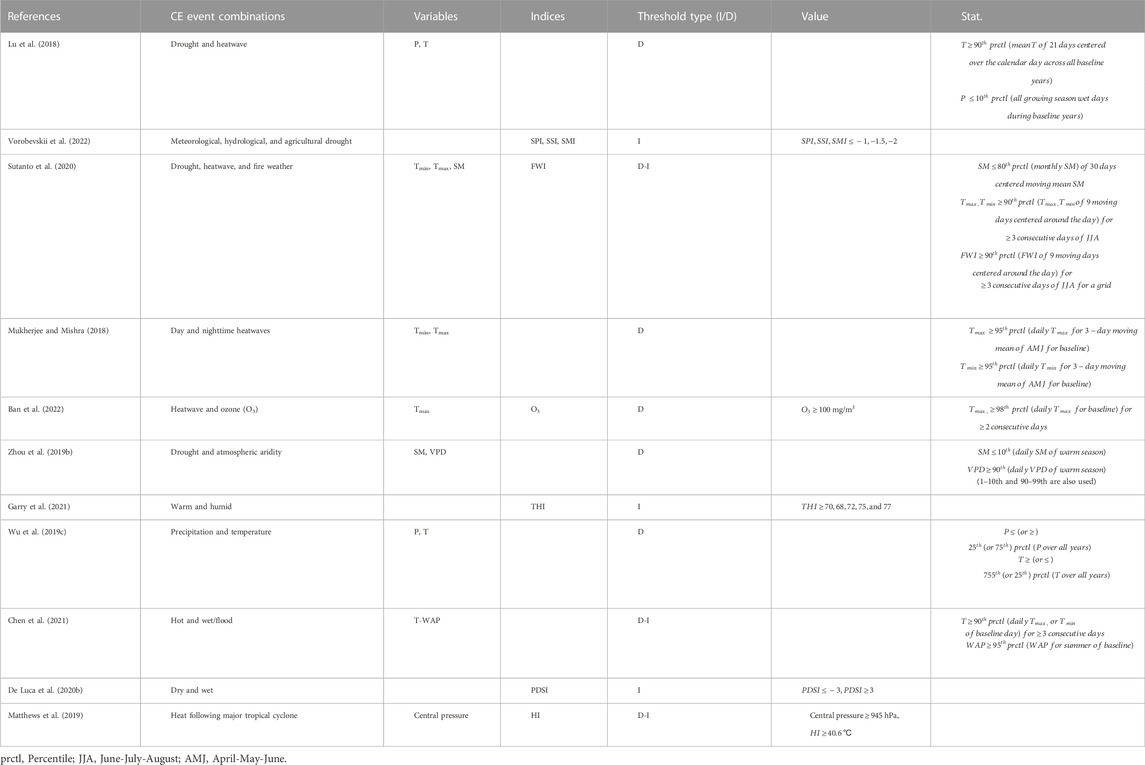
TABLE 3. Some example threshold types: (D: data-based, D-I: data- and index-based, I: index-based).
3.4 CE analysis frameworks
The frameworks of analysis mainly vary based on the objectives of analyzing only CE events (e.g., drought and heatwave), the association of CE events with large-scale modes of CV drivers (e.g., the association of drought and heatwave with ENSO), or assessing the CE-induced impacts on various aspects (e.g., impacts of drought and heatwave on yield, varying CE parameters across different land covers). The components associated with each CE framework vary based on different variables (associated with events, drivers, or impacts); parameters (e.g., frequencies, spatial extents, probabilities, and correlations) to be analyzed as outcomes; and methods (e.g., POT, JP, and CP) used to calculate the parameters. Based on the analysis conducted in the reviewed articles, the major analysis frameworks have been summarized into three segments in this systematic review based on various analysis objectives: 1) event–event that involves quantification of CE parameters using the contributing event variables/indices; 2) event–driver that involves quantifying the association of CEs with large-scale modes of CVs as drivers using variables/indices that are representative of events and drivers; and 3) event–impact that involves quantification of the impacts on various aspects using variables/indices that are representative of events and impacts. The summarized components of the three major analysis frameworks associated with CE analysis are presented in Figure 6.
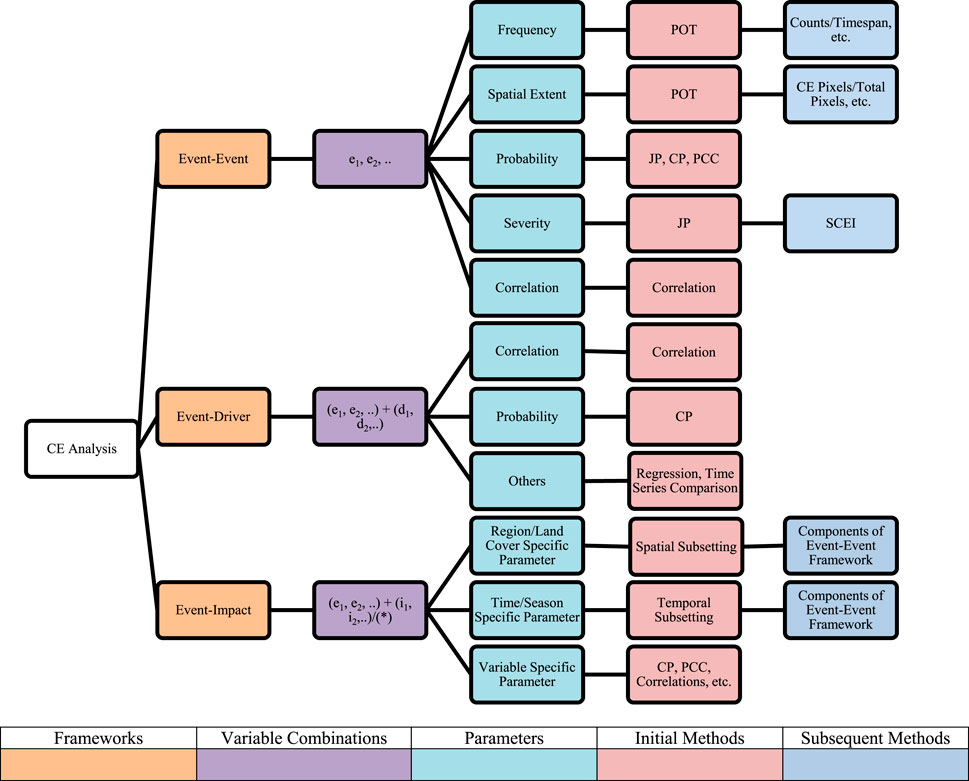
FIGURE 6. Summarized CE analysis components associated with three major analysis frameworks (event–event, event-driver, and event–impact) (here, en, dn, and in refer to events, drivers (CVs), and impacts indicating variables/indices, respectively; (*) indicates seasonal or land use data in other forms.
In the reviewed publications, several parameters are quantified to convey the outcomes of the analyzed CEs. Herein, the most frequently assessed parameters associated with each type of analysis framework are presented. In the event–event framework, the analysis of basic CE parameters mainly includes basic outcome-indicating parameters such as frequency, spatial extent, probability, return periods (RPs), compound indicator-based magnitude/severity, and correlations. In the event–driver framework, the quantification of the association with large-scale modes of CVs is mainly assessed using parameters such as correlations and probabilities. Finally, in the event–impact framework, the impacts on other impacted variables or aspects are quantified using the following three major approaches: 1) spatial subsetting of data followed by quantification of basic CE parameters with event–event framework components, 2) temporal subsetting of data followed by quantification of basic CE parameters with event–event framework components, and 3) integrating the impact variables/indices (i.e., crop yield, burned area, and mortality) directly into the equations/models with other event-indicating variables/indices (Wang et al., 2018; Feng et al., 2019; Gao et al., 2020; Feng et al., 2021c; Das et al., 2022; Ribeiro et al., 2022). Therefore, the parameters to be calculated for the aforementioned three approaches that assess the impacts are named region/land cover specific parameters, time/season specific parameters, and variable specific parameters, respectively, in this article.
The reviewed publications include one or more of these CE frameworks to represent the various outcomes of CE analysis (Hao et al., 2019b; Feng and Hao, 2020; Feng et al., 2021c). The associated methods and quantitative approaches regarding each type of analysis are described in the following three sections (3.4.1–3.4.3).
3.4.1 Frequently analyzed parameters of drought- and heatwave-associated CEs
The most analyzed parameter in previous studies is the frequency of CEs (Table 4). CEs are detected in these cases using the binary mapping technique expressed in Eq. 1, which is commonly called the “empirical approach” or “peaks-over-thresholds” (POT) (Lu et al., 2018; Wu et al., 2019c; Feng et al., 2021c). Subsequently, a comparison of frequencies between different time segments is conducted in some studies to detect the frequency changes between time periods. Occasionally, empirical RPs are also analyzed, which are the inverse of the frequency or empirical probability (Ridder et al., 2020; 2022a; 2022b). A typical example of frequency quantification is represented by the simplified Eq. 2 (Lu et al., 2018). In Eqs 1, 2, Z and CEHD represent a binary response of 0 or 1 (based on whether a variable crosses its threshold) and compound extreme hot and dry days (determined from the summation of Z), respectively. Additionally, x (precipitation threshold) and y (temperature threshold) refer to the 10th percentile of all growing season wet days during baseline years and the 90th percentile of mean temperature centered over 21 calendar days across all baseline years, respectively.
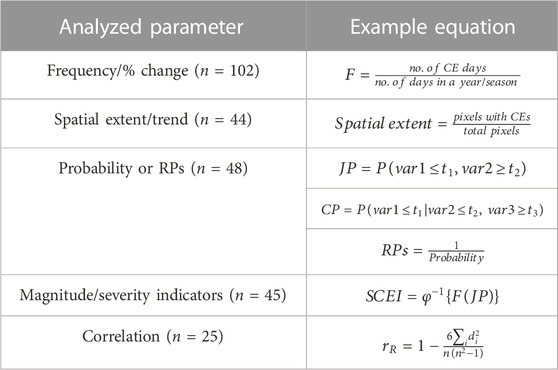
TABLE 4. Some key analyzed parameters of drought and heatwaves associated CEs assessed in reviewed publications (n = number of instances the parameter is evaluated in the reviewed articles, varn = nth variable, tn = threshold of nth variable).
In addition to the detection of CE frequencies, the spatial extent (Mazdiyasni and AghaKouchak, 2015) and trend (Feng et al., 2021c) of CEs have been detected in some articles using the aforementioned binary detection approach (Eq. 1) followed by Eqs 3, 4 he following equations:
Another frequently analyzed parameter is the joint or conditional probability for two or more variables, such as temperature, precipitation, yield, and soil moisture (Feng et al., 2019; Ribeiro et al., 2020b). In addition, RPs are frequently analyzed along with or instead of probability (Miao et al., 2016; Zhou and Liu, 2018). Probability is commonly assessed using the copula-based method or meta-Gaussian model (Gaussian copula). The typical expressions of the joint and conditional probabilities can be expressed using Eqs 5, 6, respectively. In Eqs 5, 6, SPI, STI, and SCI thresholds were represented by x (e.g., −1.6, −1, and −0.8), y (e.g., 1.6, 1, and 0.8), and z (e.g., 0), respectively:
Occasionally, a copula-based compound index, such as SCEI, can be used to indicate the severity or magnitude of CEs (Wu et al., 2020). Eq. 7 is a generalized expression of SCEI, where φ and F stand for standard normal distribution and marginal cumulative distribution, respectively. Additionally, the different severity levels mentioned by Wu et al. (2020) are summarized in Table 5:
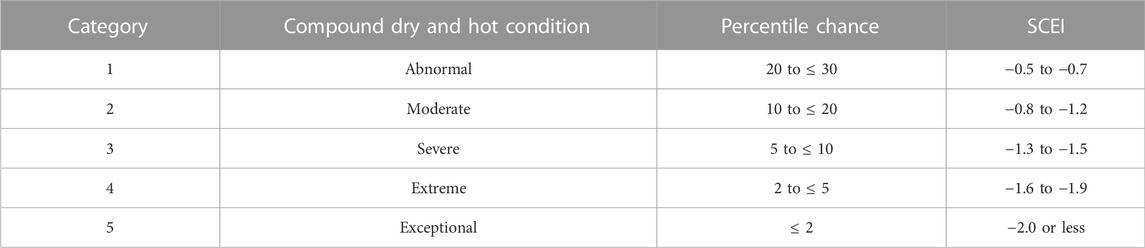
TABLE 5. Categories of compound severities (characterized by SCEI) of compound dry and hot conditions based on a previous publication.
Another important parameter proposed in CE publications is duration, which is basically the event span (Sedlmeier et al., 2018; Manning et al., 2019; Qiao et al., 2022). In some cases, the relation of CEs with another event (also lagged) can be indicated by analyzing the correlation. For instance, Hao et al. (2019a) determined the correlation between CE and standardized ENSO (Hao et al., 2019a). The details are presented in Section 3.4.2. The general equation of Spearman’s correlation coefficient (rR) is listed in Table 4, where n is the number of data points in the variables to be correlated and di is the difference in the rank of the ith element.
3.4.2 Large-scale modes of CVs as drivers of CEs
Different large-scale modes of CVs are evidently present during CEs or induced CEs as precursors or drivers in significant parts of the global land area (Hao et al., 2019a; 2019b; De Luca et al., 2020b). For instance, ENSO and PDO reportedly impact 18.1% and 12% of the global land area, respectively, whereas Atlantic Multi-decadal Oscillation (AMO) inversely affects 18.9% of the global land area. The effects of ENSO and PDO are reportedly significant in northern South America, the central United States, the western United States, the Middle East, eastern Russia, and eastern Australia. However, AMO substantially impacts Mexico, Brazil, central Africa, the Arabian Peninsula, China, and eastern Russia in different seasons (Table 6) (De Luca et al., 2020a). In most cases, the dependence between lagged or concurrent CVs is indicated using correlations. However, several other methods have also been associated with representing the relationships between CEs and CVs, as per previous studies (Table 7).
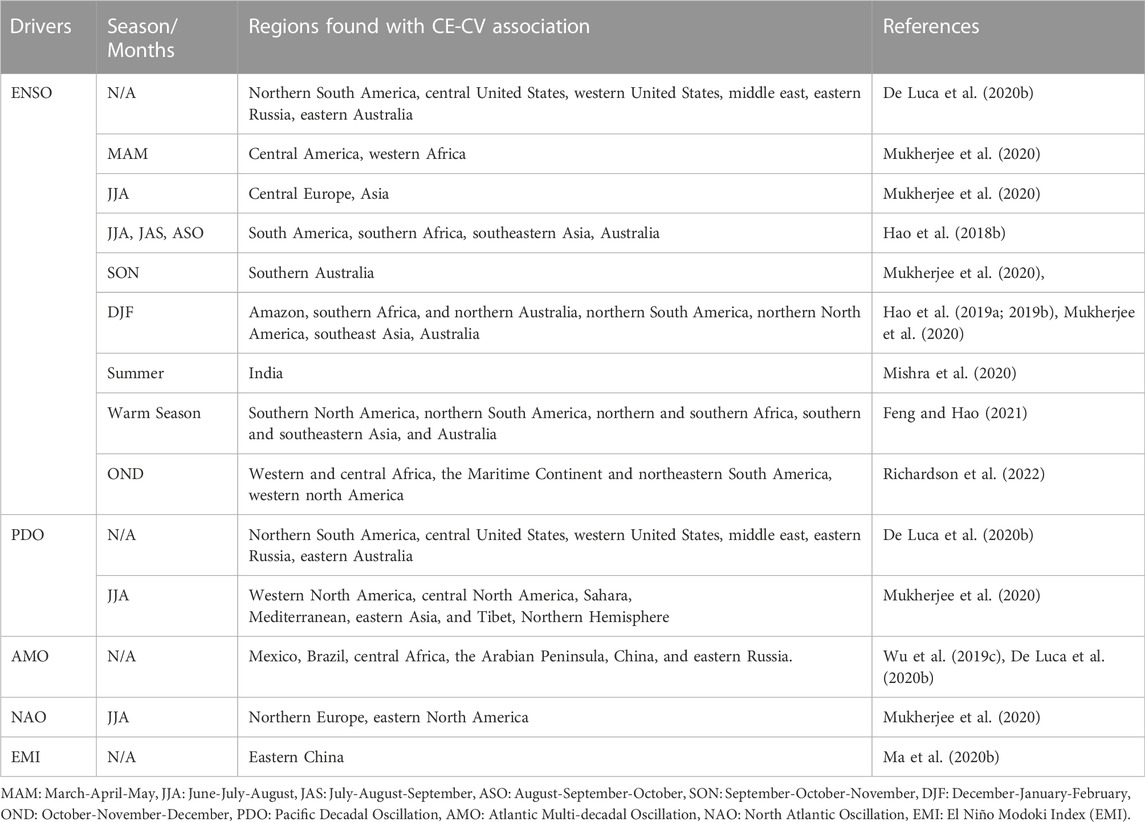
TABLE 6. Regions detected with major CE-CV association in different seasons.
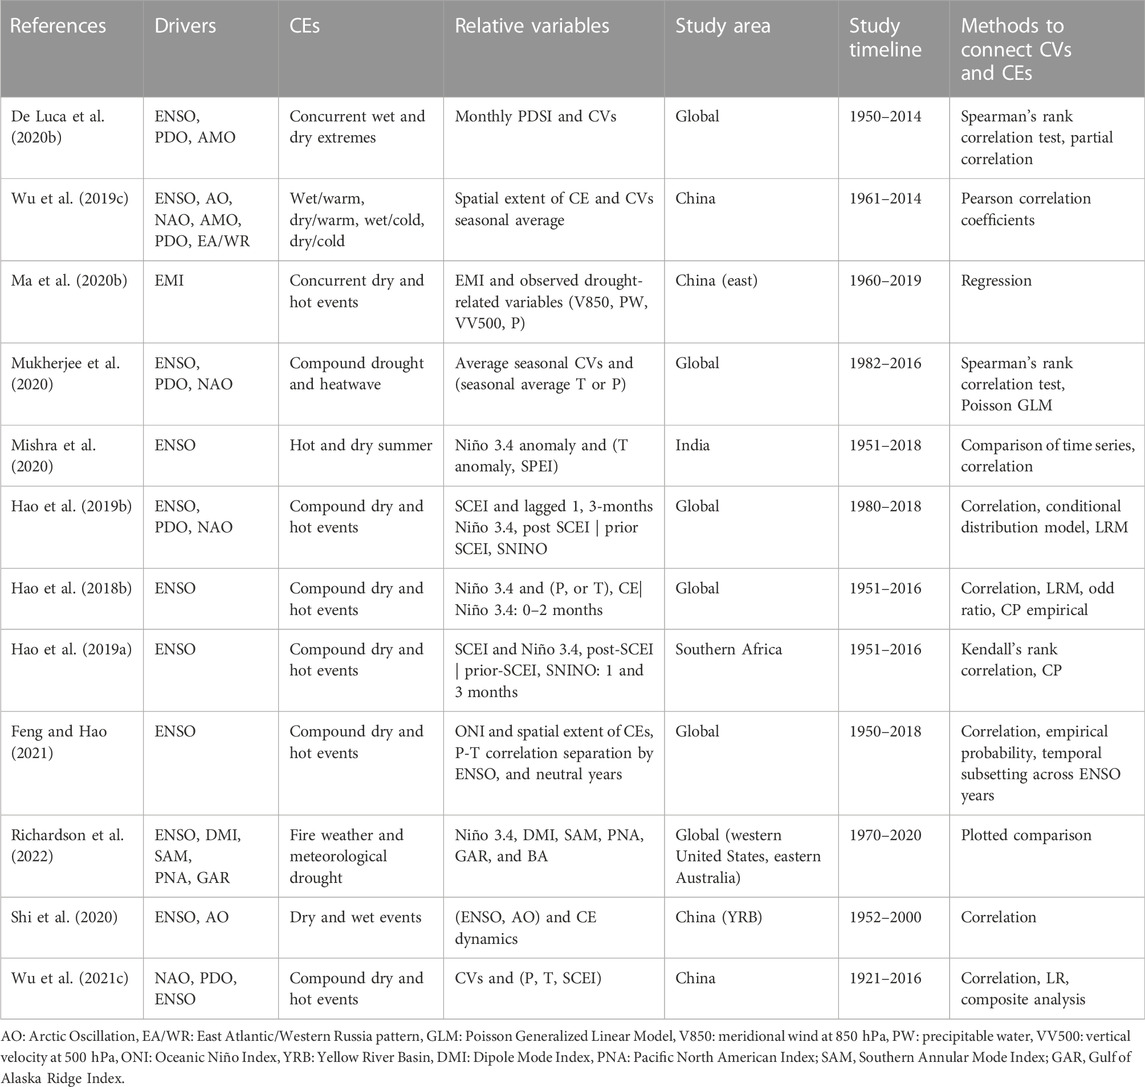
TABLE 7. Methods to assess relations of large-scale modes of CVs as drivers.
The dependence between different large-scale modes of CVs (i.e., ENSO and PDO) and CEs is most commonly assessed using correlation coefficients (e.g., Spearman’s correlation test) (Wu et al., 2019c; Mukherjee et al., 2020; Shi et al., 2020). In some instances, the impact of a major CV must be discarded to assess the relationship between another CV and CE. For such instances, a partial correlation can be used (De Luca et al., 2020b). The relationship between two random variables can be represented by this method after discarding the effects of other variables; for example, De Luca et al. (2020) estimated the relationship between PDO and PDSI, given the ENSO-indicating index called Niño 3.4 (De Luca et al., 2020b). The partial correlation between CV to be correlated (xi) and CE variable to be correlated (xj) after discarding the effect of another CV (xk) can be assessed by Eq. 8, where rij, rjk, rik refer to correlations between xi and xj, xj and xk, and xi and xk, respectively (De Luca et al., 2020):
Evidently, ENSO has the most widespread impact on global land areas in terms of percent land area impacted; furthermore, ENSO interacts with other CV modes, such as PDO and Arctic Oscillation (AO) (Wu et al., 2019c; De Luca et al., 2020b). These complex interactions may induce uncertainties in correlation results. Therefore, the correlations are highly variable over seasons, regions, and event combinations of CEs (Wu et al., 2019c).
Large-scale modes of CVs can be used as predictors for determining the severity of upcoming CEs (Hao et al., 2019a; 2019b). According to Hao et al. (2019a), the upcoming severity of a CE after 1 month of period t (Wt+1 = SCEIt+1) can be determined using Eq. 9, given that the predictors Wt and Xt are the standardized CE indicator (SCEIt) and standardized CV (SNINOt), respectively:
Eq. 9 must have a normal distribution with mean µ and variance σ2. The validity of the prediction can be assessed using Pearson’s correlation coefficient between the observed and simulated CE indicators.
A logistic regression model (LRM) can also be used to predict CE occurrence (Hao et al., 2018b; 2019b). The regression model and 1-month leading probability can be expressed using Eqs 10, 11, respectively. In these two equations, x, π,
The validity of the prediction can be determined using the Brier Skill Score in the case of LRM. The results showcase that lower SCEI values (more severe compound dry and hot events) are associated with higher SNINO (El Niño) values from December to February. In contrast, lower values of SNINO (La Niña) are associated with higher SCEI values in southern America (Hao et al., 2019b). Another expression of the relationship between compound events and ENSO is the odd ratio (
3.4.3 Assessment of CE impacts on several aspects
The impacts of various CEs have been assessed in several aspects, such as crop yield (Feng and Hao, 2020), crop growth season (Lu et al., 2018), phenological growth phases (Wang et al., 2018), land cover/land use (Feng et al., 2021c), urbanization (Wu et al., 2021b), fire risk (Richardson et al., 2022), and air quality (Gao et al., 2020). In order to assess the impacts on several aspects, the impacted parameters (region-, time-, or variable-specific) are integrated into the CE assessment framework using various approaches, such as temporal subsetting of time series for the growing season or growth stages, spatial subsetting of spatial data to include land cover/land use/region/station of interest, and directly integrating into the equations/model/method of assessment. The examples of these approaches are summarized in this section based on the major approaches to integrate impact variables or aspects. In the direct data integration approach, crop yield data or yield variables are directly included in the conditional probability or paired copula method in a few studies (Feng et al., 2019; Ribeiro et al., 2020a; Feng and Hao, 2020). In addition, the vegetation index is used as a direct variable in the vine copula model, and the burned area directly correlates with extremes. However, land cover and land use are integrated by spatial subsetting of the data by Feng et al. (2021c), with the stations or weather grids relating to different land covers, such as croplands, forests, and pastures (Feng et al., 2021c). Several other studies have followed a similar spatial subsetting approach with land use or land cover data to compare CEs for different land uses or land covers (Toreti et al., 2019; Wu et al., 2021d). In another case of spatial subsetting combined with direct variable integration, the population exposure to compound heatwave and ozone is spatially grouped across the spatial distribution of age and income (Ban et al., 2022). Examples of temporal subsettings can be found in Lu et al. (2018) and Wang et al. (2018), where CEs are compared by isolating them into the growing season and phenological stages, respectively (Lu et al., 2018; Wang et al., 2018). Additionally, assessed impacts are temporally sub-divided across CE magnitudes in the case of population mortality in Europe (Hertig et al., 2020) and vegetation vulnerability in southwest China (Liu et al., 2022), along with direct variable integration for both cases. In fact, both subsettings and variable integration approaches have been used in most cases to process spatiotemporal data used in the studies (Gao et al., 2021; Gazol and Camarero, 2022; Kroll et al., 2022). Examples of the major aspects/impact integration approaches are summarized in Table 8.
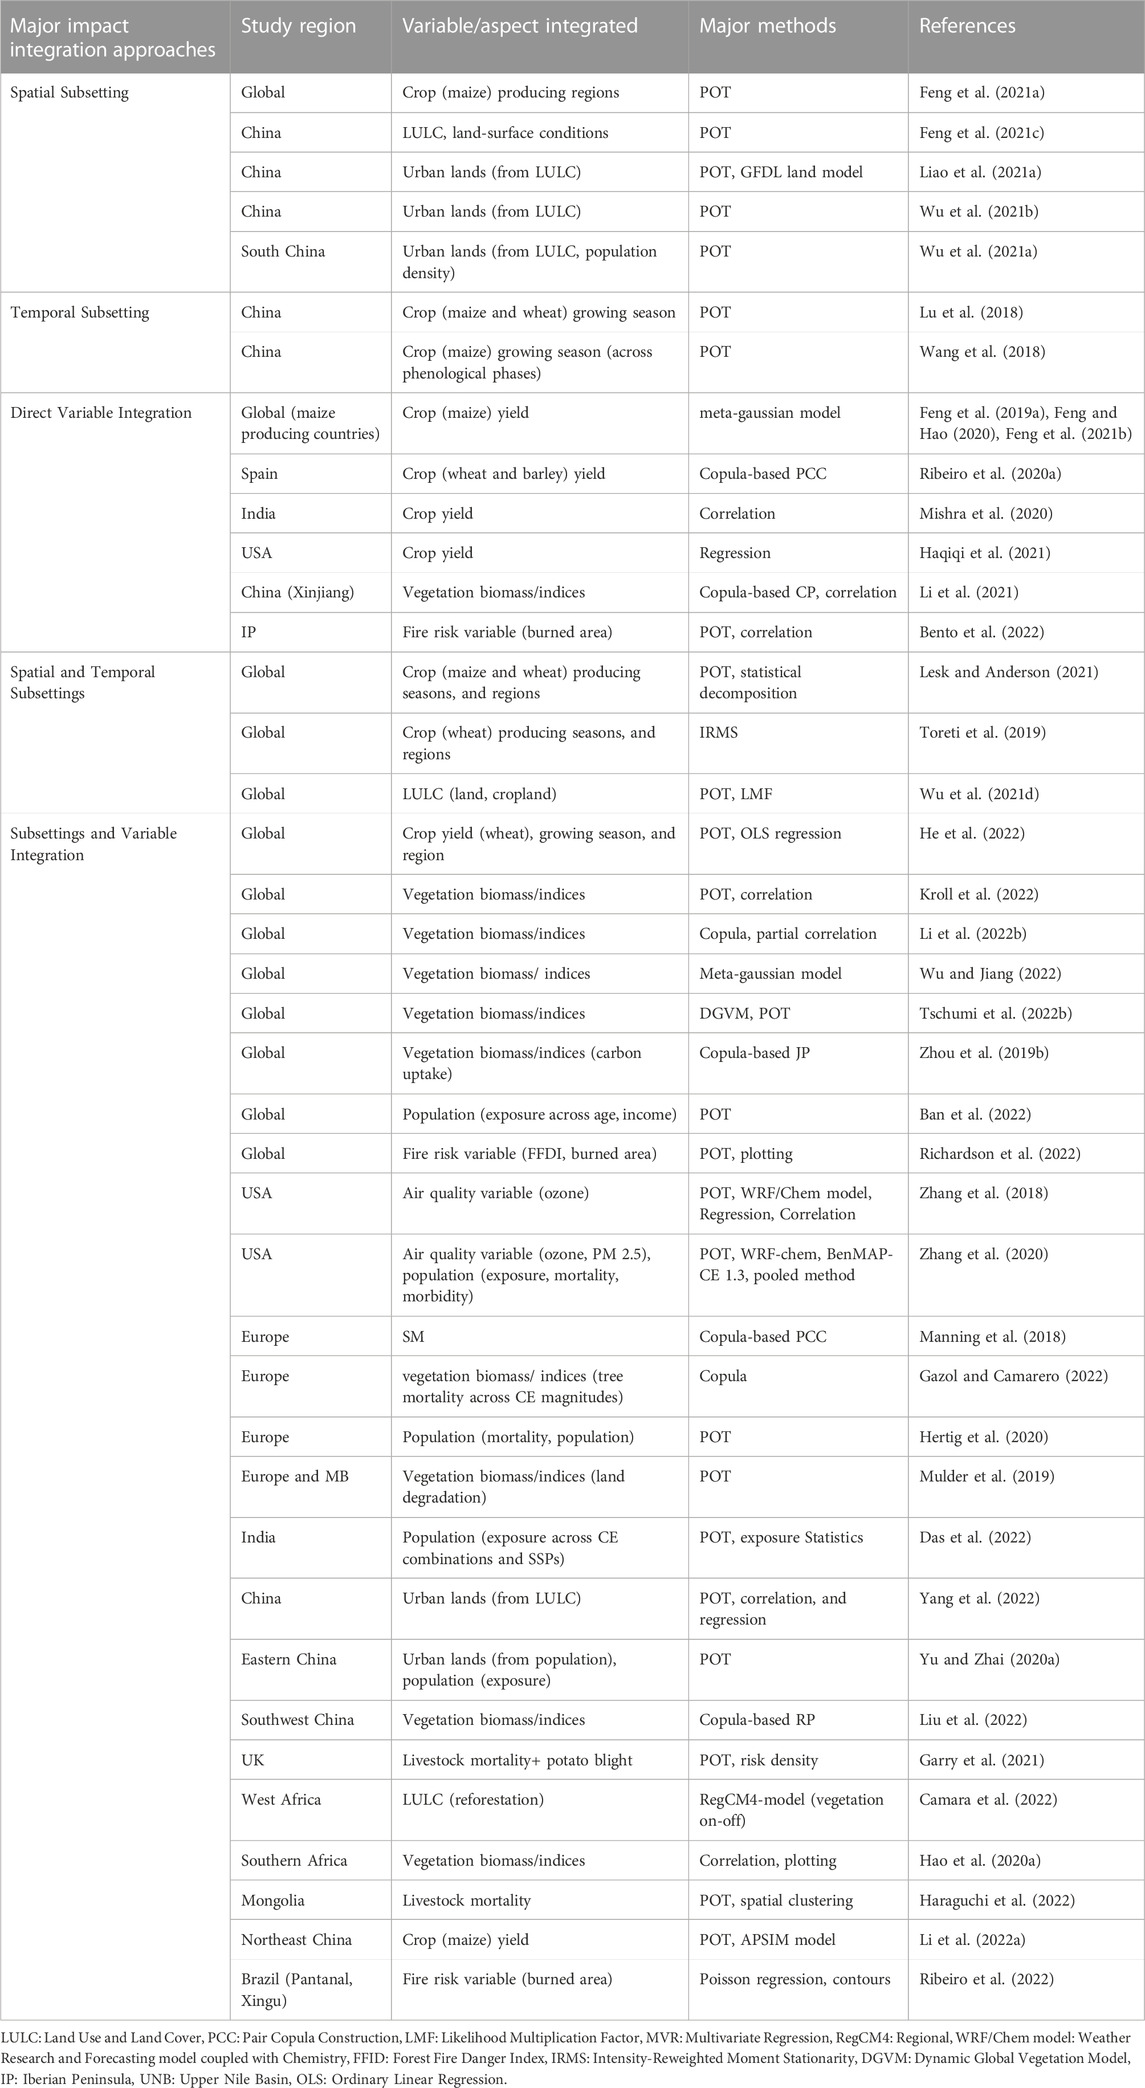
TABLE 8. Examples of CE impacts assessed on several variables/aspects in reviewed publications and major impact integration approaches (there may be additional approaches and variables/aspects in the references listed under each integration approach; only some examples of each approach are listed here).
3.5 Interrelation between ecosystems and CEs
Ecosystems and vegetation productivity are closely inter-related with hydroclimatic extremes because they can affect each other. While CEs such as drought and heatwave can affect vegetation productivity in dry and hot regions, reduced vegetation productivity can affect evaporative cooling and soil moisture dynamics to alter surface fluxes and near-surface weather to induce CEs (Li et al., 2021; Kroll et al., 2022). Kroll et al. (2022) reported an association between vegetation productivity and hydroclimatic extremes in 50% of the global study area, with impacts varying across regions. Similarly, Li J. et al. (2022) reported varying impacts of CEs in different regions. For instance, CEs of temperature and precipitation (especially warm and dry or cold and dry events) can significantly reduce vegetation productivity in mid-latitude regions between 23.5˚N and 50˚N, whereas they may increase productivity in regions with latitude greater than 50˚N (Li J. et al., 2022). Additionally, the abundance of dried vegetation caused by sequential wet and dry seasons can create fire weather, followed by fire hazards (Richardson et al., 2022). Moreover, reduced vegetation caused by CE can potentially affect terrestrial carbon dynamics and carbon sequestration, which may reduce crop yield and plant biomass and increase global warming potential (Afroz et al., 2021; Tschumi et al., 2022a; Kroll et al., 2022). Reduced vegetation in one season may also amplify drought in the next season, which can cause lower vegetation productivity with continued effects on the following seasons and productivity (Li J. et al., 2022b). As vegetation potentially induces CEs, which may impact many other aspects (e.g., yield, air quality, livestock mortality, fire risk, and human health), the direct and indirect relationships among ecosystems, vegetation, and CEs are quite evident.
3.6 Assumptions and limitations of the current study
As this study is conducted by searching WoS with eight search keywords related to CEs, some studies might have been missed in which these keywords are not explicitly mentioned in the titles, abstracts, and keywords of the publications. However, the previously collected publications from “experts” and “Google Scholar” at different timelines did contain these keywords, with most being present in the title, abstract, or keywords of a relevant article of interest. Therefore, the used keywords are assumed to have resulted in a significant number of studies to conduct a systematic review and miss only a negligible number of relevant articles.
This study limits the scope to only the most frequently used approaches and divides the analysis types and frameworks accordingly. Other possible infrequent approaches have not been discussed in this study. Additionally, the hotspot map drawn in this study represents a study area as a more frequently claimed hotspot with dot densities based on the number of global studies claiming that region to be a hotspot. Local studies are excluded from the hotspot map because the study areas do not have similar extents as global studies. In addition, some regions have more relevant articles than others (e.g., United States and China), which would yield higher dot densities in the map, even if the region is not a global hotspot for a particular event combination of CE. Therefore, the regional hotspots are represented as stacked bar plots in this study, and the number of studies is biased by the varying numbers of studies in different regions. However, the hotspot map aims to represent the already reported hotspots from reviewed global publications and how frequently they were found more impacted. The bar plots drawn on regional hotspots aim to represent regional hotspots, which are not the focus of global studies as they report on broader regions. Thus, the study number frequency associated with regional hotspots should not be interpreted as an indicator of the severity of regional hotspots compared with other areas but rather as an indicator of the frequency with which they are studied. In addition, the term “hotspot” is used to indicate the most impacted or frequent CE zone in this study based on the reviewed articles, which might have other uses in other climate studies (De Luca et al., 2020a; Ridder et al., 2020; Chiang et al., 2022b; He et al., 2022).
Additionally, in this review, only the large-scale CVs are called “drivers.” In contrast, other studies might have claimed that other events or impact variables/aspects are drivers of each other, as CEs, associated events, and impacts can influence each other (Slater et al., 2020; Zhang W. et al., 2021a). However, this study focuses on different analysis frameworks. As the large-scale modes of CVs are mainly assessed as driving forces with different framework components compared with other event–event or event–impact frameworks, they are mentioned as “drivers” in this study.
3.7 Research gaps and potential future works
Recent global and regional studies on CEs have analyzed several characteristics, driver associations, and impacts on several aspects (Hao et al., 2018b; Chiang et al., 2018; Wu et al., 2019b; 2019a). The assessment of frequency, spatial extent, correlations with variables and large-scale climate drivers, severity, probabilities of occurrence, RPs, and durations are among the most analyzed parameters either on a global scale or from a regional perspective in highly studied countries such as the United States, China, India, and Europe. However, global and regional research gaps exist on which future work should be planned.
Although Chinese studies have differentiated the impact on land-cover conditions and growth periods or growing seasons of major crops, the effect has not yet been directly assessed on yield data (Lu et al., 2018; Wang et al., 2018; Chen et al., 2021; Feng and Hao, 2021). The USA-based studies of CEs, as well as compound drought-related extremes, have already covered various aspects, including areas such as the likelihood of compound hot and drought extremes based on copula-based bivariate analysis (Hao et al., 2020b), RP analysis for California drought (AghaKouchak et al., 2014), analysis of statistically significant changes in the distribution of data (Mazdiyasni and AghaKouchak, 2015), the impact of compound drought and hot events on maize yield (Feng and Hao, 2020), analyzing shifts in temperature under various dryness conditions (Chiang et al., 2018), the occurrence of windy events with dry and hot conditions in the Great Plains of the United States (Tavakol et al., 2020), and the impact of ozone due to heatwave and stagnation (Zhang et al., 2018, 2020). However, the impacts on other major field crops (e.g., cotton, peanut, and soybean) and vegetation vulnerability are yet to be addressed.
For Europe, impacts such as forest mortality resulting from drought and heatwave (Gazol and Camarero, 2022), compound ozone and heatwave (Hertig et al., 2020; Jahn and Hertig, 2022), and various temperature and precipitation combinations have been assessed (Sedlmeier et al., 2016, 2018). However, other event combinations and impacts on crops, urbanization, and other aspects also need to be addressed in this region. For Australia, very few event combinations, such as drought and heatwave, strong winds, and heavy precipitation, are covered (Ridder et al., 2022a; Reddy et al., 2022); however, many other aspects (e.g., drought and fire risk, heatwave and ozone, warm and humid events, and drought and aridity), for which several parts of Australia have been deemed as global hotspots, have not yet been addressed from a regional perspective. The same is true for other hotspot regions, such as South Africa and South America (Tencer et al., 2016; Weber et al., 2020). In comparison to the United States and China, studies on other parts of the world have covered fewer aspects; however, they have included some local aspects that have not yet been covered in other regions, for example, the impact of reforestation on warm and dry, and warm and wet CEs in western Africa (Camara et al., 2022).
Other than drought and heatwave, the number of global studies has been limited for other event combinations (Figure 3). As the results are subjective to the studies identified in this literature review, a higher number of global studies can provide more hotspots produced from different data sources, timelines, and event/variable combinations, which are likely to provide more varied results. Even though global studies have covered various impacts and aspects such as population exposure to ozone and heatwave (Ban et al., 2022), maize yield vulnerability (Feng et al., 2019; 2021a), wheat growing season (He et al., 2022; Wu and Jiang, 2022), vegetation vulnerability (Kroll et al., 2022), population exposure to heat and humidity (Li et al., 2020), fire risk caused by drought and heatwaves (Ridder et al., 2020; Richardson et al., 2022), and various large-scale CVs related to CEs (Mukherjee et al., 2020; Mukherjee and Mishra, 2021), other potential aspects such as the effect of urbanization on CEs, concurrent day and nighttime heat extremes, and the impact of CEs on mortality/health are yet to be addressed on a global scale. These unexplored CEs and aspects on a global scale have been assessed in regional studies, showing significantly increasing trends and effects/impacts, respectively. Therefore, future research may include studies on other event combinations besides drought and heatwave as well as on potential aspects that include further knowledge in the CE analysis field. More studies on these unexplored topics can help find more global hotspots, trends, events, and impacts across various regions, timelines, and different data sources.
Although an analysis framework has been suggested and proposed in a previous review along with definitions of CEs, three major analysis frameworks applied across related articles that focus on drought- and heatwave-associated CEs have been categorized and summarized in this systematic review (Leonard et al., 2014). The same applies to the included hotspots reported in recent studies. Previous reviews have covered several other topics, such as statistical approaches, upcoming CEs, categorization of CEs, and mutual dependence patterns (Supplementary Table S3). However, the components of analytical frameworks and hotspots for drought- and heatwave-associated CEs are unexplored areas that have been comprehensively covered in this review. However, considering scope, this review limitedly summarizes the most frequently used methods and parameters. Thus, future work can potentially focus on infrequent methods, parameters and upcoming machine-learning-based approaches (Feng et al., 2021d; Sweet and Zscheischler, 2022).
4 Conclusion
This novel review presents an overall breakdown of the quantitative assessment of drought- and heatwave-associated CEs by mainly focusing on their hotspots, variables, analysis frameworks, assessed parameters, association with large-scale CVs as drivers, and impacts of CEs on several aspects. While hotspot mapping reveals the most frequently reported regions with CEs as per the reviewed global studies, event and variable combinations represent the variables/indices most commonly used to define combinations of events to form CEs. The most reported hotspots worldwide are found in Southern Africa, several parts of South America, Southeast Asia, South Asia, and Australia for various CE combinations studied in several global studies. As per the review, the most analyzed parameters of the considered CEs are frequency, spatial extent, compound indicator-based severity/magnitude of CEs, probability, RPs, duration, and correlation. While the frequency and spatial extent are usually assessed with the binary counting approach in the POT method, probabilities are determined using copula-based joint probability, conditional probability, and empirical probability approaches (Ye et al., 2019a; Wu et al., 2019b; Hao et al., 2019c). The most assessed large-scale mode of CV is found to be ENSO, whereas the impacts are found to be yield loss of several globally important crops, vegetation vulnerability, fire risk, air quality, urbanization effect, and CE frequencies under different land-use conditions (Hao et al., 2018b; Feng and Hao, 2020; Gao et al., 2020; Feng et al., 2021c; Kroll et al., 2022; Richardson et al., 2022). Therefore, this study breaks down the components of CE analysis frameworks into variables/indices, frequently calculated parameters, drivers, impacts, and associated methods. This study can aid future researchers in understanding the framework components of drought- and heatwave-associated CEs with reduced time and effort.
Data availability statement
The original contributions presented in the study are included in the article/Supplementary Material. Further inquiries can be directed to the corresponding author.
Author contributions
MA and AA conceptualized the study. The methodology design, data collection, and visualization were performed by MA. AA and GC supervised the research and acquired the funding. All authors contributed to the writing and editing of this manuscript.
Funding
This study was partially supported by the National Science Foundation under Grant no. 1735235 awarded as part of the National Science Foundation Research Traineeship; USDA-NIFA Capacity Building Grants 2017-38821-26405 and 2022–38821-37522; USDA-NIFA Evans-Allen Project, Grant 11979180/2016-01711; and USDA-NIFA Grant no. 2018-68002-27920.
Conflict of interest
The authors declare that the research was conducted in the absence of any commercial or financial relationships that could be construed as a potential conflict of interest.
Publisher’s note
All claims expressed in this article are solely those of the authors and do not necessarily represent those of their affiliated organizations or those of the publisher, the editors, and the reviewers. Any product that may be evaluated in this article, or claim that may be made by its manufacturer, is not guaranteed or endorsed by the publisher.
Supplementary material
The Supplementary Material for this article can be found online at: https://www.frontiersin.org/articles/10.3389/feart.2022.914437/full#supplementary-material
References
Afroz, M., Li, R., Chen, G., and Anandhi, A. (2021). Agricultural greenhouse gas emissions in a data-scarce region using a scenario-based modeling approach: A case study in southeastern USA. Agronomy 11, 1323. doi:10.3390/agronomy11071323
AghaKouchak, A., Cheng, L., Mazdiyasni, O., and Farahmand, A. (2014). Global warming and changes in risk of concurrent climate extremes: Insights from the 2014 California drought: Global Warming and Concurrent Extremes. Geophys. Res. Lett. 41, 8847–8852. doi:10.1002/2014GL062308
AghaKouchak, A., Chiang, F., Huning, L. S., Love, C. A., Mallakpour, I., Mazdiyasni, O., et al. (2020). Climate extremes and compound hazards in a warming world. Annu. Rev. Earth Planet. Sci. 48, 519–548. doi:10.1146/annurev-earth-071719-055228
Ambika, A. K., and Mishra, V. (2021). Modulation of compound extremes of low soil moisture and high vapor pressure Deficit by irrigation in India. Geophys. Res. Atmos. 126. doi:10.1029/2021JD034529
Anandhi, A., Sharma, A., and Sylvester, S. (2018). Can meta-analysis be used as a decision-making tool for developing scenarios and causal chains in eco-hydrological systems? Case study in Florida. Ecohydrology 11, e1997.
Ban, J., Lu, K., Wang, Q., and Li, T. (2022). Climate change will amplify the inequitable exposure to compound heatwave and ozone pollution. One Earth 5, 677–686. doi:10.1016/j.oneear.2022.05.007
Ben-Ari, T., Boé, J., Ciais, P., Lecerf, R., Van der Velde, M., and Makowski, D. (2018). Causes and implications of the unforeseen 2016 extreme yield loss in the breadbasket of France. Nat. Commun. 9, 1627. doi:10.1038/s41467-018-04087-x
Bento, V. A., Russo, A., Gouveia, C. M., and DaCamara, C. C. (2022). Recent change of burned area associated with summer heat extremes over Iberia. Int. J. Wildland Fire 31, 658–669. doi:10.1071/WF21155
Bezak, N., and Mikoš, M. (2020). Changes in the compound drought and extreme heat occurrence in the 1961–2018 period at the European scale. Water 12, 3543. doi:10.3390/w12123543
Brunner, M. I., Gilleland, E., and Wood, A. W. (2021). Space-time dependence of compound hot-dry events in the United States: Assessment using a multi-site multi-variable weather generator. Earth Syst. Dyn. Discuss. 1–19. doi:10.5194/esd-2021-5
Camara, M., Diba, I., and Diedhiou, A. (2022). Effects of land cover changes on compound extremes over west Africa using the regional climate model RegCM4. Atmosphere 13, 421. doi:10.3390/atmos13030421
Chen, Y., Liao, Z., Shi, Y., Tian, Y., and Zhai, P. (2021). Detectable increases in sequential flood-heatwave events across China during 1961–2018. Geophys. Res. Lett. 48. doi:10.1029/2021GL092549
Cheng, L., Hoerling, M., Liu, Z., and Eischeid, J. (2019). Physical understanding of human-induced changes in U.S. Hot droughts using equilibrium climate simulations. J. Clim. 32, 4431–4443. doi:10.1175/JCLI-D-18-0611.1
Cheraghalizadeh, M., Ghameshlou, A. N., Bazrafshan, J., and Bazrafshan, O. (2018). A copula-based joint meteorological–hydrological drought index in a humid region (Kasilian basin, North Iran). Arab. J. Geosci. 11, 300. doi:10.1007/s12517-018-3671-7
Chiang, F., Cook, B. I., McDermid, S., Marvel, K., Schmidt, G. A., Nazarenko, L. S., et al. (2022a). Responses of compound daytime and nighttime warm-dry and warm-humid events to individual anthropogenic forcings. Environ. Res. Lett. 17, 084015. doi:10.1088/1748-9326/ac80ce
Chiang, F., Greve, P., Mazdiyasni, O., Wada, Y., and AghaKouchak, A. (2022b). Intensified likelihood of concurrent warm and dry months attributed to anthropogenic climate change. Water Resour. Res. 58. doi:10.1029/2021WR030411
Chiang, F., Mazdiyasni, O., and AghaKouchak, A. (2018). Amplified warming of droughts in southern United States in observations and model simulations. Sci. Adv. 4, eaat2380. doi:10.1126/sciadv.aat2380
Coffel, E. D., Keith, B., Lesk, C., Horton, R. M., Bower, E., Lee, J., et al. (2019). Future hot and dry years worsen Nile Basin water scarcity despite projected precipitation increases. Earth's. Future 7, 967–977. doi:10.1029/2019EF001247
Das, J., Manikanta, V., and Umamahesh, N. V. (2022). Population exposure to compound extreme events in India under different emission and population scenarios. Sci. Total Environ. 806, 150424. doi:10.1016/j.scitotenv.2021.150424
De Luca, P., Messori, G., Faranda, D., Ward, P. J., and Coumou, D. (2020a). Compound warm–dry and cold–wet events over the Mediterranean. Earth Syst. Dynam. 11, 793–805. doi:10.5194/esd-11-793-2020
De Luca, P., Messori, G., Wilby, R. L., Mazzoleni, M., and Di Baldassarre, G. (2020b). Concurrent wet and dry hydrological extremes at the global scale. Earth Syst. Dynam. 11, 251–266. doi:10.5194/esd-11-251-2020
Esteban, E. J. L., Castilho, C. V., Melgaço, K. L., and Costa, F. R. C. (2021). The other side of droughts: Wet extremes and topography as buffers of negative drought effects in an amazonian forest. New Phytol. 229, 1995–2006. doi:10.1111/nph.17005
Feng, S., and Hao, Z. (2020). Quantifying likelihoods of extreme occurrences causing maize yield reduction at the global scale. Sci. Total Environ. 704, 135250. doi:10.1016/j.scitotenv.2019.135250
Feng, S., and Hao, Z. (2021). Quantitative contribution of ENSO to precipitation-temperature dependence and associated compound dry and hot events. Atmos. Res. 260, 105695. doi:10.1016/j.atmosres.2021.105695
Feng, S., Hao, Z., Wu, X., Zhang, X., and Hao, F. (2021a). A multi-index evaluation of changes in compound dry and hot events of global maize areas. J. Hydrology 602, 126728. doi:10.1016/j.jhydrol.2021.126728
Feng, S., Hao, Z., Zhang, X., and Hao, F. (2021b). Changes in climate-crop yield relationships affect risks of crop yield reduction. Agric. For. Meteorology 304, 108401. doi:10.1016/j.agrformet.2021.108401
Feng, S., Hao, Z., Zhang, X., and Hao, F. (2019). Probabilistic evaluation of the impact of compound dry-hot events on global maize yields. Sci. Total Environ. 689, 1228–1234. doi:10.1016/j.scitotenv.2019.06.373
Feng, Y., Liu, W., Sun, F., and Wang, H. (2021c). Changes of compound hot and dry extremes on different land surface conditions in China during 1957–2018. Int. J. Climatol. 41, E1085–E1099. doi:10.1002/joc.6755
Feng, Y., Maulik, R., Wang, J., Balaprakash, P., Huang, W., Rao, V., et al. (2021d). Characterization of extremes and compound impacts: Applications of machine learning and interpretable neural networks. Artif. Intell. Earth Syst. Predict. AI4ESP 34, 176298.
Gao, H., Luo, Y., Jiang, X., Zhang, D.-L., Chen, Y., Wang, Y., et al. (2021). A statistical analysis of extreme hot characteristics and their relationships with urbanization in southern China during 1971–2020. J. Appl. Meteorology Climatol. 60, 1301–1317. doi:10.1175/jamc-d-21-0012.1
Gao, Y., Zhang, J., Yan, F., Leung, L. R., Luo, K., Zhang, Y., et al. (2020). Nonlinear effect of compound extreme weather events on ozone formation over the United States. Weather Clim. Extrem. 30, 100285. doi:10.1016/j.wace.2020.100285
Garry, F. K., Bernie, D. J., Davie, J. C. S., and Pope, E. C. D. (2021). Future climate risk to UK agriculture from compound events. Clim. Risk Manag. 32, 100282. doi:10.1016/j.crm.2021.100282
Gazol, A., and Camarero, J. J. (2022). Compound climate events increase tree drought mortality across European forests. Sci. total Environ. 816, 151604. doi:10.1016/j.scitotenv.2021.151604
Geirinhas, J. L., Russo, A., Libonati, R., Sousa, P. M., Miralles, D. G., and Trigo, R. M. (2021). Recent increasing frequency of compound summer drought and heatwaves in Southeast Brazil. Environ. Res. Lett. 16, 034036. doi:10.1088/1748-9326/abe0eb
Goodess, C. M. (2013). How is the frequency, location and severity of extreme events likely to change up to 2060? Environ. Sci. Policy 27, S4–S14. doi:10.1016/j.envsci.2012.04.001
Gouveia, C. M., Bistinas, I., Liberato, M. L. R., Bastos, A., Koutsias, N., and Trigo, R. (2016). The outstanding synergy between drought, heatwaves and fuel on the 2007 Southern Greece exceptional fire season. Agric. For. Meteorology 218–219, 135–145. doi:10.1016/j.agrformet.2015.11.023
Hao, Y., Hao, Z., Feng, S., Zhang, X., and Hao, F. (2020a). Response of vegetation to El Niño-Southern Oscillation (ENSO) via compound dry and hot events in southern Africa. Glob. Planet. Change 195, 103358. doi:10.1016/j.gloplacha.2020.103358
Hao, Z., Hao, F., Singh, V. P., Xia, Y., Shi, C., and Zhang, X. (2018a). A multivariate approach for statistical assessments of compound extremes. J. Hydrology 565, 87–94. doi:10.1016/j.jhydrol.2018.08.025
Hao, Z., Hao, F., Singh, V. P., and Zhang, X. (2018b). Quantifying the relationship between compound dry and hot events and El Niño–southern Oscillation (ENSO) at the global scale. J. Hydrology 567, 332–338. doi:10.1016/j.jhydrol.2018.10.022
Hao, Z., Hao, F., Singh, V. P., and Zhang, X. (2019a). Statistical prediction of the severity of compound dry-hot events based on El Niño-Southern Oscillation. J. Hydrology 572, 243–250. doi:10.1016/j.jhydrol.2019.03.001
Hao, Z., Hao, F., Xia, Y., Singh, V. P., and Zhang, X. (2019b). A monitoring and prediction system for compound dry and hot events. Environ. Res. Lett. 14, 114034. doi:10.1088/1748-9326/ab4df5
Hao, Z., Li, W., Singh, V. P., Xia, Y., Zhang, X., and Hao, F. (2020b). Impact of dependence changes on the likelihood of hot extremes under drought conditions in the United States. J. Hydrology 581, 124410. doi:10.1016/j.jhydrol.2019.124410
Hao, Z., Singh, V., and Hao, F. (2018c). Compound extremes in hydroclimatology: A review. Water 10, 718. doi:10.3390/w10060718
Hao, Z., and Singh, V. P. (2020). Compound events under global warming: A dependence perspective. J. Hydrol. Eng. 25, 03120001. doi:10.1061/(ASCE)HE.1943-5584.0001991
Hao, Z., Zhang, X., Singh, V. P., and Hao, F. (2020c). Joint modeling of precipitation and temperature under influences of El Niño Southern Oscillation for compound event evaluation and prediction. Atmos. Res. 245, 105090. doi:10.1016/j.atmosres.2020.105090
Haqiqi, I., Grogan, D. S., Hertel, T. W., and Schlenker, W. (2021). Quantifying the impacts of compound extremes on agriculture. Hydrol. Earth Syst. Sci. 25, 551–564. doi:10.5194/hess-25-551-2021
Haraguchi, M., Davi, N., Rao, M. P., Leland, C., Watanabe, M., and Lall, U. (2022). Estimating return intervals for extreme climate conditions related to winter disasters and livestock mortality in Mongolia. Nat. Hazards Earth Syst. Sci. 22, 2751–2770. doi:10.5194/nhess-22-2751-2022
He, X., and Sheffield, J. (2020). Lagged compound occurrence of droughts and pluvials globally over the past seven decades. Geophys. Res. Lett. 47, e2020GL087924. doi:10.1029/2020GL087924
He, Y., Fang, J., Xu, W., and Shi, P. (2022). Substantial increase of compound droughts and heatwaves in wheat growing seasons worldwide. Intl. J. Climatol. 42, 5038–5054. doi:10.1002/joc.7518
Hertig, E., Russo, A., and Trigo, R. M. (2020). Heat and ozone pollution waves in central and South europe—characteristics, weather types, and association with mortality. Atmosphere 11, 1271. doi:10.3390/atmos11121271
Jahn, S., and Hertig, E. (2022). Using clustering, statistical modeling, and climate change projections to analyze recent and future region-specific compound ozone and temperature burden over Europe. GeoHealth 6, e2021GH000561. doi:10.1029/2021gh000561
Kirono, D. G. C., Hennessy, K. J., and Grose, M. R. (2017). Increasing risk of months with low rainfall and high temperature in southeast Australia for the past 150years. Clim. Risk Manag. 16, 10–21. doi:10.1016/j.crm.2017.04.001
Kong, Q., Guerreiro, S. B., Blenkinsop, S., Li, X.-F., and Fowler, H. J. (2020). Increases in summertime concurrent drought and heatwave in Eastern China. Weather Clim. Extrem. 28, 100242. doi:10.1016/j.wace.2019.100242
Kopp, R., Easterling, D., Hall, T., Hayhoe, K., Horton, R., Kunkel, K., et al. (2017). Potential surprises – compound extremes and tipping elements. Publ. Agencies Staff U.S. Dep. Commer. Available at: https://digitalcommons.unl.edu/usdeptcommercepub/578.
Kroll, J., Denissen, J. M. C., Migliavacca, M., Li, W., Hildebrandt, A., and Orth, R. (2022). Spatially varying relevance of hydrometeorological hazards for vegetation productivity extremes. Biogeosciences 19, 477–489. doi:10.5194/bg-19-477-2022
Leonard, M., Westra, S., Phatak, A., Lambert, M., van den Hurk, B., McInnes, K., et al. (2014). A compound event framework for understanding extreme impacts. WIREs Clim. Change 5, 113–128. doi:10.1002/wcc.252
Lesk, C., and Anderson, W. (2021). Decadal variability modulates trends in concurrent heat and drought over global croplands. Environ. Res. Lett. 16, 055024. doi:10.1088/1748-9326/abeb35
Li, D., Yuan, J., and Kopp, R. E. (2020). Escalating global exposure to compound heat-humidity extremes with warming. Environ. Res. Lett. 15, 064003. doi:10.1088/1748-9326/ab7d04
Li, E., Zhao, J., Pullens, J. W., and Yang, X. (2022a). The compound effects of drought and high temperature stresses will be the main constraints on maize yield in Northeast China. Sci. Total Environ. 812, 152461. doi:10.1016/j.scitotenv.2021.152461
Li, H. W., Li, Y. P., Huang, G. H., and Sun, J. (2021). Quantifying effects of compound dry-hot extremes on vegetation in Xinjiang (China) using a vine-copula conditional probability model. Agric. For. Meteorology 311, 108658. doi:10.1016/j.agrformet.2021.108658
Li, J., Bevacqua, E., Chen, C., Wang, Z., Chen, X., Myneni, R. B., et al. (2022b). Regional asymmetry in the response of global vegetation growth to springtime compound climate events. Commun. Earth Environ. 3, 123–129. doi:10.1038/s43247-022-00455-0
Liao, W., Li, D., Malyshev, S., Shevliakova, E., Zhang, H., and Liu, X. (2021a). Amplified increases of compound hot extremes over urban land in China. Geophys. Res. Lett. 48, e2020GL091252. doi:10.1029/2020gl091252
Liao, Z., Chen, Y., Li, W., and Zhai, P. (2021b). Growing threats from unprecedented sequential flood-hot extremes across China. Geophys. Res. Lett. 48, e2021GL094505. doi:10.1029/2021gl094505
Libonati, R., Geirinhas, J. L., Silva, P. S., Russo, A., Rodrigues, J. A., Belém, L. B. C., et al. (2022). Assessing the role of compound drought and heatwave events on unprecedented 2020 wildfires in the Pantanal. Environ. Res. Lett. 17, 015005. doi:10.1088/1748-9326/ac462e
Liu, L., Jiang, Y., Gao, J., Feng, A., Jiao, K., Wu, S., et al. (2022). Concurrent climate extremes and impacts on ecosystems in southwest China. Remote Sens. 14, 1678. doi:10.3390/rs14071678
Lu, Y., Hu, H., Li, C., and Tian, F. (2018). Increasing compound events of extreme hot and dry days during growing seasons of wheat and maize in China. Sci. Rep. 8, 16700. doi:10.1038/s41598-018-34215-y
Ma, Q., Zhang, J., Game, A. T., Chang, Y., and Li, S. (2020a). Spatiotemporal variability of summer precipitation and precipitation extremes and associated large-scale mechanisms in Central Asia during 1979–2018. J. Hydrology X 8, 100061. doi:10.1016/j.hydroa.2020.100061
Ma, S., Zhu, C., and Liu, J. (2020b). Combined impacts of warm central equatorial pacific sea surface temperatures and anthropogenic warming on the 2019 severe drought in East China. Adv. Atmos. Sci. 37, 1149–1163. doi:10.1007/s00376-020-0077-8
Manning, C., Widmann, M., Bevacqua, E., Loon, A. F. V., Maraun, D., and Vrac, M. (2019). Increased probability of compound long-duration dry and hot events in Europe during summer (1950–2013). Environ. Res. Lett. 14, 094006. doi:10.1088/1748-9326/ab23bf
Manning, C., Widmann, M., Bevacqua, E., Loon, A. F. V., Maraun, D., and Vrac, M. (2018). Soil moisture drought in Europe: A compound event of precipitation and potential evapotranspiration on multiple time scales. J. Hydrometeorol. 19, 1255–1271. doi:10.1175/JHM-D-18-0017.1
Marengo, J. A., Ambrizzi, T., Barreto, N., Cunha, A. P., Ramos, A. M., Skansi, M., et al. (2022). The heat wave of October 2020 in central South America. Intl. J. Climatol. 42, 2281–2298. doi:10.1002/joc.7365
Matthews, T., Wilby, R. L., and Murphy, C. (2019). An emerging tropical cyclone–deadly heat compound hazard. Nat. Clim. Chang. 9, 602–606. doi:10.1038/s41558-019-0525-6
Mazdiyasni, O., and AghaKouchak, A. (2015). Substantial increase in concurrent droughts and heatwaves in the United States. Proc. Natl. Acad. Sci. U. S. A. 112, 11484–11489. doi:10.1073/pnas.1422945112
Miao, C., Sun, Q., Duan, Q., and Wang, Y. (2016). Joint analysis of changes in temperature and precipitation on the Loess Plateau during the period 1961–2011. Clim. Dyn. 47, 3221–3234. doi:10.1007/s00382-016-3022-x
Mishra, V., Aadhar, S., and Mahto, S. S. (2021). Anthropogenic warming and intraseasonal summer monsoon variability amplify the risk of future flash droughts in India. npj Clim. Atmos. Sci. 4, 1–10. doi:10.1038/s41612-020-00158-3
Mishra, V., Thirumalai, K., Singh, D., and Aadhar, S. (2020). Future exacerbation of hot and dry summer monsoon extremes in India. npj Clim. Atmos. Sci. 3, 10–19. doi:10.1038/s41612-020-0113-5
Mukherjee, S., Ashfaq, M., and Mishra, A. K. (2020). Compound drought and heatwaves at a global scale: The role of natural climate variability-associated synoptic patterns and land-surface energy budget anomalies. J. Geophys. Res. Atmos. 125, e2019JD031943. doi:10.1029/2019JD031943
Mukherjee, S., and Mishra, A. K. (2021). Increase in compound drought and heatwaves in a warming world. Geophys. Res. Lett. 48, e2020GL090617. doi:10.1029/2020GL090617
Mukherjee, S., and Mishra, V. (2018). A sixfold rise in concurrent day and night-time heatwaves in India under 2 °C warming. Sci. Rep. 8, 16922. doi:10.1038/s41598-018-35348-w
Mulder, V. L., van Eck, C. M., Friedlingstein, P., Arrouays, D., and Regnier, P. (2019). Controlling factors for land productivity under extreme climatic events in continental Europe and the Mediterranean Basin. Catena 182, 104124. doi:10.1016/j.catena.2019.104124
Naveendrakumar, G., Vithanage, M., Kwon, H.-H., Chandrasekara, S. S. K., Iqbal, M. C. M., Pathmarajah, S., et al. (2019). South asian perspective on temperature and rainfall extremes: A review. Atmos. Res. 225, 110–120. doi:10.1016/j.atmosres.2019.03.021
Peng, P., Lin, X., Ünal, Z. E., Lee, K., Namkung, J., Chow, J., et al. (2020). Examining the mutual relations between language and mathematics: A meta-analysis. Psychol. Bull. 146, 595–634. doi:10.1037/bul0000231
Qiao, Y., Xu, W., Wu, D., Meng, C., Qin, L., Li, Z., et al. (2022). Changes in the spatiotemporal patterns of dry/wet abrupt alternation frequency, duration, and severity in Mainland China, 1980–2019. Sci. Total Environ. 838, 156521. doi:10.1016/j.scitotenv.2022.156521
Raymond, C., Horton, R. M., Zscheischler, J., Martius, O., AghaKouchak, A., Balch, J., et al. (2020). Understanding and managing connected extreme events. Nat. Clim. Chang. 10, 611–621. doi:10.1038/s41558-020-0790-4
Raymond, C., Matthews, T., Horton, R. M., Fischer, E. M., Fueglistaler, S., Ivanovich, C., et al. (2021). On the controlling factors for globally extreme humid heat. Geophys. Res. Lett. 48, e2021GL096082. doi:10.1029/2021GL096082
Reddy, P. J., Perkins-Kirkpatrick, S. E., Ridder, N. N., and Sharples, J. J. (2022). Combined role of ENSO and IOD on compound drought and heatwaves in Australia using two CMIP6 large ensembles. Weather Clim. Extrem., 100469.
Ribeiro, A. F., Brando, P. M., Santos, L., Rattis, L., Hirschi, M., Hauser, M., et al. (2022). A compound event-oriented framework to tropical fire risk assessment in a changing climate. Environ. Res. Lett. 17, 065015. doi:10.1088/1748-9326/ac7342
Ribeiro, A. F. S., Russo, A., Gouveia, C. M., Páscoa, P., and Zscheischler, J. (2020a). Risk of crop failure due to compound dry and hot extremes estimated with nested copulas. Biogeosciences 17, 4815–4830. doi:10.5194/bg-17-4815-2020
Ribeiro, A. F. S., Russo, A., Gouveia, C. M., and Pires, C. A. L. (2020b). Drought-related hot summers: A joint probability analysis in the iberian Peninsula. Weather Clim. Extrem. 30, 100279. doi:10.1016/j.wace.2020.100279
Richardson, D., Black, A. S., Irving, D., Matear, R. J., Monselesan, D. P., Risbey, J. S., et al. (2022). Global increase in wildfire potential from compound fire weather and drought. npj Clim. Atmos. Sci. 5, 23–12. doi:10.1038/s41612-022-00248-4
Ridder, N. N., Pitman, A. J., and Ukkola, A. M. (2022a). High impact compound events in Australia. Weather Clim. Extrem. 36, 100457. doi:10.1016/j.wace.2022.100457
Ridder, N. N., Pitman, A. J., Westra, S., Ukkola, A., Do, H. X., Bador, M., et al. (2020). Global hotspots for the occurrence of compound events. Nat. Commun. 11, 5956. doi:10.1038/s41467-020-19639-3
Ridder, N. N., Ukkola, A. M., Pitman, A. J., and Perkins-Kirkpatrick, S. E. (2022b). Increased occurrence of high impact compound events under climate change. npj Clim. Atmos. Sci. 5, 3–8. doi:10.1038/s41612-021-00224-4
Russo, A., Gouveia, C. M., Dutra, E., Soares, P. M. M., and Trigo, R. M. (2019). The synergy between drought and extremely hot summers in the Mediterranean. Environ. Res. Lett. 14, 014011. doi:10.1088/1748-9326/aaf09e
Sedlmeier, K., Feldmann, H., and Schädler, G. (2018). Compound summer temperature and precipitation extremes over central Europe. Theor. Appl. Climatol. 131, 1493–1501. doi:10.1007/s00704-017-2061-5
Sedlmeier, K., Mieruch, S., Schädler, G., and Kottmeier, C. (2016). Compound extremes in a changing climate – A Markov chain approach. Nonlin. Process. Geophys. 23, 375–390. doi:10.5194/npg-23-375-2016
Sharma, S., and Mujumdar, P. (2017). Increasing frequency and spatial extent of concurrent meteorological droughts and heatwaves in India. Sci. Rep. 7, 15582. doi:10.1038/s41598-017-15896-3
Shi, W., Huang, S., Liu, D., Huang, Q., Leng, G., Wang, H., et al. (2020). Dry and wet combination dynamics and their possible driving forces in a changing environment. J. Hydrology 589, 125211. doi:10.1016/j.jhydrol.2020.125211
Slater, L. J., Anderson, B., Buechel, M., Dadson, S., Han, S., Harrigan, S., et al. (2020). Nonstationary weather and water extremes: A review of methods for their detection, attribution, and management. Hydrology Earth Syst. Sci. Discuss., 1–54. doi:10.5194/hess-2020-576
Sutanto, S. J., Vitolo, C., Di Napoli, C., D’Andrea, M., and Van Lanen, H. A. J. (2020). Heatwaves, droughts, and fires: Exploring compound and cascading dry hazards at the pan-European scale. Environ. Int. 134, 105276. doi:10.1016/j.envint.2019.105276
Sweet, L., and Zscheischler, J. (2022). Using interpretable machine learning to identify compound meteorological drivers of crop yield failure. Copernic. Meet. 322, 743.
Tavakol, A., Rahmani, V., and Harrington, J. (2020). Probability of compound climate extremes in a changing climate: A copula-based study of hot, dry, and windy events in the central United States. Environ. Res. Lett. 15, 104058. doi:10.1088/1748-9326/abb1ef
Tencer, B., Bettolli, M. L., and Rusticucci, M. (2016). Compound temperature and precipitation extreme events in southern South America: Associated atmospheric circulation, and simulations by a multi-RCM ensemble. Clim. Res. 68, 183–199. doi:10.3354/cr01396
Toreti, A., Cronie, O., and Zampieri, M. (2019). Concurrent climate extremes in the key wheat producing regions of the world. Sci. Rep. 9, 5493. doi:10.1038/s41598-019-41932-5
Tschumi, E., Lienert, S., van der Wiel, K., Joos, F., and Zscheischler, J. (2022a). A climate database with varying drought-heat signatures for climate impact modelling. Geoscience Data J. 9, 154–166. doi:10.1002/gdj3.129
Tschumi, E., Lienert, S., van der Wiel, K., Joos, F., and Zscheischler, J. (2022b). The effects of varying drought-heat signatures on terrestrial carbon dynamics and vegetation composition. Biogeosciences 19, 1979–1993. doi:10.5194/bg-19-1979-2022
Vogel, J., Paton, E., Aich, V., and Bronstert, A. (2021). Increasing compound warm spells and droughts in the Mediterranean Basin. Weather Clim. Extrem. 32, 100312. doi:10.1016/j.wace.2021.100312
Vorobevskii, I., Kronenberg, R., and Bernhofer, C. (2022). Linking different drought types in a small catchment from a statistical perspective–Case study of the Wernersbach catchment, Germany. J. Hydrology X 15, 100122. doi:10.1016/j.hydroa.2022.100122
Wang, J., Chen, Y., Liao, W., He, G., Tett, S. F., Yan, Z., et al. (2021). Anthropogenic emissions and urbanization increase risk of compound hot extremes in cities. Nat. Clim. Chang. 11, 1084–1089. doi:10.1038/s41558-021-01196-2
Wang, L., Liao, S., Huang, S., Ming, B., Meng, Q., and Wang, P. (2018). Increasing concurrent drought and heat during the summer maize season in Huang–Huai–Hai Plain, China. Int. J. Climatol. 38, 3177–3190. doi:10.1002/joc.5492
Weber, T., Bowyer, P., Rechid, D., Pfeifer, S., Raffaele, F., Remedio, A. R., et al. (2020). Analysis of compound climate extremes and exposed population in Africa under two different emission scenarios. Earth's. Future 8, e2019EF001473. doi:10.1029/2019ef001473
Wu, S., Chan, T. O., Zhang, W., Ning, G., Wang, P., Tong, X., et al. (2021a). Increasing compound heat and precipitation extremes elevated by urbanization in South China. Front. Earth Sci. 9. Available at: https://www.frontiersin.org/articles/10.3389/feart.2021.636777 (Accessed September 23, 2022).
Wu, S., Wang, P., Tong, X., Tian, H., Zhao, Y., and Luo, M. (2021b). Urbanization-driven increases in summertime compound heat extremes across China. Sci. Total Environ. 799, 149166. doi:10.1016/j.scitotenv.2021.149166
Wu, X., Hao, Z., Hao, F., Li, C., and Zhang, X. (2019a). Spatial and temporal variations of compound droughts and hot extremes in China. Atmosphere 10, 95. doi:10.3390/atmos10020095
Wu, X., Hao, Z., Hao, F., Singh, V. P., and Zhang, X. (2019b). Dry-hot magnitude index: A joint indicator for compound event analysis. Environ. Res. Lett. 14, 064017. doi:10.1088/1748-9326/ab1ec7
Wu, X., Hao, Z., Hao, F., Zhang, X., Singh, V. P., and Sun, C. (2021c). Influence of large-scale circulation patterns on compound dry and hot events in China. JGR. Atmos. 126, e2020JD033918. doi:10.1029/2020JD033918
Wu, X., Hao, Z., Hao, F., and Zhang, X. (2019c). Variations of compound precipitation and temperature extremes in China during 1961–2014. Sci. Total Environ. 663, 731–737. doi:10.1016/j.scitotenv.2019.01.366
Wu, X., Hao, Z., Tang, Q., Singh, V. P., Zhang, X., and Hao, F. (2021d). Projected increase in compound dry and hot events over global land areas. Int. J. Climatol. 41, 393–403. doi:10.1002/joc.6626
Wu, X., Hao, Z., Zhang, X., Li, C., and Hao, F. (2020). Evaluation of severity changes of compound dry and hot events in China based on a multivariate multi-index approach. J. Hydrology 583, 124580. doi:10.1016/j.jhydrol.2020.124580
Wu, X., and Jiang, D. (2022). Probabilistic impacts of compound dry and hot events on global gross primary production. Environ. Res. Lett. 17, 034049. doi:10.1088/1748-9326/ac4c5b
Xu, F., and Luo, M. (2019). Changes of concurrent drought and heat extremes in the arid and semi-arid regions of China during 1961–2014. Atmos. Sci. Lett. 20, e947. doi:10.1002/asl.947
Yang, Y., Zhao, N., Wang, Y., and Chen, M. (2022). Variations in summertime compound heat extremes and their connections to urbanization in China during 1980–2020. Environ. Res. Lett. 17, 064024. doi:10.1088/1748-9326/ac61c5
Ye, L., Shi, K., Xin, Z., Wang, C., and Zhang, C. (2019a). Compound droughts and heat waves in China. Sustainability 11, 3270. doi:10.3390/su11123270
Ye, L., Shi, K., Xin, Z., Wang, C., and Zhang, C. (2019b). Rapid increase in the compound droughts and heat waves in China. AGU Fall Meet. Abstr. 41. Available at: http://adsabs.harvard.edu/abs/2019AGUFM (Accessed February 12, 2021).
Yu, R., and Zhai, P. (2020a). Changes in compound drought and hot extreme events in summer over populated eastern China. Weather Clim. Extrem. 30, 100295. doi:10.1016/j.wace.2020.100295
Yu, R., and Zhai, P. (2020b). More frequent and widespread persistent compound drought and heat event observed in China. Sci. Rep. 10, 14576. doi:10.1038/s41598-020-71312-3
Zhan, W., He, X., Sheffield, J., and Wood, E. F. (2020). Projected seasonal changes in large-scale global precipitation and temperature extremes based on the CMIP5 ensemble. J. Clim. 33, 5651–5671. doi:10.1175/JCLI-D-19-0311.1
Zhang, J., Gao, Y., Luo, K., Leung, L. R., Zhang, Y., Wang, K., et al. (2018). Impacts of compound extreme weather events on ozone in the present and future. Atmos. Chem. Phys. 18, 9861–9877. doi:10.5194/acp-18-9861-2018
Zhang, W., Luo, M., Gao, S., Chen, W., Hari, V., and Khouakhi, A. (2021a). Compound hydrometeorological extremes: Drivers, mechanisms and methods. Front. Earth Sci. 9, 673495. doi:10.3389/feart.2021.673495
Zhang, Y., Yang, P., Gao, Y., Leung, R. L., and Bell, M. L. (2020). Health and economic impacts of air pollution induced by weather extremes over the continental US. Environ. Int. 143, 105921. doi:10.1016/j.envint.2020.105921
Zhang, Y., Yang, X., and Chen, C. (2021b). Substantial decrease in concurrent meteorological droughts and consecutive cold events in Huai River Basin, China. Int. J. Climatol. 41, 6065–6083. doi:10.1002/joc.7168
Zhou, P., and Liu, Z. (2018). Likelihood of concurrent climate extremes and variations over China. Environ. Res. Lett. 13, 094023. doi:10.1088/1748-9326/aade9e
Zhou, S., Williams, A. P., Berg, A. M., Cook, B. I., Zhang, Y., Hagemann, S., et al. (2019a). Land–atmosphere feedbacks exacerbate concurrent soil drought and atmospheric aridity. Proc. Natl. Acad. Sci. U. S. A. 116, 18848–18853. doi:10.1073/pnas.1904955116
Zhou, S., Zhang, Y., Park Williams, A., and Gentine, P. (2019b). Projected increases in intensity, frequency, and terrestrial carbon costs of compound drought and aridity events. Sci. Adv. 5, eaau5740. doi:10.1126/sciadv.aau5740
Zong, L., Yang, Y., Xia, H., Gao, M., Sun, Z., Zheng, Z., et al. (2022). Joint occurrence of heatwaves and ozone pollution and increased health risks in beijing, China: Role of synoptic weather pattern and urbanization. Atmos. Chem. Phys. 22, 6523–6538. doi:10.5194/acp-22-6523-2022
Zscheischler, J., Martius, O., Westra, S., Bevacqua, E., Raymond, C., Horton, R. M., et al. (2020). A typology of compound weather and climate events. Nat. Rev. Earth Environ. 1, 333–347. doi:10.1038/s43017-020-0060-z
Keywords: compound extremes, drought, heatwave, hotspots, variables, analysis frameworks
Citation: Afroz M, Chen G and Anandhi A (2023) Drought- and heatwave-associated compound extremes: A review of hotspots, variables, parameters, drivers, impacts, and analysis frameworks. Front. Earth Sci. 10:914437. doi: 10.3389/feart.2022.914437
Received: 06 April 2022; Accepted: 07 December 2022;
Published: 03 February 2023.
Edited by:
Sergio M. Vicente-Serrano, Spanish National Research Council (CSIC), SpainReviewed by:
Ana Cristina Russo, University of Lisbon, PortugalAli Danandeh Mehr, Antalya Bilim University, Turkey
Safwan Mohammed, University of Debrecen, Hungary
Copyright © 2023 Afroz, Chen and Anandhi. This is an open-access article distributed under the terms of the Creative Commons Attribution License (CC BY). The use, distribution or reproduction in other forums is permitted, provided the original author(s) and the copyright owner(s) are credited and that the original publication in this journal is cited, in accordance with accepted academic practice. No use, distribution or reproduction is permitted which does not comply with these terms.
*Correspondence: Aavudai Anandhi, anandhi@famu.edu