Unconfined compressive strength and pore structure evolution law of structural clay after disturbance
 Bin Tang
 Liang Xie
 Wei Wang
 Biaohe Zhou
 Yanxia Gong
- 1College of Civil Engineering and Architectural, Guilin University of Technology, Guilin, China
- 2Wuhan Surveying-Geotechnical Research Institute Co., Ltd. of MCC, Wuhan, China
- 3Department of Civil Engineering, HuBei University of Technology Engineering and Technology College, Wuhan, China
The clay in the Zhanjiang Formation has thixotropic properties, which has greatly influenced the foundation engineering in the Zhanjiang area. The evolution law of macroscopic strength and clay microstructure during thixotropy can be used to explain the practical engineering problems caused by thixotropy. For undisturbed and reconstituted soil curing for a different period, unconfined compressive strength test, scanning electron microscopy, and mercury injection porosimetry test were carried out to obtain the unconfined compressive strength and pore structure evolution law in the thixotropic process. The results indicate that the Zhanjiang Formation structural clay is very sensitive to disturbance and its unconfined compressive strength decreases from 180.29 to 11.73 kPa after the natural structure is completely destructed. After 300 d of curing, the unconfined compressive strength of clay increased from 11.73 to 53.43 kPa because of thixotropy, which increased by 3.55 times. The stacking flaky flocculation structure of the undisturbed soil is destructed by reconstituting, turning to flaky flocculation structure, and the large pores are homogenized, the small pores develop into medium pores, and there is a decrease in soil strength. In the process of thixotropy, the soil particles gradually coagulate and form an aggregates flocculation structure, and the strength of clay increases with the increase in the degree of cementation. Based on the results, the thixotropic pattern of clay was established and its thixotropic mechanism was explained.
1 Introduction
Clay thixotropy of refers to a phenomenon in which the original soil structure is destructed when the soil is disturbed, and its mechanical strength decreases dramatically. After disturbance, part of the mechanical strength gradually recovers with time (Boswell, 1948; Skemption and Northey, 1952; Mitchell, 1961; Mewis, 1979; Barnes, 1997; Díaz-Rodríguez and Santamarina, 1999; Tang et al., 2021a). Shahriar and Jadid (2018) and Shahriar et al. (2018) studied the change rule of mechanical properties of reconstituted clays with specific water content over time, finding that the shear strength and yield stress of reconstituted clays increased significantly after 90 d compared to the initial moment. According to Kamil and Aljorany’s (2019) study on the thixotropy of 180 soil samples, the strength of the soil decreased by 45% following reconstitution, and after 25 weeks of standing, the strength of the soil recovered to the strength of the undisturbed soil caused by the thixotropic effect. Under the influence of thixotropy, the strength and deformation characteristics of soil show strong time dependence (Ruge et al., 2019; Alam et al., 2021; Tang et al., 2021b). The study of thixotropic soil behavior can provide a basis for selecting parameters of reliability design of foundation engineering under long-term load.
Studies on the thixotropy of clay have achieved a lot in terms of macroscopic mechanical properties (Rinaldi and Clariá, 2016; Yang and Andersen, 2016; Larson and Wei, 2019; Ren et al., 2021; Yang et al., 2021; Zhou et al., 2021), but there is still no unified understanding of the action mechanism of the clay thixotropy. According to the study of Huo et al. (2016), the particles of clay are usually charged, and the electrostatic interaction between the particles causes the particles to flocculate, forming the first-order flocculation structure, and cementing between the flocculants to form the second order or even higher-order flocculation structure. The process of disturbance will destruct the flocculation structure of the clay. In the thixotropic process, the clay particles follow the minimum energy principle to re-flocculate and re-cement, forming a new stable structure, and the strength of the clay gradually increases. At the same time, because of the disturbance process, the part of particle protrusion may be peeled off, reducing the interlocking between particles, and the strength of this part of loss is difficult to recover. In general, the strength of the reconstituted soil is difficult to recover to the strength of the undisturbed soil in a short time. According to the research on the thixotropy mechanism of clay of Zhang et al. (2014) and Zhang X. W. et al. (2017), the microstructure of clay undergoes a process of destruction and reorganization in the thixotropy process, during which the force field between the particles causes the particles to condense and form aggregates. Landrou et al. (2018) studied the influence of inorganic dispersants on the thixotropic behavior of tight clay and pointed out that the rearrangement of clay particles and the interaction between the charge on the surface of the particles were the root of the thixotropic clay behavior. The stable lap modes of particles were only vertical and parallel, and the probability of reaching stability in the intermediate state was very small. The change of electrolyte concentration can alter the stable lapping pattern of clay particles from vertical to parallel to form a more stable structure (Chen et al., 2020). Peng et al. (2021) believed that the evolution of clay structure may be caused by various microscale particle rearrangements, including clay particle reorientation, aggregation, and flocculation, which are controlled by interparticle forces. To understand the nature of the clay thixotropic behavior, these studies laid a solid foundation. However, the thixotropic mechanism of clay is very complex, and the micro-macro evolution law of soil structure and strength characteristics during the disturbance and static process has not been fully elaborated. There are still some contradictions between many phenomena and theoretical description, and there is a lack of close relation between the micro theory and macro phenomenon, which needs to be further explored and verified.
The clay thixotropy has a great influence on engineering practice (Kul’chitskii, 1975; Lutenegger, 2017). Engineering problems such as the strength growth of filling soil (Tsugawa et al., 2017), the bearing capacity of pile foundation in clay layer (Shen et al., 2005; Abu-Farsakh et al., 2015; Karlsson et al., 2019; Gong et al., 2020), and the time effect of anchoring force of anchor bolt (Zhang N et al., 2017) are closely related to the thixotropy of soil. These phenomena can be explained by the influence of thixotropy on clay strength, but the mechanism of thixotropy of clay has not been fully revealed. It can be seen from the existing research results that the thixotropy of clay stems from the evolution of its microstructure, and the thixotropy mechanism of clay can be revealed by studying the change rules of the internal structure and pores in the process of thixotropy. In this study, the clay in the Zhanjiang Formation in China was taken as the research object, and the strength, microstructure, and porosity of samples vary with time were studied. The tests included unconfined compressive strength (UCS) test, scanning electron microscopy (SEM), and mercury injection porosimetry (MIP). According to the test results, the laws of mechanical properties change, microstructure evolution, and pore evolution of the samples during thixotropy were obtained, and the thixotropic pattern of the clay in the Zhanjiang Formation was established to explain its thixotropy mechanism.
2 Unconfined compressive strength test
Undisturbed soil was obtained from the Baosteel Zhanjiang iron and steel base in the Donghai Island, Zhanjiang City, Guangdong Province, China. This region is located in the southern tip of the Chinese mainland and the southwest of Guangdong Province, and in the low latitude area south of the Tropic of Cancer. It has a subtropical monsoon climate, with an annual average temperature of 23.5°C and an annual average rainfall of 1,556 mm. The geological age of the sampled soil layer is early Pleistocene. The exposed section of the soil layer is presented in Figure 1.
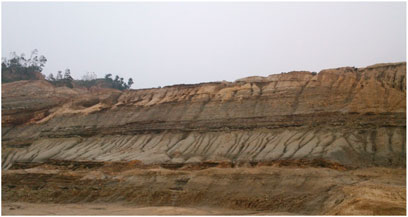
FIGURE 1. Exposure profile of soil layer.
The soil sample is gray clay with clear bedding, as shown in Figure 2.
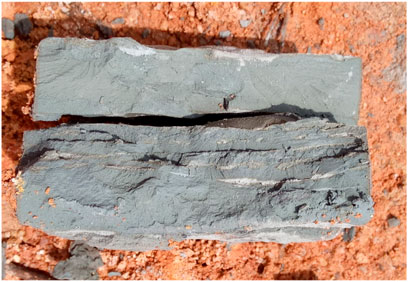
FIGURE 2. Soil sample.
The natural moisture content of the soil sample is 40.7%, the natural density is 1.81 g/cm3, and the specific gravity of soil particles is 2.71.
The undisturbed soil samples used in the test are cylindrical with a diameter of 39.1 mm and a height of 80 mm. During the preparation of undisturbed samples, wire saws were used to cut the soil samples into cuboids slightly larger than the specified size, and then soil sharpeners were used to carefully cut the cuboids into cylindrical shapes with a diameter of 39.1 mm. The unearthed samples were taken, and both ends of the soil samples were cut flat to a length of 80 mm to obtain undisturbed soil samples. During the preparation of reconstituted samples, the soil samples were naturally air-dried and then ground up, and then passed through a sieve of 2 mm. The soil samples with particle size <2 mm were put into fresh-keeping bags for sealing and reserve. At the same time, the air-dried moisture content of the soil samples was tested. The quality of distilled water needed to be added was calculated considering the natural moisture content and air-dried moisture content of soil samples. The distilled water needed for weighing was added into a sprayer, the soil sample was sprayed with the sprayer, and the soil sample was stirred at the same time to make the distilled water spray even. The soil sample with the prepared moisture content was put into a fresh-keeping bag and sealed for 24 h. Next, it was determined whether the moisture content of the soil sample was the target moisture content, and the error was controlled within ±1%. The prepared soil sample was placed into a fresh bag and sealed, and then put in a moisturizing tank for later use. The quality of a soil sample was calculated according to the natural density of the soil and the size of the sample. During sample preparation, 1/4 of the sample mass required was weighed, loaded into the sampler with a jack pressure to 1/4 of the sample height, unloading pressure, scraping in the stratified position. Next, 1/4 of the sample mass required was continued to be weighed and then loaded into the sampler. The above operations were repeated to prepare a cylindrical reconstituted sample with a diameter of 39.1 mm and a height of 80 mm. The sample was wrapped with cling film and put into the prepared PVC pipe. The lid was then closed, wrapped with adhesive tape, and sealed. Studies show that soil strength recovery is fast in the early stage, slow down in the middle stage, and tends to be stable in the late stage (Feng et al., 2004; Zhang X. W et al., 2017), so the curing time is 1, 5, 20, 60, 90, 150, and 300 d. UCS test was carried out on each curing sample, and the relation curve between axial stress and axial strain was obtained. The test method was in accordance with the relevant provisions of Article 20 of “Standard for Geotechnical Test Methods” in China (GB/T50123-2019). The relation curve between axial stress and axial strain of sample was obtained, as shown in Figure 3.
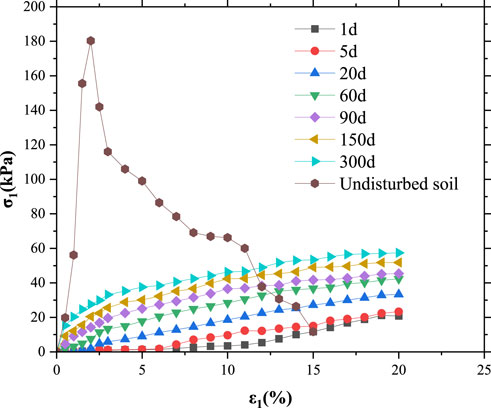
FIGURE 3. Relation curve between axial stress and axial strain.
As can be seen from Figure 3, after the stress of the undisturbed soil sample reaches the peak, the stress greatly decreases with the increase of strain, there is an obvious strain softening phenomenon, and the soil structure is strong. For the undisturbed soil sample, because of the uneven internal structural strength, when the stress reaches the peak (180.29 kPa), the part of the small structural strength will break first, and the stress will begin to decrease. With the increase of strain, the damage of this structure will continue to accumulate and finally form a complete failure surface. When the strain reaches 10%, the stress continues to decrease because of the sliding of the failure surface. The
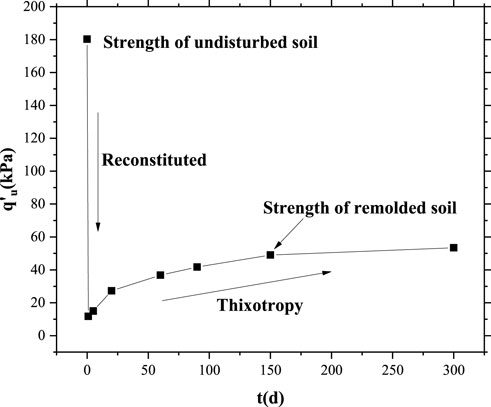
FIGURE 4. Relation curve between unconfined compressive strength and curing time.
As can be seen from Figure 4, the mechanical properties of soil samples changed greatly before and after reconstituting, and the UCS of soil samples decreased significantly after reconstituting, from 180.29 to 11.73 kPa. Structural clay forms a stable structure in the deposition process, such as cementation between particles, which is destructed after disturbance. Therefore, the strength of reconstituted soil is lower than that of the undisturbed soil. Gong et al. (2000) also obtained the same view in his study. After curing, the soil forms a new structure, and its strength gradually recovers. The strength of soil increases rapidly in the period of 0–90 d, and tends to be stable after 90 d. After 300 d of curing, the UCS of clay increased from 11.73 to 53.43 kPa by 3.55 times. Zhang et al. (2014) and Zhang X. W. et al. (2017) conducted UCS tests on clay samples with different curing times and used the thixotropic strength ratio to measure the thixotropy of clay. However, the thixotropic strength ratio of clay varies with curing time and is not unique, so it is difficult to evaluate the thixotropic of different soil samples with different curing times. According to the data in Figure 4, the thixotropic strength ratio
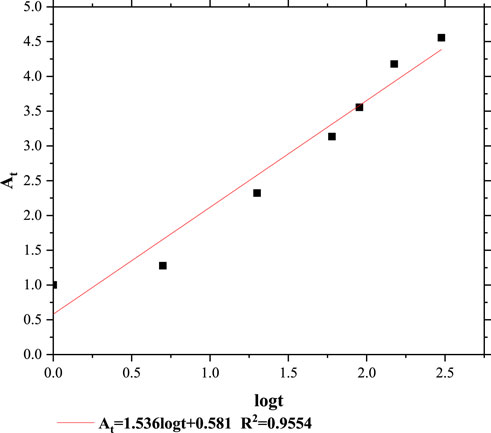
FIGURE 5. Correlation between the thixotropic strength ratio and curing time.
It can be seen from Figure 5 that the thixotropic strength ratio of soil increases with the increase of curing time, and there is a linear relation between the thixotropic strength ratio and the logarithm of curing time:
where
3 Scanning electron microscopy test
To explore the evolution law of microstructure of clay in the thixotropic process, SEM was carried out on the undisturbed soil samples and reconstituted soil samples cured for 1, 5, 20, 60, 90, 150, and 300 d. The size of the undisturbed soil sample was 10 mm × 10 mm × 10 mm. Refer to the method in Section 2 for preparation and curing of reconstituted soil. Since the reconstituted soil sample is soft, too small volume would produce large deformation during sample cutting, so the size of reconstituted soil sample was 20 mm × 20 mm × 20 mm. During the test, the sample with the corresponding specifications was cut with a thin blade and put into liquid nitrogen (boiling point −196°C) to freeze for 15–25 min, and then the frozen soil sample was placed into the freeze-drying machine. The frozen soil sample was vacuumed at −50°C for more than 24 h, so that the soil sample was dry and not easy to deform. An appropriate amount of conductive adhesive was taken to glue the sample to the sample column, and the sample was put into the vacuum sputtering coating machine for surface plating of the Au-Pd alloy film to obtain high-resolution image. After the coating was completed, the scanning electron microscope test was conducted to obtain the sample SEM images, as shown in Figures 6 and 7.
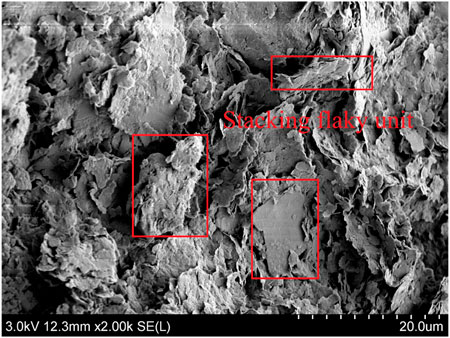
FIGURE 6. Scanning electron microscopy (SEM) photographs of undisturbed soil.
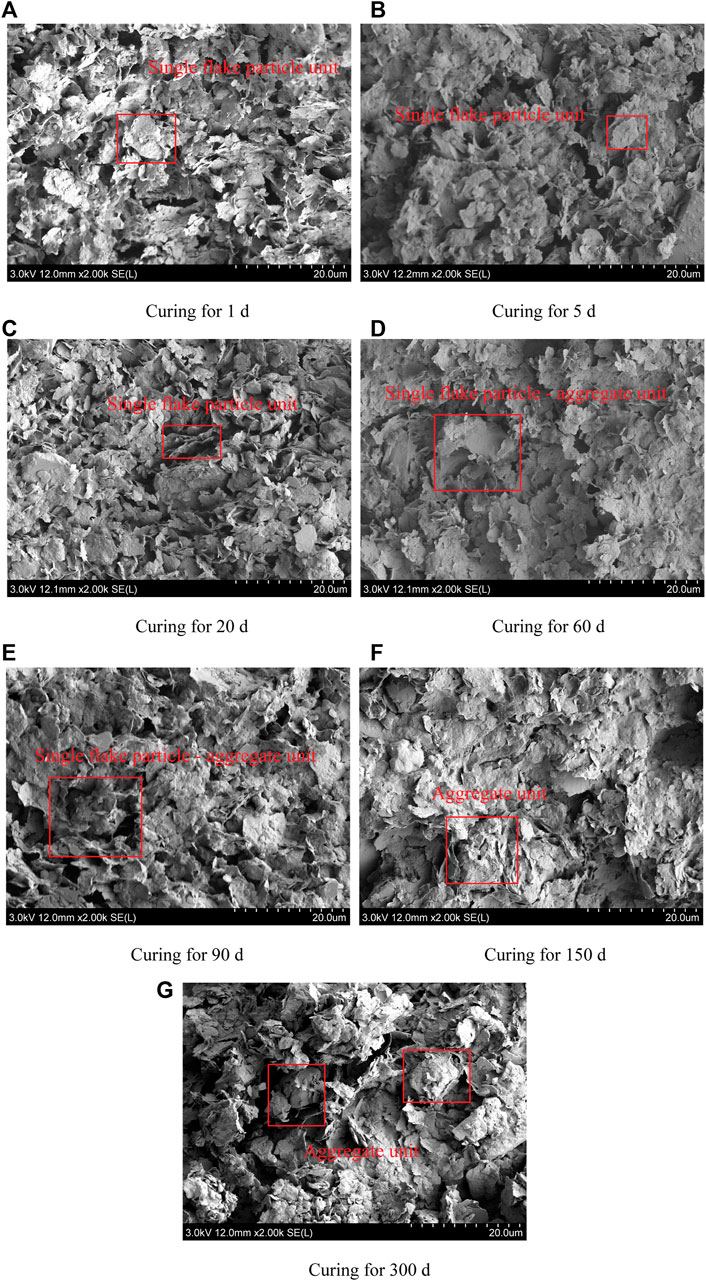
FIGURE 7. SEM photographs of reconstituted soil samples with different curing time.
As can be seen from Figure 6, the undisturbed soil in the Zhanjiang Formation is a stacking flaky flocculation structure, and the structural units of soil are mainly stacking flaky units. Stacking flaky units are formed by the cementation of single-flake soil particles by stacking face to face, and the polyporous and non-directional flocculation structure is formed by edge-to-edge lap, corner-to-surface lap, and surface-to-surface lap among stacking flaky units, which makes soil more sensitive to disturbance and has a strong structure. As can be seen from Figure 7A, after reconstituting, the stacking flaky flocculation structure of the soil sample was destructed and turned into a loose flaky flocculation structure. The structural units of soil are dominated by single-flake soil particle units. The single-flake soil particles contact each other by the way of surface–surface, edge–surface, and point–surface. The pores between the soil particles increase, the dispersion degree increases, the degree of cementation between the particles is low, and the stability is poor. It can be seen from Figures 7A–C that in the first 20 d of curing time, the structural units of soil were dominated by single-flake soil particle units. The ability of single-flake soil particle units to resist external loads is weaker than that of stacking flaky units, and the macroscopic strength of reconstituted soil is significantly lower than that of undisturbed soil. As can be seen from Figures 7D,E, when curing time is 60 d and 90 d, some flake particles polymerize and form aggregates, and the structural units are in the mixing state of single-flake soil particles and aggregates, forming a single-flake particle–aggregate flocculation structure. When the flaky particles overlap with the surface of the aggregates, the pores between the soil particles are reduced, and the degree of cementation is improved. Compared with single-flake particles, aggregates have stronger resistance to external load, and the mixing state of single-flake particles and aggregates improves the soil strength to some extent. It can be seen from Figures 7F,G that when the curing time is 150 d and 300 d, the structural units are dominated by aggregates, forming an aggregated flocculation structure. The degree of cementation is obviously improved, and the strength of soil is further improved by surface-to-surface lapping of aggregates. Zhang et al. (2014) and Zhang X. W. et al. (2017) conducted SEM tests on clay samples with different curing times and summarized the change rule of particle lap mode in clay thixotropic process. In this study, the variation law of structural units in the thixotropic process is discussed from another angle, and the thixotropic pattern of clay is established. Based on the above analysis results, in the whole process, the unit of soil structure has experienced the change processes of stacking the flaky unit, single-flake particle unit, single-flake particle–aggregate unit, and aggregate unit. At a macroscopic level, the strength of undisturbed soil is higher than that of reconstituted soil, and the strength of reconstituted soil decreases obviously. After curing the reconstituted samples, the strength of the soil gradually increases. The structural characteristics and change process of the sample at different times are presented in Figure 8.
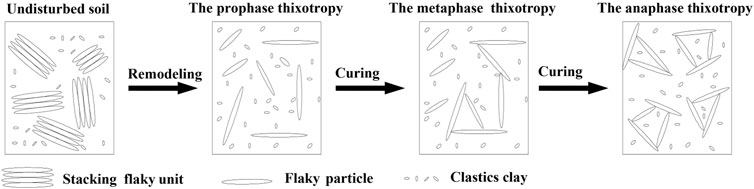
FIGURE 8. Thixotropic pattern of structural clay.
4 Mercury injection porosimetry test
To explore the evolution law of internal pores of clay in the thixotropic process, MIP test were carried out on the undisturbed soil sample and the reconstituted soil samples curing for 1, 5, 20, 60, 90, 150 and 300 d. Refer to the method in Section 2 for preparation and curing of reconstituted soil. For sample specification and freeze-drying method, refer to method 3. The test instrument adopts automatic mercury injection meter. During the test, the sample is loaded into the sample tube (dilatometer) for low pressure analysis and then transferred to the high-pressure station for high-pressure analysis to obtain the pore distribution curve of the sample. To observe the variation rule of sample pores during thixotropy more clearly, curing ages were divided into three groups: prophase thixotropy (the first 20 d), metaphase thixotropy (20–90 d) and anaphase thixotropy (90–300 d), as shown in Figure 9.
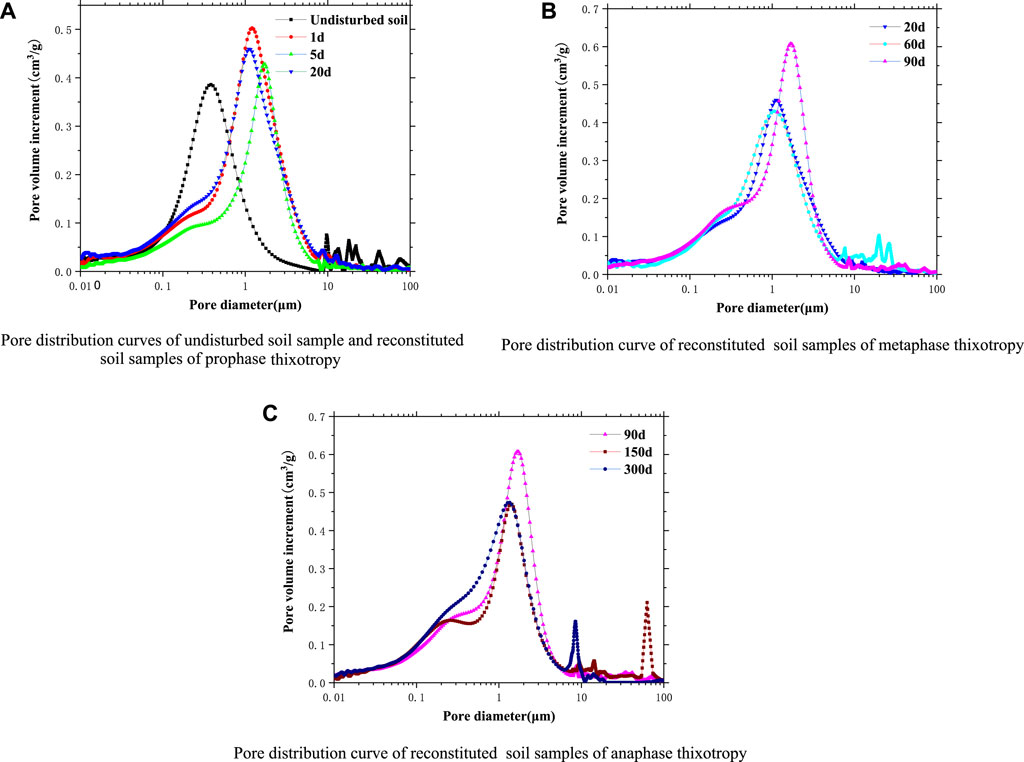
FIGURE 9. Pore distribution curves of samples during thixotropy.
It can be seen from Figure 9A that the pore distribution curve of the undisturbed soil sample is characterized by one main peak and multiple sub-peaks. The pore diameter distribution range of the main peak of the curve of the undisturbed soil sample is 0.1–1.1μm, and the distribution range of the sub-peaks is 10.0–100.0 μm. The pore distribution curve of reconstituted soil samples in the prophase thixotropy is characterized by one main peak, and the sub-peaks are not obvious. The pore diameter of the main peak of the curve of reconstituted soil sample ranges from 0.1 to 5.0 μm. The pores with pore diameter <1.0 μm are defined as small pores, those with pore diameter >1.0 μm and <10.0 μm are defined as medium pores, and those with pore diameter >10.0 μm are defined as large pores. It should be noted that the small, medium, and large pores defined here are relative to each other to facilitate the clarification of the evolution law of pores. The pore diameter distribution range of the main peak of the sample curve before and after reconstituting changed from 0.1-1.1μm to 0.1–5.0μm, indicating that the pore distribution curve of the sample shifted to the right after reconstituting, and part of the original small pores developed into medium pores. Before reconstituting, the pore distribution curve of the sample has an obvious sub-peak, and after reconstituting, the sub-peak is weakened, indicating that the large pores in the undisturbed soil sample are homogenized into medium pores by reconstituting. As can be seen from Figure 9B, the pore diameter distribution range of the main peak of the reconstituted soil sample curve at the metaphase thixotropy ranges from 0.1 to 4.0μm, and the curve of the reconstituted soil sample shows an obvious sub-peak, indicating that with the increase of curing time, part of the medium pores re-develop into small and large pores. As shown in Figure 9C, the pore diameter of the main peak of the reconstituted soil sample in the anaphase thixotropy is in the range of 0.05–0.11 μm compared with that in the metaphase thixotropy, and the obvious sub-peak appears on the right side of the curve, indicating that the small pores and large pores are developed further in the anaphase thixotropy. Zhang et al. (2014) and Zhang X. W. et al. (2017) conducted mercury injection tests on clay samples with different curing times and simply summarized the variation rule of pore distribution in the clay thixotropic process. In this study, the variation law of the main peak and sub-peaks of the pore distribution curve, the movement of the pore distribution curve, and the variation of the proportion of different pores during the thixotropic process of clay are discussed further. To more directly represent the change rule of pores in the thixotropy process, the pore distribution change process in Figure 9 is represented by a schematic diagram, as shown in Figure 10. The area in the diagram represents the proportion of pores at all levels.
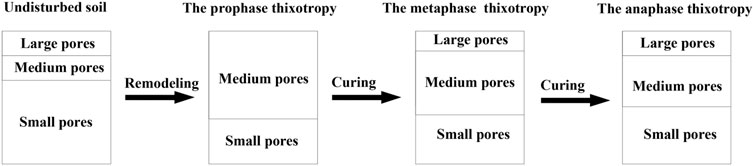
FIGURE 10. Schematic diagram of pore distribution changes.
5 Conclusion
In this study, the UCS and pore structure evolution law of clay during the thixotropic process of 300 d were examined, and the following conclusions were obtained:
1) The Zhanjiang Formation structural clay is very sensitive to disturbance. After the complete destruction of natural structure, the UCS of clay decreases from 180.29 to 11.73 kPa. After 300 d of curing, the UCS of the clay increased from 11.73 kPa to 53.43 kPa because of thixotropy, which increased by 3.55 times.
2) There is a linear relation between the thixotropic strength ratio and the logarithmic value of curing time during the thixotropic process of Zhanjiang Formation structural clays, and the slope can be used to reflect the thixotropy strength. The higher the slope, the stronger the thixotropy, and vice versa.
3) The natural structural units of the Zhanjiang Formation structural clay are stacking flaky units. After reconstituting, the structural units become single-flake particle units. With the extension of curing time, the structural units gradually evolve into single-flake particle– aggregate units, and the aggregate units are formed following 300 d of thixotropy.
4) The large pores of undisturbed soil are homogenized, and the small pores develop into medium pores by reconstituting. In the prophase thixotropy, the pores are mainly medium and small. In the metaphase thixotropy, the macropores begin to develop. In the anaphase thixotropy, some medium pores develop into small and large pores.
5) The fundamental reason for the change of macroscopic strength of clay in the thixotropic process are the changes in the cementation degree between clay particles and pore distribution. When the natural clay structure is destructed, with the extension of standing time, the reconstituted soil will gradually form a new stable structure, but the recovery of structure is limited, and in a short time, the strength of the reconstituted soil is difficult to regain the strength of the undisturbed soil.
6) Our study provides data support for revealing the thixotropic mechanism of clay, but the time scale of the study is limited, and further research is required to fully explain the thixotropic behavior of clay.
Data availability statement
The original contributions presented in the study are included in the article/supplementary material. Further inquiries can be directed to the corresponding author.
Author contributions
BT, LX and YG contributed to conception and design of the study. WW organized the database. LX performed the statistical analysis. BZ wrote the first draft of the manuscript. All authors contributed to manuscript revision, read, and approved the submitted version.
Funding
This work was supported by the Guangxi Natural Science Foundation (2020GXNSFAA297199), the National Natural Science Foundation of China (41867035), and the project of Guangxi Key Laboratory of Geotechnical Mechanics and Engineering (2016-A-01). The authors gratefully acknowledge the financial support.
Conflict of interest
LX was employed by Wuhan Surveying-Geotechnical Research Institute Co., Ltd. of MCC. The remaining authors declare that the research was conducted in the absence of any commercial or financial relationships that could be construed as a potential conflict of interest.
Publisher’s note
All claims expressed in this article are solely those of the authors and do not necessarily represent those of their affiliated organizations, or those of the publisher, the editors, and the reviewers. Any product that may be evaluated in this article, or claim that may be made by its manufacturer, is not guaranteed or endorsed by the publisher.
References
Abu-Farsakh, M., Rosti, F., and Souri, A. (2015). Evaluating pile installation and subsequent thixotropic and consolidation effects on setup by numerical simulation for full-scale pile load tests. Can. Geotech. J. 52 (11), 1734–1746. doi:10.1139/cgj-2014-0470
Alam, M., Shahriar, A. R., Islam, M. S., Islam, N., and Abedin, M. (2021). Experimental investigation on the strength and deformation aspects of thixotropic aging in reconstituted clays. Geotech. Geol. Eng. (Dordr). 39 (3), 2471–2486. doi:10.1007/s10706-020-01639-1
Barnes, H. A. (1997). Thixotropy—A review. J. Newt. fluid Mech. 70 (1-2), 1–33. doi:10.1016/S0377-0257(97)00004-9
Boswell, P. G. H. (1948). A preliminary examination of the thixotropy of some sedimentary rocks. Q. J. Geol. Soc. 104 (1-4), 499–526. doi:10.1144/GSL.JGS.1948.104.01-04.23
Chen, B., Shu, Q.-F., and Deng, R.-S. (2020). Microscopic interpretation of time-depending strength of clay considering plate-shaped particle interactions. Chin. J. Geotechnical Eng. 43 (02), 271–280. doi:10.11779/CJGE202102007
Díaz-Rodríguez, J. A., and Santamarina, J. C. (1999). “Thixotropy: the case of Mexico city soils,” in XI panamerican conference on soil mechanics and geotechnical engineering, , Brazil, 441–448. doi:10.13140/2.1.3191.4883
Feng, X-L., Zhou, S-W., Lin, L., Liu, T., and Wu, S-Q. (2004). The thixotropy of silt in huanghe delta. Periodical Ocean Univ. China 34 (6), 1053–1056. doi:10.16441/j.cnki.hdxb.2004.06.02
Gong, W., Li, L., Zhang, S., and Li, J. (2020). Long-term setup of a displacement pile in clay: an analytical framework. Ocean. Eng. 218, 108143. doi:10.1016/j.oceaneng.2020.108143
Gong, X-N., Xiong, C-X., Xiang, K-X., and Hou, Y-F. (2000). The formation of clay structure and its influence on mechanical characteristics of clay. J. Hydraulic Eng. (10), 43–47. doi:10.13243/j.cnki.slxb.2000.10.007
Huo, H-F., Qi, L., Lei, H-Y., and Yu, G. (2016). Analysis and experimental study on thixotropy of Tianjin soft clay. Chin. J. Rock Mech. Eng. 35 (3), 631–637. doi:10.13722/j.cnki.jrme.2015.0435
Kamil, A. S., and Aljorany, A. N. (2019). Thixotropic hardening of fao clay. J. Eng. 25 (5), 68–78. doi:10.31026/j.eng.2019.05.05
Karlsson, M., Yannie, J., and Dijkstra, J. (2019). Modeling aging of displacement piles in natural soft clay. J. Geotech. Geoenviron. Eng. 145 (10), 04019070. doi:10.1061/(ASCE)GT.1943-5606.0002110
Kul'chitskii, G. B. (1975). Thixotropy of soils of the middle Ob region and its consideration when constructing pile foundations. Soil Mech. Found. Eng. 12 (3), 168–170. doi:10.1007/BF01707641
Landrou, G., Brumaud, C., Plötze, M. L., Winnefeld, F., and Habert, G. (2018). A fresh look at dense clay paste: deflocculation and thixotropy mechanisms. Colloids Surfaces A Physicochem. Eng. Aspects 539, 252–260. doi:10.1016/j.colsurfa.2017.12.029
Larson, R. G., and Wei, Y. (2019). A review of thixotropy and its rheological modeling. J. Rheology 63 (3), 477–501. doi:10.1122/1.5055031
Lutenegger, A. J. (2017). “Aged undrained shear strength of remolded clays,” in Offshore Site Investigation Geotechnics 8th International Conference Proceeding, London, September 12–14, 2017 (Society for Underwater Technology), 378–383. doi:10.3723/OSIG17.378
Mewis, J. (1979). Thixotropy-a general review. J. Newt. Fluid Mech. 6 (1), 1–20. doi:10.1016/0377-0257(79)87001-9
Mitchell, J. K. (1961). Fundamental aspects of thixotropy in soils. Trans. Am. Soc. Civ. Eng. 126 (1), 1586–1620. doi:10.1061/TACEAT.0008103
Peng, J., Luo, S., Wang, D., Ren, Y., Fan, L., DeGroot, D. J., et al. (2021). Quantitative evaluation of thixotropy-governed microfabric evolution in soft clays. Appl. Clay Sci. 210, 106157. doi:10.1016/j.clay.2021.106157
Ren, Y., Yang, S., Andersen, K. H., Yang, Q., and Wang, Y. (2021). Thixotropy of soft clay: a review. Eng. Geol. 287, 106097. doi:10.1016/j.enggeo.2021.106097
Rinaldi, V. A., and Clariá, J. J. (2016). Time dependent stress–strain behavior of bentonite slurries; effect of thixotropy. Powder Technol. 291, 311–321. doi:10.1016/j.powtec.2015.12.036
Ruge, J. C., Molina-Gómez, F., and Rojas, J. P. (2019). Thixotropic behaviour study of clayey soils from the lacustrine deposits of Bogotá high plateau. J. Phys. Conf. Ser. 1386, 012050. IOP Publishing. doi:10.1088/1742-6596/1386/1/012050
Shahriar, A. R., Abedin, M. Z., and Jadid, R. (2018). Thixotropic aging and its effect on 1-D compression behavior of soft reconstituted clays. Appl. Clay Sci. 153, 217–227. doi:10.1016/j.clay.2017.12.029
Shahriar, A. R., and Jadid, R. (2018). An experimental investigation on the effect of thixotropic aging on primary and secondary compression of reconstituted dredged clays. Appl. Clay Sci. 162, 524–533. doi:10.1016/j.clay.2018.05.023
Shen, S. L., Jiang, Y. Q., Cai, F. X., and Xu, Y. S. (2005). Mechanisms of property changes of soft clays around deep mixing column. Chin. J. Rock Mech. Eng. 24 (23), 4320–4327. CNKI:SUN:YSLX.0.2005-23-021.
Skemption, A. W., and Northey, R. D. (1952). The sensitivity of clays. Geotechnique 3 (1), 30–53. doi:10.1680/geot.1952.3.1.30
Tang, B., Zhou, B., Xie, L., and Yin, J. (2021b). Evaluation method for thixotropy of clay subjected to unconfined compressive test. Front. Earth Sci. (Lausanne). 9, 683454. doi:10.3389/feart.2021.683454
Tang, B., Zhou, B., Xie, L., Yin, J., Zhao, S., Wang, Z., et al. (2021a). Strength recovery model of clay during thixotropy. Adv. Civ. Eng. 2021, 1–11. doi:10.1155/2021/8825107
Tsugawa, J. K., Pereira, K. F., and Boscov, M. E. (2017). Thixotropy of sludge from the Cubatão water treatment plant, Brazil. Geotech. Front. 2017, 842–851. doi:10.1061/9780784480472.090
Yang, S., and Andersen, K. H. (2016). Thixotropy of marine clays. Geotech. Test. J. 39 (2), 20150020. doi:10.1520/GTJ20150020
Yang, S., Ren, Y., and Andersen, K. H. (2021). Effects of thixotropy and reconsolidation on the undrained shear characteristics of remoulded marine clays. Ocean. Eng. 239, 109888. doi:10.1016/j.oceaneng.2021.109888
Zhang, N., Wu, H. N., Shen, J. S. L., Hino, T., and Yin, Z. Y. (2017). Evaluation of the uplift behavior of plate anchor in structured marine clay. Mar. Georesources Geotechnol. 35 (6), 758–768. doi:10.1080/1064119X.2016.1240273
Zhang, X.-w., Ling-wei, K., Li, J., and Ai-wu, Y. (2014). Microscopic mechanism of strength increase of clay during thixotropic process. Chin. J. Geotechnical Eng. 36 (08), 1407–1413. doi:10.11779/CJGE201408005
Zhang, X. W., Kong, L. W., Yang, A. W., and Sayem, H. M. (2017). Thixotropic mechanism of clay: a microstructural investigation. Soils Found. 57 (1), 23–35. doi:10.1016/j.sandf.2017.01.002
Keywords: thixotropy of clay, strength timeliness, unconfined compressive strength test, scanning electron microscopy test, mercury injection porosimetry test
Citation: Tang B, Xie L, Wang W, Zhou B and Gong Y (2022) Unconfined compressive strength and pore structure evolution law of structural clay after disturbance. Front. Earth Sci. 10:932621. doi: 10.3389/feart.2022.932621
Received: 30 April 2022; Accepted: 14 July 2022;
Published: 12 August 2022.
Edited by:
Xiaolei Liu, Ocean University of China, ChinaReviewed by:
Xianwei Zhang, Institute of Rock and Soil Mechanics, (CAS), ChinaZhang Bin, China University of Geosciences, China
Copyright © 2022 Tang, Xie, Wang, Zhou and Gong. This is an open-access article distributed under the terms of the Creative Commons Attribution License (CC BY). The use, distribution or reproduction in other forums is permitted, provided the original author(s) and the copyright owner(s) are credited and that the original publication in this journal is cited, in accordance with accepted academic practice. No use, distribution or reproduction is permitted which does not comply with these terms.
*Correspondence: Bin Tang, tangbin@glut.edu.cn; Yanxia Gong, 65185162@qq.com