Assessment of landslide susceptibility, exposure, vulnerability, and risk in shahpur valley, eastern hindu kush
 Ghani Rahman1
  Alam Sher Bacha2
  Muhammad Farhan Ul Moazzam3
  Atta Ur Rahman4 Shakeel Mahmood5
  Hussein Almohamad6,7* Ahmed Abdullah Al Dughairi6 Motrih Al-Mutiry8
  Mona Alrasheedi6,9
  Hazem Ghassan Abdo10,11,12
- 1Department of Geography, University of Gujrat, Gujarat, Pakistan
- 2National Center of Excellence in Geology, University of Peshawar, Peshawar, Pakistan
- 3Department of Civil Engineering, College of Ocean Science, Jeju National University, Jeju, South Korea
- 4Department of Geography, University of Peshawar, Peshawar, Pakistan
- 5Government College University, Lahore, Pakistan
- 6Department of Geography, College of Arabic Language and Social Studies, Qassim University, Buraydah, Saudi Arabia
- 7Department of Geography, Justus Liebig University of Giessen, Giessen, Germany
- 8Department of Geography, College of Arts, Princess Nourah bint Abdulrahman University, Riyadh, Saudi Arabia
- 9Geography Program, Department of Social Sciences, College of Arts, University of Ha’il, Ha’il, Saudi Arabia
- 10Geography Department, Faculty of Arts and Humanities, University of Tartous, Tartous, Syria
- 11Geography Department, Faculty of Arts and Humanities, University of Damascus, Damascus, Syria
- 12Geography Department, Arts and Humanities Faculty, Tishreen University, Lattakia, Syria
This study assessed landslide susceptibility in Shahpur valley, situated in the eastern Hindu Kush. Here, landslides are recurrent phenomena that disrupt the natural environment, and almost every year, they cause huge property damages and human losses. These damages are expected to escalate in the study area due to the high rate of deforestation in the region, population growth, agricultural expansion, and infrastructural development on the slopes. Landslide susceptibility was assessed by applying “weight of evidence” (WoE) and “information value” (IV) models. For this, the past landslide areas were identified and mapped on the SPOT5 satellite image and were verified from frequent field visits to remove the ambiguities from the initial inventory. Seven landslide contributing factors including surface geology, fault lines, slope aspect and gradient, land use, and proximity to roads and streams were identified based on indigenous knowledge and studied scientific literature. The relationship of landslide occurrence with contributing factors was calculated using WoE and IV models. The susceptibility maps were generated based on both the WoE and IV models. The results showed that the very high susceptible zone covered an area of 14.49% and 12.84% according to the WoE and IV models, respectively. Finally, the resultant maps were validated using the success and prediction rate curves, seed cell area index (SCAI), and R-index approaches. The success rate curve validated the results at 80.34% for WoE and 80.13% for the IV model. The calculated prediction rate for both WoE and IV was 83.34 and 85.13%, respectively. The SCAI results showed similar performance of both models in landslide susceptibility mapping. The result shows that the R-index value for the very high LS zone was 29.64% in the WoE model, and it was 31.21% for the IV model. Based on the elements at risk, a landslide vulnerability map was prepared that showed high vulnerability to landslide hazards in the lower parts of the valley. Similarly, the hazard and vulnerability maps were combined, and the risk map of the study area was generated. According to the landslide risk map, 5.5% of the study area was under high risk, while 2% of the area was in a very high-risk zone. It was found from the analysis that for assessing landslide susceptibility, both the models are suitable and applicable in the Hindu Kush region.
Introduction
Globally, the frequency of geo-physical and hydro-meteorological disasters has increased in the last two decades with its devastating consequences (Rahman et al., 2017). Landslides are among the geo-physical hazards that cause huge damage to human lives, property, and infrastructure (Wubalem, 2021; Shano et al., 2020). The Hindu Kush Himalayan (HKH) region is a young mountain system where landslides, snow avalanches, floods, and earthquakes are very common (Rahman et al., 2017). In this region, landslides are recurrent phenomena and are often initiated either by seismic activity, prolonged rainfall, and/or human-induced factors (Regmi et al., 2014; Santangelo et al., 2021; Li, 2022a). The frequent landslide events have been causing damages to property as well as infrastructure and sometimes led to human losses. In the literature, it is reported that the global share of landslides was five percent among all the natural hazards during 1990–2005 and tend to increase in the future because of seismic activities, increasing rainfall intensity due to climate change, and anthropogenic activities on the fragile slope (Kanungo et al., 2009; Cui et al., 2021). In 2018, the cumulative share of flooding and landslides in global catastrophic events was 46% among all natural hazards. Landslide is a natural geomorphic process (Allen et al., 2011; Nandi and Shakoor, 2010) mainly governed by the local area surface geology, seismicity, slope gradient/aspect, drainage density/pattern, land use type, and precipitation (Sudmeier-Rieux et al., 2012). In the mountainous area, prolonged rainfall increases the probability of landslide. Similarly, seismic activities and surface lithology are other important contributing factors that govern and initiate slope instability (Van Westen et al., 2010; Li et al., 2021b). Additionally, human intervention in the form of road construction, expansion of human settlement, deforestation, and agricultural activities on fragile slopes further intensifies the probability of landslide occurrence (Rahman et al., 2017; Zhou J. et al., 2021; Li, 2022b).
Many researchers have conducted studies to explore the landslide impacts including human losses, property damage, and infrastructure damages (Davies, 2022; Spegel and Ek, 2022). Very little work has been carried out yet on the impacts of landslides on the natural environment and ecological system. The environmental effects caused by landslides are changes in agricultural activities, changes in river morphology, and changes to the natural ecosystems (Nakamura et al., 2000). Other effects included sedimentation in river channels and flash floods due to breaching of landslide dams (Tien et al., 2021). Landsliding disturbs the natural habitat of certain endangered species in the susceptible zone and also affects the biodiversity of the affected area; therefore, strict forest preservation measures are highly required to reduce environmental damages (Geertsema and Pojar, 2007).
The geo-spatial probability of the slope failure is termed landslide susceptibility. The occurrence of slope failure depends on the presence of some geo-environmental elements (Guzzetti et al., 2005; Li et al., 2021a). During the last decade, numerous scientific studies, including those by Chen and Wang (2007), Goetz et al. (2015), Rahman et al. (2017), Wang et al. (2019), and Ali et al. (2021), have been conducted on fragile mountains and subsequently used a wide range of empirical approaches for analyzing landslide susceptibility to identify the extent of potentially susceptible zones. Quantitative, semi-quantitative, and qualitative techniques have been extensively applied in many studies to map landslide hazard zones (Van Westen et al., 2008; Abdı et al., 2021). In landslide indices, semi-quantitative, quantitative, and qualitative methods are adopted for the identification of landslide-prone areas that have similar geological and geomorphological characteristics (Kouli et al., 2010). In qualitative methodologies, the rating procedure is totally based on indigenous knowledge, whereas semi-quantitative methods are based on weighted procedures (Abdo, 2022). However, quantitative methods use statistical techniques to find out the relationship between factors initiating landslides and landslide events (Rahman et al., 2019).
A number of methodologies and models are in practice for prediction and susceptibility mapping of landslides globally. The spatial probability of landslides can be predicted by applying various quantitative methodologies such as frequency ratio (FR), weight of evidence (WoE), information value (IV), fuzzy neural network (FNN), analytical hierarchy (AH), index of entropy (IoE), analytical hierarchy process (AHP), logistic regression (LR), and fuzzy logic (FL) (Mohammady et al., 2012; Talaei, 2014; Shahabi and Hashim, 2015; Moazzam et al., 2020). However, WoE and IV models have been frequently used for areas with a similar environmental set-up, and therefore both models are applied in this study (Bacha et al., 2018; Mersha and Meten, 2020; Singh et al., 2021). The HKH is an active seismic region, and hence most of the landslides have been initiated by seismic activities and torrential rainfall during monsoon (Kamp et al., 2010). In the HKH region, developmental work over the fragile slopes frequently encourages landslides. This study is an integrated approach that assesses landslide susceptibility, exposure, vulnerability, and risk in the Shahpur valley, eastern Hindu Kush, and is a basic part of disaster risk management planning. Worldwide extensive work has been carried out recently on landslide susceptibility assessment and mapping (Myronidis et al., 2016; Stanley and Kirschbaum, 2017; Bui et al., 2020; Wang et al., 2020; Chen and Chen, 2021; Ngo et al., 2021; Youssef and Pourghasemi, 2021) and in the Hindu Kush Himalayan region (Ahmed et al., 2014; Rahman et al., 2017; Rahim et al., 2018; Khan et al., 2019; Gautam et al., 2021), but limited research has been carried out on landslide vulnerability and risk (Ram and Gupta, 2022). It is, therefore, necessary to map the landslide vulnerable and risk areas which will help in minimizing the landslide risk and will provide a base for management. In this regard, the present study has investigated landslide-prone areas using GIS-based information value and weight of evidence models. Consequently, the resultant maps were validated through success and prediction rate curves, seed cell area index (SCAI), and R-index approaches. The unavailability of temporal landslide records is the major limitation of this study, and therefore the susceptibility map was then considered a hazard map for vulnerability assessment. The vulnerability to landslide hazards was calculated based on the exposure of elements at risk to landslide hazard/susceptibility. Based on indigenous knowledge, the probability of loss to each element at risk was calculated for vulnerability mapping. Then, based on the function of hazard and vulnerability, the landslide risk map was generated for the study area.
The study area
The study area, Shahpur valley, lies in the Hindu Raj Mountains. These mountains are considered the offshoot of the Hindu Kush ranges (Rahman et al., 2019). Moving from the north to south, the height of these mountains tends to decrease. The latitudinal extent of the valley is 34° 52′ 31″ to 35° 9′ 35″ north, while the longitudinal extent is 72° 40′ 10″ to 72° 48′ 44″ east (Figure 1). Climatically, Shahpur valley is part of the moist temperate zone. The valley receives ample amount of rainfall from monsoon in summer, while in winter, heavy snowfall occurs at higher altitudes (Rahman et al., 2019). The average annual temperature of the valley is 18°C, and it receives 1,200 mm of rainfall annually (GOP, 1998). In winter, the rainfall occurs due to western disturbances which are usually accompanied by snowfall, while in summer, rainfall occurs in the months of July and August from monsoon. Both summer and winter rainfall causes landslides in the study region. The total area of the district is 258.96 km2, out of which 16.82% is cultivated, while the rest (83.18%) is uncultivated including 40.14% under forest cover dominated by softwood coniferous forest. In the study area, agriculture is a major revenue-generating activity carried out in terraced fields which largely depends on rainfall, whereas only 2% of the cultivated area is irrigated (GOP, 1998). The study area consists of rugged topographic terrain where the elevation varies from 879 m to 4,394 m. According to the 2017 population census, the total population of the valley was 115,711 persons, with an average household size of 8.3 persons. The population density in the valley was 446.8 person/sq. km according to the 2017 census.
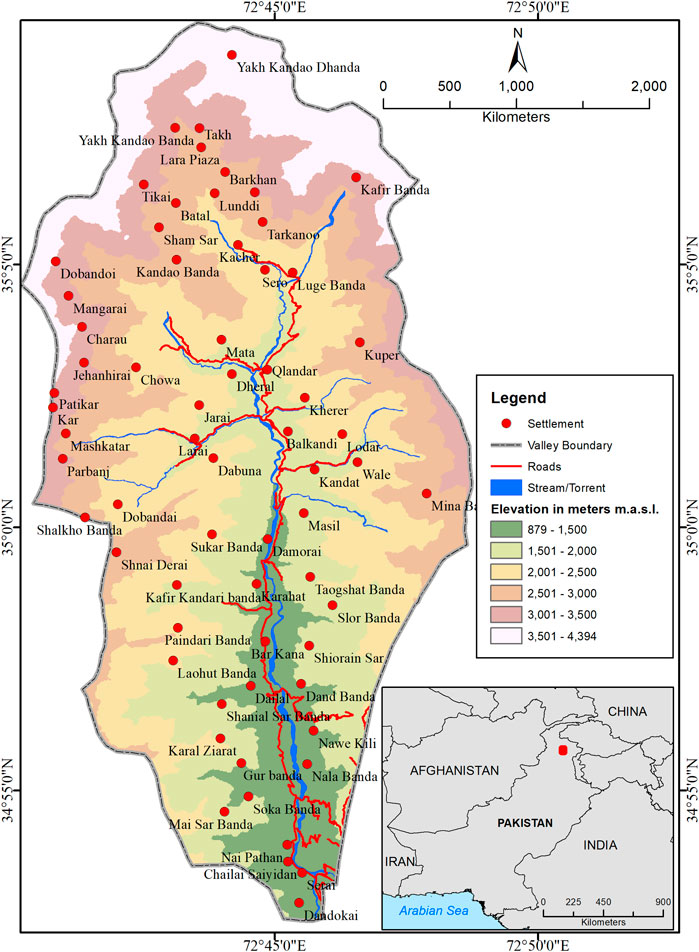
FIGURE 1. Digital elevation map of Shahpur valley.
The study area falls in the active seismic zone of the HKH region. The USGS earthquake catalog reported 499 earthquakes of ≥4.5 magnitude during 1973–2019 in the HKH region of Pakistan (Figure 2). The study area consists of young mountain systems that have immature geology (Jehan and Ahmad, 2006) which are prone to landslides and often result in considerable property damage and human losses. The probabilities of these losses are expected to increase due to increasing population pressure on these prone slopes, anthropogenic activities, deforestation, and increasing rainfall intensity. Population growth has posed more pressure on fragile slopes and has made them more vulnerable to landslides.
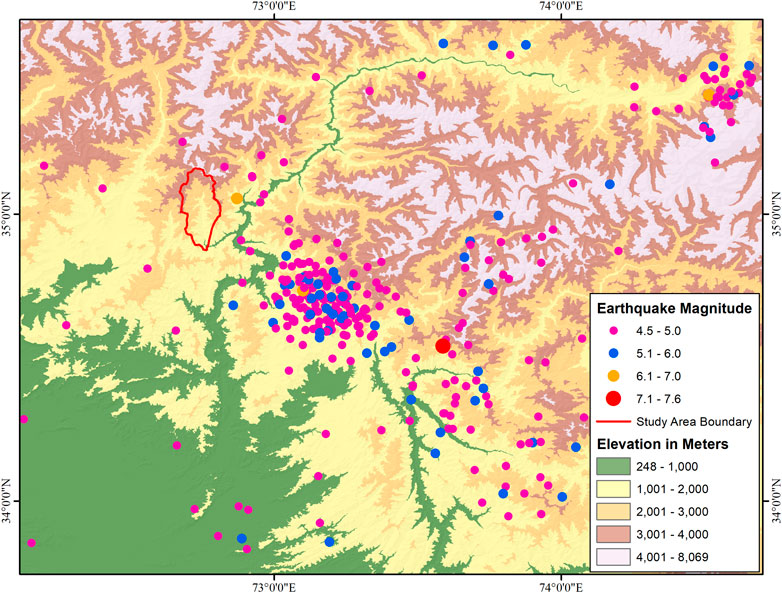
FIGURE 2. Shahpur valley and surroundings: spatial distribution of earthquake events.
Materials and methods
Data
The data were collected through primary and secondary sources to meet the required objectives of the study. As a mandatory part of the study, the sites of previous landslides were identified and mapped on the SPOT5 image with a 2.5 m resolution in April 2013, and to reconfirm the ambiguous sites, consecutive field visits were also conducted to validate the landslide sites on the ground. The landslide contributing factors were selected based on previous literature combined with local community knowledge regarding the factors that contribute to or cause landslides. Thus, seven landslide contributing factors, namely, surface geology, proximity to fault lines, slope gradient and aspect, land use, and proximity to roads and streams were selected. Surface geology and tectonic formation determine the rock permeability and strength that ultimately influence slope stability. Similarly, the slope gradient has a direct relationship with landslides as more landslides occur at higher slopes, while the slope aspect has an indirect relationship with landslide occurrence (Khan et al., 2011). Thick vegetation bounces back the initiation of landslides, while vegetation-free land leads to erosion of soil and slope instability. The construction of roads over fragile slopes and stream lateral erosion also encourage slope instability (Zhou Z. et al., 2021); therefore, all these seven landslide contributing factors were selected for landslide susceptibility assessment.
Spatial data of the aforementioned contributing factors were acquired from various sources. The surface geology and tectonics data were traced and extracted from the Geological map of north Pakistan. The vector geodatabase of settlement and administrative units was obtained from the Survey of Pakistan. The shapefiles of the road network were acquired from the Communication and Works Department, Peshawar (Table 1). Similarly, the land use map was derived from a SPOT satellite image through a supervised classification algorithm in ArcGIS 10.2 (Table 1). The stream network, slope gradient, and slope aspect maps were derived from the ASTER 30 m Global Digital Elevation Model (GDEM).
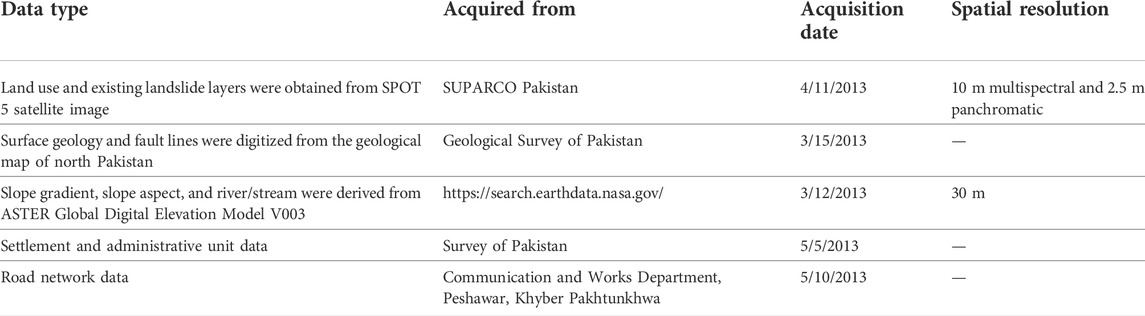
TABLE 1. Dataset used in the study and source of data.
Inventory of landslides
The past landslide sites were mapped on a multispectral satellite image of SPOT (Figure 3A). These sites were verified through a series of field visits. About 300 landslides of varying sizes were marked on the satellite image, and almost 50% of the total landslides were randomly verified through field investigation. Among these landslides, 50% were debris flow and debris slides, while the remaining 40% consisted of mudflow and mudslide (Figure 3B). Only 10% among these landslides were rockfall and rockslide. The debris flow and debris slide mostly occur in the rainy season along the terrace agricultural field, unstable slopes along roads, and streams flowing on steep slopes in the study area. The debris flow and debris slides were also observed in the high snow-melting areas. Rockfall and rockslides were observed along fault lines in steep slope areas. According to the local people, rockfall and rockslides mostly occur during earthquakes in the study region. The mapped landslides were randomly divided into 75 and 25% as training and validation landslides, respectively (Figure 3A). These landslides were then rasterized to find out the pixel number in all classes of each contributing factor map to calculate the weight values for IV and WoE models.
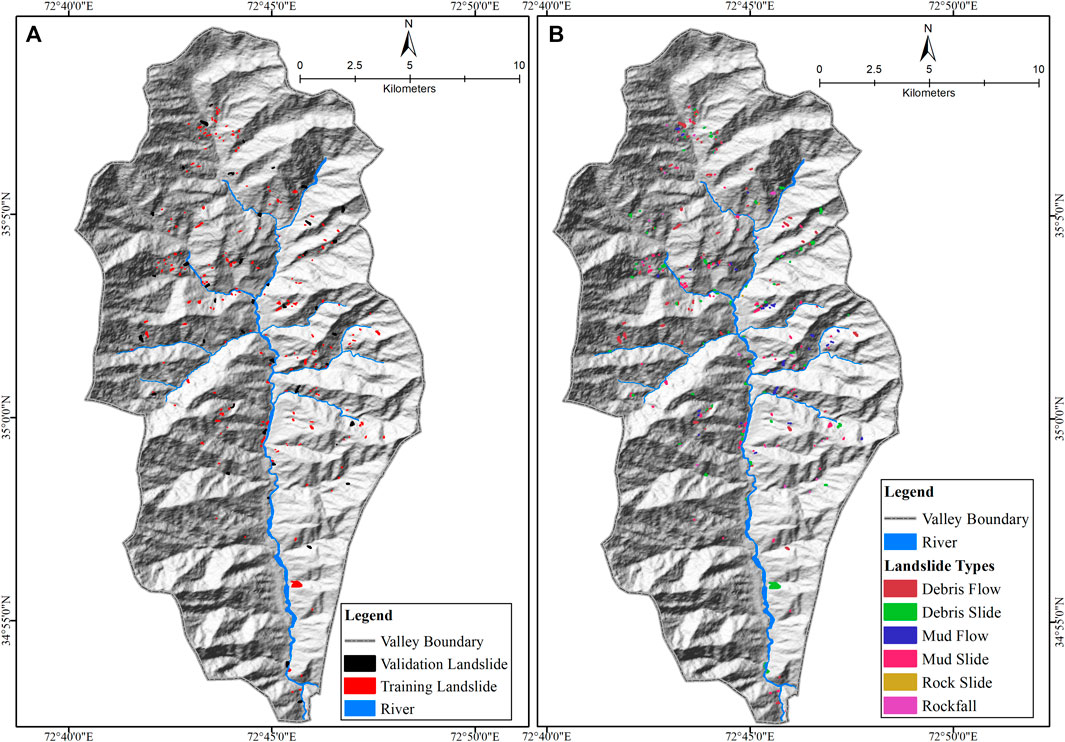
FIGURE 3. Shahpur valley: (A) distribution of past landslides and (B) types of landslides.
Weight of evidence model
Bonham-Carter (1989) applied the weight of evidence model for the first time using Eq. 1 and Eq. 2:
In the abovementioned equations, the probability is denoted by
Information value (IV) model
Measuring the effect of landslide contributing factors on landslide occurrence was also examined using the IV model. The information value model is based on Bayes’ theorem, and information values are derived from each class of contributing factors. The IV model calculates landslide susceptibility based on past landslide events and its correlation with landslide contributing factors. The positive information value of a class shows a stronger correlation with landslide occurrence, while the negative value denotes a negative correlation of that class with landslides. In the IV model, the statistical values are calculated for all classes of each contributing factor using Eq. 6:
where
Landslide susceptibility index (LSI)
The LSI for both IV and WoE models was calculated using the sum of the landslide causal/contributing factors in the GIS based on the
where
Validation techniques
The success rate curve, prediction rate curve, R-index, and seed cell area index (SCAI) were used to validate the LSI maps prepared based on WoE and IV models. The success rate curve validation is based on training landslides which is 75% of the total landslides, while the prediction rate curve is based on validation landslides which is 25% of the total landslides. Both curves elucidate the accuracy of WoE and IV for selected causal factors to landslide occurrences. The validation curves for WoE and IV were calculated using the LSI values overlaid with the existing layer of landslide area using the geo-statistical tool in the GIS. Cumulative percentages for both susceptibility class and landslide area were calculated, and susceptibility class was plotted on the x-axis and landslide area on the y-axis to generate both success and prediction rate curves. The landslide model performance was assessed using specificity, sensitivity, and accuracy. Sensitivity is the proportion of pixels that have been accurately classified as occurrences of landslides, whereas the proportion of pixels of non-landslide pixels that are accurately classified as non-landslides is the specificity (Abedi Gheshlaghi and Feizizadeh, 2021) and accuracy is the proportion of landslides and non-landslide pixels that are accurately classified (Chen et al., 2018).
In the equations, TN is the true-negative, TP is the true-positive, FN is the false-negative, and FP is the false-positive (Abedi Gheshlaghi and Feizizadeh, 2021).
The SCAI technique was applied on both WoE and IV models as first tested by Süzen and Doyuran (2004). SCAI is the ratio of the percentage of the pixels of a landslide susceptibility zone to the percentage of existing landslide pixels in that susceptibility zone. The model is considered excellent if the value of the SCAI decreases from a very low to a very high LS class (Arabameri et al., 2020; Pawluszek-Filipiak et al., 2020). The SCAI is calculated using the following equation:
In addition, the relative landslide density (R-index) was also used to validate the LSI maps. R-index is calculated using the following equation:
where ni is the number of landslides in a LS zone and Ni is the total number of pixels in a LS zone.
Landslide vulnerability assessment
Vulnerability is the essential element of risk assessment which refers to the potential degree of loss to the element at risk (Ram and Gupta, 2022). According to the definition of UNISDR (2009), vulnerability is “the characteristics and circumstances of a community, system, or asset that make it susceptible to the damaging effects of a hazard.” The calculation of social, economic, and environmental vulnerability is still a challenge in landslide studies (Fu et al., 2020); therefore, the physical vulnerability was assessed based on elements at risk exposure level and the probability of loss due to landslide. Based on indigenous knowledge and expert opinions, the agricultural land, settlement, rangeland, forest, schools, roads, and bridges were selected as elements at risk for vulnerability assessment. Based on the element at risk, the exposure maps were prepared using the landslide susceptibility map to measure the level of exposure of these elements at risk. These exposure maps were used to calculate to prepare the vulnerability map of the area using a geo-statistical approach based on Eq. 14.
where P is the probability of loss due to landslides and D is the element at risk. From the knowledge gained during fieldwork, the value of each element at risk was then used for calculation of the probability of loss which is expressed on a scale of 0 to 1, where zero means no loss while 1 is the total loss. The final map was reclassified into five zones ranging from very low- to very high-vulnerability zones.
Landslide risk assessment
The function of hazard (likelihood of landslide occurrence) and damage potential is called risk (Anbalagan and Singh, 1996; Sujatha and Rajamanickam, 2015). Risk is defined as the potential for adverse consequences or the chances of loss (Lee and Jones, 2004). UNISDR (2009) defines risk as “the combination of the probability of an event and its negative consequences.” In this study, risk assessment is calculated based on damage potential to the elements at risk which we have named vulnerability (Ram and Gupta, 2022).
In this study, landslide risk is calculated using the following equation:
where R is the potential risk, H is the hazard probability (landslide susceptibility), and V is the calculated vulnerability (damage potential to the elements at risk). In the study region, the unavailability of temporal records of landslides is the limitation of the study; therefore, we have used the likelihood of landslide occurrence instead of landslide hazard which might possess some degree of uncertainty in risk assessment.
Results
Landslide causative factors and landslide occurrence
Surface geology
The relationship between surface geology and landslide occurrence was assessed using WoE and IV models. The types of surface geology are shown in Figure 4A. The highest positive
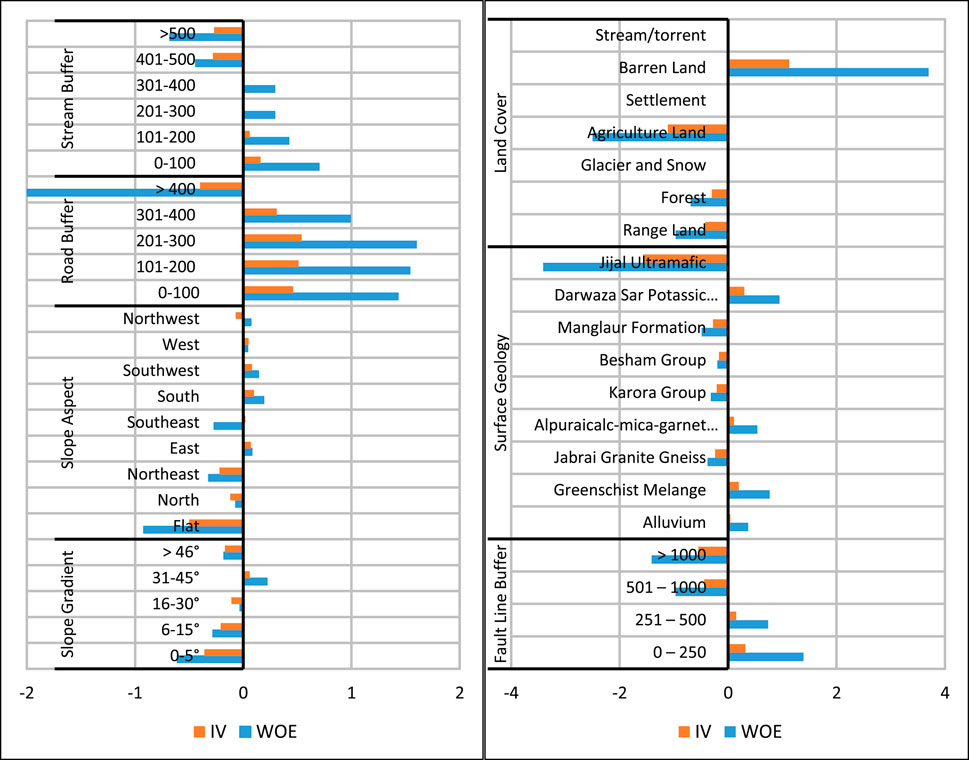
FIGURE 4. Shahpur valley, the calculated weight of each class of causal factors.
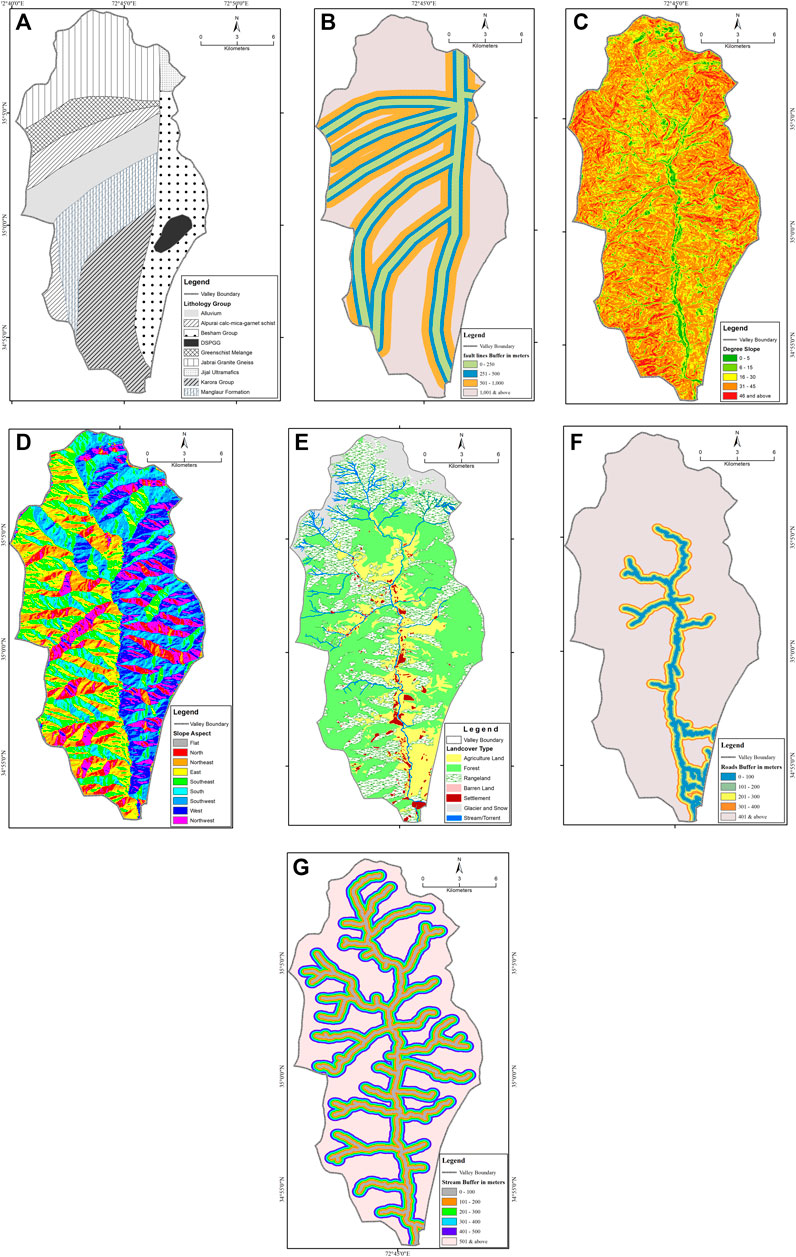
FIGURE 5. Shahpur valley: (A) surface geology; (B) proximity to fault lines; (C) slope gradient; (D) slope aspect; (E) land use/land cover; (F) proximity to road; (G) proximity to stream/torrent (Rahman et al., 2017).
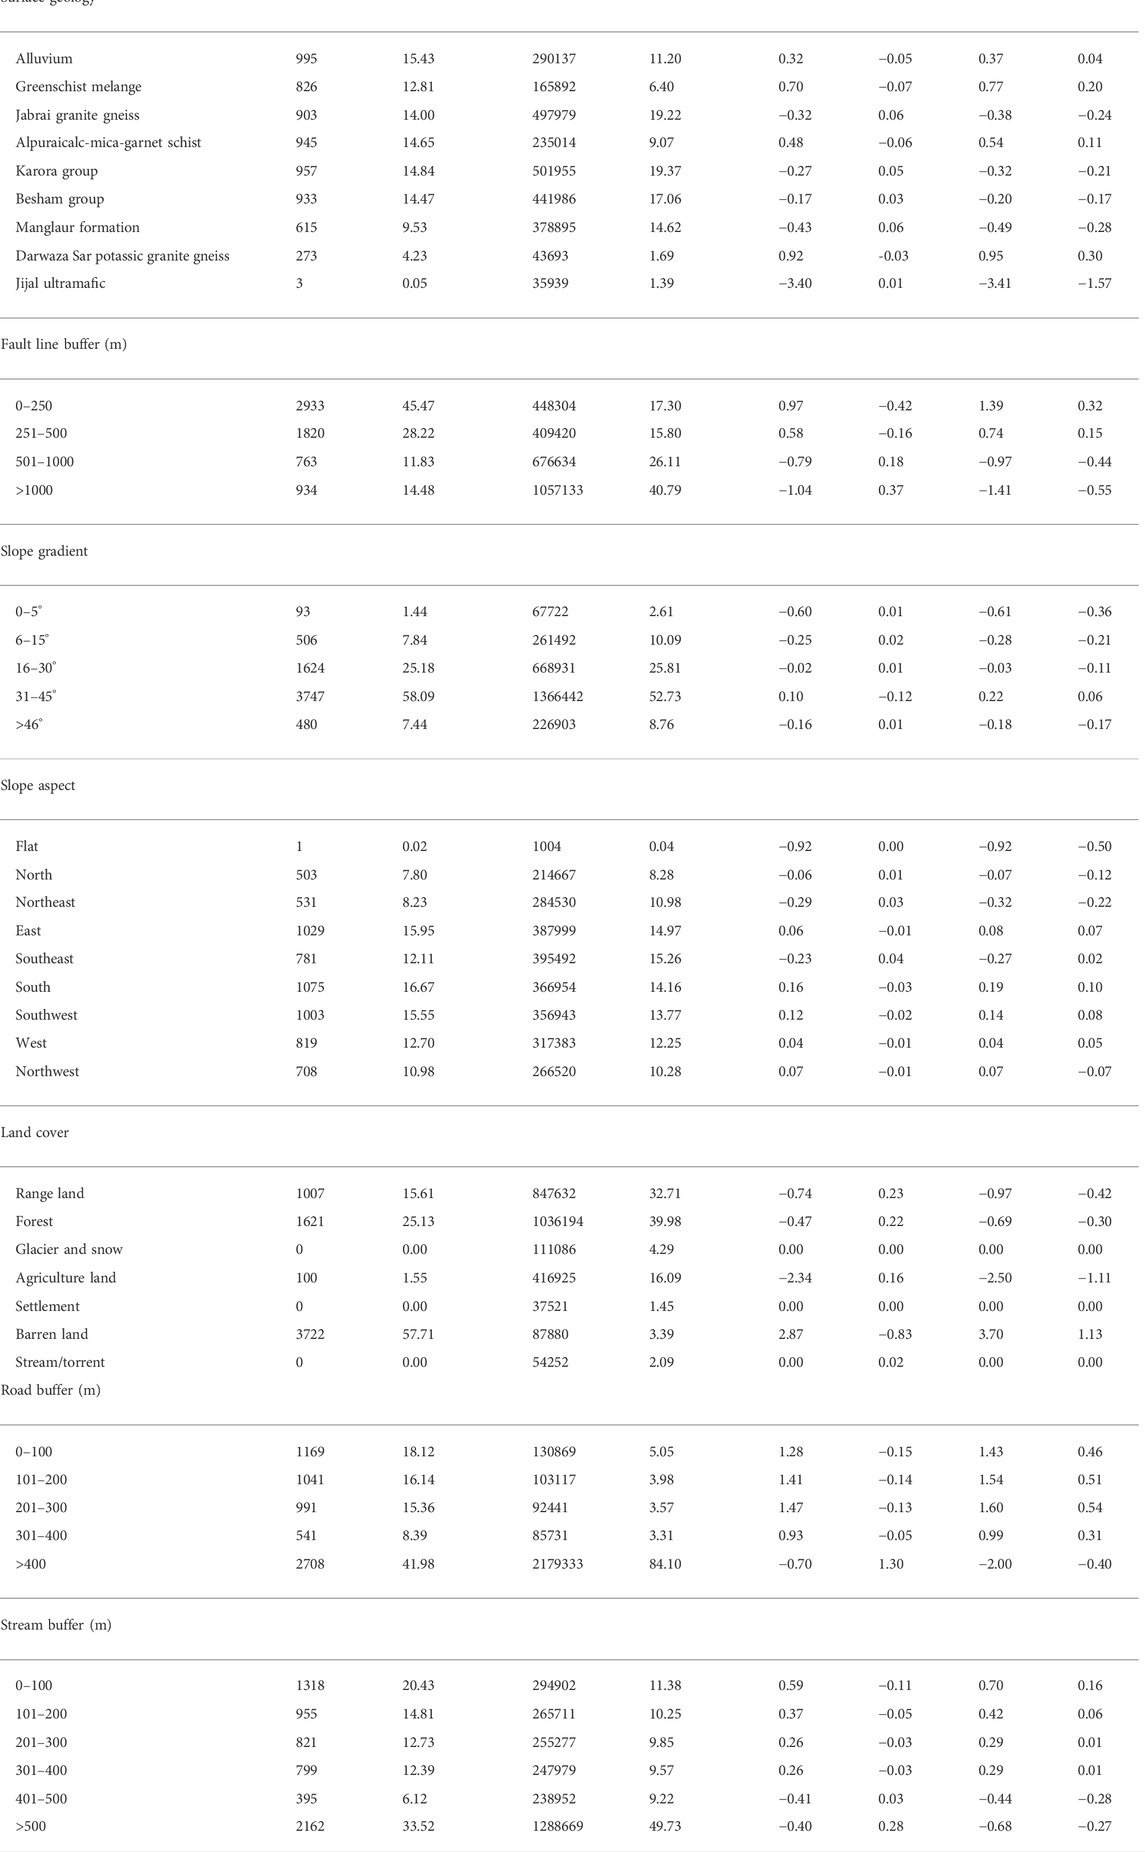
TABLE 2. Shahpur valley: the calculated weight of each class of causal factors.
Proximity to fault line
The occurrence of landslides has a strong correlation with fault lines (Korup, 2004; Rahman et al., 2019). The existence of fault lines at high slope gradients provides favorable settings for the occurrence of slope failure. There is a complex tectonic structure in the study area which is considered a causal factor for slope instability. It is evident from the analysis that the tectonic structures have a major role in landslide occurrence. The highest positive
Slope gradient
The slope gradient affects the population distribution, their activities, and natural resource distribution. Likewise, slope gradient has a close association with landslide distribution, and it acts as a governing factor in slope stability as the chances of landslide incidence escalate with the increase in slope gradient. It was observed during field visits that a high number of landslides occurred on the slope along the road and stream where the lateral cutting was a dominant factor. The map of the slope gradient for the study area was generated in the GIS from ASTER-GDEM having a 30 m spatial resolution (Figure 4C). The analysis of both WoE and IV shows that the slope failure is higher in 31–45° slopes as the highest
Slope aspect
Slope direction governed sunlight intensity and duration, determining the amount of rainfall, moisture-holding capacity of land, and distribution of vegetation. The analysis revealed that the south-facing slope has the highest value of
Land use/land cover
The forest cover protects the mountainous slope from weathering and mass wasting processes as the roots hold the underneath soil and keep the slope stable. Increasing population growth has increased the demand for wood and land for food, which has disturbed the slope of almost all the mountainous regions of the world and has led to slope instability. The land use map of the study area shows seven different land cover types, that is, rangeland, forest, glacier and snow, agricultural land, settlement, barren land, and stream/torrent (Figure 4E). The statistical weight for land use classes was derived using WoE and IV models. The highest weight of both WoE (
Proximity to road
Road constructions often disturb the slopes and expedite the weathering and mass wasting processes, thus increasing the probability of landslide occurrences. It also provides means of accessibility and accelerates the process of deforestation in mountainous regions. In the current study, proximity to the road is used as a contributing factor of landslide hazard. The results show a high positive correlation with proximity to the road, especially the distance from the road up to 300 m. The highest
Proximity to stream/torrent
The relationship of stream/torrent with landslide was also examined through WoE and IV statistical models. It was found from the analysis that both WoE and IV have higher values near the stream, which indicates high landslide probability in this region. The highest
Landslide susceptibility zonation
Landslide is a common menace to property, human lives, and infrastructure in Shahpur valley. For its mitigation, the first important step is to identify susceptible landslide areas. In the LSZ map, all the landslide causative factors were integrated into the GIS, and the region was divided into very low- to very high-susceptible zones based on their susceptibility level. To minimize the subjectivity, quantitative weight to each class of factor maps was applied based on WoE and IV models for the preparation of the LSZ map of Shahpur valley. The LSZ map was created based on both WoE and IV models by integrating all the relative weights of all classes of factor maps.
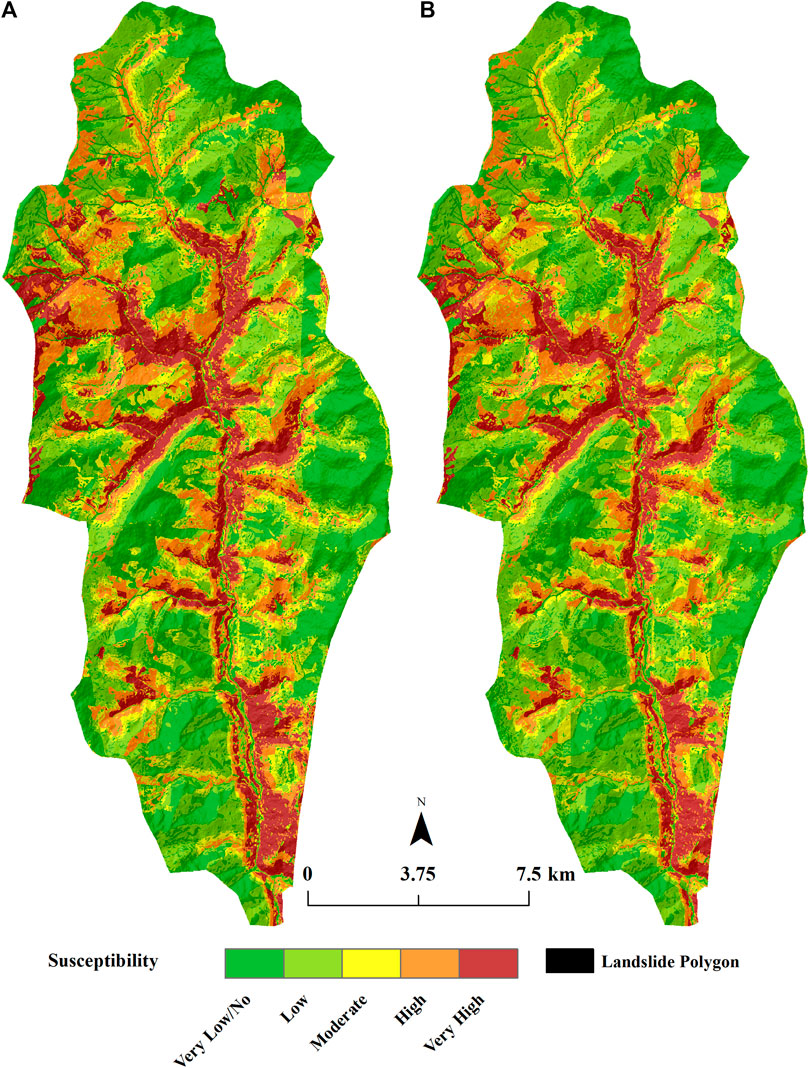
FIGURE 6. Shahpur valley: (A) WoE-based landslide susceptibility zones and (B) IV-based landslide susceptibility zones.
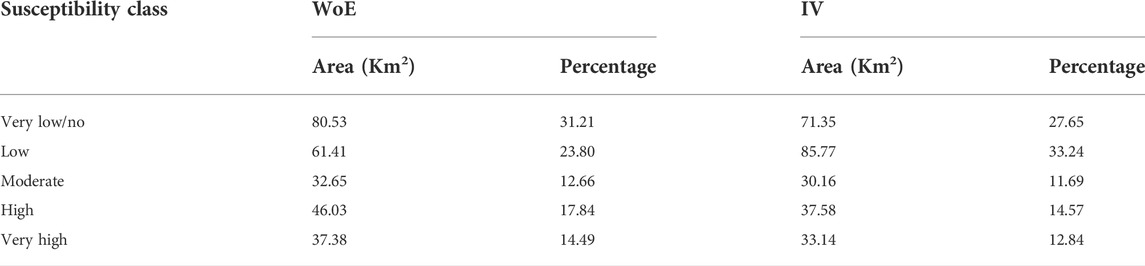
TABLE 3. Areal coverage of landslide susceptibility zones.
Validation of the landslide susceptibility map
The result of both success and prediction rate curves has a steep slope, which indicates significantly good results for both WoE and IV models. The model validation from the success rate curve shows 80.34% accuracy for WoE and 80.13% for the IV model (Figure 7A). The area under the curve (AUC) was calculated using a success rate curve based on the training dataset. An AUC of 79.64% was recorded for WoE and 77.95% for the IV model (Figure 7A). The model’s prediction rate curve was also calculated based on the validation dataset and shown in Figure 6B. The calculated prediction rate for both WoE and IV was 83.34 and 85.13%, respectively.
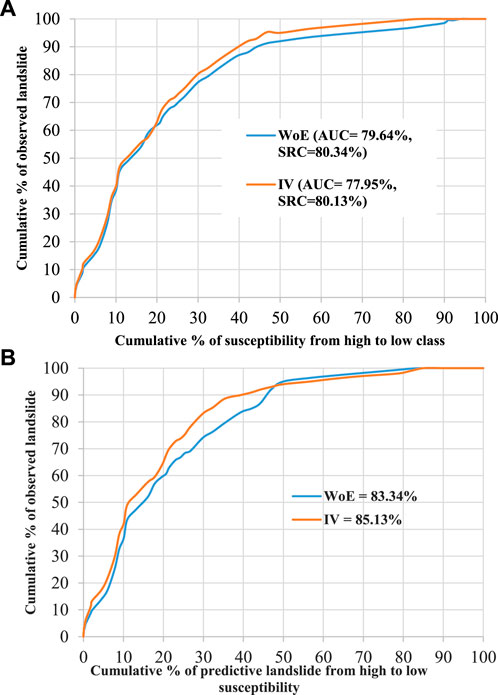
FIGURE 7. Shahpur valley: (A) success rate curve and (B) prediction rate curve, showing the prediction capability of WoE and IV models.
Based on the training dataset, the performance of the models, that is, WoE and IV models has been assessed as shown in Table 4. Both the models showed very good performance in the classification of landslide pixels where the sensitivity for the WoE was 86.36%, while it was 90.77% for the IV model (Table 4). Similarly, the models showed the highest performance in the classification of non-landslide pixels, where the WoE model recorded 80.95% specificity, whereas the specificity of the IV model was 80.47%. The highest accuracy is for the IV model (85.66%), whereas the accuracy for the training dataset of the WoE model is 83.72% (Table 4).
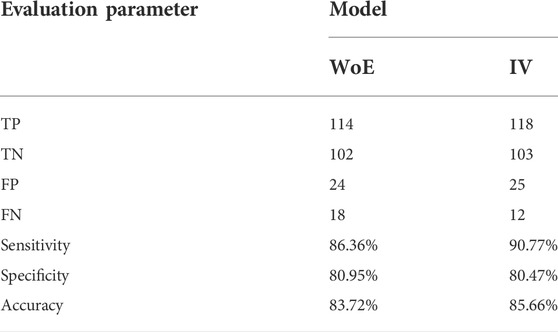
TABLE 4. Model performance using the training dataset.
Likewise, in the training dataset, the performance of the models was assessed using the validation dataset. The WoE and IV models showed excellent performance in the classification of landslide pixels. The sensitivity results for the WoE model are 88.46%, whereas it is 91.84% for the IV model (Table 5). Similarly, both the models showed the highest performance for non-landslide pixels classification, which recorded 84.78% specificity for WoE and 83.67% for the IV model. The accuracy of the WoE model is 86.73%, while the IV model's accuracy is 87.76% (Table 5).
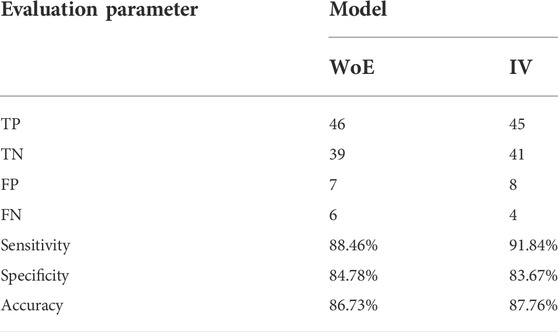
TABLE 5. Model performance using a validation dataset.
The results of the SCAI validation index are shown in Table 6. It is evident from the previous literature that the SCAI value should be lower in the higher LS zone and higher in the lower LS zone, whereas the greater difference in SCAI values of both LS zones (lower and higher LS zone) indicates a good fit of the model (Arabameri et al., 2020; Saha and Saha, 2020). In the current study, the SCAI results for very high and low landslide susceptibility classes in both WoE and IV models show the same value range where the very low LS zone has 2 and the very high LS zone has 0.43 SCAI value (Table 6). This means that both models have almost similar performance for landslide susceptibility mapping in the Hindu Kush region.

TABLE 6. WoE and IV model result validation based on seed cell area index (SCAI).
In this research article, the susceptibility model results were also validated through the R-index which is considered one of the important validation techniques in landslide studies. The result shows that the R-index value for high and very high LS zones was 26.64 and 29.64%, respectively, in the WoE model, and it was 29.48 and 31.21% for the IV model, respectively (Figure 8). Both landslide models have high accuracy and are suitable for similar studies in the Hindu Kush region; however, based on the validation results of all mentioned techniques, it was elucidated that the WoE model gives slightly better results than the IV model.
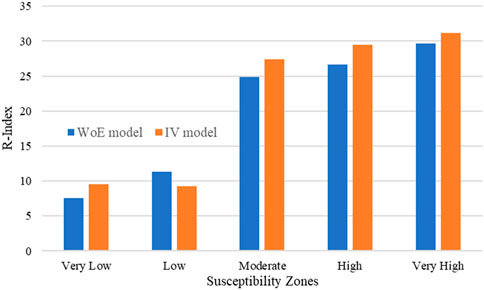
FIGURE 8. R-index of LS zones for WoE and IV models.
Elements at risk and landslide vulnerability
In this study, elements at risk were assessed based on indigenous knowledge and expert opinions, and these included agriculture land, range land, settlements, road network, bridges, and schools. The elements at risk are studied in relation to landslide hazard (susceptibility) zones, and their degree of exposure is explored through the GIS. Each element at risk that falls in the high-susceptibility zone was categorized into the highly exposed group, and similarly, those lying in the low-susceptibility zone are categorized as low exposure to landslide as one of the core characteristics of vulnerability is the ability to see the conditions of exposed elements or communities at risk.
In Shahpur valley, agriculture is the mainstay of the economy, a source of foodstuff, and a major economic activity in the low-lying areas. In Shahpur valley, agriculture land occupied 42.22 sq km, which is 16.3% of the total study area. The local people practice agriculture in the low-lying areas, specifically in the vicinity of rivers or streams, and mostly gentle slopes are dominated by terrace farming. It was found from the results that 37.6% of the total agriculture land is highly exposed to the likelihood of landslide occurrence (Figure 9A). Landslide is a major threat to the agriculture sector and to the people engaged in agriculture activities. About 52.2% of agriculture land is moderately exposed, and only 10.2% of agriculture land is in the category of low exposure to the likelihood of landslide occurrence.
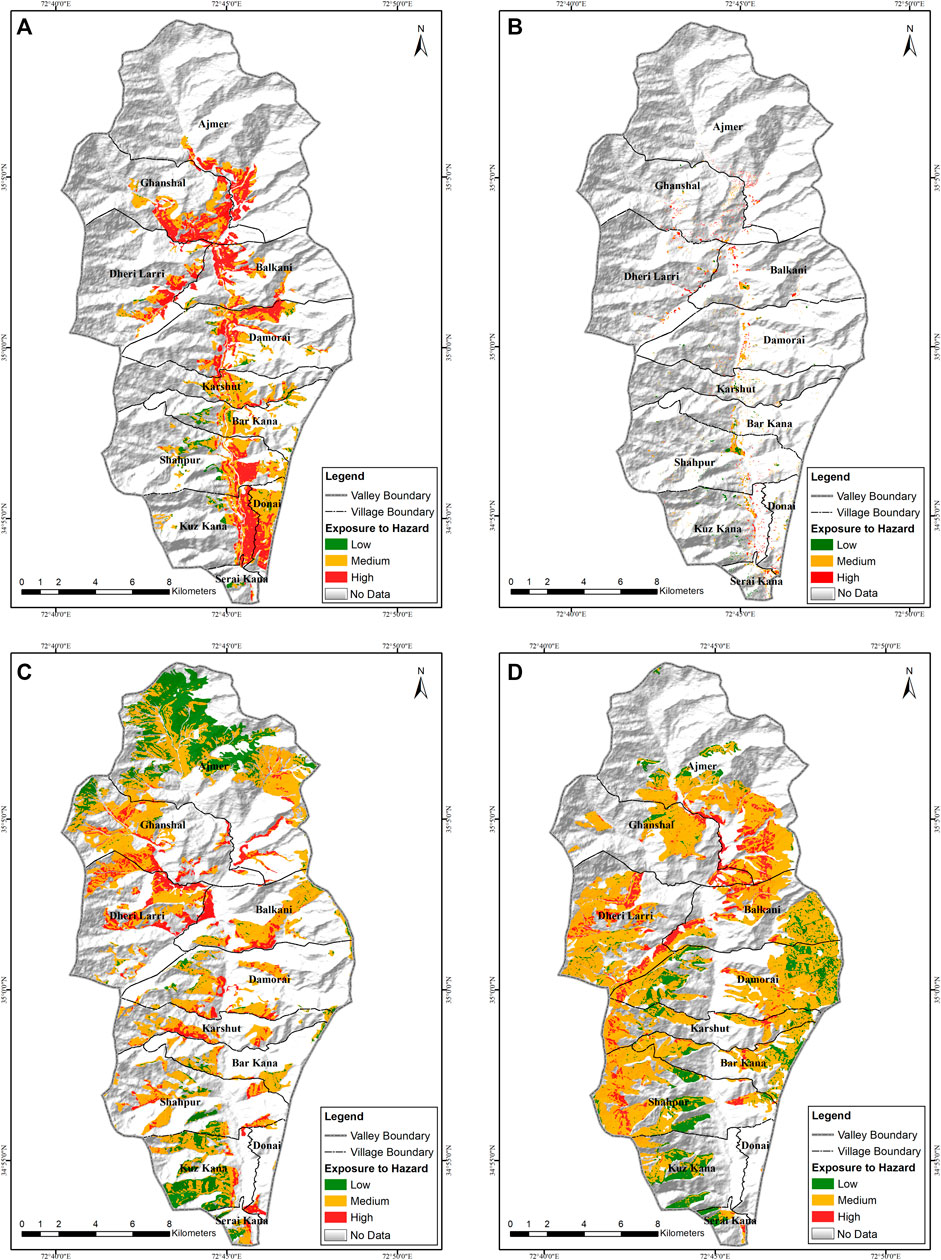
FIGURE 9. Shahpur valley. (A) Agriculture land exposure to the likelihood of landslide occurrence. (B) Settlement exposure to the likelihood of landslide occurrence. (C) Rangeland exposures to the likelihood of landslide occurrence. (D) Forest cover exposures to the likelihood of landslide occurrence.
In the Hindu Kush region, the pace of population growth is higher than the national average (Rahman and Shaw, 2015). This tremendous population growth has increased pressure on the available natural and land resources. With the population growth, demand for food, shelter, communication network, and other requirements also increases. In the areas like Shahpur valley, the people have no choice other than engulfing forest and rangeland to construct shelter for their living and clear the area for agriculture to gain food self-sufficiency. Such situations have accelerated the likelihood of landslide occurrence and vulnerability in the whole Shahpur valley. Settlements taken into consideration as elements at risk include housing units and commercial areas such as shops. People living in these settlements and their vulnerability depend on the location of settlements: either they are situated in hazard-free zone or in hazard-prone areas. Based on the analysis results, about 18.3% of the area under settlements is highly exposed to the likelihood of landslide occurrence, and these settlements are highly vulnerable to any unusual landslide event (Figure 9B). About 66.2% of settlements are moderately exposed to the likelihood of landslide occurrence and have comparatively low vulnerability, while 15.5% of settlements have low exposure to the likelihood of landslide occurrence.
In Shahpur valley, rangelands are present at higher altitudes and are mainly dominated by grasses, shrubs, and bushes. Such lands are very suitable for watershed management and mainly utilized for grazing and livestock ranching. These rangelands are the main pastureland in Shahpur valley. The vegetation cover in these rangelands protects soil erosion and discourages landslide phenomena. In Shahpur valley, out of the total rangeland area, 13.6% was found highly exposed to the likelihood of landslide occurrence and 25.67% area has low exposure, while the rangeland moderately exposed to the likelihood of landslide occurrence is 60.73% of the total area under rangeland (Figure 9C).
Forest is an important resource for the local people and contributes equally to the country's economy. Forest provides timber for house construction and wood for cooking and heating in winter to protect from harsh cold winter. Forest cover is a bioengineering solution for landslide hazards and soil erosion. Forest helps in binding soil and protecting it from slope failure. The study area has thick vegetation cover, particularly over the higher altitudes and the slopes which receive an ample amount of precipitation. At higher altitudes, the coniferous forest is predominant. In landslide vulnerability analysis, it is also an important indicator like agriculture land and human settlement, but it works as a landslide mitigation strategy and its importance cannot be denied. About 10% of the area under forest cover is highly exposed to the likelihood of landslide occurrence (Figure 9D). Mostly, the highly exposed areas are on the slope which is destabilized either by a natural intervention such as earthquake, geological structure, and lateral erosion by rivers and streams during floods or by human intervention such as deforestation, clearing area for settlement construction and agricultural activities, road construction, and quarrying. Forest cover is basically a capacity to cope with the landslide hazard phenomena, but unfortunately, due to the lack of forest conservation, this precious resource is vanishing and, as a result, vulnerability to landslide hazard is increasing.
Likewise, agriculture, settlements, forest and rangeland, and the infrastructure including schools, bridges, and roads were also analyzed for exposure to landslide hazard. Road and bridge data were obtained from the Communication and Works Department, Khyber Pakhtunkhwa, while the school data were obtained from the Elementary and Secondary Education Department. The school data consist of primary, middle, and high schools for both boys and girls. In Shahpur Valley, there are a total of 120 schools. Out of total schools, 42 were found in very high and high hazard zones, which make up 35% of the total schools and have been categorized as highly exposed to landslide hazard (Figure 10A).
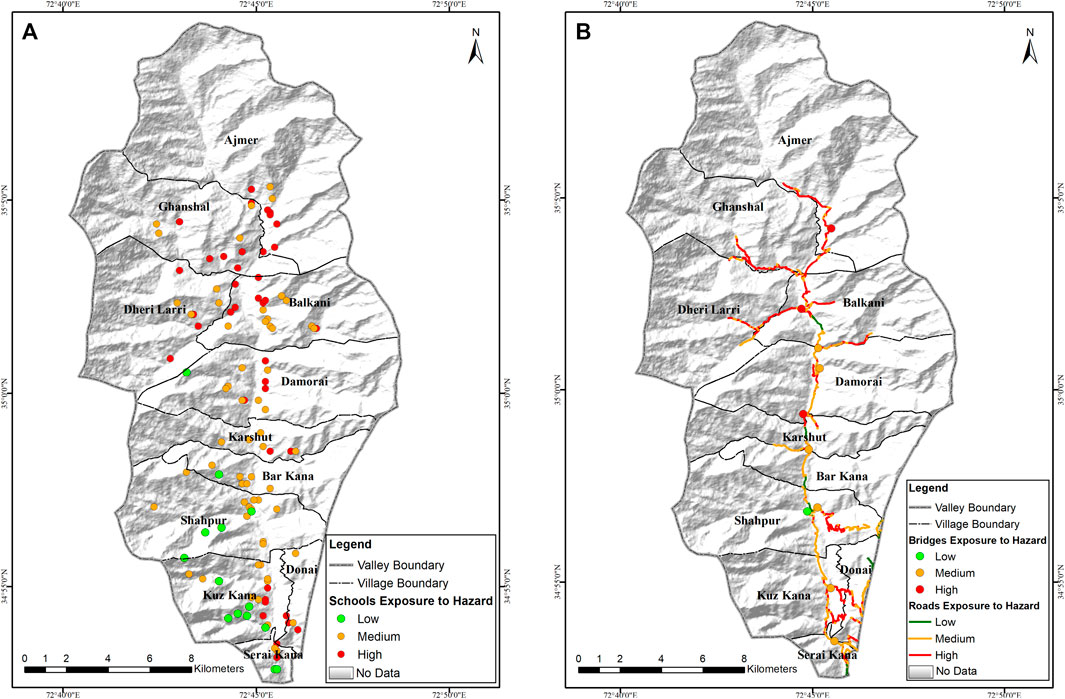
FIGURE 10. Shahpur valley. (A) School exposure to the likelihood of landslide occurrence. (B) Roads and bridge exposure to the likelihood of landslide occurrence.
In Shahpur valley, there is a total of 75 km road network in terms of length, out of which 38 km falls in highly exposed landslide hazard class (Figure 10B). Most of the highly exposed road section is in the upper part of the valley. Roads in Shahpur valley mostly follow the riverside, so the river lateral erosion and road construction itself pose a serious threat, whereas human intervention over the natural slope increases the vulnerability to landslide hazards. About 25 km road is moderately exposed to landslide hazard. Likewise, bridges were also analyzed for landslide exposure. According to the Communication and Works Department, there are 10 bridges in the valley, out of which three bridges are highly exposed to landslide hazard. Similarly, six bridges are located in a moderately exposed area, and the remaining one bridge is in the zone of low exposure to landslide hazard (Figure 10B).
In the study area, agriculture and settlements have high importance and were given a high vulnerability score based on expert opinion, while the rangeland which is not that important in terms of monetary benefits, given a moderate vulnerability score. Thus, vulnerability zonation maps were produced through weighted overlay analysis in the ArcGIS environment using the element at risk layers. Figure 11 shows the different zones of vulnerability for landslide hazard in Shahpur valley. The high and very high vulnerability is mostly found in the lower parts of the valley, while the upper parts of the valley mostly have low vulnerability. The vulnerability variation in the upper and lower parts of the valley is characterized by the variation in the population inhabiting the area and agriculture activity carried out in the valley. Villages Kuz Kana, Shahpur, Bar Kana, and Karshut have high vulnerability as compared to other villages such as Ajmir, Ganshal, and Dheri Larri.

FIGURE 11. Shahpur valley: vulnerability zonation.
Landslide Risk
The likelihood of landslide occurrence and damage potential to the elements at risk maps (vulnerability) were combined through overlay analysis, and the final landslide risk map was prepared. The risk map depicts the areas of high and low risk. The areas that have low or moderate risk means that there is only likelihood of landslide occurrence or damage potential to elements at risk that exists, while both likelihoods of landslide occurrence and damage potential to elements at risk are high, categorized as high and very high landslide risk zones. According to Figure 12, in Shahpur valley, 41.5% of the total area falls in low-risk areas, while the majority (51%) of the area is in a moderate landslide risk zone. The remaining 5.5% area is at high risk, and 2% is in a very high landslide risk zone. In Shahpur valley, while comparing Figure 12 with the land use, road network, and other infrastructure, it was found that most of the agriculture land, settlements, and road network are located in high and very high landslide risk zones. It was found that 10% of the total agriculture land is in a very high landslide risk area and another 22.75% is at high risk of landslide hazard. This is an alarming issue for the agriculture sector, and similarly, in Shahpur valley, enormous damages could occur to this sector if proper mitigation measures are not taken into consideration.

FIGURE 12. Shahpur valley: landslide risk.
Discussion
This study focused on landslide susceptibility using WoE and IV models, assessed elements at risk exposure to landslide hazard (susceptibility), assessed vulnerability based on exposure to hazard and probability of loss, and prepared the landslide risk map based on the function of hazard and vulnerability. Due to unavailability of spatio-temporal landslide inventory in Pakistan and especially in the study region, the inventory of the existing landslide was prepared using high-resolution remote sensing images and verified with extensive field visits. The existing landslides were mapped on the image using polygons. In landslide susceptibility and hazard mapping, polygon data are more effective and reliable than point data (Pourghasemi et al., 2020). In the current study, seven landslide causative factors were selected based on indigenous people's knowledge and studied literature (Khan et al., 2011; Khan et al., 2019; Rahman et al., 2019; Moazzam et al., 2020; Abdı et al., 2021). The relationship between landslide causative factors and landslide occurrences was investigated based on WoE and IV models as shown in Table 2. It is evident from the results of this study that land cover, geology, proximity to roads, and proximity to fault lines have high W^c value and IV values. It is, therefore, concluded that these factors are more contributing in landslide occurrences, and the same has been observed in other studies (Moazzam et al., 2017; Bacha et al., 2018; Rahim et al., 2018). Moreover, the land cover parameter, the barren land, was found highly susceptible to landslide occurrence as this class is more exposed to erosional and mass wasting processes (Mohammady et al., 2012). Similarly, the geology parameters, Darwaza Sar Potassic Gneiss and Greenschist Melange, are found in the seismic-tectonically active zone and therefore bear a high potential for slope failure. Moreover, it is observed from Table 2 that the influence of landslide occurrence decreases with an increase in distance from the roads and streams, and the same has been observed in other similar studies (Regmi et al., 2014; Rahman et al., 2017; Bacha et al., 2018). The construction of roads and stream lateral erosion destabilized the nearby slopes and caused landslides. Earthquake and rainfall are the major landslide causative factors, but due to the unavailability of landslide data associated with both these parameters, we could not use these variables in landslide susceptibility mapping.
The derived susceptibility maps were validated using success and prediction rate curves using training and validation landslides for both curves, respectively. Both curves showed high accuracy for both WoE and IV models, and the results are in line with other studies (Pradhan et al., 2010; Regmi et al., 2014). Both models (WoE and IV) showed excellent performance in sensitivity, specificity, and accuracy results based on both training and validation datasets as shown in Tables 4 and 5, and similar results have been observed in some previous studies (Abdı et al., 2021; Abedi Gheshlaghi and Feizizadeh, 2021). Furthermore, the susceptibility maps derived based on WoE and IV models were validated using the SCAI validation index, and the results showed a good fit for the models, which are in line with other studies (Arabameri et al., 2020; Saha and Saha, 2020).
In this study, exposure to landslide hazard (susceptibility) was assessed using agricultural land, range land, human settlements, roads, bridges, and school data as elements at risk which were selected based on indigenous people's knowledge and expert opinions. Exposure of elements at risk is one of the core characteristics of vulnerability assessment (Shahabi and Hashim, 2015; Singh et al., 2021). It is difficult to assess social, economic, and environmental vulnerability in a region of scarce data availability; therefore, we just focused on the physical vulnerability of the elements at risk in this study. In the Hindu Kush region, the pace of population growth is higher than the national average (Rahman and Shaw, 2015). This tremendous population growth has increased pressure on the available natural and land resources, which ultimately increased the demand for food, shelter, communication network, and other necessities. In the areas like Shahpur valley, the people have no choice other than engulfing forest and range land to construct shelter for their living and clear the area for agriculture to gain food self-sufficiency. Such situations have accelerated the landslide hazard and vulnerability in the whole Shahpur valley. In the valley, 37.6% of the total agriculture land is highly exposed to landslide hazards (Figure 9A), while 18.3% of settlements are highly exposed to landslides (Figure 9B). Landslides deposit debris on prime agricultural land or remove the productive soil (Nguyen and Kim, 2021). From the fieldwork, it was deduced that most of the agriculture is in practiced on greater than 30° slopes due to limited land availability in lower areas. Furthermore, heavy landsliding was observed in heavily grazed and cultivated areas. The forest and natural vegetation clearance for agricultural practices as well as for wood used as a fuel and construction have increased vulnerability in the study region. More than 50% of the road sections in the study area are facing the continuous threat of landslide (Figure 10B). The areas with high population and agricultural practices were found in the highly vulnerable zone (Figure 11). Out of the total study area, 7.5% of the area was found in a high to very high-risk zone where 32% of agriculture is in practice. Evading and reducing the impacts of landslide hazards is possible with education and awareness of people of the community, looking to the history of the hazard to avoid such prone areas. Land use planning, policies, and regulation implementation through local government can reduce the risk of such hazards, and government intervention in this regard has been observed by Almeida et al. (2017).
Conclusion
The WoE and IV models were applied to develop landslide susceptibility maps in this study. Initially, past landslides were marked on the SPOT5 satellite image, validated with consecutive field visits, and then plotted on a map. Landslide causal factors identified through literature review and from indigenous people's knowledge were surface geology, fault lines, land cover, slope gradient and aspect, and distance from streams and roads. The maps of these factors were prepared for susceptibility analysis. The roles of each class of these factor maps in landslide occurrence were analyzed, and assigned weights were calculated by implementing Bayesian probability models, that is, the weight of evidence and information value. The required susceptibility maps were generated using
The LSI maps were prepared based on both models and then validated using the success and prediction rate curves, SCAI, and R-index techniques. The results concluded that the very high landslide susceptibility zone covers 14.49% of the area according to the WoE model and 12.84% of the area in the IV model. Similarly, the area covered by the high-susceptibility zone was 17.84 and 14.57% in WoE and IV models, respectively. The validation results of all applied techniques showed better performance of both the models in the study region. Based on elements at risk, the landslide vulnerability map was generated which showed a high vulnerability to the likelihood of landslide occurrence in the lower parts of the valley. Similarly, the likelihood of landslide occurrence and vulnerability maps were combined, and the risk map of the study area was generated. According to the landslide risk map, 5.5% of the study area was under high risk while 2% of the area was in the very high-risk zone. The availability of temporal landslide records in the study region is the main hindrance in the preparation of landslide hazard and risk mapping. Extensive fieldwork in similar mountainous terrain is another hindrance in the preparation of social and economic landslide vulnerability maps. This study provides a base for disaster management authorities to develop location-specific mitigation measures for landslide hazards to avoid human losses and infrastructural damages in the future. The study concludes that landslide hazards in the region may have negative impacts on agricultural activities, natural ecosystems, river morphology, human lives, and infrastructure in future. In this regard, proper land use planning and strict forest preservation measures are highly required to reduce the environmental and socio-economic damages from landslide hazards.
Data availability statement
The original contributions presented in the study are included in the article/Supplementary Material; further inquiries can be directed to the corresponding author.
Author contributions
GR, MU, AB, SM, and AR proposed the main concept and are highly involved in the write-up. AB, MU, SM, GR, MA, HA, AA, MA-M, and HA assisted in data analysis and preparation of the spatial map. GR, MU, AR, SM, MA-M, AA, HA, MA, and HA are involved in the write-up and review. MM, AB, AA, SM, AR, HA, MA, MA-R, and HA are involved in the review, editing and review, and English grammar correction.
Funding
The article processing charge was funded by the Deanship of Scientific Research, Qassim University. This project was funded by Princess Nourah bint Abdulrahman University Research Supporting Project Number PNURSP 2022R241, Princess Nourah bint Abdulrahman University, Riyadh, Saudi Arabia.
Acknowledgments
The researchers would like to thank the Deanship of Scientific Research, Qassim University, for funding the publication of this project.
Conflict of interest
The authors declare that the research was conducted in the absence of any commercial or financial relationships that could be construed as a potential conflict of interest.
Publisher’s note
All claims expressed in this article are solely those of the authors and do not necessarily represent those of their affiliated organizations, or those of the publisher, the editors, and the reviewers. Any product that may be evaluated in this article, or claim that may be made by its manufacturer, is not guaranteed or endorsed by the publisher.
References
Abdı, A., Bouamrane, A., Karech, T., Dahri, N., and Kaouachi, A. (2021). Landslide susceptibility mapping using GIS-based fuzzy logic and the analytical hierarchical processes approach: a case study in constantine (North-East Algeria). Geotech. Geol. Eng. (Dordr). 39, 5675–5691. doi:10.1007/s10706-021-01855-3
Abdo, H. (2022). Assessment of landslide susceptibility zonation using frequency ratio and statistical index: a case study of Al-fawar basin, tartous, Syria. Int. J. Environ. Sci. Technol. (Tehran). 19, 2599–2618. doi:10.1007/s13762-021-03322-1
Abedi Gheshlaghi, H., and Feizizadeh, B. (2021). GIS-based ensemble modelling of fuzzy system and bivariate statistics as a tool to improve the accuracy of landslide susceptibility mapping. Nat. Hazards (Dordr). 107, 1981–2014. doi:10.1007/s11069-021-04673-1
Ahmed, M. F., Rogers, J. D., and Ismail, E. H. (2014). A regional level preliminary landslide susceptibility study of the upper Indus river basin. Eur. J. Remote Sens. 47, 343–373. doi:10.5721/eujrs20144721
Ali, S. A., Parvin, F., Vojteková, J., Costache, R., Linh, N. T. T., Pham, Q. B., et al. (2021). GIS-based landslide susceptibility modeling: a comparison between fuzzy multi-criteria and machine learning algorithms. Geosci. Front. 12, 857–876. doi:10.1016/j.gsf.2020.09.004
Anbalagan, R., and Singh, B. (1996). Landslide hazard and risk assessment mapping of mountainous terrains—a case study from kumaun himalaya, India. Eng. Geol. 43, 237–246. doi:10.1016/s0013-7952(96)00033-6
Arabameri, A., Saha, S., Roy, J., Chen, W., BlASCHKE, T., Tien Bui, D., et al. (2020). Landslide susceptibility evaluation and management using different machine learning methods in the gallicash river watershed, iran. Remote Sens. 12, 475. doi:10.3390/rs12030475
Bacha, A. S., Shafique, M., and Van Der Werff, H. (2018). Landslide inventory and susceptibility modelling using geospatial tools, in Hunza-Nagar valley, northern Pakistan. J. Mt. Sci. 15, 1354–1370. doi:10.1007/s11629-017-4697-0
Bonham-Carter, G. F. (1989). Weights of evidence modelling: A new approach to mapping mineral potential. Stat. Appl. earth Sci., 171
Bui, D. T., Tsangaratos, P., Nguyen, V.-T., Van Liem, N., and Trinh, P. T. (2020). Comparing the prediction performance of a deep learning neural network model with conventional machine learning models in landslide susceptibility assessment. Catena 188, 104426. doi:10.1016/j.catena.2019.104426
Chen, W., Xie, X., Peng, J., Shahabi, H., Hong, H., Bui, D. T., et al. (2018). GIS-based landslide susceptibility evaluation using a novel hybrid integration approach of bivariate statistical based random forest method. Catena 164, 135–149. doi:10.1016/j.catena.2018.01.012
Chen, X., and Chen, W. (2021). GIS-based landslide susceptibility assessment using optimized hybrid machine learning methods. Catena 196, 104833. doi:10.1016/j.catena.2020.104833
Chen, Z., and Wang, J. (2007). Landslide hazard mapping using logistic regression model in Mackenzie Valley, Canada. Nat. Hazards (Dordr). 42, 75–89. doi:10.1007/s11069-006-9061-6
Cui, S., Pei, X., Jiang, Y., Wang, G., Fan, X., Yang, Q., et al. (2021). Liquefaction within a bedding fault: understanding the initiation and movement of the daguangbao landslide triggered by the 2008 wenchuan Earthquake (Ms= 8.0). Eng. Geol. 295, 106455. doi:10.1016/j.enggeo.2021.106455
Davies, T. (2022). Reducing landslide disaster impacts.” in Landslide hazards, risks, and disasters. Elsevier.
Fu, S., Chen, L., Woldai, T., Yin, K., Gui, L., Li, D., et al. (2020). Landslide hazard probability and risk assessment at the community level: a case of Western hubei, China. Nat. Hazards Earth Syst. Sci. 20, 581–601. doi:10.5194/nhess-20-581-2020
Gautam, P., Kubota, T., Sapkota, L. M., and Shinohara, Y. (2021). Landslide susceptibility mapping with GIS in high mountain area of Nepal: a comparison of four methods. Environ. Earth Sci. 80, 359. doi:10.1007/s12665-021-09650-2
Geertsema, M., and Pojar, J. J. (2007). Influence of landslides on biophysical diversity—a perspective from British columbia. Geomorphology 89, 55–69. doi:10.1016/j.geomorph.2006.07.019
Goetz, J., Brenning, A., Petschko, H., and Leopold, P. (2015). Evaluating machine learning and statistical prediction techniques for landslide susceptibility modeling. Comput. geosciences 81, 1–11. doi:10.1016/j.cageo.2015.04.007
Guzzetti, F., Reichenbach, P., Cardinali, M., Galli, M., and Ardizzone, F. (2005). Probabilistic landslide hazard assessment at the basin scale. Geomorphology 72, 272–299. doi:10.1016/j.geomorph.2005.06.002
Jehan, N., and Ahmad, I. (2006). Petrochemistry of asbestos bearing rocks from Skhakot-Qila Ultramafic Complex, northern Pakistan. J. Himal. Earth Sci. 39, 75
Kamp, U., Owen, L. A., Growley, B. J., and Khattak, G. A. (2010). Back analysis of landslide susceptibility zonation mapping for the 2005 kashmir earthquake: An assessment of the reliability of susceptibility zoning maps. Nat. Hazards (Dordr). 54, 1–25. doi:10.1007/s11069-009-9451-7
Kanungo, D., Arora, M., Sarkar, S., and Gupta, R. (2009). A fuzzy set based approach for integration of thematic maps for landslide susceptibility zonation. Georisk Assess. Manag. Risk Eng. Syst. Geohazards 3, 30–43. doi:10.1080/17499510802541417
Khan, A. N., Collins, A. E., and Qazi, F. (2011). Causes and extent of environmental impacts of landslide hazard in the himalayan region: a case study of murree, Pakistan. Nat. Hazards (Dordr). 57, 413–434. doi:10.1007/s11069-010-9621-7
Khan, H., Shafique, M., Khan, M. A., Bacha, M. A., Shah, S. U., Calligaris, C., et al. (2019). Landslide susceptibility assessment using frequency ratio, a case study of northern Pakistan. Egypt. J. Remote Sens. Space Sci. 22, 11–24. doi:10.1016/j.ejrs.2018.03.004
Korup, O. (2004). Landslide-induced river channel avulsions in mountain catchments of southwest new zealand. Geomorphology 63, 57–80. doi:10.1016/j.geomorph.2004.03.005
Kouli, M., Loupasakis, C., Soupios, P., and Vallianatos, F. (2010). Landslide hazard zonation in high risk areas of rethymno prefecture, crete Island, greece. Nat. Hazards (Dordr). 52, 599–621. doi:10.1007/s11069-009-9403-2
Li, H., Deng, J., Feng, P., Pu, C., Arachchige, D. D., Cheng, Q., et al. (2021a). Short-term nacelle orientation forecasting using bilinear transformation and ICEEMDAN framework. Front. Energy Res. 9, 780928. doi:10.3389/Fenrg.2021.780928
Li, H., Deng, J., Yuan, S., Feng, P., and ArACHCHIGE, D. D. (2021b). Monitoring and identifying wind turbine generator bearing faults using deep belief network and EWMA control charts. Front. Energy Res. 9, 799039. doi:10.3389/fenrg.2021.799039
Li, H. (2022a). SCADA data based wind power interval prediction using LUBE-based deep residual networks. Front. Energy Res. 690, 920837. doi:10.3389/fenrg.2022.920837
Li, H. (2022b). Short-term wind power prediction via spatial temporal analysis and deep residual networks. Front. Energy Res. 662, 920407. doi:10.3389/fenrg.2022.920407
Mersha, T., and Meten, M. (2020). GIS-based landslide susceptibility mapping and assessment using bivariate statistical methods in simada area, northwestern Ethiopia. Geoenvironmental disasters 7, 20. doi:10.1186/s40677-020-00155-x
Moazzam, M. F. U., Vansarochana, A., Boonyanuphap, J., and ChoosumroNG, S. (2017). Landslide assessment using GIS-based frequency ratio method: a case study of mae-phun sub-district, laplae district, uttaradit province, Thailand. Delhi, India: 38th Asian conference on remote sensing.
Moazzam, M. F. U., Vansarochana, A., Boonyanuphap, J., Choosumrong, S., Rahman, G., Djueyep, G. P., et al. (2020). Spatio-statistical comparative approaches for landslide susceptibility modeling: case of mae phun, uttaradit province, thailand. SN Appl. Sci. 2, 384. doi:10.1007/s42452-020-2106-8
Mohammady, M., Pourghasemi, H. R., and Pradhan, B. (2012). Landslide susceptibility mapping at golestan province, Iran: A comparison between frequency ratio, dempster–shafer, and weights-of-evidence models. J. Asian Earth Sci. 61, 221–236. doi:10.1016/j.jseaes.2012.10.005
Myronidis, D., Papageorgiou, C., and Theophanous, S. (2016). Landslide susceptibility mapping based on landslide history and analytic hierarchy process (AHP). Nat. Hazards (Dordr). 81, 245–263. doi:10.1007/s11069-015-2075-1
Nakamura, F., Swanson, F. J., and Wondzell, S. M. (2000). Disturbance regimes of stream and riparian systems—A disturbance‐cascade perspective. Hydrol. Process. 14, 2849–2860. doi:10.1002/1099-1085(200011/12)14:16/17<2849:aid-hyp123>3.0.co;2-x
Ngo, P. T. T., Panahi, M., Khosravi, K., Ghorbanzadeh, O., KarimINEJAD, N., Cerda, A., et al. (2021). Evaluation of deep learning algorithms for national scale landslide susceptibility mapping of Iran. Geosci. Front. 12, 505–519. doi:10.1016/j.gsf.2020.06.013
Nguyen, B.-Q.-V., and Kim, Y.-T. (2021). Regional-scale landslide risk assessment on Mt. Umyeon using risk index estimation. Landslides 18, 2547–2564. doi:10.1007/s10346-021-01622-8
Pawluszek-Filipiak, K., Oreńczak, N., and Pasternak, M. (2020). Investigating the effect of cross-modeling in landslide susceptibility mapping. Appl. Sci. 10, 6335. doi:10.3390/app10186335
Pourghasemi, H. R., Kornejady, A., Kerle, N., and ShabanI, F. (2020). Investigating the effects of different landslide positioning techniques, landslide partitioning approaches, and presence-absence balances on landslide susceptibility mapping. Catena 187, 104364. doi:10.1016/j.catena.2019.104364
Pradhan, B., Sezer, E. A., Gokceoglu, C., and Buchroithner, M. F. (2010). Landslide susceptibility mapping by neuro-fuzzy approach in a landslide-prone area (Cameron Highlands, Malaysia). IEEE Trans. Geosci. Remote Sens. 48, 4164–4177. doi:10.1109/tgrs.2010.2050328
Rahim, I., Ali, S. M., and Aslam, M. (2018). GIS Based landslide susceptibility mapping with application of analytical hierarchy process in District Ghizer, Gilgit Baltistan Pakistan. J. Geoscience Environ. Prot. 6, 34–49. doi:10.4236/gep.2018.62003
Rahman, G., Rahman, A.-U., and Collins, A. (2017). Geospatial analysis of landslide susceptibility and zonation in shahpur valley, eastern hindu kush using frequency ratio model. Proc. Pak. Acad. Sci. 54, 149–163.
Rahman, G., Rahman, A.-U., Ullah, S., Miandad, M., and Collins, A. E. (2019). Spatial analysis of landslide susceptibility using failure rate approach in the Hindu Kush region, Pakistan. J. Earth Syst. Sci. 128, 59. doi:10.1007/s12040-019-1066-0
Ram, P., and Gupta, V. (2022). Landslide hazard, vulnerability, and risk assessment (HVRA), Mussoorie township, lesser himalaya, India. Environ. Dev. Sustain. 24, 473–501. doi:10.1007/s10668-021-01449-2
Regmi, A. D., Devkota, K. C., Yoshida, K., Pradhan, B., Pourghasemi, H. R., Kumamoto, T., et al. (2014). Application of frequency ratio, statistical index, and weights-of-evidence models and their comparison in landslide susceptibility mapping in central nepal himalaya. Arab. J. Geosci. 7, 725–742. doi:10.1007/s12517-012-0807-z
Saha, A., and Saha, S. (2020). Comparing the efficiency of weight of evidence, support vector machine and their ensemble approaches in landslide susceptibility modelling: a study on kurseong region of darjeeling himalaya, India. Remote Sens. Appl. Soc. Environ. 19, 100323. doi:10.1016/j.rsase.2020.100323
Santangelo, N., Forte, G., De Falco, M., Chirico, G. B., and Santo, A. (2021). New insights on rainfall triggering flow-like landslides and flash floods in Campania (Southern Italy). Landslides 18, 2923–2933. doi:10.1007/s10346-021-01667-9
Shahabi, H., and Hashim, M. (2015). Landslide susceptibility mapping using GIS-based statistical models and remote sensing data in tropical environment. Sci. Rep. 5, 9899. doi:10.1038/srep09899
Shano, L., Raghuvanshi, T. K., and Meten, M. (2021). Landslide susceptibility mapping using frequency ratio model: the case of gamo highland, south Ethiopia. Arab. J. Geosci. 14, 623. doi:10.1007/s12517-021-06995-7
Singh, P., Sharma, A., Sur, U., and Rai, P. K. (2021). Comparative landslide susceptibility assessment using statistical information value and index of entropy model in Bhanupali-Beri region, himachal pradesh, india. Environ. Dev. Sustain. 23, 5233–5250. doi:10.1007/s10668-020-00811-0
Spegel, E., and Ek, K. (2022). Valuing the impacts of landslides: a choice experiment approach. Econ. Disaster. Clim. Chang. 6, 163–181. doi:10.1007/s41885-021-00101-7
Stanley, T., and Kirschbaum, D. B. (2017). A heuristic approach to global landslide susceptibility mapping. Nat. Hazards (Dordr). 87, 145–164. doi:10.1007/s11069-017-2757-y
Sudmeier-Rieux, K., Jaquet, S., Derron, M.-H., Jaboyedoff, M., and Devkota, S. (2012). A case study of coping strategies and landslides in two villages of central-eastern nepal. Appl. Geogr. 32, 680–690. doi:10.1016/j.apgeog.2011.07.005
Sujatha, E. R., and Rajamanickam, G. V. (2015). Landslide hazard and risk mapping using the weighted linear combination model applied to the Tevankarai stream watershed, Kodaikkanal, India. Hum. Ecol. Risk Assess. Int. J. 21, 1445–1461. doi:10.1080/10807039.2014.920222
Süzen, M. L., and Doyuran, V. (2004). A comparison of the GIS based landslide susceptibility assessment methods: multivariate versus bivariate. Environ. Geol. 45, 665–679. doi:10.1007/s00254-003-0917-8
Talaei, R. (2014). Landslide risk assessment using a multi-method approach in hashtchin region (NW of Iran). Acta Geod. geophys. 49, 381–401. doi:10.1007/s40328-014-0052-x
Tien, P. V., Luong, L. H., Nhan, T. T., Duc, D. M., Quynh, D. T., Lan, N. C., et al. (2021). Secondary processes associated with landslides in vietnam.” in Proceedings of the international conference on innovations for sustainable and responsible mining. Springer, 192–209.
UNISDR (2009). “UNISDR terminology on disaster risk reduction,” in United nations international strategy for disaster reduction.
Van Westen, C. J., Castellanos, E., and Kuriakose, S. L. (2008). Spatial data for landslide susceptibility, hazard, and vulnerability assessment: an overview. Eng. Geol. 102, 112–131. doi:10.1016/j.enggeo.2008.03.010
Van Westen, C., Quan Luna, B., Vargas Franco, R., Malet, J., Jaboyedoff, M., HoRTON, P., et al. (2010). Development of training materials on the use of geo-information for multi-hazard risk assessment in a mountainous environment.” in Proceedings of the mountain risks international conference. Firenze, Italy, 24–26.
Wang, C., Horby, P. W., Hayden, F. G., and Gao, G. F. (2020). A novel coronavirus outbreak of global health concern. Lancet 395, 470–473. doi:10.1016/s0140-6736(20)30185-9
Wang, Y., Fang, Z., and Hong, H. (2019). Comparison of convolutional neural networks for landslide susceptibility mapping in Yanshan County, China. Sci. total Environ. 666, 975–993. doi:10.1016/j.scitotenv.2019.02.263
Youssef, A. M., and Pourghasemi, H. R. (2021). Landslide susceptibility mapping using machine learning algorithms and comparison of their performance at abha basin, asir region, saudi arabia. Geosci. Front. 12, 639–655. doi:10.1016/j.gsf.2020.05.010
Zhou, J., Wei, J., Yang, T., Zhang, P., Liu, F., Chen, J., et al. (2021a). Seepage channel development in the crown pillar: insights from induced microseismicity. Int. J. Rock Mech. Min. Sci. 145, 104851. doi:10.1016/j.ijrmms.2021.104851
Keywords: landslide, weight of evidence, information value, susceptibility, risk
Citation: Rahman G, Bacha AS, Ul Moazzam MF, Rahman AU, Mahmood S, Almohamad H, Al Dughairi AA, Al-Mutiry M, Alrasheedi M and Abdo HG (2022) Assessment of landslide susceptibility, exposure, vulnerability, and risk in shahpur valley, eastern hindu kush. Front. Earth Sci. 10:953627. doi: 10.3389/feart.2022.953627
Received: 26 May 2022; Accepted: 11 July 2022;
Published: 16 August 2022.
Edited by:
Yusen He, Grinnell College, United StatesReviewed by:
Jiahao Deng, DePaul University, United StatesClàudia Abancó, University of Barcelona, Spain
Sujatha Evangelin Ramani, SASTRA University, India
Copyright © 2022 Rahman, Bacha, Ul Moazzam, Rahman, Mahmood, Almohamad, Al Dughairi, Al-Mutiry, Alrasheedi and Abdo. This is an open-access article distributed under the terms of the Creative Commons Attribution License (CC BY). The use, distribution or reproduction in other forums is permitted, provided the original author(s) and the copyright owner(s) are credited and that the original publication in this journal is cited, in accordance with accepted academic practice. No use, distribution or reproduction is permitted which does not comply with these terms.
*Correspondence: Hussein Almohamad, H.Almohamad@qu.edu.sa