DEM analysis of micromechanics and buffering capacity of superquadric mixture granular materials under impact load
 Hongzhi Qiu
 Jintao Yuan3,4,5,6*
  Peifeng Han
- 1School of Architecture and Civil Engineering, Chengdu University, Chengdu, China
- 2Key Laboratory of Mountain Hazards and Earth Surface Processes, Institute of Mountain Hazards and Environment, Chinese Academy of Sciences, Chengdu, China
- 3School of Civil Engineering and Architecture, Southwest University of Science and Technology, Mian Yang, China
- 4Research Center on Mountain Torrent and Geologic Disaster Prevention, Ministry of Water Resources, Wuhan, China
- 5Guangxi Key Laboratory of Rock and Soil Mechanics and Engineering, Guilin, China
- 6Key Laboratory of Geohazard Prevention of Hilly Mountains, Ministry of Natural Resources, Fuzhou, China
- 7Guangdong Dapeng LNG Company Ltd, Shenzhen, China
As one of the most common geological disasters, rockfalls seriously threaten the safety of linear projects such as roads, railways, and oil and natural gas pipelines. The rigid protective structures that are used for disaster reduction are easily damaged by the impact of rockfalls, which affects the service life of structures. Consequently, the buffer layer has been introduced to resolve this problem. In this work, numerical simulations were carried out by the discrete element method to study the interaction between falling rocks and the granular medium of a soil cushion layer that is installed on a rigid structure. The falling rock is modeled as a single sphere and the soil cushion layer is modeled as a component composed of a collection under the action of gravity, where the filled particles of the soil cushion layer are based on superquadric spheres generated by the superquadric surface equation. This paper uses three shapes (i.e., spheres, cubes, and cylinders) to mix and match as the soil cushion layer. The buffer performance of different mixed material buffer layers is investigated by analyzing the pressure of the bottom plate. The force chain propagation process is investigated by analyzing the comparison of the force chains of the soil cushion layers with different thickness and different filling particles after being impacted. The energy propagation process was studied by analyzing the evolution of the kinetic energy of the particles after the impact of the soil cushion layer.
Introduction
Geological disasters are of widespread concern because they threaten all kinds of infrastructure, human life and property, and seriously restrict the development of human beings (Chae et al., 2017; Fan et al., 2020; Qiu et al., 2020; Cui et al., 2021; Feng et al., 2021; Lee et al., 2021). Rockfall is one of the most common natural hazards in mountainous region. Because of its high kinetic energy characteristics, rockfall poses a considerable threat to the safety of linear projects (Zhang et al., 2004; Guzzetti and Reichenbach, 2010; Zhang J. et al., 2015; Feng et al., 2022; Rao et al., 2022). Measures such as concrete slabs and soil bedding are used to reduce the damage of rockfalls (Lambert and Bourrier, 2013; Chen et al., 2015; Ng et al., 2016). A soil cushion layer of adequate thickness can effectively reduce the impact of a rockfall, while a soil layer installed in front of a concrete slab also has the effect of dispersing the energy of rockfall impact. Therefore, studying the buffering effect of soil bedding on rockfall impact can facilitate the effective design of the corresponding protection.
Quantitative methods have been successfully applied in many fields (Li et al., 2021a; Li H. J. 2022), and many experimental and theoretical studies have been carried out to investigate the interaction between rockfall and soil cushion layers (Calvetti and Di Prisco, 2012; Kim et al., 2015; Zhang G. C. et al., 2015; Ferrero et al., 2016; Tao et al., 2017; Pérez-Rey et al., 2019; Zhou et al., 2021). In these studies, some important factors in the rockfall impact process (e.g., the thickness of the soil cushion layer, and the mass and velocity of the rockfall) were studied in depth, and used to study the laws of impact force and penetration depth. In addition, numerical simulations using discrete element methods (DEM) have been used to analyze the effects of rockfall impacts from a microscopic to macroscopic perspective. For example, Zhang et al. (2017) used a 3D DEM model to study the energy propagation process and the rebound effect of falling rocks when they impacted the buffer layer. Bourrier et al. (2010) used the DEM method to study the evolution of the force chain of falling rocks impacting the buffer layer of soil particles and the overall mechanical response of the buffer layer. Su et al. (2019) conducted a series of DEM model experiments to study the effect of the particle size distribution of soil particles on the horizontal impacts of the impacting rock masses. Roethlin et al. (2013) used the DEM method to study the stress distribution on concrete slabs. These experiments can verify that the DEM method is an effective method to study the impact response of soil buffer layer.
In these studies, the particles of the soil cushion layers are always treated as spheres and the shapes of the falling rocks (e.g., spheres, ellipsoids, or cylinders) are mainly studied. In reality, the particles of the filled soil buffer layer may be very irregular, resembling shapes such as cubes, wedges, and flat spheres. In addition, previous studies have shown that the impact force, penetration depth, and so on of the soil buffer layer particle pile of falling rocks have a great influence (Shen et al., 2019; Ji and Liu, 2020; Shen et al., 2021; Zhu et al., 2021). Shen et al. (2021) studied the effect of the size of the particles of the buffer layer on the impact buffering efficiency of the soil buffer layer, and the shape of the discrete element simulation of the soil buffer-filled particles was spherical. Zhu et al. (2021) studied the effect of the thickness of the soil bedding layer and the size of the filled particles on the impact of falling rocks with spherical particles, and found that the increase of the particle size of the bedding layer decreased the penetration depth of rockfall and attenuated the buffering effectiveness. Shen et al. (2019) studied the impact of different sphericity of the blocks and different falling heights of stones falling on a concrete substrate. The authors found that the maximum impact force on the falling stones increased with the increase of the sphericity of the falling blocks, and the penetration depth of the falling stones decreased with the increase of the sphericity of the falling stones. Ji and Liu (2020) studied the effects of different buffer thicknesses and glass or gravel-filled buffers on the buffering effect of rockfall impacts, explored the force chains evolution of rockfall impacts with different buffer thicknesses by the discrete element method, and further analyzed the buffering performance of spherical particle-filled buffers from the perspective of force chains. It can be seen that these studies all focus on the particle size of the soil buffer layer, the thickness of the buffer layer, and the shape of the falling rocks, whose buffer layer particles are all spherical in shape. Therefore, further research is needed to investigate the influence of the shape of the particles filled in the buffer layer on its buffering ability.
With successful application of quantitative analysis in multiple domains (Li et al., 2021b; Li H. H. 2022), in this study the interaction between rockfall and buffer layer particles are investigated using a discrete element approach using DEM commercial software. A simple spherical rockfall vertically impacting a soil buffer layer particle medium is considered. The objectives include studying the kinetic energy propagation between impacted particles and the evolution of the force chains. Impact simulations were performed for soil buffers filled with different particle shapes and for different soil buffer thicknesses to understand the whole impact process. In addition, the relevance between the buffering performance of soil layers and the shape of the filled particles was investigated.
Materials and methods
Construction of superquadric particles
The superquadric shape was first proposed in mathematics by Barr (1981); this shape is an extension of the sphere and the ellipse. The superquadric equation given by Barr is as follows:
where a, b, and c are the semi-axis lengths on the major axis of the particle (Figure 1A), and s1 and s2 are the shape parameters that describe the particle. By simply altering the five shape parameters (a, b, c, s1, s2) in Eq. 1, the superquadrics gives a good trade-off between the complexity of the model and the flexibility of the shape. An ellipsoid is obtained if a = b = c, when the parameters s1 = s2 = 2; a cylinder is obtained when s1 = 8 > 2 and s2 = 2 ; and a cube is obtained when s1 = s2 = 8 > 2 (Figure 1B).
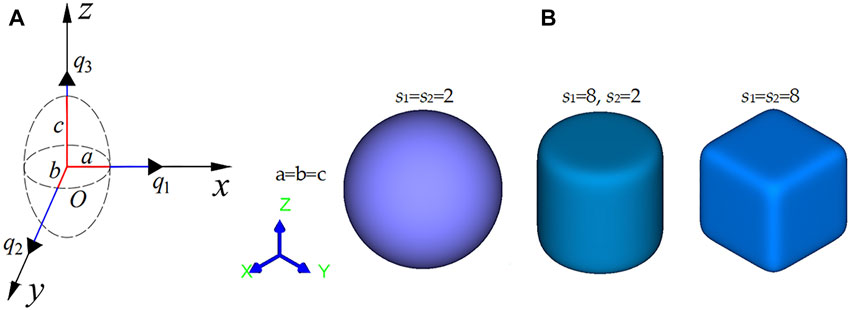
FIGURE 1. Superquadric elements in three dimensions: (A) standard model; (B) sphere, cylinder, and square.
Superquadric particle contact detection
The efficiency of contact detection between particles is related to factors such as contact detection algorithms, particle shape, and boundary conditions, which will directly affect the calculation time of the numerical simulation. In addition, when the semi-axis parameter of the superquadric particle conforms to the condition a = b = c, the shape indexes s1 and s2 are smaller, the particle shape is closer is to the sphere, or the particle surface is smoother, and the efficiency of contact detection is higher. However, as the particle shape parameters s1 and s2 increase, the efficiency of contact detection decreases (Podlozhnyuk et al., 2017). Next, we will briefly introduce three commonly used particle contact detection methods (Wang and Ji, 2018). Among them, the spherical bounding box contact detection algorithm is relatively simple and efficient, as shown in Figure 2A. The radius of the spherical bounding box can be expressed as
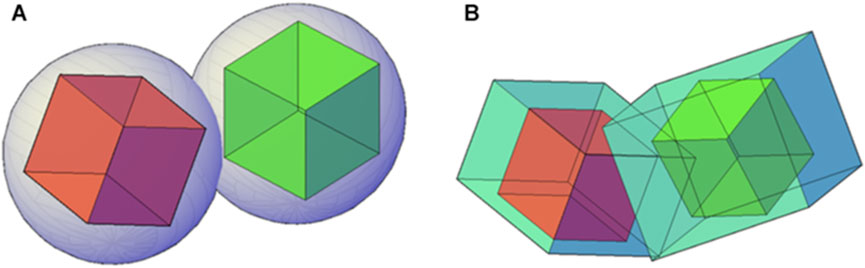
FIGURE 2. Neighbor particles contact detected search: (A) bounding spheres; (B) OBB.
Using the nonlinear Newton iterative method as the third contact between cells transforms the optimization problem of solving the shortest distance between cells into a nonlinear system of equations for solving (Wellmann et al., 2008). When the particles are in contact, the surface normal of the particle are parallel and opposite, and the geometric potential energy is equal according to the midpoint between particles with respect to the surface of the two particles equations, as shown in Figure 3, which can be expressed as
where X=(x,y,z)T; Fi(X), and Fj(X) are the equations of particle i and j in global coordinates, respectively; ▽Fi(X) and ▽Fj(X) are the external normal directions of the surfaces of particle i and j in the x, y, and z directions; and k2 is the external normal direction between the particles.
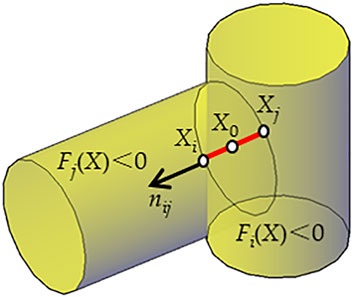
FIGURE 3. Schematic diagram of superquadric particles contact detection.
Equation 2 with Newton’s iterative formula can be expressed as
where
When the particle surface point conforms to Eq. 4, and the unknown parameters λ1 and λ2 can be calculated by the one-element nonlinear Newton equations expressed in Eq. 5, then the normal overlap when contact between particles occurs can be expressed as
Similarly, the contact detection algorithm of the particle boundary is expressed as a function, which is the superquadric equation, and establishes the nonlinear equations to be solved. The boundary considered in this paper is a cylinder bore of the rigid structure shown in Figure 4, and the function can be expressed as
where D and H are the inner diameter and height of the cylinder bore, respectively.
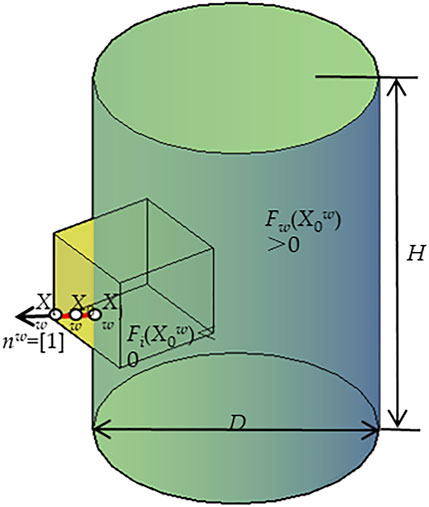
FIGURE 4. Schematic diagram of contact detection between the surface of the superquadric particle and the boundary of the cylinder bore.
While there is contact between the particle elements, the surface normal is parallel, and vice versa. When the geometric potential energy from the midpoint to the surface of the particle is equal to that from the midpoint to the cylinder surface, then the nonlinear equations can be established and expressed as
Equation 7 with Newton’s iterative formula can be expressed as
where
Furthermore, Xjw on the surface of the cylinder can be expressed as Eq. 9. When Xiw conforms to Eq. 10, and the unknown parameter λ3 can be calculated by the one-dimensional nonlinear Newton iteration equation expressed in Eq. 11, then the normal overlap when the particle element is in contact with the cylinder boundary can be expressed as
In general, the Newton iteration of solving a quadratic nonlinear system of equations algorithm for solving the quadratic nonlinear system of equations is the main factor affecting the efficiency of particle search and the overall computation time, which is closely related to the particle surface sharpness and aspect ratio. As the inter-unit search efficiency decreases significantly with the exponential increase of the sharpness parameters s1 and s2, the efficiency of inter-unit search decreases significantly because the particles are close to spherical shape. The overall computational efficiency gradually improves as the particles approach a spherical shape.
The linear spring-dashpot contact model
The contact model of the superquadric particle element is an improved model based on the three equations linear elastic damping model (Di Renzo and Di Maio, 2004). The interaction force and torque between the particles in the contact model can be simplified to a spring, damper, and slider. According to Newton’s second law, the force, overlap, and direction at the contact point at which the particle element interacts can be calculated, as shown in Figure 5.
where kt,n is the normal displacement stiffness coefficient; δn,ij is the normal overlap of particles i and j; ηt,n is the particle normal damping coefficient; vn,ij is the normal relative velocity of particle i and j; and ni,j is the unit normal vector of the overlap between particle i and j.
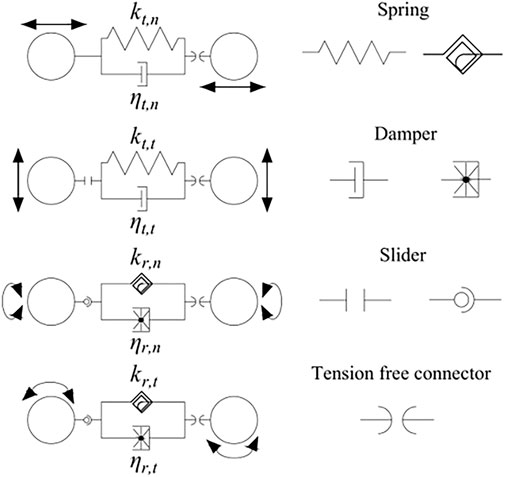
FIGURE 5. Contact model of linear spring-dashpot. As the particles interact, the resulting contact normal force Fn can be expressed as.
The tangential force Ft when the particles are tangents can be expressed as
where δt,ij is the tangential overlap of particle i and j; vt,ij are the relative tangential velocity of particles i and j; vi,j are the relative velocity of particles i and j; ω is the angular velocity of particle rotation; and li and lj are the distance from the centroid of particle i and j to the point of contact between particle i and j, respectively.
DEM model calibration and validation
In this section, the DEM model is first calibrated and then validated. Figure 6 shows the DEM model configuration of the rockfall impacts on the soil cushion, and three different particle shapes (i.e., spheres, cubes and cylinders) in the soil cushion are constructed by the quadric hypersurface equation. A soil cushion layer of different thicknesses is randomly generated at the bottom of a rigid boundary with a diameter of 100 mm, and the soil cushion is kept in stable equilibrium under the action of gravity. The rock block is simulated as an individual spherical particle with a diameter of 16 mm. During the simulation, the rock block is placed directly above the soil buffer and the initial velocity v0 of the rock block impacting the soil cushion is determined based on its fall height. Poisson’s ratio, Young’s modulus, and density of the soil cushion particles are selected as the values commonly used in the paper (Effeindzourou et al., 2017; Ji and Liu, 2020; Shen et al., 2021; Zhu et al., 2021), and the parameters of the DEM model are detailed in Table 1 below.

FIGURE 6. Schematic DEM model of the rockfall impacting soil cushion layer.
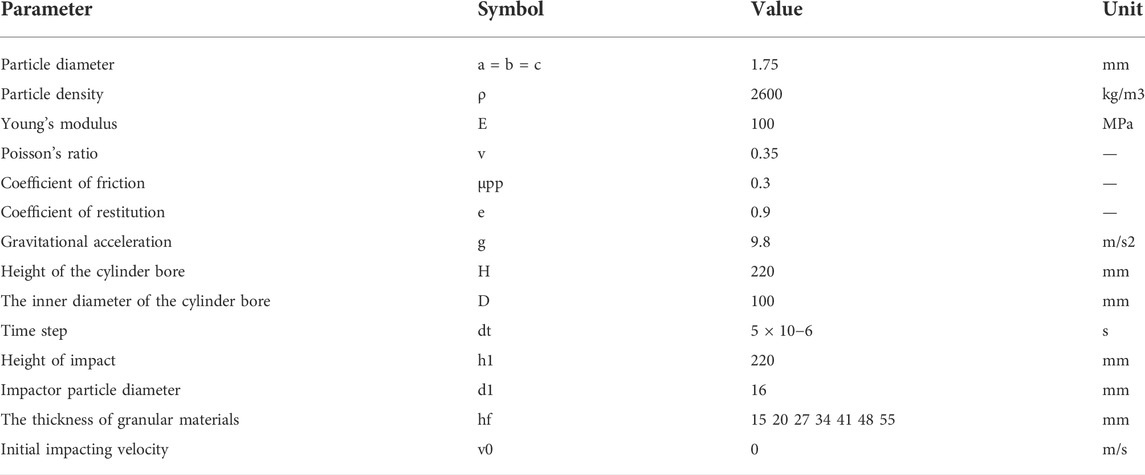
TABLE 1. Simulation parameters used in the discrete element method (DEM).
To determine the thickness of the soil buffer layer and the effect of its particle shape on the impact characteristics between the rockfall and the cushion layer, different particle shape groups and cushion layer thickness groups were set up in the experiment. The particle shape groups were: sphere-cylindrical layer, sphere-cubic layer, cubic-cylindrical layer, and cylindrical-cubic-spherical layer. The thicknesses of the soil particle cushion layers were 15, 20, 27, 34, 41, 48, and 55 mm, which were relatively consistent with the experimental conditions of Ji and Liu (2020).
Results and discussion
Impact of rockfall on the force of the bottom floor
To research the buffering effect of different shapes of particle bedding on the impact process of falling rocks and to ensure the consistency of the particle aspect ratio of the soil buffer layer, we obtained the buffering performance of the soil cushion layer formed under different particle shapes. Figure 7 presents the evolution of impact pressure for the rockfall motion on the system of granular materials (sphere-cylinder) buffering at different thicknesses of the soil cushion layer. After rockfall collision onto the surface of the particle layer, the bearing impact pressure of the particle first sharply increased to the peak value and then gradually decreased to zero within a short time. The impact pressure duration decreased with the increased thickness of the particle layer and finally is smaller than 7.5 ms. However, the impact pressure is decreased from 0.42 to 0.2 Pa with the increased thickness of the particle layer. According to Zhang et al. (2017), the impact pressure and impact duration were factual relations to the number of particles contacted in the rockfall, and the contact force includes normal and tangential directions in the particles buffering layer at impact. In current numerical results, the evolution of contact force on normal and tangential direction are shown in Figures 8A,B, respectively. It can be seen that the evolution of Fn and Ft were similar with impact pressure and impact duration. When the rockfall touched the soil cushion layer surface, the contact force of particle sharply increased to maximum contact force and then decreased to zero within a short time. In addition, we note the time that Fn and Ft reached maximum value were the same as peak value of impact pressure because the relationship is close between both contact force and impact pressure. For the test of thickness of particles layer (h = 15 mm), the value of Fn and Ft is larger than other cases. The normal and tangential forces on the base plate was greater when the height of soil cushion layer to contact number between rockfall with particle buffering was smaller, and the transmission of the impact force was more stable. As expected, for the test of thickness of particles layer (h = 55 mm) the impact force of the bottom plate was smaller when more particles join to contact with rockfall, and this means that the greater impact force resolved between particles lead is smaller. Hence, the evolution of the contact force can reflect impact pressure and impact duration.
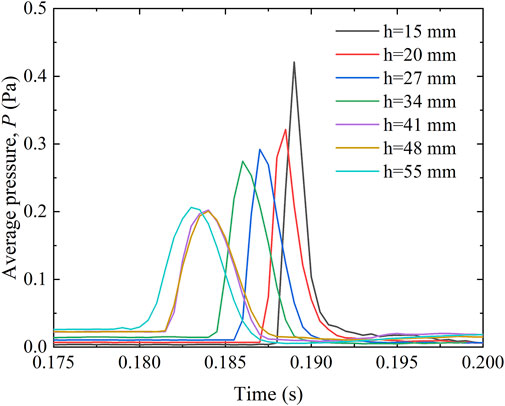
FIGURE 7. Evolution and comparison of the impact average pressure for the rockfall impacting against the granular material of buffering (sphere-cylinder) with different thicknesses of the particle layer.
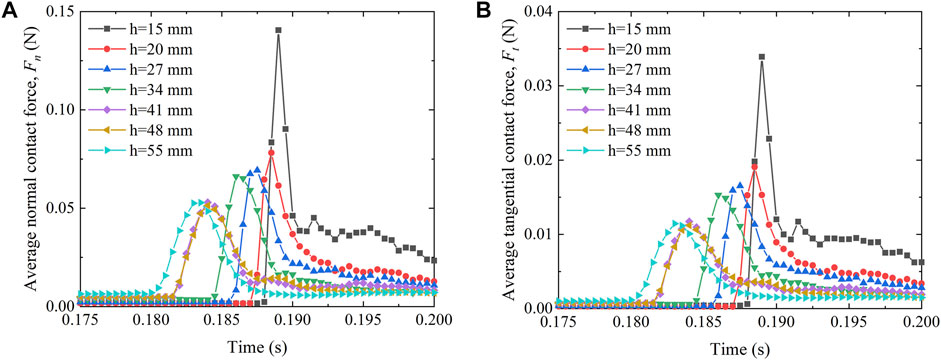
FIGURE 8. Evolution of the contact force for the rockfall impacting against the granular material of buffering (sphere-cylinder) with different thicknesses of the particle layer: (A) normal force; (B) tangential force.
The evolution characteristics of the maximum impact force on the bottom plate surface of different types of soil cushion layers with the thickness of the cushion layer are shown in Figure 9. The impact force on the bottom plate tends to decrease gradually as the thickness of the particle cushion layer increases. After the thickness of the cushion layer reaches 48 mm, the maximum impact force on the bottom plate tends to be horizontal with the increase of the thickness, which is consistent with the change trend of the experimental results of Zhu et al. (2021). When the thickness of the soil cushion layer is less than 48 mm, the different shapes of the filled particles have a significant effect on the cushioning performance of the cushion layer at the same thickness. In particular, the impact force on the bottom plate of the cushion layer with the particles filled with the sphere-cylinder combination is the smallest and its cushioning effect is the best, and the impact force on the bottom plate of the cushion layer with the particles filled with the sphere-cylinder-cube is the largest and the buffering effect is the worst. As the thickness of the soil buffer layer increases, the shape of the filled particles of the soil buffer layer gradually reduces its influence on the pressure of the bottom plate. When the thickness of the buffer layer is not less than 48 mm, the shape of the filled particles already has little effect on its buffering. It seems that by controlling the thickness of the soil buffer layer and the shape of the filled particles, the impact force on the bottom plate can be reduced very well.
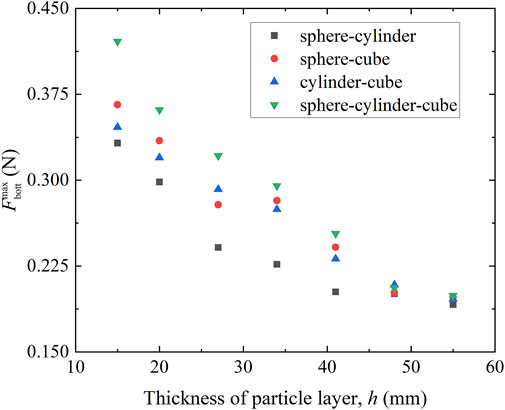
FIGURE 9. Comparison of the maximum impact for the rockfall impacting against the granular material of buffering with different thickness of soil cushion layer.
Figure 10A shows that normal pressure maximum (P) of the bottom plate on the sphere-cylinder group is lowest in one of the mixture granular materials, P of sphere-cylinder-cube group is largest, P of sphere-cube and cylinder-cube group is in-between them, presented a decrease trend of the exponential function, and the value of decrease is minimized with the growth value of particle thickness layer (h0). The proposed prediction mathematics model between P and h0 is shown in Table 2. According to the literature of Ji and Liu (2020), this result proposes a critical thickness of particle layer (hc). It can be obviously seen that when h0 < hc (particle thickness layer of critical value), the particle shape or the sharpness of the particle surface (i.e., particle catalog of the granular material system) is more complicated and is more sensitive to P; when h0 > hc, the particle shape or mixture level of particle system is not sensitive to P; meanwhile, hc in this paper is 48 mm. Meanwhile, the rate of buffering capacity (κ) presents a tendency to increase with the additional value of the particle thickness layer, note that this tendency is in contrast to P, and κ reaches a stable value of 90% when h0 = 48 mm, as shown in Figure 11B. Because hc is closely related to factors such as granular material, impactor shape, and geometric size, there is a difference in hc under different boundary conditions. In addition, to evaluate value of thickness of granular material layer (i.e., hc, and also mean economic cost and consumption of material) there is thus a need for further research of the buffering characteristics of particulate materials.
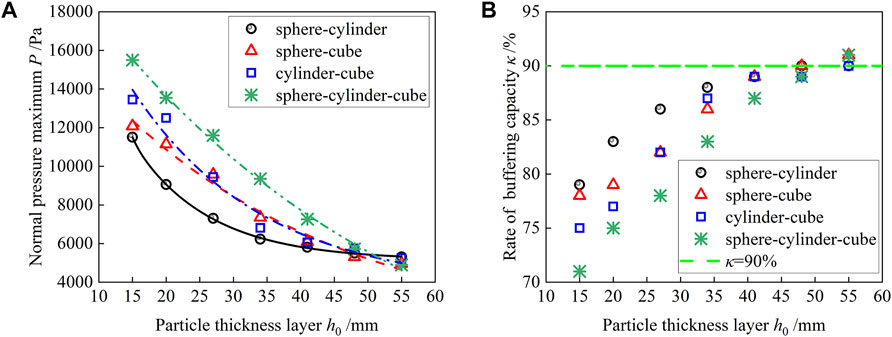
FIGURE 10. Influence on particle thickness layer for impact pressure of bottom plate: (A) normal pressure maximum P; (B) rate of buffering capacity κ.
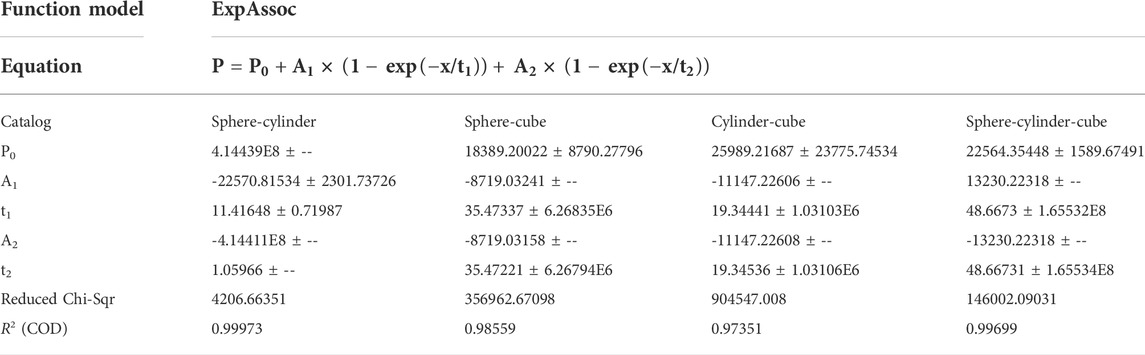
TABLE 2. Fitting function model of normal pressure maximum P.
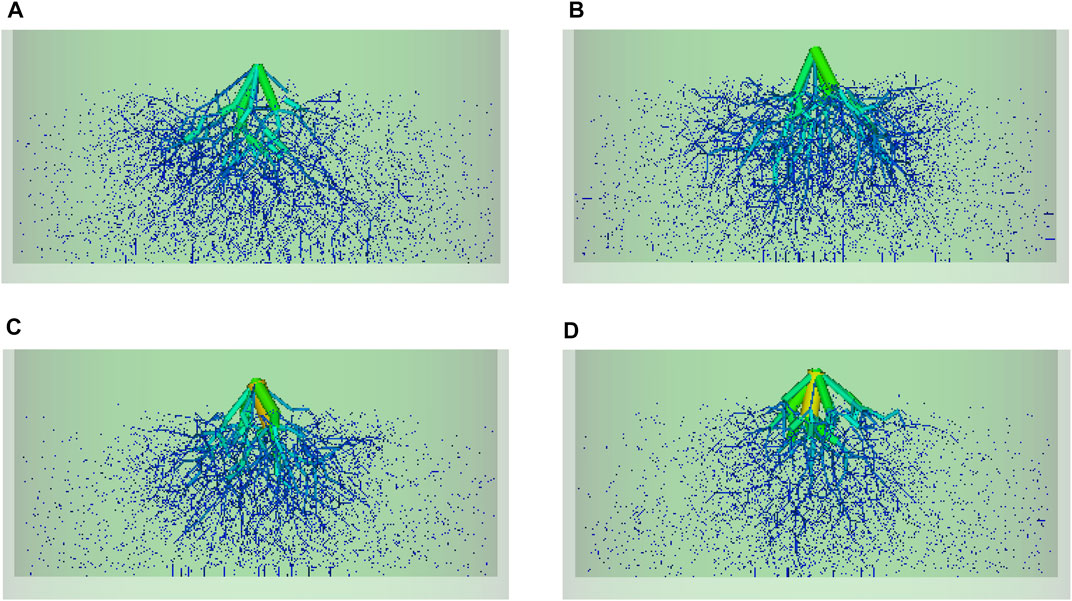
FIGURE 11. Comparative analysis of the evolution of normal force chains of different mixed particle materials at the same moment: (A) cylinder-cube; (B) sphere-cube; (C) sphere-cylinder; (D) sphere-cylinder-cube.
Micromechanics characteristics of the mixed granular material at the peak pressure of the bottom plate
The force chain is defined as a network of discontinuous lines in the centers of the contact particles, being the path along which the force is selectively transmitted along the contact network, and the thickness of the lines is proportional to the magnitude of the contact force. In the impact overshoot, the different buffer layers all show the shock wave propagating radially and laterally from the impact point within the buffer layer. The larger normal contact force is mainly concentrated under the falling rock, while the smaller normal contact force is distributed near the propagation front, which is similar to the experimental phenomenon of Shen et al. (2019). Figure 11 shows a comparison of the force chain evolution for soil buffers filled with different particle shapes at the same moment. Based on the color and thickness of the force chains, it can be seen that the maximum normal contact force is the largest in Figure 11C, followed by Figure 11D, and the smallest in Figure 11A. This is due to the fact that as the shape of the cube of the particles filled with the soil buffer layer increases (i.e., the increase in the sharpness of the particles makes the interparticle contact tend to be from point contact to surface contact), the contact area between the particles increases and the particle system is denser. The relative sliding and rolling between the particles are suppressed, the efficiency of the force chain network in transmitting force is more rapidly, and the buffering effect of the soil buffer layer is poor.
Figure 12 shows the evolution of the falling rock impact force chain with different buffer layer thicknesses. It can be seen that the maximum normal contact force between particles is the deepest in color when the buffer layer thickness is h = 15 mm, and the lateral development of the force chain is also the slowest, the vertical development is the fastest, and the buffering effect is the weakest. Combined with Figure 11C, the comparison shows that the radial and lateral development of force chains are on the rise as the buffer layer thickness increases to h = 41 mm in the process, and the mesh structure of force chains becomes increasingly complex. When the buffer layer thickness h ≥48 mm, the longitudinal network of the force chain at that moment can no longer touch the bottom plate, and the longitudinal and transverse development of the force chain network both show a slowing trend. From the perspective of force chain, when the thickness of soil buffer layer reaches hc, the buffer efficiency of buffer layer thickness does not show an increasing trend.
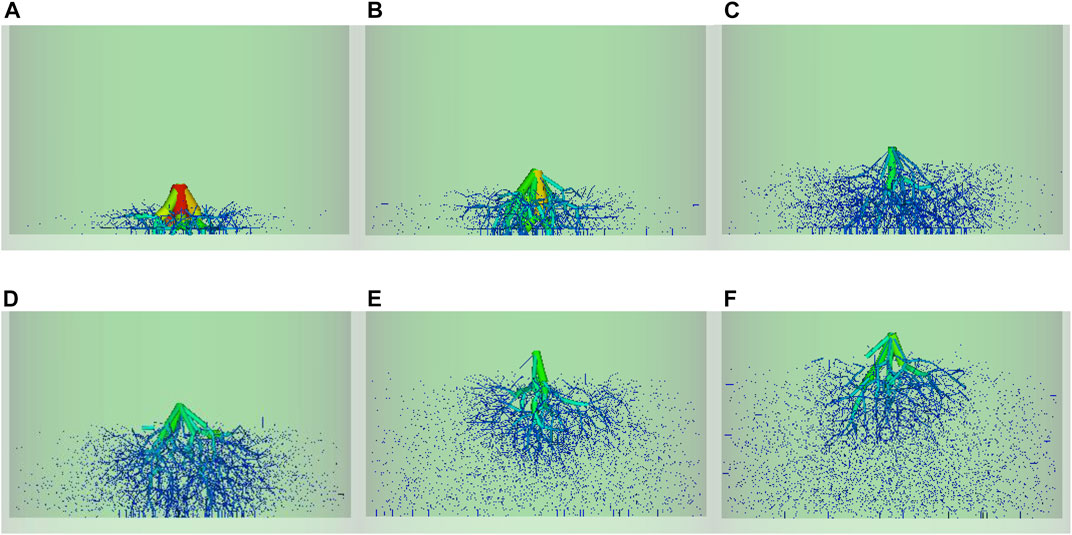
FIGURE 12. Comparison of the evolution of force chains with different thicknesses of the sphere-cylinder soil buffer layer at the same moment: (A) h = 15 mm; (B) h = 20 mm; (C) h = 27 mm; (D) h = 34 mm; (E) h = 48 mm; (F) h = 55 mm.
Kinetic energy mobilization
The effect of rockfall on the soil buffer layer involves the evolution of a range of energy components, with the evolution of kinetic energy in particular being the most specific (Zhang et al., 2017). During the impact process, the kinetic energy of falling rocks is gradually transferred to the particles of the soil buffer layer, resulting in significant changes in both the rotational kinetic energy Er and the translational kinetic energy Et of the particles of the soil buffer layer. Figure 13 presents the evolution of kinetic energy for a system of granular materials buffering at different thickness of particle layer. Obviously, as shown in Figure 13A, the trend of the average translational energy of soil buffer particles of different thicknesses after impact is similar, but the average translational energy of buffer particles tends to decrease gradually with the increase of buffer thickness. As shown in Figure 13B, the trends of the maximum translational energy of different types of soil buffers after impact with the thickness of soil buffers are relatively consistent, and the influence of the shape of the buffer-filled particles on the translational energy of the buffer particles can be seen.
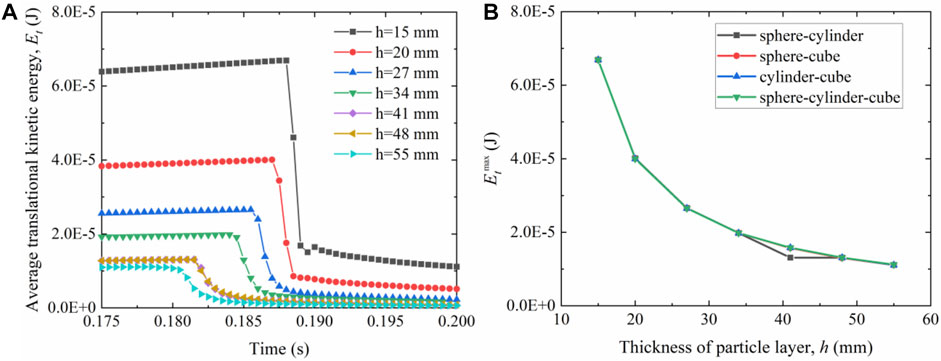
FIGURE 13. Evolution and comparison of the translational kinetic energy for the rockfall impacting against the granular material of buffering with different thickness of particle layer: (A) sphere-cylinder; (B) translational kinetic energy of max.
Figure 14A shows that the time course curves of the average rotational kinetic energy of the soil buffer during the impact of falling rocks on the soil buffer of different thicknesses. It can be seen that as the thickness of the buffer decreases, the peak of the average rotational kinetic energy becomes larger, which is due to the increase of the average tangential force on the particles of the soil buffer. Figure 14B shows the trend of the maximum rotational kinetic energy of different types of soil buffer particles with the increase of buffer layer thickness. It can be seen that the shape of the filled particles of the buffer layer has a greater influence on its rotational kinetic energy. In particular, the variation of the rotational kinetic energy of the cylinder-cube buffer layer is the greatest.
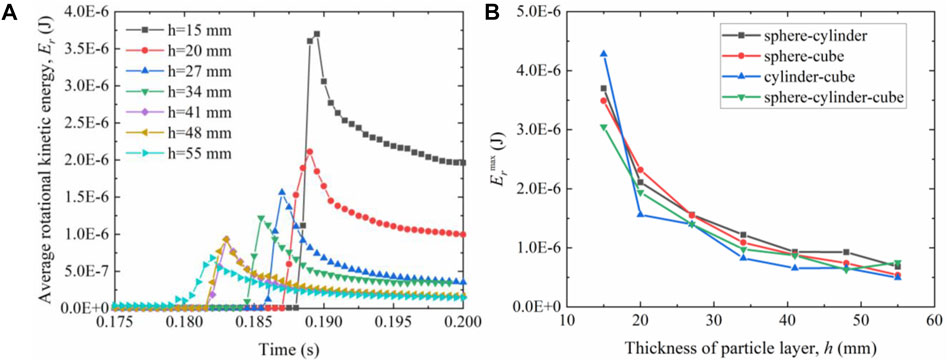
FIGURE 14. Evolution and comparison of the rotational kinetic energy for the rockfall impacting against the granular material of buffering with different thickness of particle layer: (A) sphere-cylinder; (B) rotational kinetic energy of max.
Conclusion
In this study, based on the hyperquadratic surface equation to construct the non-spherical particle shape, the discrete element method was used to numerically analyze the buffering characteristics of the mixed particle soil buffer layer under the action of spherical rockfall impact. The evolution of the internal force chain of the buffer layer and the evolution of the kinetic energy of the particles in the buffer layer are further investigated by studying the effects of the buffer layer thickness and the composition of the cushioning material on the bottom impact force.
The results show that the buffer layer thickness is an important factor that affects the buffering performance of mixed materials of different shapes. When the thickness of the buffer layer h < hc, the buffering performance of the buffer layer of mixed materials with different shapes increases with the thickness of the particle layer; when h > hc, the influence of the particle shape and buffer layer thickness on its buffering performance is small and the change is small. Meanwhile, the buffer performance of soil cushion layer with spherical filling is better than that of soil cushion layer with mixed materials. The higher the content of cube-particles of mixed materials, the more the surface contact between the cushion layers increases and the point contact decreases, which increases the stability of the buffer system and thus reduces the buffer performance of the soil cushion layer particles.
Data availability statement
The datasets presented in this article are not readily available because the original contributions presented in the study are included in the article/Supplementary Material, further inquiries can be directed to the corresponding author. Requests to access the datasets should be directed to 2758714200@qq.com or hnqhz@126.com.
Author contributions
HQ and JY: investigation, software and writing original draft; PH: writing, review and editing; MY, WH and XF: investigation; YL: drawing the graphs and tables in the paper. All authors have read and agreed to the published version of the manuscript.
Funding
This research was funded by the National Natural Science Foundation of China (Grant No. 42101089); Research Center on Mountain Torrent and Geologic Disaster Prevention Foundation, Ministry of Water Resources, China (Grant No. CKWV2019759/KY); Opening Fund of Key Laboratory of Geohazard Prevention of Hilly Mountains, Ministry of Natural Resources (Fujian Key Laboratory Of Geohazard Prevention) (Grant No. FJKLGH 2022K006); Guangxi Key Laboratory of Geomechanics and Geotechnical Engineering (Grant No. 20-Y-KF-03); and Sichuan Science and Technology Innovation Project (No. SCJSKJ 2021-42).
Conflict of interest
Authors MY and WH are employed by Guangdong Dapeng LNG Company Ltd.
The remaining authors declare that the research was conducted in the absence of any commercial or financial relationships that could be construed as a potential conflict of interest.
Publisher’s note
All claims expressed in this article are solely those of the authors and do not necessarily represent those of their affiliated organizations, or those of the publisher, the editors and the reviewers. Any product that may be evaluated in this article, or claim that may be made by its manufacturer, is not guaranteed or endorsed by the publisher.
References
Barr, A. H. (1981). Superquadrics and angle-preserving transformations. IEEE Comput. Graph. Appl. 1, 11–23. doi:10.1109/mcg.1981.1673799
Bourrier, F., Nicot, F., and Darve, F. (2010). Evolution of the micromechanical properties of impacted granular materials. Comptes Rendus Mec. 338, 639–647. doi:10.1016/j.crme.2010.09.007
Calvetti, F., and Di Prisco, C. (2012). Rockfall impacts on sheltering tunnels: real-scale experiments. Géotechnique 62, 865–876. doi:10.1680/geot.9.p.036
Chae, B. G., Park, H. J., Catani, F., Simoni, A., and Berti, M. (2017). Landslide prediction, monitoring and early warning: a concise review of state-of-the-art. Geosci. J. 21 (6), 1033–1070. doi:10.1007/s12303-017-0034-4
Chen, X. Q., Cui, P., You, Y., Chen, J. G., and Li, D. J. (2015). Engineering measures for debris flow hazard mitigation in the Wenchuan earthquake area. Eng. Geol. 194, 73–85. doi:10.1016/j.enggeo.2014.10.002
Cui, S. H., Pei, X. J., Jiang, Y., Wang, G. H., Fan, X. M., Yang, Q., et al. (2021). Liquefaction within a bedding fault: understanding the initiation and movement of the Daguangbao landslide triggered by the 2008 Wenchuan Earthquake (Ms = 8.0). Eng. Geol. 295, 106455. doi:10.1016/j.enggeo.2021.106455
Di Renzo, A., and Di Maio, F. P. (2004). Comparison of contact-force models for the simulation of collisions in DEM-based granular flow codes. Chem. Eng. Sci. 59 (3), 525–541. doi:10.1016/j.ces.2003.09.037
Effeindzourou, A., Giacomini, A., Thoeni, K., and Sloan, S. W. (2017). Numerical investigation of rockfall impacts on muckpiles for underground portals. Rock Mech. Rock Eng. 50 (6), 1569–1583. doi:10.1007/s00603-017-1183-5
Fan, X. Y., Tang, J. J., Tian, S. J., and Jiang, Y. J. (2020). Rainfall-induced rapid and long-runout catastrophic landslide on July 23, 2019 in Shuicheng, Guizhou, China. Landslides 17 (9), 2161–2171. doi:10.1007/s10346-020-01454-y
Feng, P., Xu, Y., and Dai, F. (2021). Effects of dynamic strain rate on the energy dissipation and fragment characteristics of cross-fissured rocks. Int. J. Rock Mech. Min. Sci. 138, 104600. doi:10.1016/j.ijrmms.2020.104600
Feng, P., Zhao, J. C., Dai, F., Wei, M. D., and Liu, B. (2022). Mechanical behaviors of conjugate-flawed rocks subjected to coupled static–dynamic compression. Acta Geotech. 17, 1765–1784. doi:10.1007/s11440-021-01322-6
Ferrero, A. M., Migliazza, M. R., Pirulli, M., and Umili, G. (2016). Some open issues on rockfall hazard analysis in fractured rock mass: problems and prospects. Rock Mech. Rock Eng. 49 (9), 3615–3629. doi:10.1007/s00603-016-1004-2
Guzzetti, F., and Reichenbach, P. (2010). Rockfalls and their hazard, in: Tree rings and natural hazards. Springer, 129–137. doi:10.1007/978-90-481-8736-2_12
Ji, S. Y., and Liu, L. (2020). “DEM analysis of vibration reduction and buffering capacity of granular materials,” in Computational granular mechanics and its engineering applications (Singapore: Springer), 359–387. doi:10.1007/978-981-15-3304-4-10
Kim, D. H., Gratchev, I., Berends, J., and Balasubramaniam, A. (2015). Calibration of restitution coefficients using rockfall simulations based on 3D photogrammetry model: a case study. Nat. Hazards (Dordr). 78, 1931–1946. doi:10.1007/s11069-015-1811-x
Lambert, S., and Bourrier, F. (2013). Design of rockfall protection embankments: a review. Eng. Geol. 154, 77–88. doi:10.1016/j.enggeo.2012.12.012
Lee, J., Barbato, M., and Lee, D. K. (2021). Rockfall hazard analysis based on the concept of functional safety with application to the highway network in South Korea. Rock Mech. Rock Eng. 54, 6633–6647. doi:10.1007/s00603-021-02490-3
Li, H. J., Deng, J., Feng, P., Pu, C., Arachchige, D., Cheng, Q., et al. (2021a). Short-term nacelle orientation forecasting using bilinear transformation and ICEEMDAN framework. Front. Energy Res. 9, 780928. doi:10.3389/fenrg.2021.780928
Li, H. J., Deng, J., Yuan, S., Feng, P., and Arachchige, D. (2021b). Monitoring and identifying wind turbine generator bearing faults using deep belief network and EWMA control charts. Front. Energy Res. 9, 799039. doi:10.3389/fenrg.2021.799039
Li, H. J. (2022a). SCADA data based wind power interval prediction using LUBE-based deep residual networks. Front. Energy Res. 10, 920837. doi:10.3389/fenrg.2022.920837
Li, H. H. (2022b). Short-term wind power prediction via spatial temporal analysis and deep residual networks. Front. Energy Res. 10, 920407. doi:10.3389/fenrg.2022.920407
Ng, C. W. W., Choi, C. E., Su, A. Y., Kwan, J. S., and Lam, C. H. (2016). Large-scale successive boulder impacts on a rigid barrier shielded by gabions. Can. Geotech. J. 53, 1688–1699. doi:10.1139/cgj-2016-0073
Pérez-Rey, I., Riquelme, A., González-deSantos, L. M., Estévez-Ventosa, X., Tomás, R., Alejano, L. R., et al. (2019). A multi-approach rockfall hazard assessment on a weathered granite natural rock slope. Landslides 16, 2005–2015. doi:10.1007/s10346-019-01208-5
Podlozhnyuk, A., Pirker, S., and Kloss, C. (2017). Efficient implementation of superquadric particles in discrete element method within an open-source framework. Comput. Part. Mech. 4, 101–118. doi:10.1007/s40571-016-0131-6
Portal, R. J. F., Dias, J. M. P., and Sousa, L. A. G. (2010). Contact detection between convex superquadric surfaces. Archive Mech. Eng. LVII (2), 165–186. doi:10.2478/v10180-010-0009-8
Qiu, H. Z., Chen, X. Q., Wu, Q. H., Wang, R. C., Zhao, W. Y., Qian, K. J., et al. (2020). Deformation mechanism and collapse treatment of the rock surrounding a shallow tunnel based on on-site monitoring. J. Mt. Sci. 17 (12), 2897–2914. doi:10.1007/s11629-020-6026-2
Rao, P., Wu, Z., and Cui, J. (2022). Analysis of deformation of adjacent buried pipeline under rockfall impact load. Geotech. Geol. Eng. (Dordr). 40, 1463–1474. doi:10.1007/s10706-021-01975-w
Roethlin, C., Calvetti, F., Yamaguchi, S., and Vogel, T. (2013). “Numerical simulation of rockfall impact on a rigid reinforced concrete slab with a cushion layer,” in Fourth international workshop on performance, protection and strengthening of structures, Mysore, India, August 26-27, 2013. doi:10.3929/ethz-a-010061763
Shen, W. G., Zhao, T., Dai, F., Jiang, M. J., and Zhou, G. D. (2019). DEM analyses of rock block shape effect on the response of rockfall impact against a soil buffering layer. Eng. Geol. 249, 60–70. doi:10.1016/j.enggeo.2018.12.011
Shen, W. G., Zhao, T., and Dai, F. (2021). Influence of particle size on the buffering efficiency of soil cushion layer against rockfall impact. Nat. Hazards (Dordr). 108, 1469–1488. doi:10.1007/s11069-021-04741-6
Su, Y. C., Cui, Y. F., Ng, C. W. W., Choi, C. E., and Kwan, J. S. H. (2019). Effects of particle size and cushioning thickness on the performance of rock-filled gabions used in protection against boulder impact. Can. Geotech. J. 56, 198–207. doi:10.1139/cgj-2017-0370
Tao, Z. G., Zhu, C., He, M. C., Pang, S. H., Xie, H., and Lai, H. (2017). Test of V shaped groove structure against rockfall based on orthogonal design. J. China Coal Soc. 42 (09), 2307–2315. doi:10.13225/j.cnki.jccs.2016.1688
Wang, S. Q., and Ji, S. Y. (2018). Discrete element analysis of buffering capacity of non-spherical granular materials based on super-quadric method. Acta Phys. Sin. 67 (9), 094501. doi:10.7498/aps.67.20172549
Wellmann, C., Lillie, C., and Wriggers, P. (2008). A contact detection algorithm for superellipsoids based on the common-normal concept. Eng. Comput. Swans. 25 (5), 432–442. doi:10.1108/02644400810881374
Zhang, L. Q., Yang, Z. F., and Xu, B. (2004). Rock falls and rock fall hazards. J. Eng. Geol. 12 (3), 225–231.
Zhang, G. C., Tang, H. M., Xiang, X., Karakus, M., and Wu, J. P. (2015a). Theoretical study of rockfall impacts based on logistic curves. Int. J. Rock Mech. Min. Sci. 78, 133–143. doi:10.1016/j.ijrmms.2015.06.001
Zhang, J., Liang, Z., Han, C. J., and Zhang, H. (2015b). Buckling behaviour analysis of a buried steel pipeline in rock stratum impacted by a rockfall. Eng. Fail. Anal. 58 (1), 281–294. doi:10.1016/j.engfailanal.2015.09.009
Zhang, L. R., Lambert, S., and Nicot, F. (2017). Discrete dynamic modelling of the mechanical behaviour of a granular soil. Int. J. Impact Eng. 103, 76–89. doi:10.1016/j.ijimpeng.2017.01.009
Zhou, J. R., Wei, J., Yang, T. H., Zhang, P. H., Liu, F. Y., Chen, J. K., et al. (2021). Seepage channel development in the crown pillar: insights from induced microseismicity. Int. J. Rock Mech. Min. Sci. 145, 104851. doi:10.1016/j.ijrmms.2021.104851
Keywords: rockfall, impact, discrete element method, kinetic energy, soil cushion layer
Citation: Qiu H, Yuan J, Han P, Yang M, Huang W, Fang X and Li Y (2022) DEM analysis of micromechanics and buffering capacity of superquadric mixture granular materials under impact load. Front. Earth Sci. 10:959930. doi: 10.3389/feart.2022.959930
Received: 02 June 2022; Accepted: 05 July 2022;
Published: 12 August 2022.
Edited by:
Jingren Zhou, Sichuan University, ChinaReviewed by:
Qunlei Zhang, North China University of Water Resources and Electric Power, ChinaWeigang Shen, Southwest Jiaotong University, China
Copyright © 2022 Qiu, Yuan, Han, Yang, Huang, Fang and Li. This is an open-access article distributed under the terms of the Creative Commons Attribution License (CC BY). The use, distribution or reproduction in other forums is permitted, provided the original author(s) and the copyright owner(s) are credited and that the original publication in this journal is cited, in accordance with accepted academic practice. No use, distribution or reproduction is permitted which does not comply with these terms.
*Correspondence: Jintao Yuan, 2758714200@qq.com