Increased populations will be exposed to the dangerous precipitation extremes across China in the future
 Huiwen Xu
 Huopo Chen
 Huijun Wang
- 1Nansen-Zhu International Research Centre, Institute of Atmospheric Physics, Chinese Academy of Sciences, Beijing, China
- 2University of Chinese Academy of Sciences, Beijing, China
- 3Collaborative Innovation Center on Forecast and Evaluation of Meteorological Disasters, Nanjing University for Information Science and Technology, Nanjing, China
This study investigates the future changes in dangerous precipitation extremes with multiyear return periods and the population exposure across China at the 1.5–4°C warming levels via the latest simulations from the Coupled Model Intercomparison Project Phase 6 (CMIP6). The results show that the simulations project more frequent dangerous precipitation extremes across China under the warmer climate regardless of the shared socioeconomic pathway (SSP), with more substantial occurrence increases at the high warming levels. Consequently, the population exposure to dangerous precipitation extremes is anticipated to increase persistently in most regions of China except for some parts of northwestern China and the Tibetan Plateau. For the events estimated to occur once every 10 years, the 1.5, 2.0, 3.0, and 4.0°C warming relative to the current state will result in approximately 29.9, 47.8, 72.9, and 84.3% increases in the aggregated population exposure over China under the SSP5-8.5 scenario, respectively. However, the exposure change is somewhat subject to the emission scenarios, with larger proportional increases under the regional-rivalry scenario of SSP3-7.0 compared to the fossil-fueled development scenario of SSP5-8.5. The increased exposure under all the scenarios is primarily attributed to the climate change factor, and the population change and their interaction component make a minor contribution. Furthermore, compared to the 2.0°C warmer climate, the 0.5°C less warming under the 1.5°C climate can trigger remarkable decreases of 16.5–20.8% for exposure to once-in-decade events over China. Additionally, the changes in the occurrence and exposure are much larger for the rarer events. Hence, our analyses indicate that limiting warming to 1.5°C is beneficial to reducing the impacts associated with precipitation extremes across China, particularly for the more extreme events.
Introduction
Global warming has been a great challenge to the international community over the past decades. The Sixth Assessment Report (AR6) of the Intergovernmental Panel on Climate Change (IPCC) documents that human activity has unequivocally warmed the atmosphere, ocean and land. With anthropogenic climate change, climate extremes including extreme heat events, heavy precipitation and agricultural droughts have significantly increased in both frequency and intensity (IPCC, 2021). Many unprecedented extreme events surprise the society, such as the 2010 heat waves in Russia (Barriopedro et al., 2011), the 2015 European drought in summer (Ionita et al., 2017), and the heavy precipitation from Hurricane Harvey in August 2017 (Risser and Wehner, 2017; Van Oldenborgh et al., 2017). China, a populous region regulated by the East Asian monsoon and with diverse terrain, is particularly vulnerable to climate extremes. For instance, in 2018, the natural disasters caused by weather and climate extremes in China contributed to direct economic losses of about 264.5 billion yuan, along with 13.5 million affected population (Wang et al., 2021). Accounting for their destructive consequences, there is always a significant societal concern that how climate extremes in China change with global warming.
To reduce the climate change impact, the Paris Agreement, successfully signed in December 2015, pledges to limit global warming to well less than 2.0°C and set an aspirational restriction of 1.5°C above preindustrial periods. Following this, the scientific community emerges a focus to explore the changes in climate extremes at the specific warming target, such as 1.5°C, 2.0°C, and higher (Huang et al., 2017; Chen and Sun, 2018; Wu et al., 2020). Some studies have indicated that compared to the 1.5°C warming level, the additional warming of 0.5°C under the 2.0°C warmer climate will induce substantial increases in extreme high-temperature events across China (Wang et al., 2015; Chen and Sun, 2018; Wang et al., 2019; Zhou et al., 2020; Xie et al., 2021; Zhang et al., 2021; Hu et al., 2022). Chen and Sun (2019) have revealed that drought occurrence is estimated to increase by 9% in response to the 0.5°C additional warming, with extreme droughts increasing by 8%. Additionally, precipitation extremes are also projected to intensify with continuous warming over China (Jiang et al., 2020; Wu et al., 2020; Zhang et al., 2020; Xu et al., 2021).
Among these hazards, precipitation extreme is one of the most frequent disasters in China, responsible for massive socio-economic losses and mortalities (Zhai et al., 2005; Michaelides, 2013; Selvey et al., 2014). There are two typical methods to represent the precipitation extremes. One is to utilize the indices defined by the Expert Team on Climate Change Detection and Indices (ETCCDI), usually depicting the frequent climate events in 1 year. The other method is to implement the Generalized Extreme Value (GEV) distribution to obtain more extreme statistics, meaning the rare precipitation extremes with return periods (Kharin et al., 2007; Kim et al., 2020). Such rare extremes will induce more adverse consequences on the environment, human health and society (Zhang et al., 2017). Moreover, evidence has shown that human-induced warming tends to trigger larger changes in frequency and intensity of such dangerous precipitation extremes in comparison to the relatively mild events occurring per year globally (Kharin et al., 2018; Li et al., 2019; Li et al., 2021). Current studies are dedicated to understanding the changes in precipitation extremes represented by ETCCDI indices (Dong and Sun, 2018; Wu et al., 2020), whereas potential changes in the dangerous precipitation extremes with different return periods over China have received less attention.
Climate change risks result from the complex interactions of hazards, exposure, and vulnerability of society to the hazards (Leonard et al., 2013; Jones et al., 2018). Hence, other than the anticipating changes in the disasters themselves, understanding the changes in exposure to disasters is also essential for effective adaptation and mitigation of climate change risks. Previous studies have confirmed that the continuing global warming will exacerbate exposure to extreme heat events (Jones et al., 2015; Matthews et al., 2017; Rohat et al., 2019; Iyakaremye et al., 2021; Xie et al., 2022). Instead of 2.0°C, limiting the global mean temperature increase to 1.5°C can reduce the exposure to these heat extremes (Harrington and Otto, 2018; Yu et al., 2020). Chen and Sun (2019) have reported that the exposure to drought in China is on the rise under a warming climate, particularly for extreme drought. For precipitation extremes, global aggregate population exposure to precipitation extremes is projected to increase by over 50% by the end of this century (Chen and Sun, 2021). However, rarer studies focus on the population changes exposed to precipitation extremes over China, especially the dangerous events with return periods mentioned above.
Hence, the main objective of this study is to deal with these issues: 1) Compared to the current climate, how do the dangerous precipitation extremes and associated population exposure over China change at the 1.5–4.0°C warming levels under different shared socioeconomic pathways (SSPs) via the latest simulations from Coupled Model Intercomparison Project Phase 6 (CMIP6)? 2) To what extent can the population exposure to dangerous precipitation extremes be avoided if global warming is limited to 1.5°C? 3) What are the relative roles of changes in climate and population effect in exposure?
Data and methods
Datasets
The daily precipitation and monthly temperature outputs from the CMP6 models are employed in this study, including the historical simulations for the period of 1950–2014 and future projections under the four SSPs spanning from 2015–2100. These data can be acquired from the website (https://esgf-node.llnl.gov/search/cmip6/). The SSPs are the new future forcing pathways related to societal development, describing the alternative evolutions of demographics, technology, economics and other societal factors (Jones and O’Neill, 2016). Given the availability of models, we use future simulations from 23, 24, 21 and 24 CMIP6 models from SSP1-2.6, SSP2-4.5, SSP3-7.0 and SSP5-8.5 scenarios, respectively (Supplementary Table S1). All the models are based on the first member (r1i1p1f1). The temperature outputs are calculated on their native girds for obtaining the periods achieving the warming targets, while the bilinear interpolation method is conducted to interpolate the precipitation simulations onto 1.5° × 1.5° grids via Climate Data Operator software. Moreover, we analyze the two extreme precipitation indices of maximum 1-day precipitation amount (RX1day) and the maximum 5-day precipitation amount (RX5day) calculated from the CMIP6 outputs, which are associated with the potential flood risks (Sillmann et al., 2013).
For the population exposure analysis, we apply the spatially explicit population dataset under different SSPs at a native resolution of 0.125° × 0.125°developed by Jones and O’Neill (2016). The population scenarios are in accordance with the SSPs for climate change studies, bearing the same socioeconomic assumptions. We also compare this population projection with reasonable spatial distribution to the other dataset from Inter-Sectoral Impact Model Intercomparison Project (ISI-MIP) with uniform national growth rates to justify the population data (Supplementary Figure S1).
Definition of the different warming levels
The 1.5, 2.0, 3.0, and 4.0°C global warming levels are defined as the global mean temperature increases by 1.5, 2.0, 3.0, and 4.0°C above the preindustrial level of 1861–1890. To remove the impacts of uncertainty from interannual variability on determining the warming levels, we applied the 9-year running average to the time series of the global mean temperature for individual models (Supplementary Figure S2). The 1.5–4.0°C warming periods are hereafter estimated as the 9-year windows centering on the years when the global mean temperature exceeds the corresponding warming levels for the first time under different scenarios (Supplementary Table S1). The derived centered years of the warming periods are generally similar to the results from previous studies (Zhang et al., 2018; Zhu et al., 2021), and the different centered years are attributed to the different increasing magnitudes of the global mean temperature over the coming century among the individual models and emission scenarios. Future changes under the warming climate are calculated with respect to the historical period of 1995–2014 and are first computed for individual models to obtain multi-model median ensembles (MMEs). Additionally, because the temperature of most models under SSP1-2.6 (SSP2-4.5) fails to reach the 3.0 and 4.0°C (4.0°C) warming target, the corresponding changes are not calculated. We also repeated the 21-year running average to the original time series and found little difference from the above centered years of the time windows, indicating the robustness of the defining approach of warming levels.
Dangerous precipitation extremes
RX1day and RX5day on each grid for individual models for the period of 1950–2014 were first fitted by the GEV method, deriving the cumulative density function (CDF) for the GEV analysis (Kharin et al., 2007). CDF corresponding to a specific probability p is then inverted to the quantile function of GEV, as follows.
Here, location parameter µ, scale parameter σ, and shape parameter k are estimated using a maximum likelihood method. Then we can derive the return values from the quantile function of GEV at each grid point (Eq. 1). For instance, the 10-year (20-year) return value is calculated when p = 0.9 (0.95). As shown in Figure 1, the return values over China decrease from southeast to northwest and are generally larger for the extremes with the longer return periods across China. The dangerous precipitation extremes are thus defined as the events when the RX1day and RX5day exceed their historical return values. Dangerous precipitation extremes with 10-year return period (i.e., events estimated to occur once in every 10 years) are referred to as 10-year events in the following. This is also suitable for 20-year and 50-year events.
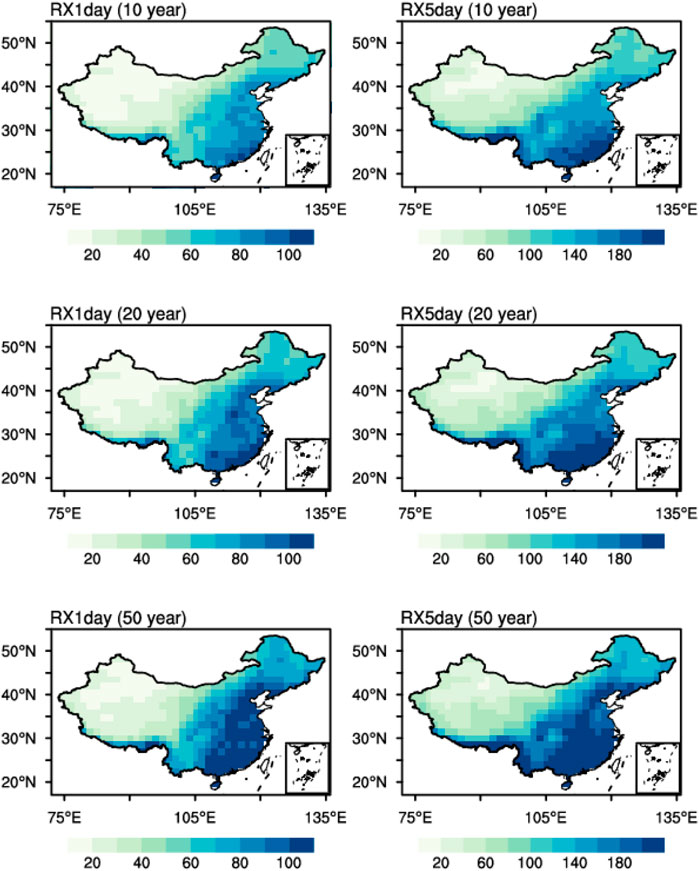
FIGURE 1. Estimated return values for the extreme events (RX1day and RX5day) that occur once in 10, 20, and 50 years fitted by the GEV analysis for the period of 1950–2014. Units: mm.
In addition, the probability rate (PR) for the occurrence of dangerous precipitation extremes is also discussed here that is calculated as the ratio of the occurrence probability under the warmer climate to the corresponding probability in the base period of 1995–2014.
Population exposure calculation
Before the exposure investigation, we quantified the population changes as the aggregate population under the warmer climate minus the aggregate population in the baseline of 2000. The relative population changes at different warming levels under different scenarios are expressed as
where
To calculate the population exposure to dangerous precipitation extremes, the number of people exposed to the hazard, we multiplied the frequency of dangerous precipitation extremes by the population at each grid point (Jones et al., 2015). Here, the quantified population exposure is based on the population from the baseline of 2000, and the future exposure under SSP1, SSP2, SSP3 and SSP5 is combined with the corresponding future scenarios of precipitation extreme simulations of SSP1-2.6, SSP2-4.5, SSP3-7.0 and SSP5-8.5 scenarios, respectively. The exposure changes at different warming levels relative to the baseline are estimated as follows:
where
Ultimately, we divide the changes in population exposure into three components according to Jones et al. (2015).
In Eq. 4,
Results
Changes in precipitation extremes over China with global warming
Previous studies have shown that CMIP6 models can reasonably reproduce the basic features of precipitation extremes over China (Xu et al., 2021). Accordingly, we project the changes in precipitation extremes averaged over China during future decades based on the CMIP6 simulations (Figure 2). The MMEs of RX1day and RX5day are expected to significantly increase in the coming century relative to the current climate regardless of the scenarios, but with some differences among the four scenarios. The increase of precipitation extremes over China intensifies sequentially from low emissions of SSP1-2.6 to unconstrained emissions of SSP5-8.5, implying the vital role of societal decisions in the future increases for precipitation extremes (O'Neill et al., 2016; Riahi et al., 2017). In detail, the increase under SSP1-2.6 and SSP2-4.5 tend to be small after 2060, whereas with a clear increase under SSP3-7.0 and SSP5-8.5 scenarios. Additionally, for all scenarios, the interquartile model spreads representing the uncertainties of the future projections are also observed to be larger with time.
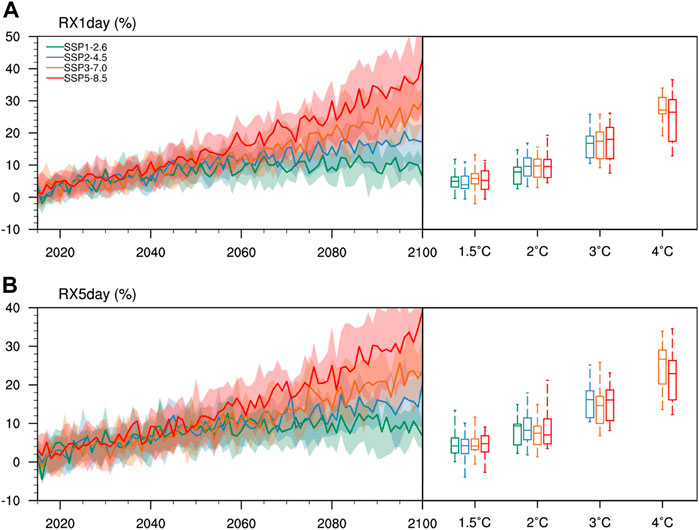
FIGURE 2. Future changes in the areal-weighted mean (A) RX1day and (B) RX5day under different emission scenarios relative to the reference period of 1995–2014. The solid lines in the left panel denote the MMEs and the shadings represent the projection uncertainty ranging from 25th to 75th quantiles. Box-and-whisker plots on the right panels depict the changes in precipitation extremes averaged over China under the 1.5, 2.0, 3.0, and 4.0°C warmer climate with respect to the present day. Herein, the solid lines in the boxes denote the MMEs, and the bounds of the boxes denote the 25th and 75th percentiles of the model simulations. The whiskers outside the boxes range represent all the inter-model ranges. Units: %.
The regional mean changes in precipitation extremes over China at the 1.5–4.0°C warming levels with respect to the current climate are further examined (Figure 2). In line with the previous model outputs (Zhang et al., 2020), the CMIP6 simulations project more intense precipitation extremes at higher warming levels. Specifically, RX1day is reported to increase by 5.2, 9.6, 18.0, and 26.4% when the global warming reaches 1.5, 2.0, 3.0, and 4.0°C under SSP5-8.5 scenario, respectively, as well as the increases of 4.8, 7.1, 16.1, and 22.9% for RX5day. Note that the changes in RX1day and RX5day at the four warming levels from SSP5-8.5 scenario are similar to those from the other scenarios, suggesting the independence of changes to these emission scenarios. Spatially, increases for the two precipitation indices are dominant in almost all the regions of China in a warmer world, except for sporadic regions such as some parts of Southwest China and Northeast China experiencing decreases in a 1.5°C warmer world (Supplementary Figure S3).
Considering social impacts, dangerous precipitation extremes with return periods of 10–50 years are usually record-shattering and cause more irreversible damages (Zwiers et al., 2011). The changes in occurrence probability of dangerous precipitation extremes for RX1day at different warming levels are thus explored (Figure 3). The results show little difference among the emission scenarios at the same warming levels. Agreeing with the changes in precipitation extremes analyzed above, PRs of the dangerous precipitation extremes are also reported to increase with continued global warming, indicating more frequent precipitation extremes over China. For instance, the occurring probability of 20-year events under the 1.5–4.0°C warming climate increases approximately to a factor of 1.4, 1.8, 2.5, and 3.5 of that in the reference period. This indicates that the areal-mean precipitation extreme events that are expected to occur once every 20 years are expected to happen once in 14, 11, 8, and 6 years on average in the 1.5–4.0°C warmer world, respectively. Another notable feature is that PRs increase more significantly responding to the global warming with the return period extending, particularly for the high warming target. Namely, the rarer precipitation extremes show much greater increases at the given warming level. Compared to the relatively slight increases for 10-year events from the PR of 1.3 at the 1.5°C warming target to PR of 2.8 at the 4.0°C warming target, the PRs for 50-year events increase more substantially from 1.7 to 5.0 in response to global warming. Moreover, the model spreads are reported to be larger with the return periods extending. Dangerous precipitation extremes for RX5day show similar changing characteristics with RX1day.
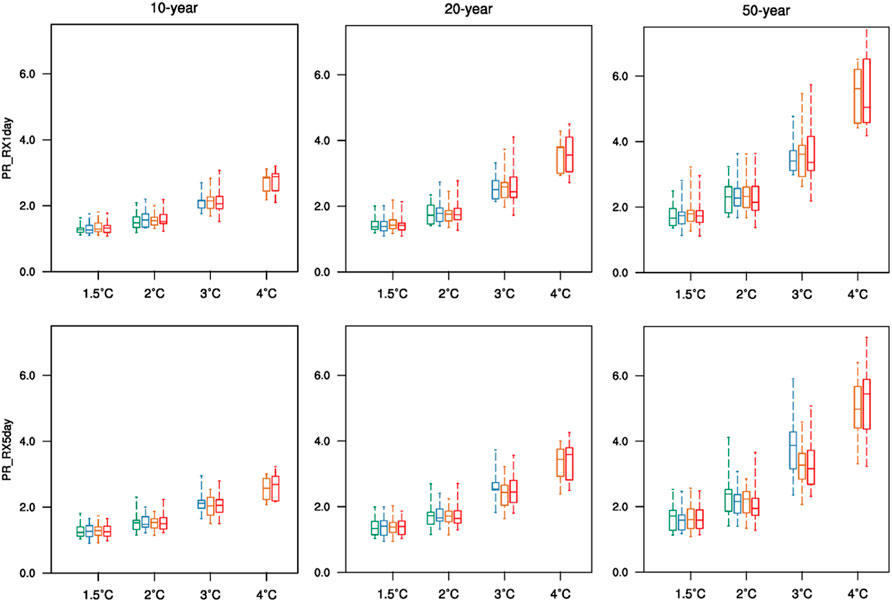
FIGURE 3. Box-and-whisker plots of the PRs of occurrence of 10-year, 20-year, and 50-year events averaged over China at the 1.5–4.0°C warming level under different scenarios. The green, blue, orange, and red boxes denote the PRs under the SSP1-2.6, SSP2-4.5, SSP3-7.0 and SSP5-8.5 scenarios, respectively.
In terms of the spatial patterns, we first consider the features of the PRs of 10-year RX1day and RX5day at the 1.5–4.0°C warming levels from SSP5-8.5 scenario. Before this, we divide China into eight subregions referring to Jiang et al., 2020 for facilitating analysis as marked in Figure 4. Almost all the regions across China experience increasing occurring probabilities (PR larger than 1) of 10-year events at the 1.5°C warming target with respect to present-day (Figure 4). The remarkable increase is mainly centered in some regions of the Tibet Plateau and southeastern China, especially for high warming scenarios. The PRs of the Tibet Plateau are even roughly larger than 3, i.e., more than twofold increases for the occurrence of 10-year events at the 4.0°C warming levels as opposed to the present day. Furthermore, the occurring probability for more intense events, such as the 20-year events, present similar change patterns, but with larger magnitudes at the same warming level (Supplementary Figure S4). Likewise, these changes are also insensitive to the warming levels from different forcing scenarios.
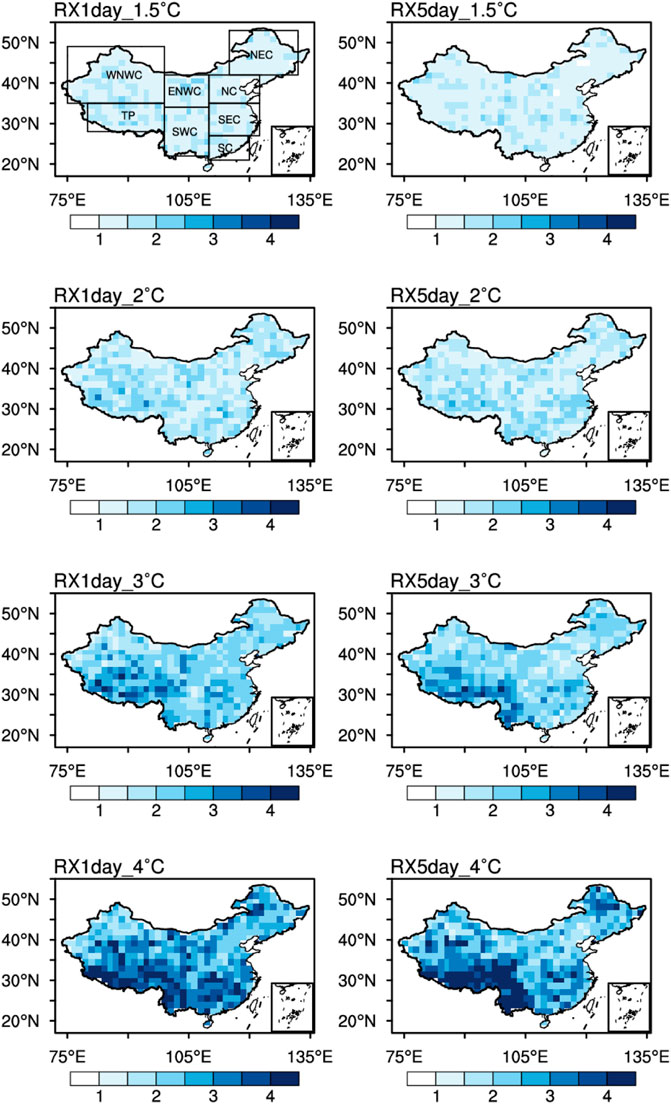
FIGURE 4. Spatial patterns for the PRs of the occurrence of 10-year RX1day and RX5day over China under the 1.5–4.0°C warmer climate under the SSP5-8.5 scenario with respect to the current climate (1995–2014). The occurrence probability of precipitation extremes is expected to increase if the PR is larger than 1.0.
Changes in population exposure over China with global warming
During the past decades, precipitation extreme events frequently hit China, posing a serious threat to human society and leaving numerous people displaced, injured, missing and even dead (Wang et al., 2012). Therefore, it is imperative to evaluate the population exposed to this natural hazard in China.
Apart from the above changing extreme events, exposure to the hazards also depends on changes in the number and spatial pattern of the human population (Jones et al., 2015). We thus project the aggregate population growth and the geographical distribution across China in the coming future under different scenarios (Supplementary Figures S1, S5). The total population in China is projected to peak around the year 2030 under the SSP2 and SSP3 scenarios and around the year 2020 under the scenarios of SSP1, SSP4 and SSP5, subsequently decreasing (Supplementary Figure S1). The population reduction from SSP1, SSP4 and SSP5 is more rapid with respect to that from the SSP3 scenario, along with a relatively moderate change in the population of the SSP2 scenario. By the end of the 21st century, the population is projected to decline throughout China (Supplementary Figure S5). Consistent with the demographic structure in the baseline, the dense population is still mainly concentrated in eastern China, while the regions of northwestern China and the Tibetan Plateau have a low population density by the end of the 21st century. Moreover, the population decline also varies across regions. The Tibetan Plateau is anticipated to experience the largest decrease, along with the slight proportional reduction in eastern China (Supplementary Figures S5D,E).
In the following, we further investigate the population exposure to the dangerous precipitation extremes with 10-year return periods for RX1day and RX5day over China under different warming targets from the SSP5-8.5 scenario (Figure 5). Clearly, the spatial structures of population exposure are similar to those of the population in China, with notable regional variations. In the base period of 2000, regions with a dense population including eastern China and some regions of southwestern China, such as the Sichuan Basin, have a high population exposure to dangerous precipitation extremes. Conversely, the low exposure is mainly concentrated over the Tibetan Plateau and northwestern China, also coinciding with regions sparsely populated. With the global mean temperature increasing, the future basic feature of population exposure is similar to that in the base period, but with more widespread exposure in high-exposure areas and the lower population exposed to precipitation extremes in originally low-exposure areas. This regional difference of population changes exposed to precipitation extremes may be associated with the discrepancy of future population changes in China.
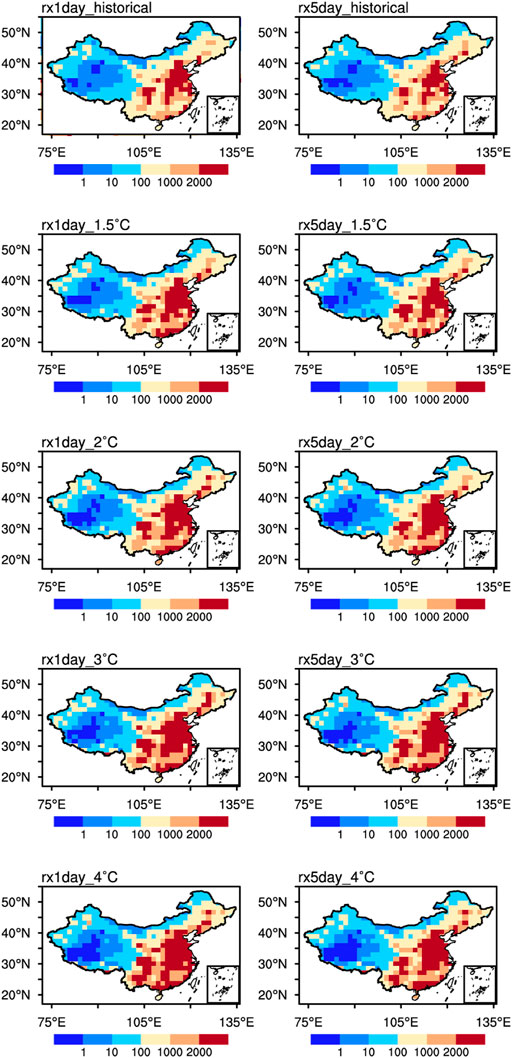
FIGURE 5. Spatial patterns of the population exposure to the 10-year events over China in the base year of 2000 (the first row) and in response to the 1.5–4.0°C warming under the SSP5-8.5 scenario (the last four rows). Units: 104 person-days.
Figure 6 maps the changes in population exposure to precipitation extremes for 10-year RX1day and RX5day events over China in the warmer world under SSP5-8.5 scenario against the base period. The exposure presents persistent increases in most regions of China in response to the continued global warming, but with spatial heterogeneity for the increasing magnitude. Notably, under the 4.0°C warmer climate that is estimated to occur around 2080 under SSP5-8.5 scenarios, the exposure exhibits widespread and remarkable increases over most regions of eastern and southern China with a high model agreement, increasing by over 60%. This indicates that China will experience a larger population exposed to the dangerous precipitation extremes under the future warmer climate. However, the exposure is projected to decline over some grids of northwestern China and the Tibetan Plateau as a consequence of the global mean temperature increases, and the declines over these regions are reported to strengthen and enlarge with warming. The 4.0°C global warming will result in striking decreases in population exposure of more than 60% over the Tibetan Plateau with a high model agreement. This may be attributed to the decreasing population in these areas.
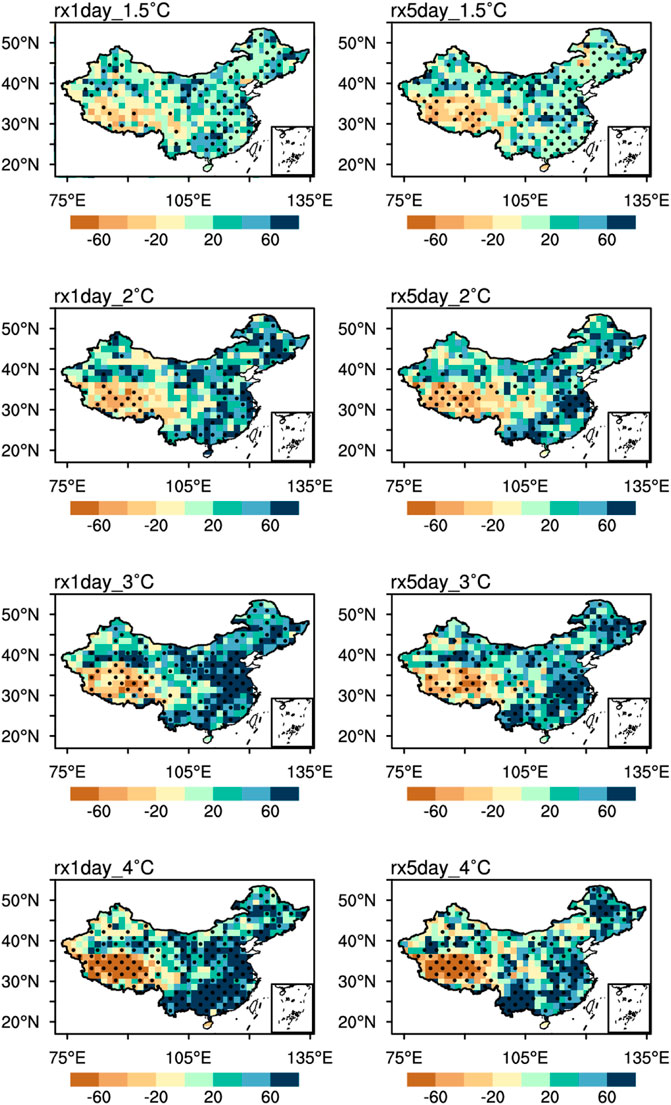
FIGURE 6. Future changes in population exposure to the 10-year events in response to the 1.5–4.0°C warming under the SSP5-8.5 scenario relative to the present day (1995–2014). The stippling is applied in regions where over 2/3 of the models are in accordance with the signs of MME changes. Units: %.
Additionally, changes in population exposure to the 20-year events bear similar geographical patterns to those for the 10-year events under a warmer climate, but with relatively large increasing magnitudes in exposure-increasing areas, particularly for the high warming levels (Supplementary Figure S6). For the other emission scenarios, the exposure distributions resemble those under SSP5-8.5, whereas there are scenario exceptions. When choosing the regional-rivalry scenario of SSP3-7.0, the increases of population exposure are expected to remarkably enlarge and enhance across China with the higher model agreement compared to the fossil-fueled development scenario of SSP5-8.5 (Supplementary Figure S7). Also distinguished from SSP5-8.5 scenario, the decreases are reported to shrink and weaken with warming under SSP3-7.0 scenario, and also with a lower model agreement. Specifically, the decreases can still be observed over the Tibetan Plateau at the 1.5°C warming level, but are confined to a smaller region and weaker as opposed to the same levels under SSP5-8.5. In the 2–4.0°C warmer climates, pronounced increases for population exposure were predominant almost everywhere across China and the decreases are estimated to nearly vanish under SSP3-7.0 scenario. This suggests the important role of societal decisions in future changes in population exposure to the dangerous precipitation extremes (Jones and O’Neill, 2016).
Figure 7 comprehensively summarizes the areal mean exposure changes to dangerous precipitation extremes with return periods ranging from 10 to 50 years for RX1day and RX5day at the four warming levels from different scenarios. We prioritize illustrating the results from SSP5-8.5 scenario. Given the similar results from RX1day and RX5day, our following analysis is mainly based on RX1day. Overall, future warming heightens the aggregated population exposure to precipitation extremes. Considering the 20-year events first, the exposure changes increase with the global mean temperature increasing. The warming against the current state to 1.5–4.0°C warmer climate leads to about 34.0% (25.8–74.9%), 60.1% (49.7–101.2%), 113.0% (80.0–129.2%), and 150.3% (95.5–168.4%) increases in the population exposure on average, respectively. Similar tendencies can be observed in exposure for the 10-year events, whereas the increasing magnitudes are smaller than those of the 20-year events at the same warming levels, with respective increases of approximately 29.9% (23.8–62.7%), 47.8% (36.8–79.8%), 72.9% (49.3–93.3%), and 84.3% (58.8–99.9%). In contrast, changes in the 50-year events outpace changes in more moderate events such as the 20-year events under the continued global warming, with the evidently larger increasing magnitudes at the same warming levels. Correspondingly, similar to changes in occurring probability of the dangerous precipitation extremes, the relative population changes exposed to precipitation extremes are also larger for the rarer and more extreme events. In addition, the interquartile model uncertainties are larger for the rarer events.
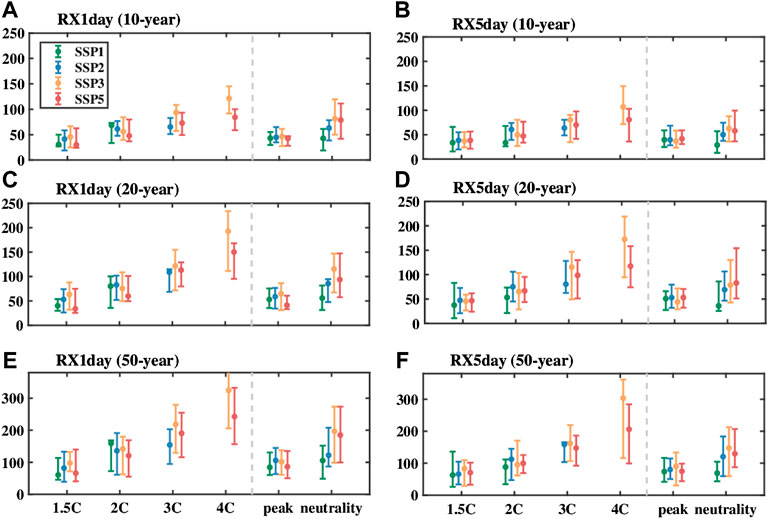
FIGURE 7. Projected changes in areal-mean aggregated population exposure to (A), (B) 10-year, (C), (D) 20-year and (E), (F) 50-year RX1day and RX5day over China under the 1.5–4.0°C warmer climate as well as the carbon peak (2030) and neutrality periods (2060) under all the four SSPs. The data points and error bars represent the MMEs and interquartile model spreads, respectively. Units: %.
Differing from the changes in occurring probability, the areal weighted average exposure changes are somewhat sensitive to the selected forcing scenarios, embodying the role of demographic change in the exposure. For SSP1-2.6 and SSP2-4.5 scenarios, the exposure also increases consistently with the future warming, but the differences from changes under SSP5-8.5 scenario are not very clear owning to the limited models reaching the high warming thresholds. However, it is evident that compared to SSP5-8.5 scenario, the areal mean population exposure presents a larger proportional increase at the same warming levels under SSP3-7.0 scenario, particularly for the high warming targets, regardless of the return periods of precipitation extremes. For instance, the 4.0°C warming with respect to the current climate will drive an increase of over 300% in the exposure to the 50-year RX1day on average under SSP3-7.0 scenario, about 80% more than the changes under SSP5-8.5 scenario. As a consequence, population exposure changes are subject to the chosen emission scenarios, implying the importance of societal decisions. Briefly, the spatial patterns of exposure changes are in good agreement with the areal averages of exposure changes, confirming the robustness of our findings in this study.
We further estimate the avoided impacts in terms of the population exposure if the global mean temperature increases to 1.5°C instead of 2.0°C (Figure 8). The aggregated mean indicates that a 0.5°C reduced warming is projected to trigger more decreases of about 16.7, 20.8, 16.5, and 16.9% for exposure to the 10-year RX1day events under SSP1-2.6, SSP2-4.5, SSP3-7.0, and SSP5-8.5 scenarios, respectively. For more intense events, including the 20-year and 50-year RX1day events, the population exposure decreases more remarkably in response to the 0.5°C reduced warming under all the emission scenarios. The cases are also true for RX5day. Notably, the rarer events also bear the larger model uncertainty for the avoided changes.
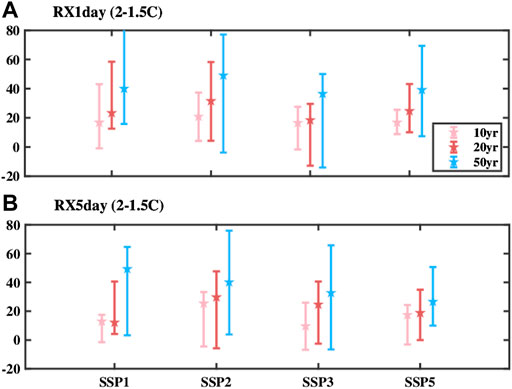
FIGURE 8. The regional mean reduced population exposure to 10-year, 20-year and 50-year (A) RX1day and (B) RX5day under the 1.5°C warmer climate instead of the 2.0°C warmer climate. The star points and error bars represent the MMEs and interquartile model spreads, respectively. Units: %.
Roles of climate and population changes in exposure
To assess the role of the factors to the changes in population exposure to the dangerous precipitation extremes over China, we further decompose the aggregate exposure change into three elements, i.e., the population change component, the climate change component, and their interaction effect. Figure 9 illustrates the contributions of the three components to the exposure changes for the 10-year events under the future warming climate from the four SSP scenarios. RX1day and RX5day also yield similar outcomes, thus choosing RX1day for analyzing. Under SSP5-8.5 scenario, increases in population exposure are mainly sourced from the climate change, followed by the relatively minor contribution from the population change and their interaction effect. If the global mean temperature increases by 1.5°C, pronounced increases are expected in exposure for the 10-year events with about 2.1 million person-days. Herein, the climate driver contributes most to the increase of 1.4 million person-days, accounting for 67% of the total exposure increase, whereas the minor attributable increases to population change and their effects only account for 28 and 5%, respectively (Figure 9 and Supplementary Figure S8). With the warming level increasing, the contribution from climate change shows a dramatic increase, while the effects of population change and their interaction decreases, making an increasingly negative contribution to the exposure increases. At the 4.0°C warming levels, the climate change exerts a more pronounced effect on the increased exposure compared to the lower warming levels, adding 12.1 million person-days, but counteracted by the negative effect of population change and the interaction component of 6.1 million person-days totally. Consequently, the exposure increases by about 6.0 million person-days, just approximately 1.1 million person-days larger than those at the 3.0°C warming levels owning to the important offsetting role of the population change and interaction components.
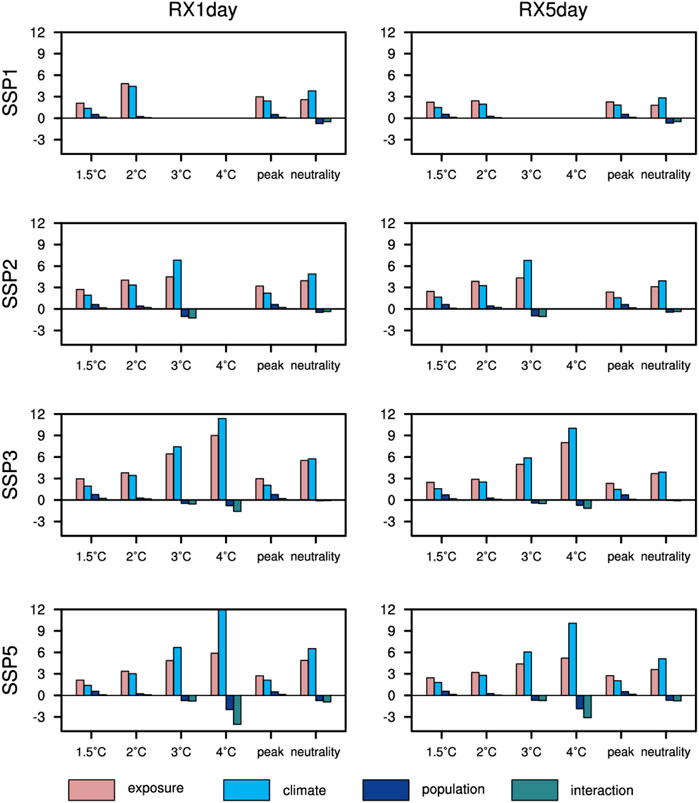
FIGURE 9. Contribution from climate change, population change, and their interaction effect on the exposure change in response to the 1.5–4.0°C warming as well as the carbon peak (2030) and neutrality periods (2060) under all the four SSPs. Units: 106 person-days.
Concerning the contribution rate of the three components, under the 1.5°C warmer climate under SSP5-8.5 scenario, the climate change dominates the exposure change, but the population contribution is also clear due to the relatively small risk of precipitation extremes at the limited warming target (Supplementary Figure S8). From 2.0 to 4.0°C warming, the contribution rate of the climate change component exhibits a progressive decrease, declining from a key dominance of 91–67%. Simultaneously, the contribution portions of the combined negative effects from population and interaction components are estimated to increase from 9 to 33%, but they still take a back seat to the climate driver.
Briefly, at the low warming level, the combined positive effects from the three factors drive the increased exposure, dominated by the climate change. Meanwhile, at the high warming level, the increased population exposed to precipitation extremes can be also largely attributed to the climate change factor but partially offset by the negative contribution from the population and interaction components. Additionally, under other scenarios, the change in population exposure is also heavily influenced by climate change, followed by the demographic change and their interaction effects (Figure 9). Particularly, compared to SSP5-8.5 scenario, the demographic change plays a more minor negative role in the increased exposure owing to the slow population decline under SSP3-7.0 scenario. Overall, the similar features between emission scenarios enhance the credibility of the outcomes.
Changes in exposure during carbon peak and neutrality periods
As part of the Paris Agreement, China aims to peak its carbon emissions by 2030 and reach carbon neutrality by 2060 to combat climate change (Guan et al., 2018; Liu Z. et al., 2021). The population changes exposed to the dangerous precipitation extremes over China during the two periods under different emission scenarios are thus of specific concern. By 2030, a similar pattern of the exposure changes can be reported with the changes at the 1.5°C warming levels, with the increases prevailing over eastern China and decreases over some parts of western China, especially over the Tibetan Plateau (Supplementary Figure S9). The areal means for all the scenarios show similar overall increases (Figure 7). Under the further warming induced by the continued emissions of the greenhouse gases, dangerous precipitation extremes are more influential on the population over China by 2060, with the exposure increases enlarging over most of the regions with a high model agreement, except for the Tibetan Plateau. The areal-mean increased exposure by 2060 is comparable to the increases induced by 2.0–3.0°C global warming, especially pronounced under the high emission scenarios of SSP3-7.0 and SSP5-8.5 (Figure 7). Such findings emphasize the crucial role that continued emissions of greenhouse gases play in contributing to the precipitation-related risks over China, and highlight the necessity of conducting the regulation policies to reduce the carbon emissions.
Conclusion and discussion
This study projects the future changes in dangerous precipitation extremes and the population exposure to these hazards over China at 1.5–4.0°C warming levels under different SSPs with respect to the current climate, paying particular attention to the relative roles of climate and population effect in the exposure. As global mean temperature increases, the CMIP6 simulations project more frequent dangerous precipitation extremes with return periods ranging from 10 to 50 years across China, with more remarkable increases in the occurrence probability at the high warming levels. This is in accordance with the results of previous CMIP models (Li et al., 2018). For instance, the areal mean occurring probability of 20-year RX1day is reported to significantly increase by approximately 40, 80, 150, and 250% at the 1.5, 2.0, 3.0, and 4.0°C warming climate under SSP5-8.5 scenario with respect to the current climate of 1995–2014, respectively. Notably, the magnitudes of the increases rely on the rarity of precipitation extremes, and the increases are more intense for rarer events. Other scenarios yield the similar features with SSP5-8.5, implying the independence of the outcomes to emission scenarios. RX5day also shares the similar results with RX1day. Briefly, global warming will exacerbate the increases in the occurrence of dangerous precipitation extremes with different return periods across China regardless of the chosen scenarios.
As a consequence of the increased occurrence, population exposure to dangerous precipitation extremes over China presents persistent increases with continued future warming. The 1.5–4.0°C warming relative to present-day results in approximately 29.9, 47.8, 72.9, and 84.3% increases in the aggregated population exposure to the 10-year RX1day under SSP5-8.5 scenario on average, respectively. A similar tendency can be expected in exposure for events with other return periods, but the increasing magnitudes for the population exposed to precipitation extremes are also larger for more extreme events. Spatially, the increases dominate in most regions of China, particularly for regions of eastern and southern China, with more widespread and intense increases for the higher warmer climate. Conversely, some parts of northwestern China and the Tibetan Plateau experience decreasing exposure with future warming. In addition, different from the occurrence changes, the areal weighted average exposure changes are somewhat sensitive to the selected forcing scenarios. Despite the consistent increases in exposure with future warming under other scenarios, the aggregated population exposure presents the larger proportional increases at the same warming levels from the regional-rivalry scenario of SSP3-7.0 compared to the fossil-fueled development scenario of SSP5-8.5. This indicates population exposure changes are subject to emission scenarios, embodying the importance of societal decisions.
Previous literature has documented that limiting global warming from 2.0 to 1.5°C can reduce the population exposure to the 20-year events over the global land monsoon region by 36% (Zhang et al., 2018). In this study, the 0.5°C less warming is estimated to trigger remarkable decreases of 16.5–20.5% for exposure to the 10-year events over China. Our results are also in line with Zhang et al. (2018) that the avoided impacts are more significant for rarer events.
Climate and population changes both drive the exposure changes. Analysis of their relative role shows that the climate change effect is the key determinant of the increased exposure to precipitation extremes, which is partly counteracted by the negative effects of the population change and their interaction components. The offsetting effect of the population is sourced from the population decline over China, while the negative contribution of their interaction component is mainly attributed to the asynchronous changes in climate and population (Jones et al., 2015). Majority of the regions over China undergoing increased precipitation present the decreased population, which may be the primary cause of the negative effect of the interaction component. This highlights the importance of mitigation strategies for precipitation extremes to decrease population exposure, particularly for vulnerable and populous regions such as eastern China.
The projection of precipitation extremes still bears large uncertainties, especially for the rarer events, which is generally consistent with the outcomes of previous CMIP outputs (Kharin et al., 2018). The global models have difficulty in simulating the precipitation extremes in some local regions with complex topography due to their coarse resolutions (Zhou et al., 2019; Xie et al., 2021). More different models for climate or population should be adopted in further exploration. Nevertheless, the analysis from multiple emission scenarios and precipitation indices leads to generally consistent qualitative results, verifying the robust estimation for exposure over China in this study. In addition, recently, investigations are emerging about the exposure to the compound events, such as the co-occurrence of drought and heatwaves (Liu W. et al., 2021), which may trigger more amplified consequences as opposed to the individual events. This encourages us to assess the risks arising from the compound events in the future work.
Data availability statement
The original contributions presented in the study are included in the article/Supplementary Material, further inquiries can be directed to the corresponding author.
Author contributions
HX: formal analysis; investigation; writing original draft; writing—review and editing. HC: conceptualization; methodology; supervision; writing original draft; writing—review and editing. HW: resources; supervision.
Funding
This research was jointly supported by the Strategic Priority Research Program of the Chinese Academy of Sciences (Grant No: XDA23090102) and the National Natural Science Foundation of China (Grant No: 41922034, 42075021).
Conflict of interest
The authors declare that the research was conducted in the absence of any commercial or financial relationships that could be construed as a potential conflict of interest.
Publisher’s note
All claims expressed in this article are solely those of the authors and do not necessarily represent those of their affiliated organizations, or those of the publisher, the editors and the reviewers. Any product that may be evaluated in this article, or claim that may be made by its manufacturer, is not guaranteed or endorsed by the publisher.
Supplementary material
The Supplementary Material for this article can be found online at: https://www.frontiersin.org/articles/10.3389/feart.2022.963042/full#supplementary-material
References
Barriopedro, D., Fischer, E. M., Luterbacher, J., Trigo, R. M., and Garcia-Herrera, R. (2011). The hot summer of 2010: redrawing the temperature record map of europe. Science 332, 220–224. doi:10.1126/science.1201224
Chen, H., and Sun, J. (2019). Increased population exposure to extreme droughts in China due to 0.5 °C of additional warming. Environ. Res. Lett. 14, 064011. doi:10.1088/1748-9326/ab072e
Chen, H., and Sun, J. (2018). Projected changes in climate extremes in China in a 1.5°C warmer world. Int. J. Climatol. 38, 3607–3617. doi:10.1002/joc.5521
Chen, H., and Sun, J. (2021). Significant increase of the global population exposure to increased precipitation extremes in the future. Earth's. Future 9, 2020EF001941. doi:10.1029/2020ef001941
Dong, S., and Sun, Y. (2018). Comparisons of observational data sets for evaluating the CMIP5 precipitation extreme simulations over Asia. Clim. Res. 76, 161–176. doi:10.3354/cr01534
Guan, D., Meng, J., Reiner, D. M., Zhang, N., Shan, Y., Mi, Z., et al. (2018). Structural decline in China’s CO2 emissions through transitions in industry and energy systems. Nat. Geosci. 11, 551–555. doi:10.1038/s41561-018-0161-1
Harrington, L. J., and Otto, F. E. L. (2018). Changing population dynamics and uneven temperature emergence combine to exacerbate regional exposure to heat extremes under 1.5°C and 2°C of warming. Environ. Res. Lett. 13, 034011. doi:10.1088/1748-9326/aaaa99
Hu, D., Jiang, D., Tian, Z., and Lang, X. (2022). How skillful was the projected temperature over China during 2002–2018? Sci. Bull. 67, 1077–1085. doi:10.1016/j.scib.2022.02.004
Huang, J., Yu, H., Dai, A., Wei, Y., and Kang, L. (2017). Drylands face potential threat under 2 °C global warming target. Nat. Clim. Chang. 7, 417–422. doi:10.1038/nclimate3275
Ionita, M., Tallaksen, L. M., Kingston, D. G., Stagge, J. H., Laaha, G., Van Lanen, H. A. J., et al. (2017). The European 2015 drought from a climatological perspective. Hydrol. Earth Syst. Sci. 21, 1397–1419. doi:10.5194/hess-21-1397-2017
IPCC (2021). Climate change 2021: The physical science basis. Contribution of working group I to the sixth assessment Report of the intergovernmental panel on climate change. Cambridge: Cambridge University Press.
Iyakaremye, V., Zeng, G., Yang, X., Zhang, G., Ullah, I., Gahigi, A., et al. (2021). Increased high-temperature extremes and associated population exposure in Africa by the mid-21st century. Sci. Total Environ. 790, 148162. doi:10.1016/j.scitotenv.2021.148162
Jiang, D. B., Hu, D., Tian, Z. P., and Lang, X. M. (2020). Differences between CMIP6 and CMIP5 models in simulating climate over China and the East Asian monsoon. Adv. Atmos. Sci. 37, 1102–1118. doi:10.1007/s00376-020-2034-y
Jones, B., O’Neill, B. C., McDaniel, L., McGinnis, S., Mearns, L. O., and Tebaldi, C. (2015). Future population exposure to US heat extremes. Nat. Clim. Chang. 5, 652–655. doi:10.1038/nclimate2631
Jones, B., and O’Neill, B. C. (2016). Spatially explicit global population scenarios consistent with the Shared Socioeconomic Pathways. Environ. Res. Lett. 11, 084003. doi:10.1088/1748-9326/11/8/084003
Jones, B., Tebaldi, C., O’Neill, B. C., Oleson, K., and Gao, J. (2018). Avoiding population exposure to heat-related extremes: demographic change vs climate change. Clim. Change 146, 423–437. doi:10.1007/s10584-017-2133-7
Kharin, V. V., Flato, G. M., Zhang, X., Gillett, N. P., Zwiers, F., and Anderson, K. J. (2018). Risks from climate extremes change differently from 1.5°C to 2.0°C depending on rarity. Earth's. Future 6, 704–715. doi:10.1002/2018ef000813
Kharin, V. V., Zwiers, F. W., Zhang, X., and Hegerl, G. C. (2007). Changes in temperature and precipitation extremes in the IPCC ensemble of global coupled model simulations. J. Clim. 20, 1419–1444. doi:10.1175/jcli4066.1
Kim, Y. H., Min, S. K., Zhang, X., Sillmann, J., and Sandstad, M. (2020). Evaluation of the CMIP6 multi-model ensemble for climate extreme indices. Weather Clim. Extrem. 29, 100269. doi:10.1016/j.wace.2020.100269
Leonard, M., Westra, S., Phatak, A., Lambert, M., van den Hurk, B., McInnes, K., et al. (2013). A compound event framework for understanding extreme impacts. WIREs Clim. Change 5, 113–128. doi:10.1002/wcc.252
Li, C., Zwiers, F., Zhang, X., Chen, G., Lu, J., Li, G., et al. (2019). Larger increases in more extreme local precipitation events as climate warms. Geophys. Res. Lett. 46, 6885–6891. doi:10.1029/2019gl082908
Li, C., Zwiers, F., Zhang, X., Li, G., Sun, Y., and Wehner, M. (2021). Changes in annual extremes of daily temperature and precipitation in CMIP6 models. J. Clim. 34, 3441–3460. doi:10.1175/jcli-d-19-1013.1
Li, W., Jiang, Z., Zhang, X., Li, L., and Sun, Y. (2018). Additional risk in extreme precipitation in China from 1.5 °C to 2.0 °C global warming levels. Sci. Bull. 63, 228–234. doi:10.1016/j.scib.2017.12.021
Liu, W., Sun, F., Feng, Y., Li, C., Chen, J., Sang, Y. F., et al. (2021a). Increasing population exposure to global warm-season concurrent dry and hot extremes under different warming levels. Environ. Res. Lett. 16, 094002. doi:10.1088/1748-9326/ac188f
Liu, Z., Deng, Z., He, G., Wang, H., Zhang, X., Lin, J., et al. (2021b). Challenges and opportunities for carbon neutrality in China. Nat. Rev. Earth Environ. 3, 141–155. doi:10.1038/s43017-021-00244-x
Matthews, T. K., Wilby, R. L., and Murphy, C. (2017). Communicating the deadly consequences of global warming for human heat stress. Proc. Natl. Acad. Sci. U. S. A. 114, 3861–3866. doi:10.1073/pnas.1617526114
Michaelides, S. (2013). Vulnerability of transportation to extreme weather and climate change. Nat. Hazards 72, 1–4. doi:10.1007/s11069-013-0975-5
O'Neill, B. C., Tebaldi, C., van Vuuren, D. P., Eyring, V., Friedlingstein, P., Hurtt, G., et al. (2016). The scenario model Intercomparison project (ScenarioMIP) for CMIP6. Geosci. Model Dev. 9, 3461–3482. doi:10.5194/gmd-9-3461-2016
Riahi, K., van Vuuren, D. P., Kriegler, E., Edmonds, J., O’Neill, B. C., Fujimori, S., et al. (2017). The Shared Socioeconomic Pathways and their energy, land use, and greenhouse gas emissions implications: An overview. Glob. Environ. Change 42, 153–168. doi:10.1016/j.gloenvcha.2016.05.009
Risser, M. D., and Wehner, M. F. (2017). Attributable human-induced changes in the likelihood and magnitude of the observed extreme precipitation during Hurricane Harvey. Geophys. Res. Lett. 44, 12457–12464. doi:10.1002/2017gl075888
Rohat, G., Flacke, J., Dosio, A., Dao, H., and Maarseveen, M. (2019). Projections of human exposure to dangerous heat in african cities under multiple socioeconomic and climate scenarios. Earth's. Future 7, 528–546. doi:10.1029/2018ef001020
Selvey, L. A., Rutherford, S., Dodds, J., Dwyer, S., and Robinson, S. M. (2014). The impact of climate-related extreme events on public health workforce and infrastructure - how can we be better prepared? Aust. N. Z. J. Public Health 38, 208–210. doi:10.1111/1753-6405.12219
Sillmann, J., Kharin, V. V., Zwiers, F. W., Zhang, X., and Bronaugh, D. (2013). Climate extremes indices in the CMIP5 multimodel ensemble: Part 2. Future climate projections. J. Geophys. Res. Atmos. 118, 2473–2493. doi:10.1002/jgrd.50188
Van Oldenborgh, G. J., Van der Wiel, K., Sebastian, A., Singh, R., Arrighi, J., Otto, F., et al. (2017). Attribution of extreme rainfall from Hurricane Harvey, August 2017. Environ. Res. Lett. 12, 124009. doi:10.1088/1748-9326/aa9ef2
Wang, H., Sun, J., Chen, H., Zhu, Y., Zhang, Y., Jiang, D., et al. (2012). Extreme climate in China: Facts, simulation and projection. Meteorol. Z. 21, 279–304. doi:10.1127/0941-2948/2012/0330
Wang, J., Song, Y., and Xue, D. (2021). Spatio-temporal evolution of natural disasters and its social-economic effects in China. J. Zhejiang Univ. Sci. Ed. 48, 750–759.
Wang, W., Zhou, W., Li, X., Wang, X., and Wang, D. (2015). Synoptic-scale characteristics and atmospheric controls of summer heat waves in China. Clim. Dyn. 46, 2923–2941. doi:10.1007/s00382-015-2741-8
Wang, X. X., Jiang, D. B., and Lang, X. M. (2019). Extreme temperature and precipitation changes associated with four degree of global warming above pre-industrial levels. Int. J. Climatol. 39, 1822–1838. doi:10.1002/joc.5918
Wu, J., Han, Z., Xu, Y., Zhou, B., and Gao, X. (2020). Changes in extreme climate events in China under 1.5°C–4°C global warming targets: Projections using an ensemble of regional climate model simulations. J. Geophys. Res. Atmos. 125, e2019JD031057. doi:10.1029/2019jd031057
Xie, W., Zhou, B., Han, Z., and Xu, Y. (2021). Projected changes in heat waves over China: Ensemble result from RegCM4 downscaling simulations. Int. J. Climatol. 41, 3865–3880. doi:10.1002/joc.7047
Xie, W., Zhou, B., Han, Z., and Xu, Y. (2022). Substantial increase in daytime-nighttime compound heat waves and associated population exposure in China projected by the CMIP6 multimodel ensemble. Environ. Res. Lett. 17, 045007. doi:10.1088/1748-9326/ac592d
Xu, H., Chen, H., and Wang, H. (2021). Future changes in precipitation extremes across China based on CMIP6 models. Int. J. Climatol. 42, 635–651. doi:10.1002/joc.7264
Yu, H., Wu, D., Piao, X., Zhang, T., Yan, Y., Tian, Y., et al. (2020). Reduced impacts of heat extremes from limiting global warming to under 1.5°C or 2°C over Mediterranean regions. Environ. Res. Lett. 16, 014034. doi:10.1088/1748-9326/abd132
Zhai, P., Zhang, X., Wan, H., and Pan, X. (2005). Trends in total precipitation and frequency of daily precipitation extremes over China. J. Clim. 18, 1096–1108. doi:10.1175/jcli-3318.1
Zhang, G., Zeng, G., Yang, X., and Jiang, Z. (2021). Future changes in extreme high temperature over China at 1.5°C–5°C global warming based on CMIP6 simulations. Adv. Atmos. Sci. 38, 253–267. doi:10.1007/s00376-020-0182-8
Zhang, M., Yu, H., King, A. D., Wei, Y., Huang, J., and Ren, Y. (2020). Greater probability of extreme precipitation under 1.5 °C and 2 °C warming limits over East-Central Asia. Clim. Change 162, 603–619. doi:10.1007/s10584-020-02725-2
Zhang, W., Zhou, T., Zou, L., Zhang, L., and Chen, X. (2018). Reduced exposure to extreme precipitation from 0.5°C less warming in global land monsoon regions. Nat. Commun. 9, 3153. doi:10.1038/s41467-018-05633-3
Zhang, X., Zwiers, F. W., Li, G., Wan, H., and Cannon, A. J. (2017). Complexity in estimating past and future extreme short-duration rainfall. Nat. Geosci. 10, 255–259. doi:10.1038/ngeo2911
Zhou, B., Cheng, Y., Han, Z., Xu, Y., and Wang, X. (2020). Future changes of cluster high temperature events over China from RegCM4 ensemble under RCP4.5 scenario. Adv. Clim. Change Res. 11, 349–359. doi:10.1016/j.accre.2020.11.007
Zhou, B., Wu, J., Xu, Y., Han, Z., and Shi, Y. (2019). Projected changes in autumn rainfall over West China: Results from an ensemble of dynamical downscaling simulations. Int. J. Climatol. 39, 4869–4882. doi:10.1002/joc.6115
Zhu, H., Jiang, Z., and Li, L. (2021). Projection of climate extremes in China, an incremental exercise from CMIP5 to CMIP6. Sci. Bull. 66, 2528–2537. doi:10.1016/j.scib.2021.07.026
Keywords: population exposure, precipitation extremes, CMIP6 models, global warming, avoided impacts
Citation: Xu H, Chen H and Wang H (2022) Increased populations will be exposed to the dangerous precipitation extremes across China in the future. Front. Earth Sci. 10:963042. doi: 10.3389/feart.2022.963042
Received: 07 June 2022; Accepted: 19 July 2022;
Published: 10 August 2022.
Edited by:
Marcelo Cohen, Federal University of Pará, BrazilReviewed by:
Qingxiang Li, School of Atmospheric Sciences, Sun Yat-sen University, ChinaCheng Sun, Beijing Normal University, China
Copyright © 2022 Xu, Chen and Wang. This is an open-access article distributed under the terms of the Creative Commons Attribution License (CC BY). The use, distribution or reproduction in other forums is permitted, provided the original author(s) and the copyright owner(s) are credited and that the original publication in this journal is cited, in accordance with accepted academic practice. No use, distribution or reproduction is permitted which does not comply with these terms.
*Correspondence: Huopo Chen, chenhuopo@mail.iap.ac.cn