Mapping the most heavily reclaimed shorelines of the Yangtze River delta urban agglomerations
 Ting Lu
 Cong Lin
 Ya Ping Wang
 Hao Wu2
  Yu Chen
- 1Nanjing Research Institute of Surveying, Mapping and Geotechnical Investigation, Co., LTD, Nanjing, China
- 2Ministry of Education Key Laboratory for Coast and Island Development, School of Geography and Ocean Science, Nanjing University, Nanjing, China
- 3State Key Laboratory of Information Engineering in Surveying, Mapping and Remote Sensing (LIESMARS), Wuhan University, Wuhan, China
- 4State Key Laboratory of Estuarine and Coastal Research, School of Marine Sciences, East China Normal University, Shanghai, China
- 5School of Environment and Spatial Informatics, China University of Mining and Technology, Xuzhou, China
Objectively understanding the characteristics and evolution of coastal geomorphology, and predicting the growth potential of intertidal flats are the prerequisites for the effective conservation and development of shoreline resources. However, the vulnerability of shorelines in the long term and large space scale needs to be assessed since human intervention in recent decades has intensified the double oppression of river delta system transformation and land reclamation. The Yangtze River Delta Urban Agglomerations (YRDUA) is a highly developed global economy, therefore, the YRDUA with the most intense reclamation, and their dynamic shoreline changes before and after the sharply decreasing sediment supply were detected based on 4,596 remote sensing images and corresponding hydrodynamic data. We found that the sediment replenishment from the radial sand ridges on the middle Jiangsu Coast made the shoreline expansion rate reach 4–5 times that of other Jiangsu coasts. Specifically, a close correlation between the shoreline accretion rate and the amount of sediment supply was found on the eastern Chongming Wetland. Generally, there were still sufficient sediments on the Yangtze River Estuary and Hangzhou Bay interface to support the shoreline expansion despite the upstream sediment reduction. The longshore sediment transport from the delta-front erosion and the land reclamation including vegetation ecological responses were the main factors promoting the shoreline advance. Human interventions, dominated mainly by reclamation, formed positive feedback with local hydrodynamic processes and promoted continuous shoreline accretion. This study focused on the external and internal drivers and their interactions of long-term shoreline evolution with very intensive human activities, which can provide the decision-making reference for the regional coastal zone management and conservation.
1 Introduction
Shorelines, as well as the new reserved land brought about by the shoreline expansion, are the most valuable natural resource in the land-ocean interaction areas (Temmerman et al., 2013). As the value provider for ecosystem services (Chen et al., 2020), they could ensure the land demand for increased human survival and development space, provide habitat for fish, birds and benthic organisms, and serve as the buffer zone and natural barrier against marine disasters such as storm surges (Allen, 2000; Costanza, 2006). Therefore, investigating the changes in the key areas of shoreline expansion is necessary for coastal zone environmental planning and ecological conservation (Wang et al., 2012; Addo, 2013; Li et al., 2014).
Coastal wetlands within the shoreline are facing non-ignorable challenges under the threat of the worldwide reduced river sediment supply due to upstream dam constructions (Syvitski et al., 2009), such as the Nile (Stanley and Warne, 1993), Colorado (Carriquiry et al., 2001), Mississippi (Blum and Roberts, 2009), and Yellow River (Wang et al., 2010). However, an opposite view was that the vulnerability of coastal wetlands was overestimated contributing to the combination of higher tidal inundation and developing salt marshes capturing fine-grained sediments (Foster et al., 2013; Kirwan et al., 2016; Langston et al., 2020). Moreover, a new insight has been proposed in some recent findings that even with a sharp decrease in upstream sediment supply, coastal wetlands still tend to expand seaward under conditions of local suspended sediment concentrations (SSC) remained unchanged caused by the offshore budget (Long et al., 2021; Lou et al., 2022). The hydrodynamic environment in estuaries and coasts determines the direction and destination of suspended sediment transport (Wang et al., 2013; Xiong et al., 2017; Li et al., 2018). Hence, the physical processes of local hydrodynamic-sediment coupling and the corresponding biological responses affect the seaward/landward trend of coastal wetlands and, therefore, shoreline changes (Chen et al., 2020).
The human intervention caused mainly by land reclamation is the prominent feature of the shoreline changes in economically developed regions (Wu et al., 2016; Du et al., 2019). Economic development, population growth, and regional natural characteristics are attention-getting factors contributing to sequential coastal reclamations (Wu et al., 2016). The abundant sediment supply from the Yangtze River (YZR) has aggravated coastal erosion/deposition and benefited the reclamation (Gao et al., 2013). Meanwhile, continuing reclamation depends largely on sediment accumulation rates on tidal flats (Du et al., 2019). The internal salt marsh systems attenuate hydrodynamics and reduce erosion, with more significant accumulation rates than bare flats. Thus, regions with vegetation cultivation, such as salt marshes, become the main reclamation targets (Chen et al., 2020). Therefore, an urgent requirement for the rational use of new land is to better understand the coastal hydrodynamic-sediment coupling process and ecological response under the influence of anthropogenic activities at spatial and temporal scales.
On account of the time-consuming field observations and computationally expensive limitations of morphodynamic models, investigating shoreline changes relies on massive spatio-temporal data accumulated by advanced remote sensing technology (Li et al., 2016). The development of geospatial information cloud computing platforms, especially Google Earth Engine (GEE), has dramatically improved the ability of spatio-temporal large-scale expression (Tamiminia et al., 2020). Medium-resolution and multi-temporal images, such as the Landsat data, are widely used in the aspect of shoreline change analysis (Pardo-Pascual et al., 2012; Addo, 2013; Li et al., 2014), providing convenience for the detection of large-spatial scales and long-time scales.
Furthermore, the present studies have focused mainly on the dynamic shoreline changes, but few have systematically revealed the controlling factors of the temporal and spatial changes from the perspective of the natural geographical characteristics and the forcing of anthropogenic interventions, and the Yangtze River Delta Urban Agglomerations (YRDUA) is a highly developed global economy under the double oppression of the delta system transformation due to the dam construction and land reclamation behavior for economic growth. In this study, Landsat images in long sequences of several decades and local hydrodynamic-sediment data were collected, and images were processed on the GEE platform to obtain the spatial-temporal distribution of coastal surface water variations, quantify shoreline forward/backward rates, and discuss the natural or anthropogenic sources affecting shoreline changes. The present study has a certain value for coastal vulnerability assessment and wetland management.
2 Study area
The YRDUA is north of Yancheng, Jiangsu Province, and south of Taizhou, Zhejiang Province (Figure 1A). It connects the Abandoned Yellow River Delta, Jiangsu Coast, Yangtze River Estuary (YRE), Hangzhou Bay (HZB), and Zhejiang Coast (Figure 1B). As a semi-enclosed embayment, the Jiangsu Coast is adjacent to the South Yellow Sea (Dong et al., 2011), with an average tidal range reaching 3.68 m (Chen et al., 2020). The YRE is located downstream of the YZR (Figure 1B), with an average tidal range of 2.67 m (Dai et al., 2013). The HZB is located downstream of the Qiantang River (QTR) (Figure 1B), and the tidal ranges of the north and south bank are 2–4 m and 1–2 m respectively due to the terrain obstruction of islands (Xie et al., 2017).
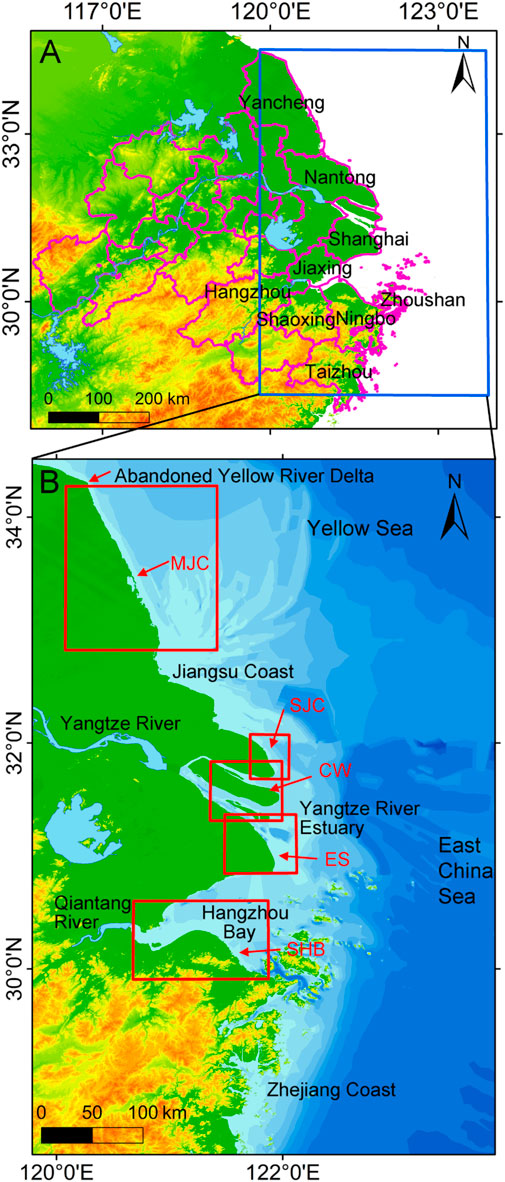
FIGURE 1. Study area and typical shoreline change areas. (A) The geographical location of the YRDUA, and the labeled are coastal cities including Yancheng, Nantong, Shanghai, Jiaxing, Hangzhou, Shaoxing, Ningbo, Zhoushan, and Taizhou. (B) The schematic diagrams of typical shoreline change areas are marked by red wireframes (MJC: middle Jiangsu Coast; SJC: southern Jiangsu Coast; CW: Chongming Wetland; ES: eastern Shanghai; SHB: southern Hangzhou Bay).
The sediments are dominated by fine-grained mud and silt from the Jiangsu Coast to the HZB, presenting complex underwater geomorphological features. Offshore on the middle Jiangsu Coast (MJC), radial sand ridges diverge in the adjacent waters (Xing et al., 2012; Xiong et al., 2017), with approximately a length of 90 km from the east to the west and a width of 200 km from the northwest to the southeast (Liu et al., 1989; Wang et al., 2012), which is the largest sand ridges on the Chinese continental shelf (Xu et al., 2016; Chen et al., 2020). Located in the YRE, the estuarine turbidity maximum with a length of about 25–46 km from the northwest to the southeast and a width of about 90 km from the north to the south, is formed by the accumulation of fine-grained sediments within the water column (Li and Zhang, 1998; Lu et al., 2020). The HZB shows a significant turbid water state on the suspension of extremely high concentrations (Shi, 2011; He et al., 2016), with 70% of the fine-grained particles coming from the YZR sediment transport (He et al., 2016).
As the shoreline advances bring potential land resources, the reclamation since 1949 has altered hydrodynamics and resulted in considerable reductions of tidal flats within shorelines (Wang et al., 2012). Typical native and introduced vegetation communities are distributed over the salt marshes, and the introduced Spartina species are outcompeting the native species (Wang et al., 2012; Li et al., 2014), becoming the potential primary target of land reclamations.
3 Materials and methods
3.1 Data sources
The Landsat series provide global-scale optical satellite images with the longest time series remote sensing data, and we used the atmospheric-corrected Landsat Surface Reflectance products based on the GEE platform to calculate coastal surface water variations each year (Chen et al., 2017; Wang et al., 2020; Long et al., 2022). We selected a total of 4,596 images with less than 30% cloud coverage, including Landsat 5 TM, Landsat 7 ETM+ and Landsat 8 OLI (Table 1).
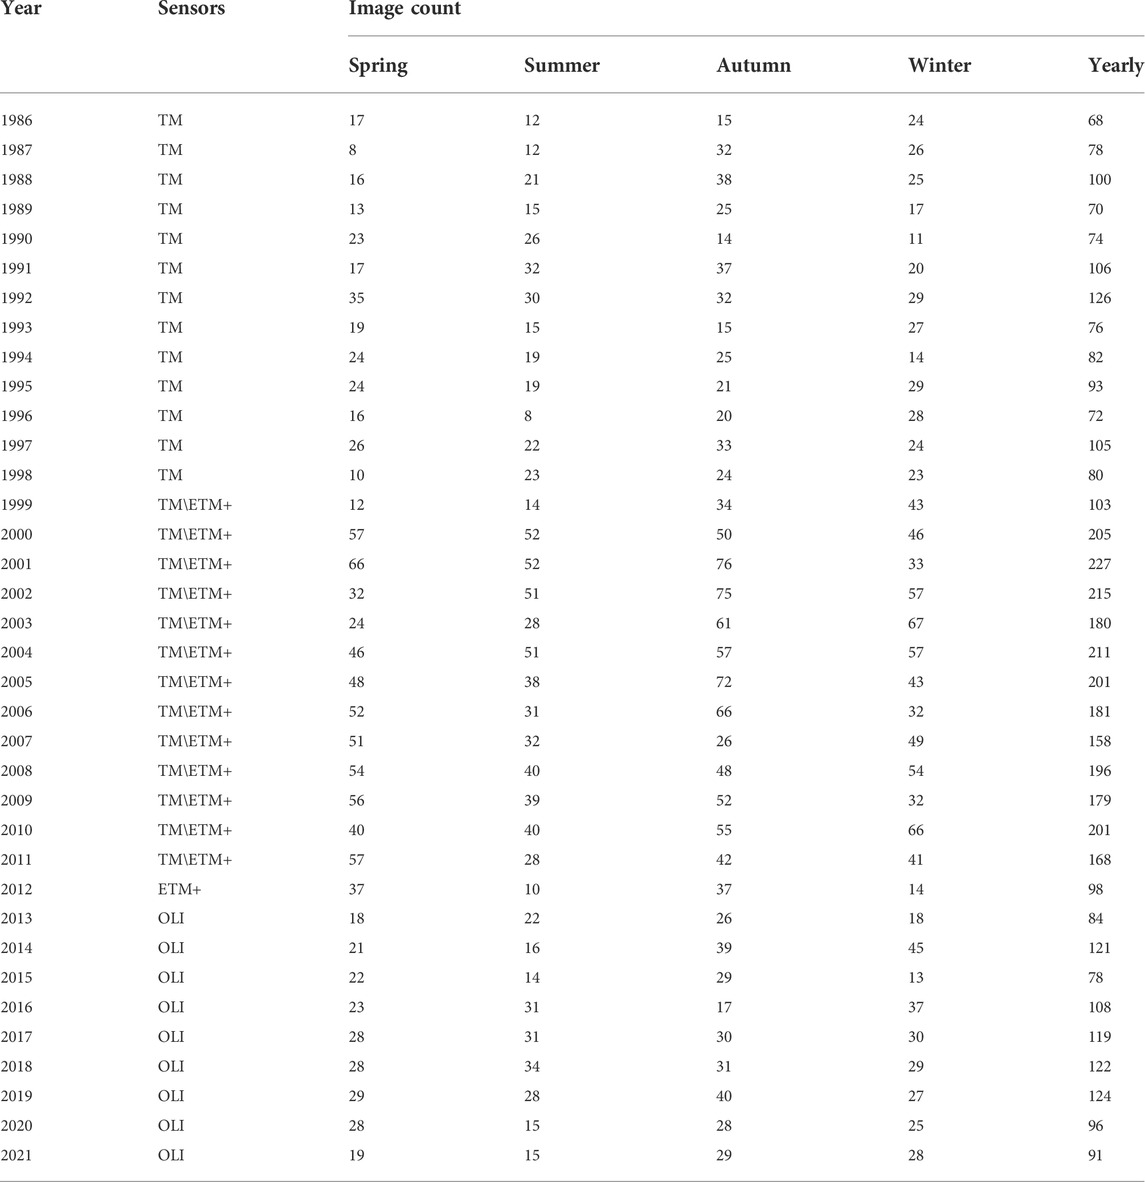
TABLE 1. Statistical information for the Landsat data collections.
In order to improve the accuracy of surface water extraction in remote sensing images, we also used relevant public data stored on the GEE platform (Figure 2), including: 1) Digital Elevation Model (DEM) reflecting elevation and slope information, and chose a data-complete V4 version with a spatial resolution of 90 m (Farr et al., 2007) (Figure 2A); 2) MERIT Hydro global hydrological dataset containing Height Above the Nearest Drainage (HAND) with a spatial resolution of 3 arcseconds (Nobre et al., 2011; Dai et al., 2019) (Figure 2B); 3) Global Human Settlement Layer (GHSL) containing built-up region data in 1975, 1990, 2000, and 2014 with a spatial resolution of 30 m (Pesaresi et al., 2016) (Figure 2C).
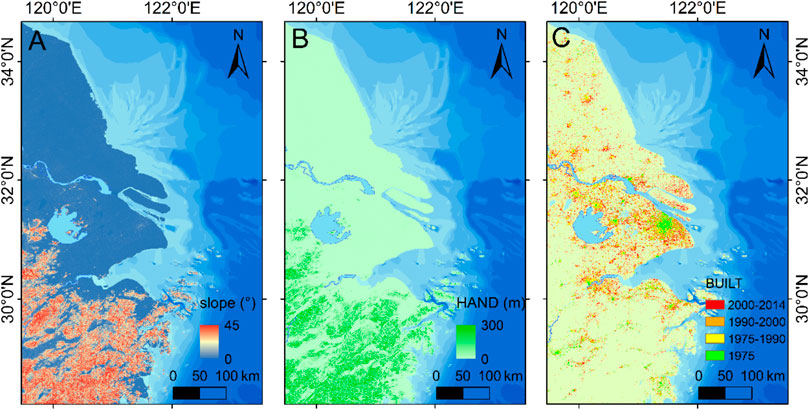
FIGURE 2. Datasets of the study area for multi-level surface water extraction post-processing rules. (A) The slope map; (B) the Height Above the Nearest Drainage (HAND) map; (C) the built-up map in different years.
We collected relevant hydrodynamic and sediment transport data to analyze natural factors of shoreline changes. The annual suspended sediment load (SSD) at Datong Station, the most downstream hydrological station of the YZR, was obtained from the Changjiang Water Resource Committee and the China River Sediment Bulletin, and data at the representative hydrological station of the QTR was from the China River Sediment Bulletin. The wave direction and wave period data were from the European Centre for Medium-Range Weather Forecasts (ECMWF) (https://apps.ecmwf.int/datasets/data/interim-full-daily/levtype=sfc/).
3.2 Methods
3.2.1 Image processing
As procedures shown in the workflow (Figure 3), the preparation and processing of the image data include: 1) the images with less than 30% cloud coverage screening; 2) the cloud and cloud shadow masking using the Fmask algorithm for filtered (Zhu and Woodcock, 2012); 3) the yearly image median composite. The purpose of the image median composite was to make up for some of the data gaps caused by single-period image clouds and cloud shadow masks.
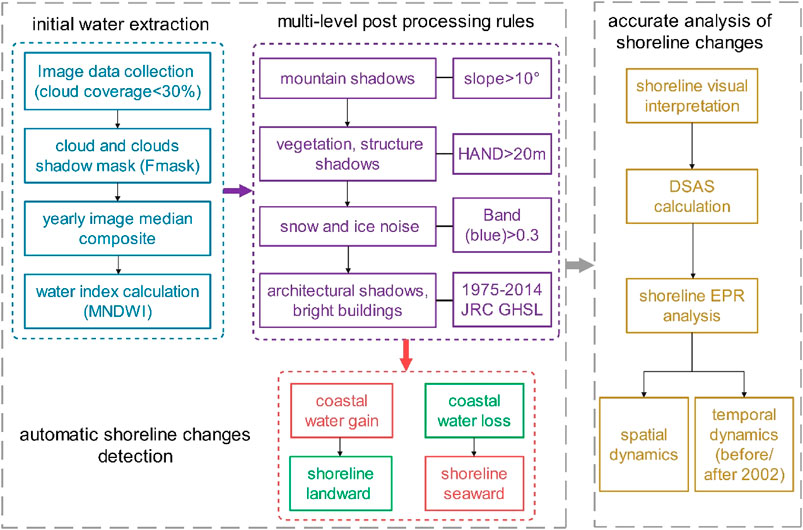
FIGURE 3. Workflow of the automatic shoreline change extraction and accurate analysis. We conducted the automatically coastal surface water extraction method (including the initial water extraction and then multi-level post-processing rules) to detect shoreline change areas and analyze shoreline change trends. Then, we obtained accurate shorelines by artificial visual interpretation based on the shoreline change areas detection by the automatically coastal surface water extraction method.
We indirectly described the shoreline changes by the automatically coastal surface water extraction method (Figure 3). The shoreline retreated landward when the coastal water increased and accreted seaward when it decreased. We used the improved normalized water index (MNDWI) to conduct the water extraction (Xu, 2006).
where
The water index method can efficiently extract the surface water at large spatial scales, but this method is susceptible to low-reflectance features such as terrain and building shadows and high-reflective features such as snow and bright buildings. Therefore, we have constructed multi-level water extraction post-processing rules for the removal of major noises from initial water extractions, which applied to all flat areas, not just this study (Figure 3): 1) based on the slope information (Slope > 10°) to mask obvious undulating regions of terrain to solve the mis-extraction of mountain shadows (Lu et al., 2016); 2) based on the Height Above the Nearest Drainage (HAND > 20 m) to remove the effects of other shadows such as vegetation, structures, etc. (Tsyganskaya et al., 2018); 3) based on the Blue-band surface reflectivity greater than 0.3 masking to remove the effects of snow and ice noise (Yang et al., 2020); 4) based on the 1975–2014 JRC GHSL global human settlement data masking urban built-up regions to prevent architectural shadows and bright building mis-extraction in the city (Pesaresi et al., 2016).
3.2.2 Analysis of shoreline changes
By conducting initial water extraction and multi-level post-processing rules, the spatial/temporal variations of coastal water increases/decreases within the interannual period were obtained, and thus the landward/seaward trends of shoreline changes were indirectly obtained (Figure 3).
In order to quantify the shoreline trend in more detail (Figure 3), we used the digital shoreline analysis system (DSAS), an extension software for ArcGIS that allows shoreline change rate statistics to detect the seaward/landward trend in the region where shorelines have changed for decades (Thieler et al., 2009). We calculated the end-point rate (EPR) to quantify the interannual shoreline seaward/landward rate according to dividing the shoreline travel distance by the time elapsed from shoreline movement (Thieler et al., 2009; Long et al., 2021).
where,
We accurately characterized shoreline changes: 1) at large spatial scales, since the YRDUA has undergone large-scale land reclamation on account of emerging economies, and 2) on temporal scales before and after 2002, since the YRDUA is a typical case under the oppression of the delta system transformation due to the Three Gorges Dam construction in 2002 (Figure 3).
4 Results
4.1 Temporal and spatial coastal surface water variations
The temporal and spatial coastal surface water increases/decreases every 1 year and every 5 years were presented in Figures 4–6. Generally, coastal surface water variations and shoreline changes mainly occurred in the following typical regions: the MJC; SJC; CW; ES, and SHB. The decreasing trend of coastal surface water was more common than the increasing trend to a large extent, indicating that most shorelines were pushed seaward and the new land was expanded contributing mainly to the land reclamation in recent decades (Figures 4A,B).
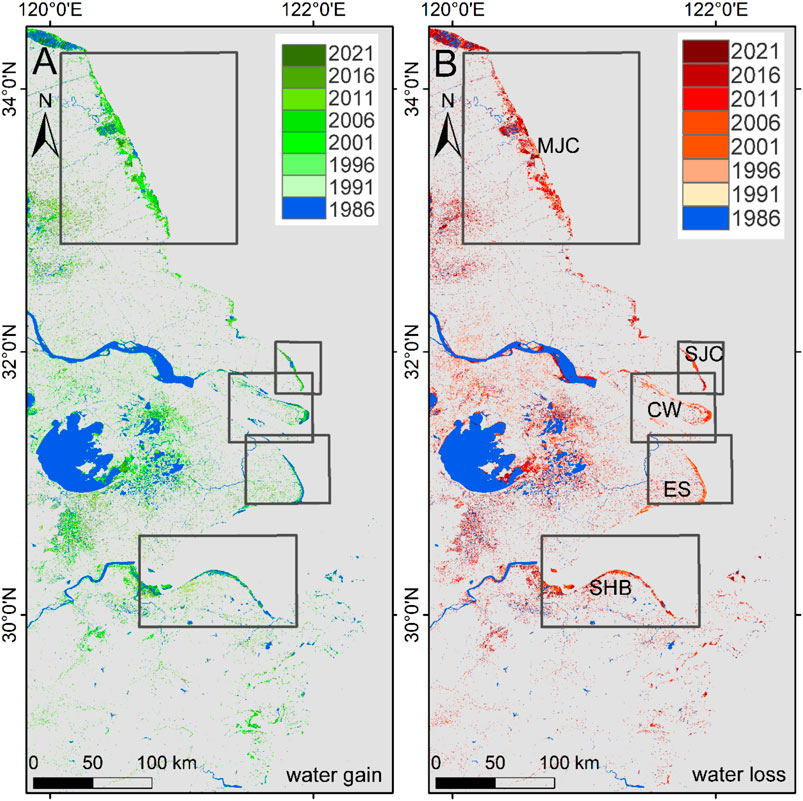
FIGURE 4. Spatial variations of the coastal surface water in the study area, and the schematic diagrams of typical shoreline change areas [including the middle Jiangsu Coast (MJC), southern Jiangsu Coast (SJC), Chongming Wetland (CW), eastern Shanghai (ES), and southern Hangzhou Bay (SHB)] are marked by dark gray wireframes. The MJC and SJC are on the Jiangsu Coast, and the CW, ES, and SHB are on the Yangtze River Estuary (YRE) and Hangzhou Bay (HZB) interface. (A) Gains; (B) losses of the total surface water area from 1986 to 2021. Blue areas show the extent of the coastal surface water in the initial year 1986, and the amount of water gain/losses in each period are represented by green/red gradient areas.
The dynamic process of coastal surface water variations in key shoreline change areas was depicted in Figures 5, 6. Salt pans and aquaculture bases were distributed on the Jiangsu Coast (Figures 5A,B,D,E). Both the water gains and losses of each year showed fluctuation characteristics during the whole period (Figures 5C,F). Meanwhile, the total water change areas, including the sum of water gains/losses of every 5 years remained almost unchanged after 1996 on the Jiangsu Coast (including the MJC and SJC). The decreasing area of water losses when the increasing area of water gains, and vice versa (Figures 5C,F).
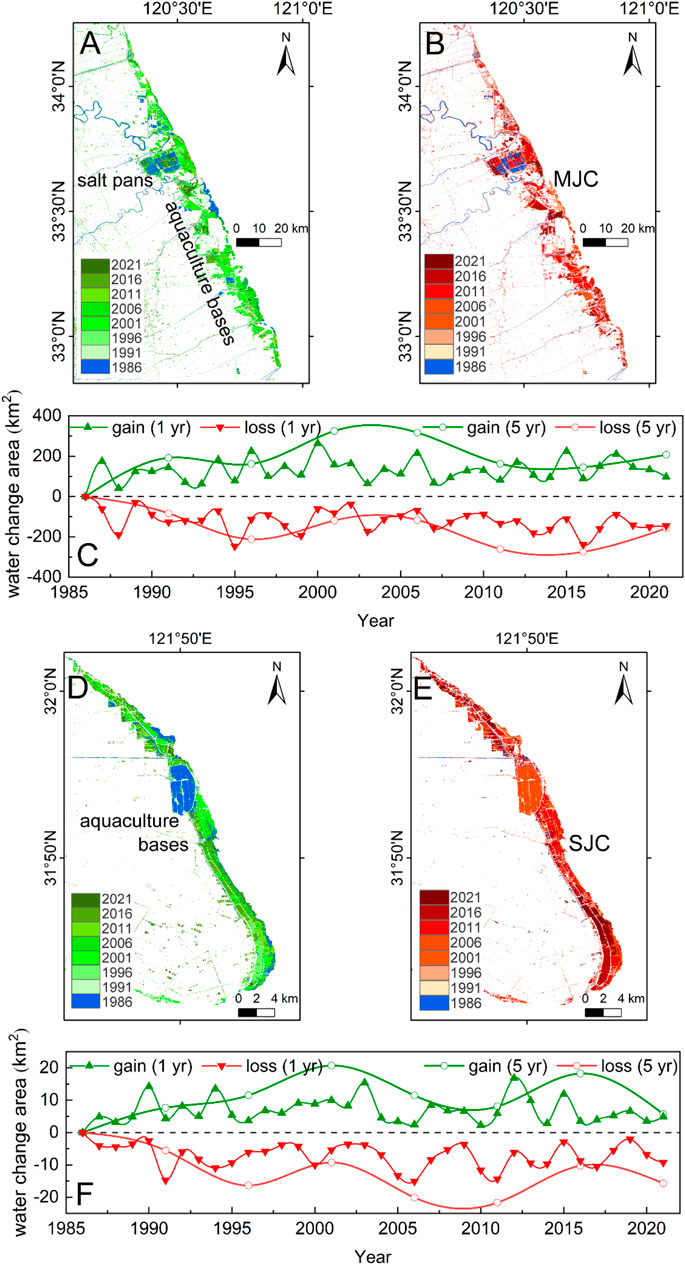
FIGURE 5. Spatial variations of the coastal surface water on the Jiangsu Coast. (A) Gains; (B) losses; (C) water change areas on the middle Jiangsu Coast (MJC); (D) gains; (E) losses; (F) water change areas on the southern Jiangsu Coast (SJC) from 1986 to 2021. Blue areas (A,B,D,E) show the extent of the coastal surface water in the initial year 1986. The amount of water gains (A,D) and water losses (B,E) in each period are represented by green/red gradient areas. Green/red dot lines (C,F) indicate the water gain/loss trend divided by every 1 year (triangular solid dot lines) and every 5 years (circular hollow dot lines).
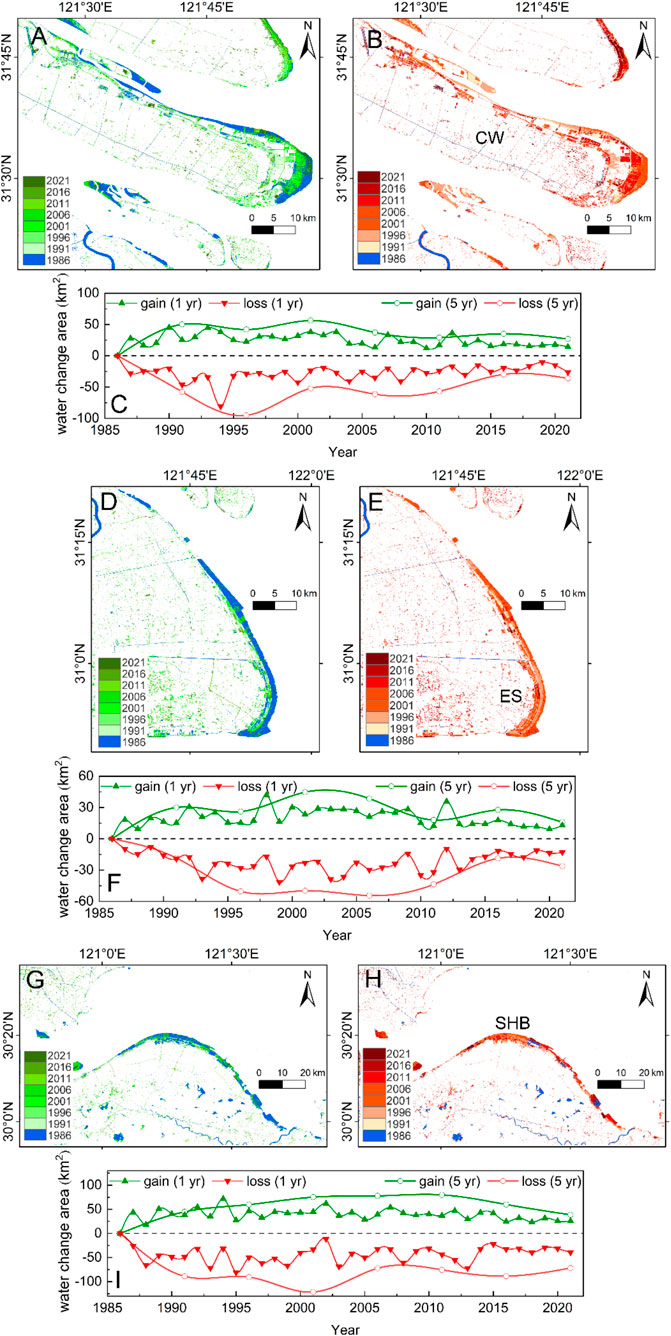
FIGURE 6. Spatial variations of the coastal surface water on the Yangtze River Estuary (YRE) and Hangzhou Bay (HZB) interface. (A) Gains; (B) losses; (C) water change areas on the Chongming Wetland (CW); (D) gains; (E) losses; (F) water change areas on the eastern Shanghai (ES); (G) gains; (H) losses; (I) water change areas on the southern Hangzhou Bay (SHB) from 1986 to 2021. Blue areas (A,B,D,E,G,H) show the extent of the coastal surface water in the initial year 1986. The amount of water gains (A,D,G) and water losses (B,E,H) in each period are represented by green/red gradient areas. Green/red dot lines (C,F,I) indicate the water gain/loss trend divided by every 1 year (triangular solid dot lines) and every 5 years (circular hollow dot lines).
The coastal surface water on the YRE-HZB interface (including the CW, ES, and SHB) showed different change patterns from the Jiangsu Coast (Figures 6A–I). Generally, the coastal water experienced massive degradation. There was almost no peak of water gains, but significant peaks of water losses every 5 years, and the time of the most water losses on the CW, ES, and SHB were in 1996, from 1996 to 2006 and in 2001 (Figures 6C,F,I). Generally, the variation range of coastal wetland areas gradually decreased on the YRE-HZB interface (Figures 6C,F,I). The yearly water gains were close to water losses on the CW after 2015 (Figure 6C), indicating that the shoreline accretion rate has slowed down. Nevertheless, the yearly water losses were still greater than water gains on the SHB after 2015 (Figure 6I), which revealed that the SHB shoreline was still expanding seaward.
4.2 Shoreline changes
4.2.1 Changes in the total area
The accurate depictions of shoreline changes were shown in Figures 7, 8, indicating that the shoreline pushed seaward in the YRDUA during recent decades. For the temporal variations before (BD) and after the dam construction in 2002 (AD), the most shoreline seaward trend on the MJC and eastern CW was during BD (Figures 7A–E, 8A–E). Conversely, the more significant shoreline accretion on the SJC, ES, and inner SHB was during AD (Figures 7F–J, 8F–O).
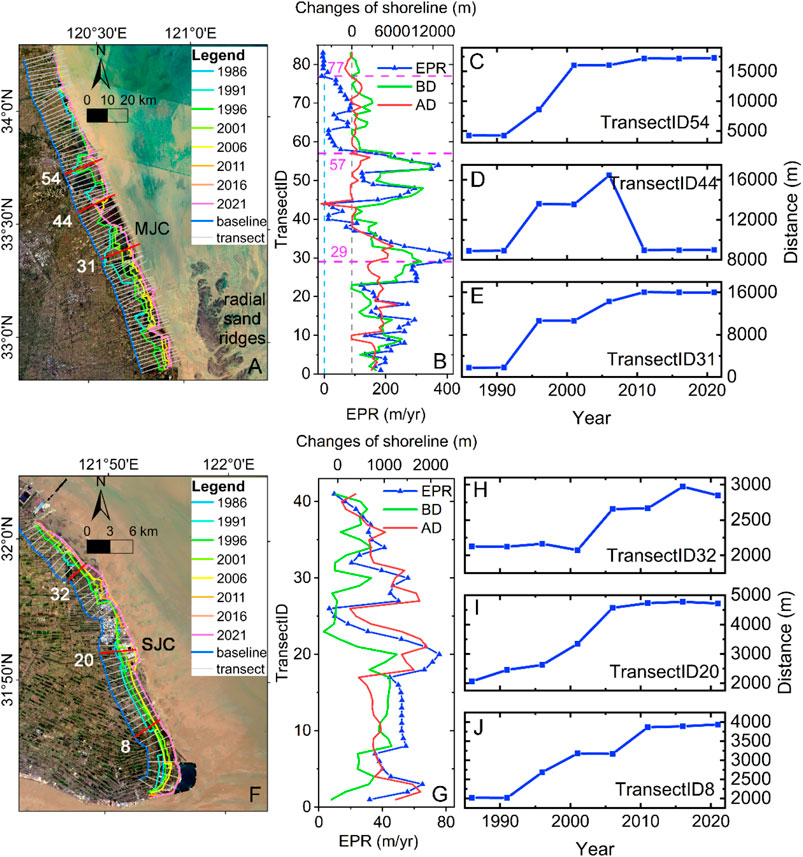
FIGURE 7. Shoreline changes on the Jiangsu Coast. Shorelines on the (A) middle Jiangsu Coast (MJC), and the MJC is adjacent to radial sand ridges; (F) southern Jiangsu Coast (SJC). End-point rate (EPR) of the shoreline (the blue triangle dot-dash line) and the shoreline change distance before the dam construction in 2002 (during BD, the green line) and after the dam construction in 2002 (during AD, the red line) on the (B) MJC; (G) SJC. Variations in distance from (C–E) Transect54, 44, 31 [marked in (A)] to the baseline [the dark blue line in (A)] (H–J) Transect32, 20, 8 [marked in (F)] to the baseline [the dark blue line in (F)]. The transect was generated equidistant from the baseline, and each transect was perpendicular to the baseline.
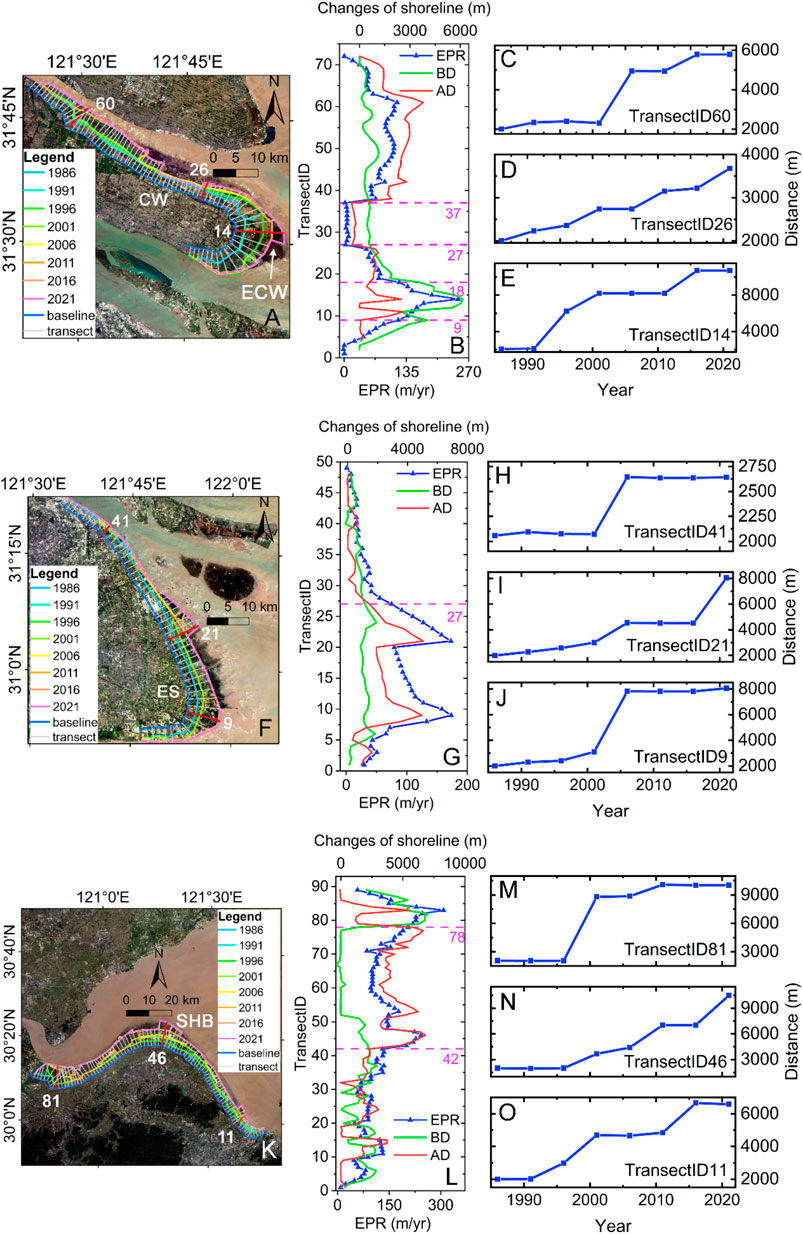
FIGURE 8. Shoreline changes on the Yangtze River Estuary [YRE, including the Chongming Wetland (CW) and the eastern Shanghai (ES)] and Hangzhou Bay (HZB) interface. Shorelines on the (A) CW (ECW: eastern Chongming Wetland); (F) ES; (K) southern HZB (SHB). End-point rate (EPR) of the shoreline (the blue triangle dot-dash line) and shoreline change distance before the dam construction in 2002 (during BD, the green line) and after the dam construction in 2002 (during AD, the red line) on the (B) CW; (G) ES; (l) SHB. Variations in distance from (C–E) Transect60, 26, 14 [marked in (A)] to the baseline [the dark blue line in (A)]; (H–J) Transect41, 21, 9 [marked in (F)] to the baseline [the dark blue line in (F)]; (M–O) Transect81, 46, 11 [marked in (K)] to the baseline [the dark blue line in (K)]. Transect was generated equidistant from the baseline, and each transect was perpendicular to the baseline.
More specifically, the shoreline expansion rate on the MJC near the radial sand ridges, northern MJC part and SJC were 213.4 m/yr, 50.8 m/yr, and 42.0 m/yr, respectively (Figures 7B,G), indicating that the accretion rate with the radial sand ridge sediment supply was 4–5 times that of other Jiangsu coasts. Comparatively, the CW accretion rates in the eastern and western parts were 157.1 m/yr and 82.5 m/yr, respectively, and the south and north of the ES were 98.7 m/yr and 22.5 m/yr, respectively (Figures 8B,G). In the outer and inner SHB, the average accretion rates were 88.9 m/yr and 154.8 m/yr, respectively (Figure 8L), which revealed that the seaward rate of the inner bay was about 2 times that of the outer bay.
4.2.2 Temporal variations in different regions
For the temporal variations, notably, the MJC shoreline accretion trend was hindered and even landward in the northern Transect77 during AD (Figures 7A,B). The CW shoreline expansion trend was hindered during AD (Figure 8A), and the rates in the most significant accretion eastern part (Transect9 to Transect18) during BD and AD were 302.6 m/yr and 48.0 m/yr, respectively (Figure 8B). However, the SHB shorelines moved continuously seaward (Figure 8K), and the shoreline accretion rates on the inner western part of Transect42 during BD and AD were 104.9 m/yr, 192.2 m/yr, respectively (Figure 8L). Meanwhile, the SHB accretion rate during BD was more significant on the inner Transect78 (Figure 8L).
4.2.3 Spatial patterns in different regions
For the spatial variations, on the Jiangsu Coast, the maximum rate was 406.9 m/yr in Transect31 and the seaward distance from 1991 to 1996 accounted for 62% of the total expansion distance (Figures 7B,E). The smallest rate was in Transect44 with advancing seaward but retreating landward rapidly (Figures 7B,D). In Transect54, the main expansion occurred from 1991 to 2001 (Figures 7B,C). Therefore, the shoreline of the Jiangsu Coast (including the MJC and SJC) gradually expanded from 1991 to 2006, whereas changed little after 2011 (Figures 7C–J).
On the YRE-HZB interface, most CW shoreline expansions occurred from 1991 to 2001 with the maximum rate (Figure 8E), and 70% occurred from 2001 to 2006 in Transect60 (Figure 8C). On the ES, the shoreline pushed 4,718 m seaward from 2001 to 2006 in Transect9 and accreted 3,529 m seaward from 2016 to 2021 in Transect21 (Figures 8I,J). In particular, the SHB shoreline experienced two expansions in Transect11 (Figure 8O) and gradually pushed seaward after 1996 in Transect46 (Figure 8N). Generally, there was a shoreline accretion trend after 2011.
5 Discussion
5.1 Impacts of natural hydrodynamic-sediment coupling environments
5.1.1 Sediment supply and interface exchange
Estuarine sediment supply from upstream rivers provides adequate sediment sources for the coastal zone (Long et al., 2022), enhancing the possibility of shoreline seaward progradation. The sediments carried by the YZR were served as the most crucial element of the HZB (He et al., 2016). There was a sharp decrease in the SSD of the YZR during the following 5 years after the Three Gorges Dam construction in 2002 (Figure 9) (Gao and Wang, 2008; Yang et al., 2018; Lu et al., 2020). Comparatively, the QTR was 2 orders of magnitude smaller than the YZR and had a weak impact on geomorphological changes and shoreline expansions (Figure 9B).
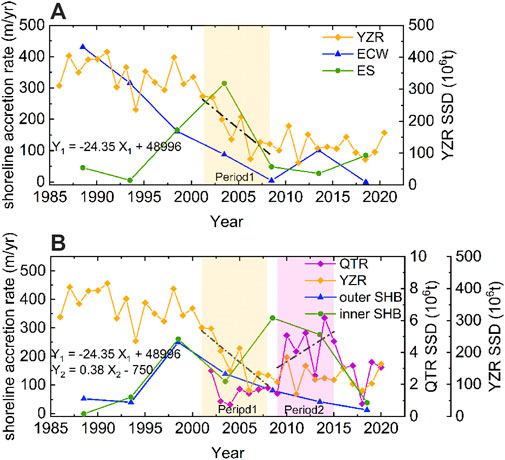
FIGURE 9. The relationship between shoreline accretion rate and suspended sediment load (SSD). (A) SSD at Datong station of the Yangtze River (YZR), and its impact on the Eastern Chongming Wetland [ECW, Transect9-Transect18 of the Chongming Wetland (CW)] and Eastern Shanghai (ES, Transect1-Transect27); (B) SSD of the Yangtze River (YZR) and Qiantang River (QTR), and their impacts on the outer and inner southern Hangzhou Bay (SHB). The YZR SSD was sharply reduced with a rate of −24.35 Mt/yr in Period1 and the QTR SSD was slightly increased with a rate of 0.38 Mt/yr in Period2.
We compared the relationship between the shoreline change and the sediment supply carried by the YZR and QTR (Figures 9A,B), suggesting a very close positive correlation between the 5-year averaged shoreline change of the ECW and the amount of SSD at Datong Station (Figure 9A). Nevertheless, the correlation did not exist on the ES and SHB (Figures 9A,B), and the increase of coastal deposition contributed to the land enclosure caused by human reclamations might be a crucial contributor (van der Wal et al., 2002; Xie et al., 2017). The relationship on the ECW could be described as:
Based on the sediment budget scheme of the YRE and HZB interface exchange proposed by Xie et al. (2017), the SSD from the YRE to the eastern HZB decreased by 140 Mt/yr (230–370) and increased by 11 Mt/yr (186–175), respectively (Figure 10), indicating the sediment compensation from the outer YRE. The sediment transported to HZB decreased by only 13 Mt/yr (122–135) and the SSD on the YRE and eastern HZB interface decreased by 44 Mt/yr (186–230), while on the eastern HZB and Zhejiang Coast interface remained unchanged (85–85) (Figure 10). Our result revealed that there was a significant shoreline accretion trend of the inner HZB after 2006 despite the SSD reduction (Figures 8K–O, 9B). Therefore, it can be inferred that the erosion response of the SSD reduction mainly occurred outside the HZB, while the sediment was compensated inside the HZB supplied by local reclamation activities (Xie et al., 2017).
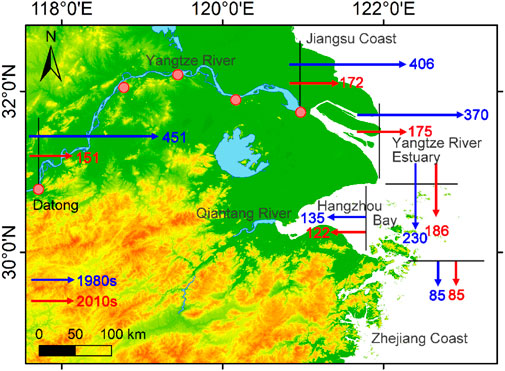
FIGURE 10. Sediment flux model on the Yangtze River Estuary (YRE) and Hangzhou Bay (HZB) interface from Xie et al. (2017). Blue lines show the sediment flux in the 1980s and red lines show the result in the 2010s, which could be associated with shoreline changes from remote sensing data. The unit of the sediment flux is Mt/year.
5.1.2 Tide- and wave-induced sediment transport
The suspended sediment transport process is one of the major forces driving the present-day coastal geomorphology and shoreline evolution (Xing et al., 2012; Xiong et al., 2017). The northerly wind in winter carried sediments to transport along the southward SBCC (Ren, 1986; Zhu et al., 1986; Yuan and Hsueh, 2010), while some residual sediments carried by the YZR entered HZB southward (He et al., 2016) (Figures 11A,B).
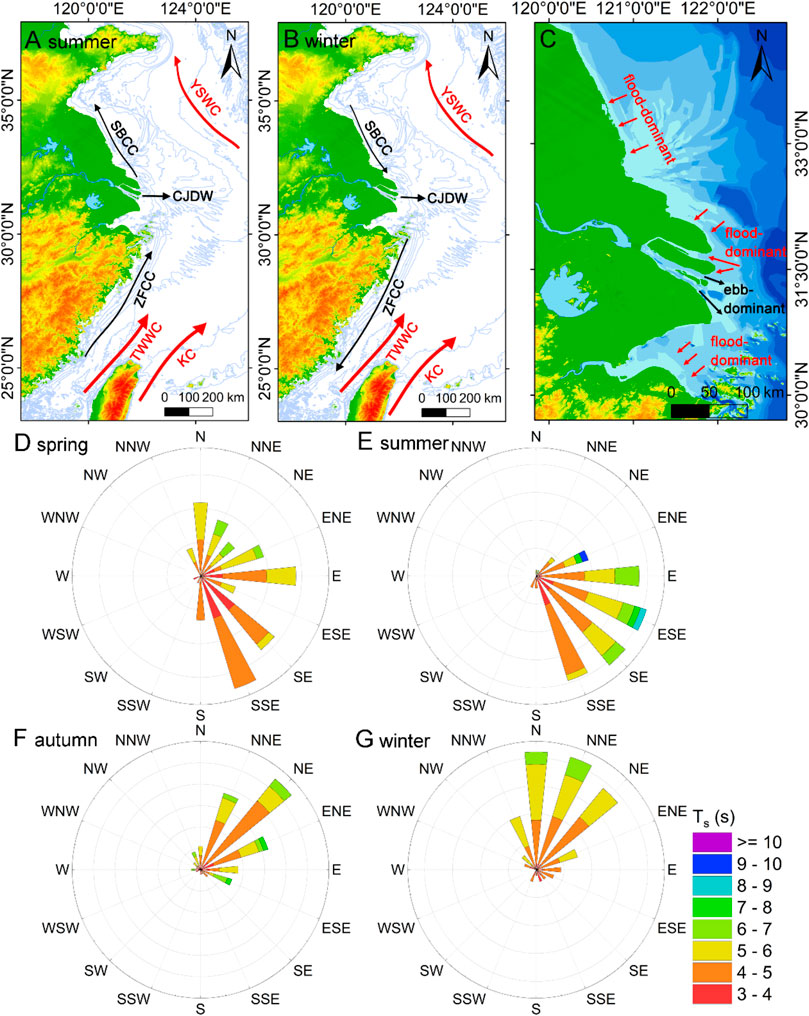
FIGURE 11. The tide and wave characteristics. Circulation systems in (A) summer; (B) winter (YSWC: The Yellow Sea Warm Current; SBCC: The Subei Coastal Current; CJDW: The Changjiang Diluted Water; ZFCC: Zhejiang-Fujian Coastal Current; TWWC: Taiwan Warm Current; and KC: Kuroshio Current); (C) division of flood-/ebb-dominant currents in typical areas with shoreline changes; (D–G) the seasonal wave direction and wave period (
The tide was demonstrated as the dominant factor influencing suspended sediment distribution (Xing et al., 2012). Most of the Jiangsu Coast was dominated by the flood-dominant tidal asymmetry (Figure 11C), and was contributed to the net landward sediment replenished by the offshore radial sand ridges (Dronkers, 1986; Wang et al., 2012). The northern channel of the ECW was flood-dominant due to the weak runoff and strong tide (Chen and Chen, 2003) (Figure 11C), and the shoreline accretion of the northeastern and eastern parts was mainly supplied by the longshore sediment transport. In contrast, the southern shore was ebb-dominant (Lou et al., 2022). Thus, the ECW shoreline expansion was mainly in the northeastern and eastern parts (Figures 8A–E). The SHB was flood-dominant (Figure 11C), and the sediment resuspension and transport caused by strong tidal currents were the main contributors to maintaining high concentrations in the HZB (Shi, 2011).
Additionally, the evident seasonal waves contributed to the seasonality of sediment concentration (Du et al., 2019). The wave direction was south or southeast in spring and summer and north or northeast in autumn and winter (Figures 11D–G), and the wave height in autumn and winter was much more significant than that in spring and summer under normal conditions (Dong et al., 2011). Generally, waves enhanced the sediment resuspension and favored the nearshore sediment erosion/deposition.
5.2 Impacts of human intervention dominated by reclamations
5.2.1 The reclamation impact on calm weather conditions
The intensive reclamations including coastal engineering constructions and vegetation planting in the YRDUA (accounted for 39.7% in China from 1985 to 2010) were mainly constructed in muddy estuaries and coasts (Wu et al., 2016), promoting shoreline progradation. Generally, the reclamation was the most intensive from 1995 to 2000 in the YRE and increased continuously on the SHB (Figure 12).
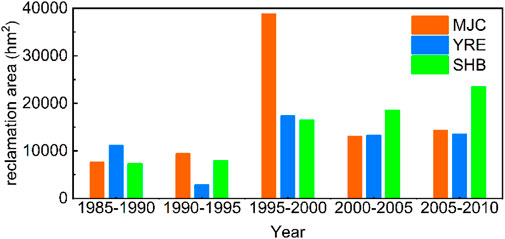
FIGURE 12. The reclamation area trend in the most heavily reclaimed middle Jiangsu Coast (MJC), Yangtze River Estuary [YRE, including the Chongming Wetland (CW) and the eastern Shanghai (ES)], and southern Hangzhou Bay (SHB) from 1985 to 2010.
Continuous reclamation largely depends on the sediment accumulation rate in coastal zones (Du et al., 2019). Meanwhile, reclamation interrupts tidal currents, and limits sediment-carrying capacities, eventually transforming sediment transport patterns and promoting erosion and deposition (Wang et al., 2012). The SHB shoreline seaward trend was on account of the anthropogenic reclamation intervention with the increased sediment resuspension induced by the seabed erosion (He et al., 2013; Liu and Wu, 2015; Xie et al., 2017). However, the SSD transported to the SHB has decreased by 13 Mt/yr (122–135) although the continued erosion of the outer HZB replenished suspended sediments (Figure 10) (Xie et al., 2013). Therefore, the geomorphology and shoreline changes within the SHB require decades of long-term scale modelings (Xie et al., 2017).
Vegetation planting is a typical anthropogenic process affecting coastal wetland expansions and shoreline changes (Zhang et al., 2020). Spartina alterniflora was introduced to resist coastal erosion and promote deposition and sedimentation on the Jiangsu Coast in 1979 and ECW in 1995, respectively (Yuan et al., 2011; Du et al., 2019). In the salt marsh ecosystem, the introduced S. alterniflora species has a strong expansion rate and can occupy a lower ecological niche compared with native species (Zhang et al., 2004; Huang and Zhang, 2007; Zhu et al., 2012). Native and introduced vegetations increased the deposition rate by 2–3 times compared with bare flats (Wang et al., 2005), and this ecological response explained the internal mechanisms of salt marshes and bare flats (Lou et al., 2022), enhancing shoreline progradation process when bare flats migrate seaward.
5.2.2 The reclamation impact on coastal flood risks
The tidal flat reclamation is demonstrated to profoundly enhance the hydrodynamic processes, and thus, contribute to the increase in wave heights (Loder et al., 2009; Liu et al., 2019; Zhang et al., 2021). For coasts with fast shoreline accretion rates, reclamations have a suppressed and weakened impact on the potential nearshore waves and coastal flood risks (Zhang et al., 2018). For vegetation planting of saltmarshes on the intertidal flat, the vegetation induced increasing bottom friction and drag force and remarkable feature of the wave attenuation (Vuik et al., 2016; Du et al., 2019). The wide and shallow tidal flat before the reclamation could efficiently reduce the wave height by the rate of 35% with the wind speed of 20 m/s and the wind angle normal to the shoreline. Therefore, the reclamation has occupied the wide intertidal flat and its internal saltmarsh, and coastal wetlands become less resistant to wind and waves during storm surges conditions (Zhang et al., 2021).
The intertidal flat and coastal wetland conservation will be highlighted due to the reclamation via human intervention under the global trend of sea-level rise and increasing extreme events (Kirwan et al., 2016). In response to the more frequent coastal flood hazards due to tidal flat losses, a nature-based solution considering physical environments such as sediment availability (including the sediment supply and transport) and ecological values such as vegetation consolidation is more attractive rather than the straightforward seawall heightening approach (Zhang et al., 2021).
5.3 Dynamic spatial patterns of shoreline changes
The key areas of shoreline changes showed different spatial distribution patterns during BD and AD (Figure 13). Generally, the shoreline accretion and progradation occurred widely during BD and AD except for some slight erosion with -23.6 m/yr near the Abandoned Yellow River Delta during AD (Figures 1, 13). Specifically, the MJC shoreline during BD was in a state of increasing seaward accretion rate from the northern to the southern part, while during AD was transformed from slight erosion and decrement to significant deposition and progradation. The eastern part of the ECW during BD experienced an extremely rapid progradation rate of 302.6 m/yr, but during AD the accretion rate was similar to the SJC and the northern ECW, which was only 16% of before. Both shorelines of the ES and the inner SHB were in a much greater expansion state during AD than BD despite the sediment supply reduction. However, the outer SHB progradation trend was hindered during AD (Figure 13). Since the shoreline was distinguished by coastal deposits or vegetations, our ECW shoreline accretion rate statistics of 45.7–48.0 m/yr during AD were similar to the salt marsh expansion rate of 39.5–60.6 m/yr proposed by Lou et al. (2022).
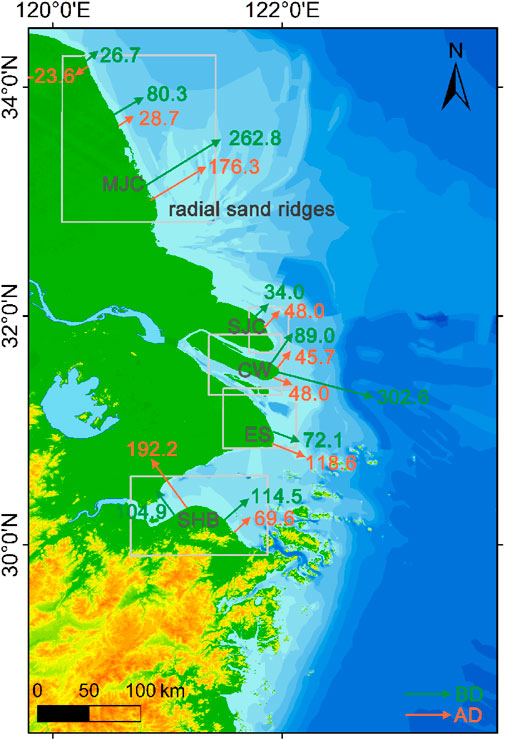
FIGURE 13. Spatial patterns of shoreline changes before the dam construction in 2002 (during BD, the green line) and after the dam construction in 2002 (during AD, the orange line). The schematic diagrams of typical areas with shoreline changes [including the middle Jiangsu Coast (MJC) with the adjacent radial sand ridges, southern Jiangsu Coast (SJC), Chongming Wetland (CW), eastern Shanghai (ES), and southern Hangzhou Bay (SHB)] are marked by gray wireframes. The unit of shoreline change rate is m/year. The seaward direction is positive and the landward direction is negative.
The dynamic spatial patterns have summarized and predicted the YRDUA shoreline changes in the future. Generally, the shorelines are unlikely to maintain the same seaward advance rate as before since the oppression of upstream sediment reduction induced delta system transformation, but keep pushing seaward compensated by the sediment transport from the delta-front erosion or radial sand ridges supplement. However, the intensive land reclamation has promoted the shoreline progradation more rapidly during AD on the ES and inner SHB (Figure 13), and has remained existing coastal water losses and shoreline accretion after 2015 (Figures 6, 8). The future geomorphic evolution still needs to be investigated, simulated and predicted on a longer time scale as the change of land reclamation intensity supported by government policies or economic growth, and the outer sea gradually reaching its seabed erosion critical threshold oppressed by the delta system transformation.
6 Conclusion
As a representative region oppressed by the sediment supply reduction and reclamation activities, the YRDUA shorelines have undergone dynamic changes. Remote sensing technology was proposed to evaluate the vulnerability of coastal wetlands at a large spatial scale and long-term scale. We investigated the coastal surface water variations from remote sensing images, distinguished the dynamic shoreline changes temporally, and discussed the internal and external driving forces of shoreline changes.
The total shoreline progradation increased incrementally in the YRDUA. The shoreline expansion rate adjacent to the radial sand ridges was 4–5 times that of other coastal areas in Jiangsu, but the shoreline on the northern MJC has experienced slight erosions. Specifically, there was a positive correlation between the shoreline accretion rate and the amount of sediment supply on the ECW. However, the sediment supply was still sufficient to support the shoreline expansion on the coasts of the YRE-HZB interface on the premise of the upstream sediment reduction, although the accretion rate has slowed down. The ES and inner SHB were exceptions, as accretion rates have been expedited even after 2015, mainly for the extremely intensive land reclamation activities.
Human interventions, dominated mainly by land reclamations (including the external coastal engineering constructions and internal ecological vegetation planting), affected intertidal flat mechanisms and shoreline changes. The continuous reclamation in recent decades was determined by sediment accumulation rates to some extent. On the one hand, under the background of the delta system transformation with upstream sediment decline, the hydrodynamic-sediment coupling process caused by waves and currents formed different seaward expansion degrees and provided sufficient sediments for the reclamation on inner coasts. On the other hand, anthropogenic reclamation enhanced hydrodynamic morphology and increased coastal flood hazard risks due to tidal flat losses. A nature-based solution considering the sediment availability and ecological value is more attractive for coastal wetland conservation.
Data availability statement
The original contributions presented in the study are included in the article/supplementary material, further inquiries can be directed to the corresponding authors.
Author contributions
CL and YW put forward the idea, designed the experiments and funded the study. TL processed the main measurements/experiments data and completed the major sections of the manuscript. HW and YC helped making general changes and improvements to the article. MZ helped processing partial data. YS reviewed this article and made suggestions to improve it. All authors contributed to manuscript revision, read, and approved the submitted version.
Funding
Financial support was provided by the Research Project of Nanjing Research Institute of Surveying, Mapping and Geotechnical Investigation, Co., Ltd. (2021RD02), the Innovation Program of Shanghai Municipal Education Commission (2019-01-07-00-05-E00027) and the National Natural Science Foundation of China (U2240220).
Acknowledgments
We thank Xiangyu Nie, Shibing Zhu, and Junhao Fu for their assistance in providing suggestions and checking out the manuscript.
Conflict of interest
Authors TL, CL, MZ, and YS were employed by Nanjing Research Institute of Surveying, Mapping and Geotechnical Investigation Co., LTD.
The remaining authors declare that the research was conducted in the absence of any commercial or financial relationships that could be construed as a potential conflict of interest.
The authors declare that this study also received funding from Geotechnical Investigation, Co., Ltd. The funder was not involved in the study design, collection, analysis, interpretation of data, the writing of this article or the decision to submit it for publication.
Publisher’s note
All claims expressed in this article are solely those of the authors and do not necessarily represent those of their affiliated organizations, or those of the publisher, the editors and the reviewers. Any product that may be evaluated in this article, or claim that may be made by its manufacturer, is not guaranteed or endorsed by the publisher.
References
Addo, K. A. (2013). Shoreline morphological changes and the human factor. Case study of Accra Ghana. J. Coast. Conserv. 17 (1), 85–91. doi:10.1007/s11852-012-0220-5
Allen, J. R. L. (2000). Morphodynamics of holocene salt marshes: A review sketch from the atlantic and southern north sea coasts of europe. Quat. Sci. Rev. 19 (12), 1155–1231. doi:10.1016/S0277-3791(99)00034-7
Blum, M. D., and Roberts, H. H. (2009). Drowning of the Mississippi Delta due to insufficient sediment supply and global sea-level rise. Nat. Geosci. 2 (7), 488–491. doi:10.1038/ngeo553
Carriquiry, J. D., Sánchez, A., and Camacho-Ibar, V. F. (2001). Sedimentation in the northern Gulf of California after cessation of the Colorado River discharge. Sediment. Geol. 144 (1-2), 37–62. doi:10.1016/s0037-0738(01)00134-8
Chen, B., Xiao, X., Li, X., Pan, L., Doughty, R., Ma, J., et al. (2017). A mangrove forest map of China in 2015: Analysis of time series Landsat 7/8 and Sentinel-1A imagery in Google Earth Engine cloud computing platform. ISPRS J. Photogrammetry Remote Sens. 131, 104–120. doi:10.1016/j.isprsjprs.2017.07.011
Chen, D., Li, M., Zhang, Y., Zhang, L., Tang, J., Wu, H., et al. (2020). Effects of diatoms on erosion and accretion processes in saltmarsh inferred from field observations of hydrodynamic and sedimentary processes. Ecohydrology 13 (8), 1–15. doi:10.1002/eco.2246
Chen, J., and Chen, S. (2003). The changes of ecologic environment in Yangtze River estuary and some suggestions for estuary regulation. Water Resour. Hydropower 34 (01), 19–25. (in Chinese with English Abstract).
Costanza, R., Mooney, H. A., Capistrano, D., Carpenter, S. R., Chopra, K., Cropper, A., et al. (2006). Nature: The many benefits of ecosystem services. Nature 443, 749. doi:10.1038/443749a
Dai, Y., Daiki, I., Jeison, S., and Pavelsky, T. M. (2019). MERIT Hydro: A high‐resolution global hydrography map based on latest topography dataset. Water Resour. Res. 55 (6), 5053–5073. doi:10.1029/2019WR024873
Dai, Z., Liu, J. T., Fu, G., and Xie, H. (2013). A thirteen-year record of bathymetric changes in the North Passage, Changjiang (Yangtze) estuary. Geomorphology 187 (4), 101–107. doi:10.1016/j.geomorph.2013.01.004
Dong, L. X., Guan, W. B., Chen, Q., Li, X. H., Liu, X. H., and Zeng, X. M. (2011). Sediment transport in the Yellow Sea and east China sea. Estuar. Coast. Shelf Sci. 93 (3), 248–258. doi:10.1016/j.ecss.2011.04.003
Dronkers, J. (1986). Tidal asymmetry and estuarine morphology. Neth. J. Sea Res. 20 (2-3), 117–131. doi:10.1016/0077-7579(86)90036-0
Du, J., Shi, B., Li, J., and Wang, Y. P. (2019). “Muddy coast off Jiangsu, China: Physical, ecological, and anthropogenic processes,” in Sediment dynamics of Chinese muddy coasts and estuaries, 25–49.
Fagherazzi, S., Mariotti, G., Leonardi, N., Canestrelli, A., and Kearney, W. S. (2020). Salt marsh dynamics in a period of accelerated sea level rise. JGR. Earth Surf. 125, e2019JF005200. doi:10.1029/2019JF005200
Farr, T. G., Rosen, P. A., Caro, E., Crippen, R., Duren, R., Hensley, S., et al. (2007). The shuttle radar topography mission. Rev. Geophys. 45 (2), RG2004. doi:10.1029/2005rg000183
Foster, N. M., Hudson, M. D., Bray, S., and Nicholls, R. J. (2013). Intertidal mudflat and saltmarsh conservation and sustainable use in the UK: A review. J. Environ. Manag. 126, 96–104. doi:10.1016/j.jenvman.2013.04.015
Gao, S., and Wang, Y. P. (2008). Changes in material fluxes from the Changjiang River and their implications on the adjoining continental shelf ecosystem. Cont. Shelf Res. 28 (12), 1490–1500. doi:10.1016/j.csr.2007.02.010
Gao, Y., Wang, H., Su, F., and Liu, G. (2013). Spatial and temporal of continental coastalline of China in recent three decades. Acta Oceanol. Sin. 35 (6), 31–42. (in Chinese with English Abstract).
He, X., Bai, Y., Pan, D., Huang, N., Dong, X., Chen, J., et al. (2013). Using geostationary satellite ocean color data to map the diurnal dynamics of suspended particulate matter in coastal waters. Remote Sens. Environ. 133, 225–239. doi:10.1016/j.rse.2013.01.023
He, Z., Huangfu, K., Yuan, Y., Song, D., and Li, L. (2016). Variations of temperature, salinity and current in the southern tidal passage of the Hangzhou Bay, China. Acta Oceanol. Sin. 35 (3), 30–37. doi:10.1007/s13131-016-0819-8
Huang, H. M., and Zhang, L. Q. (2007). The spatio-temporal dynamics of salt marsh vegetation for chongming dongtan national nature reserve, Shanghai. Acta Ecol. Sin. 27 (10), 4166–4172. (in Chinese with English Abstract).
Kirwan, M. L., Temmerman, S., Skeehan, E. E., Guntenspergen, G. R., and Fagherazzi, S. (2016). Overestimation of marsh vulnerability to sea level rise. Nat. Clim. Chang. 6 (3), 253–260. doi:10.1038/nclimate2909
Langston, A. K., Vinent, O. D., Herbert, E. R., and Kirwan, M. L. (2020). Modeling long‐term salt marsh response to sea level rise in the sediment‐deficient Plum Island Estuary, MA. Limnol. Oceanogr. 65, 2142–2157. doi:10.1002/lno.11444
Li, J., and Zhang, C. (1998). Sediment resuspension and implications for turbidity maximum in the Changjiang Estuary. Mar. Geol. 148 (3-4), 117–124. doi:10.1016/S0025-3227(98)00003-6
Li, S., Dragicevic, S., Castro, F. A., Sester, M., Winter, S., Coltekin, A., et al. (2016). Geospatial big data handling theory and methods: A review and research challenges. ISPRS J. Photogrammetry Remote Sens. 115, 119–133. doi:10.1016/j.isprsjprs.2015.10.012
Li, X., Zhou, Y., Zhang, L., and Kuang, R. (2014). Shoreline change of chongming dongtan and response to River Sediment load: A remote sensing assessment. J. Hydrology 511, 432–442. doi:10.1016/j.jhydrol.2014.02.013
Li, Y., Jia, J., Zhu, Q., Cheng, P., Gao, S., and Wang, Y. P. (2018). Differentiating the effects of advection and resuspension on suspended sediment concentrations in a turbid estuary. Mar. Geol. 403, 179–190. doi:10.1016/j.margeo.2018.06.001
Liu, G. S., and Wu, X. G. (2015). Study on dynamics geomorphology evolution of Huibieyang zone in recent ten years. J. Sediment Res. 3, 42–48. (in Chinese with English Abstract).
Liu, X., Wang, Y., Costanza, R., Kubiszewski, I., Xu, N., Yuan, M., et al. (2019). The value of China's coastal wetlands and seawalls for storm protection. Ecosyst. Serv. 36, 100905. doi:10.1016/j.ecoser.2019.100905
Liu, Z., Huang, Y., and Zhang, Q. (1989). Tidal current ridges in the southwestern Yellow Sea. J. Sediment. Res. 59 (3), 432–437. doi:10.1306/212F8FB7-2B24-11D7-8648000102C1865D
Loder, N. M., Irish, J. L., Cialone, M. A., and Wamsley, T. V. (2009). Sensitivity of hurricane surge to morphological parameters of coastal wetlands. Estuar. Coast. Shelf Sci. 84 (4), 625–636. doi:10.1016/j.ecss.2009.07.036
Long, C., Dai, Z., Wang, R., Lou, Y., Zhou, X., Li, S., et al. (2022). Dynamic changes in mangroves of the largest delta in northern Beibu Gulf, China: Reasons and causes. For. Ecol. Manag. 504, 119855–119866. doi:10.1016/j.foreco.2021.119855
Long, C., Dai, Z., Zhou, X., Mei, X., and Mai Van, C. (2021). Mapping mangrove forests in the red river delta, vietnam. For. Ecol. Manag. 483, 118910–118923. doi:10.1016/j.foreco.2020.118910
Lou, Y., Dai, Z., Long, C., Dong, H., Wei, W., and Ge, Z. (2022). Image-based machine learning for monitoring the dynamics of the largest salt marsh in the Yangtze River Delta. J. Hydrology 608, 127681–127694. doi:10.1016/j.jhydrol.2022.127681
Lu, S., Jia, L., Zhang, L., Wei, Y., Baig, M. H. A., Zhai, Z., et al. (2016). Lake water surface mapping in the Tibetan Plateau using the MODIS MOD09Q1 product. Remote Sens. Lett. 8 (3), 224–233. doi:10.1080/2150704x.2016.1260178
Lu, T., Wu, H., Zhang, F., Li, J., Zhou, L., Jia, J., et al. (2020). Constraints of salinity- and sediment-induced stratification on the turbidity maximum in a tidal estuary. Geo-Mar. Lett. 40 (5), 765–779. doi:10.1007/s00367-020-00670-8
Nobre, A. D., Cuartas, L. A., Hodnett, M., Rennó, C. D., Rodrigues, G., Silveira, A., et al. (2011). Height above the nearest drainage – A hydrologically relevant new terrain model. J. Hydrology 404 (1-2), 13–29. doi:10.1016/j.jhydrol.2011.03.051
Pardo-Pascual, J. E., Almonacid-Caballer, J., Ruiz, L. A., and Palomar-Vázquez, J. (2012). Automatic extraction of shorelines from Landsat TM and ETM+ multi-temporal images with subpixel precision. Remote Sens. Environ. 123, 1–11. doi:10.1016/j.rse.2012.02.024
Ren, M. e. (1986). Comprehensive investigation of the coastal zone and tidal land resources of Jiangsu Province. Beijing: Ocean Press.
Pesaresi, M., Ehrlich, D., Ferri, S., Florczyk, A., Freire, A., Stamatia, H., et al. (2016). Operating procedure for the production of the Global Human Settlement Layer from Landsat data of the epochs 1975, 1990, 2000, and 2014. European Commission: JRC Technical Reports, 1–62.
Shi, J. Z. (2011). Tide-induced fine sediment resuspension in the well-mixed Hangzhou bay, east China sea, China. Earth Environ. Sci. Trans. R. Soc. Edinb. 102 (1), 25–34. doi:10.1017/s1755691011010061
Stanley, D. J., and Warne, A. G. (1993). Nile delta: Recent geological evolution and human impact. Science 260 (5108), 628–634. doi:10.1126/science.260.5108.628
Syvitski, J. P. M., Kettner, A. J., Overeem, I., Hutton, E. W. H., Hannon, M. T., Brakenridge, G. R., et al. (2009). Sinking deltas due to human activities. Nat. Geosci. 2 (10), 681–686. doi:10.1038/ngeo629
Tamiminia, H., Salehi, B., Mahdianpari, M., Quackenbush, L., and Brisco, B. (2020). Google Earth engine for geo-big data applications: A meta-analysis and systematic review. ISPRS J. Photogrammetry Remote Sens. 164, 152–170. doi:10.1016/j.isprsjprs.2020.04.001
Temmerman, S., Meire, P., Bouma, T. J., Herman, P. M., Ysebaert, T., and De Vriend, H. J. (2013). Ecosystem-based coastal defence in the face of global change. Nature 504 (7478), 79–83. doi:10.1038/nature12859
Thieler, E. R., Himmelstoss, E. A., Zichichi, J. L., and Ergul, A. (2009). The digital shoreline analysis system (DSAS) version 4.0 - an ArcGIS extension for calculating shoreline change. doi:10.3133/ofr20081278
Tsyganskaya, V., Martinis, S., Marzahn, P., and Ludwig, R. (2018). SAR-Based detection of flooded vegetation – A review of characteristics and approaches. Int. J. Remote Sens. 39 (8), 2255–2293. doi:10.1080/01431161.2017.1420938
van der Wal, D., Pye, K., and Neal, A. (2002). Long-term morphological change in the ribble estuary, northwest england. Mar. Geol. 189 (3-4), 249–266. doi:10.1016/S0025-3227(02)00476-0
Vuik, V., Jonkman, S. N., Borsje, B. W., and Suzuki, T. (2016). Nature-based flood protection: The efficiency of vegetated foreshores for reducing wave loads on coastal dikes. Coast. Eng. 116, 42–56. doi:10.1016/j.coastaleng.2016.06.001
Wang, A., Gao, S., Jia, J., and Pan, S. (2005). Contemporary sedimentation rates on salt marshes at wanggang, Jiangsu, China. Acta Geogr. Sin. 60 (1), 61–70. (in Chinese with English Abstract).
Wang, H., Bi, N., Saito, Y., Wang, Y., Sun, X., Zhang, J., et al. (2010). Recent changes in sediment delivery by the Huanghe (Yellow River) to the sea: Causes and environmental implications in its estuary. J. Hydrology 391 (3-4), 302–313. doi:10.1016/j.jhydrol.2010.07.030
Wang, X., Xiao, X., Zou, Z., Hou, L., Li, B., Dong, J., et al. (2020). Mapping coastal wetlands of China using time series Landsat images in 2018 and Google Earth Engine. ISPRS J. Photogrammetry Remote Sens. 163, 312–326. doi:10.1016/j.isprsjprs.2020.03.014
Wang, Y. P., Gao, S., Jia, J., Thompson, C. E. L., Gao, J., and Yang, Y. (2012). Sediment transport over an accretional intertidal flat with influences of reclamation, Jiangsu coast, China. Mar. Geol. 291-294, 147–161. doi:10.1016/j.margeo.2011.01.004
Wang, Y. P., Voulgaris, G., Li, Y., Yang, Y., Gao, J., Chen, J., et al. (2013). Sediment resuspension, flocculation, and settling in a macrotidal estuary. J. Geophys. Res. Oceans 118 (10), 5591–5608. doi:10.1002/jgrc.20340
Wu, W. T., Tian, B., Zhou, Y. X., Shu, M. Y., Qi, X. Y., and Xu, W. (2016). The trends of coastal reclamation in China in the past three decades. Acta Ecol. Sin. 36 (16), 5007–5016. (in Chinese with English Abstract).
Xie, D., Gao, S., Wang, Z., and Pan, C. (2013). Numerical modeling of tidal currents, sediment transport and morphological evolution in Hangzhou Bay, China. Int. J. Sediment Res. 28 (3), 316–328. doi:10.1016/s1001-6279(13)60042-6
Xie, D., Pan, C., Wu, X., Gao, S., and Wang, Z. (2017). The variations of sediment transport patterns in the outer Changjiang Estuary and Hangzhou Bay over the last 30 years. J. Geophys. Res. Oceans 122 (4), 2999–3020. doi:10.1002/2016jc012264
Xing, F., Wang, Y. P., and Wang, H. V. (2012). Tidal hydrodynamics and fine-grained sediment transport on the radial sand ridge system in the southern Yellow Sea. Mar. Geol. 291-294, 192–210. doi:10.1016/j.margeo.2011.06.006
Xiong, J., Wang, X. H., Wang, Y. P., Chen, J., Shi, B., Gao, J., et al. (2017). Mechanisms of maintaining high suspended sediment concentration over tide-dominated offshore shoals in the southern Yellow Sea. Estuar. Coast. Shelf Sci. 191, 221–233. doi:10.1016/j.ecss.2017.04.023
Xu, F., Tao, J., Zhou, Z., Coco, G., and Zhang, C. (2016). Mechanisms underlying the regional morphological differences between the northern and southern radial sand ridges along the Jiangsu Coast, China. Mar. Geol. 371, 1–17. doi:10.1016/j.margeo.2015.10.019
Xu, H. (2006). Modification of normalised difference water index (NDWI) to enhance open water features in remotely sensed imagery. Int. J. Remote Sens. 27 (14), 3025–3033. doi:10.1080/01431160600589179
Yang, H. F., Yang, S. L., Xu, K. H., Milliman, J. D., Wang, H., Yang, Z., et al. (2018). Human impacts on sediment in the Yangtze River: A review and new perspectives. Glob. Planet. Change 162, 8–17. doi:10.1016/j.gloplacha.2018.01.001
Yang, X., Qin, Q., Yésou, H., Ledauphin, T., Zhu, Z., Grussenmeyer, P., et al. (2020). Monthly estimation of the surface water extent in France at a 10-m resolution using Sentinel-2 data. Remote Sens. Environ. 244, 111803. doi:10.1016/j.rse.2020.111803
Yuan, D., and Hsueh, Y. (2010). Dynamics of the cross-shelf circulation in the Yellow and east China seas in winter. Deep Sea Res. Part II Top. Stud. Oceanogr. 57 (19-20), 1745–1761. doi:10.1016/j.dsr2.2010.04.002
Yuan, L., Zhang, L., Xiao, D., and Huang, H. (2011). The application of cutting plus waterlogging to control Spartina alterniflora on saltmarshes in the Yangtze Estuary, China. Estuar. Coast. Shelf Sci. 92 (1), 103–110. doi:10.1016/j.ecss.2010.12.019
Zhang, M., Dai, Z., Bouma, T. J., Bricker, J., Townend, I., Wen, J., et al. (2021). Tidal-flat reclamation aggravates potential risk from storm impacts. Coast. Eng. 166, 103868. doi:10.1016/j.coastaleng.2021.103868
Zhang, R. S., Shen, Y. M., Lu, L. Y., Yan, S. G., Wang, Y. H., Li, J. L., et al. (2004). Formation of Spartina alterniflora salt marshes on the coast of Jiangsu Province, China. Ecol. Eng. 23 (2), 95–105. doi:10.1016/j.ecoleng.2004.07.007
Zhang, X., Xiao, X., Wang, X., Xu, X., Li, B., Wang, J., et al. (2020). Quantifying expansion and removal of Spartina alterniflora on Chongming island, China, using time series Landsat images during 1995-2018. Remote Sens. Environ. 247 (15), 111916. doi:10.1016/j.rse.2020.111916
Zhang, X., Zhang, Y., Zhu, L., Chi, W., Yang, Z., Wang, B., et al. (2018). Spatial-temporal evolution of the eastern Nanhui mudflat in the Changjiang (Yangtze River) Estuary under intensified human activities. Geomorphology 309, 38–50. doi:10.1016/j.geomorph.2018.02.023
Zhu, D., Ke, X., and Gao, S. (1986). Tidal flat sedimentation of Jiangsu coast. J. Oceanogr. Huanghai Bohai seas 4 (3), 19–27. (in Chinese with English Abstract).
Zhu, Z., and Woodcock, C. E. (2012). Object-based cloud and cloud shadow detection in Landsat imagery. Remote Sens. Environ. 118, 83–94. doi:10.1016/j.rse.2011.10.028
Keywords: shoreline change, Yangtze River Delta Urban Agglomerations (YRDUA), sediment supply, land reclamation, Google Earth Engine
Citation: Lu T, Lin C, Wang YP, Wu H, Zhou M, Chen Y and Shen Y (2022) Mapping the most heavily reclaimed shorelines of the Yangtze River delta urban agglomerations. Front. Earth Sci. 10:981606. doi: 10.3389/feart.2022.981606
Received: 29 June 2022; Accepted: 05 August 2022;
Published: 01 September 2022.
Edited by:
Chong Xu, National Institute of Natural Hazards, ChinaReviewed by:
Min Zhang, Shanghai Normal University, ChinaShenliang Chen, East China Normal University, China
Hualong Luan, Changjiang River Scientific Research Institute (CRSRI), China
Copyright © 2022 Lu, Lin, Wang, Wu, Zhou, Chen and Shen. This is an open-access article distributed under the terms of the Creative Commons Attribution License (CC BY). The use, distribution or reproduction in other forums is permitted, provided the original author(s) and the copyright owner(s) are credited and that the original publication in this journal is cited, in accordance with accepted academic practice. No use, distribution or reproduction is permitted which does not comply with these terms.
*Correspondence: Cong Lin, lcnju1994@163.com; Ya Ping Wang, ypwang@nju.edu.cn