The impact of persistent anomalous precipitation in Southwest China caused by low-frequency atmospheric disturbances in different latitudes and altitudes
 Tian-Gui Xiao1,2
  Lin Han
- 1Yunnan R&D Institute of Natural Disaster on Chengdu University of Information and Technology, Chengdu, Sichuan, China
- 2Chengdu University of Information and Technology, Chengdu, Sichuan, China
- 3Sichuan Meteorological Service Center, Chengdu, Sichuan, China
Previous studies have pointed out that persistent abnormal precipitation is closely related to atmospheric low-frequency oscillation, and Southwest China can be affected by low-frequency oscillation in different latitudes and altitudes. Therefore, it is necessary to study the relationship between persistent abnormal precipitation in Southwest China and low-frequency oscillation. In this study, the characteristics of atmospheric low-frequency oscillation in different latitudes and altitudes affecting persistent extreme precipitation in Southwest China were discussed by synthetic analysis and Butterworth filtering with precipitation data from meteorological stations and NCEP/NCAR reanalysis data, and the configuration relationship of low-frequency systems in three-dimensional space was shown. The results showed the following: 1) in the low-frequency circulation field, the Ural Mountains, east of Lake Baikal, the Sea of Okhotsk (Japan), the Western Pacific subtropical high control area, the South China Sea, the Indian Peninsula, and the Bay of Bengal were the key areas affecting precipitation; 2) oscillation could better reflect the original circulation characteristics at all latitudes of each layer, and on a period of oscillation of 15–30 days, it will affect precipitation at all altitudes and latitudes; and 3) at the lower level, different low-frequency cyclones and anticyclones moved to the mid-latitude and converged in different forms in the precipitation area. In the middle layer, the low-frequency high-pressure and low-pressure centers in the middle and high latitudes moved southward, finally forming a circulation situation of the high west and low east. At the upper level, the rainy area was controlled by low-frequency anticyclones and divergence centers from different regions, forming a high-altitude divergence field. The results can provide a theoretical basis for forecasting the extended period of persistent heavy rain in Southwest China.
1 Introduction
Persistent abnormal precipitation is the main cause of floods. Ding (2005) proposed that the generation of torrential rain is mainly affected by three large-scale circulation factors. Liao Qinghai and Tao Shiyan (2004) clarified that the circulation process of the East Asian summer atmospheric circulation is related to the abnormal disturbance of the quasi-stationary waves of the subtropical westerly jet. Sometimes low-latitude circulation can also cause persistent anomalous precipitation. For example, Zhou and Cheng (1987) reported that the low-level jet in Somalia may be one of the reasons for the persistent heavy rainfall in the upper reaches of the Yangtze River. He Min (2005) proposed that the interaction between the cross-equatorial airflow and the westerly circulation anomaly in the southern hemisphere may be an important factor for the formation of the continuous heavy rain in the Huaihe River in 2003. In addition to the influence of planetary-scale systems, synoptic-scale systems are the direct cause of precipitation, and persistent heavy rain is often caused by the continuous generation, convergence, strengthening, and mutual influence of several mesoscale and small-scale precipitation systems (Zhou, 2000; Liu et al., 2005).
Many studies have found that atmospheric intraseasonal oscillations are closely related to monsoon activity and persistent abnormal precipitation (Zhang et al., 1992; Li and Zhou, 1995; Kikuchi and Wang, 2009). Most of the low-frequency oscillations of precipitation result from the interaction of low-frequency systems at high and low latitudes of the atmosphere (Horel and Wallace, 1981; Li, 1990; Yang, 1990). Liang and Ding (2012) showed that the large-value area of Meiyu in East Asia is closely related to the transport of warm air at low latitudes and cold air at high latitudes (Xiao and Li, 1992). In the middle and high latitudes, the low-frequency wave trains carry cold air from the Caspian Sea to the east, and the center of the potential vortex propagates from the Sea of Okhotsk to the southwest (Barnes et al., 1983; Zhang, 1987; Luo, 1998). At low latitudes, a low-frequency northerly wind and low-frequency offset are formed in the lower layers of the precipitation area (Lu, 1994; Lu, 1994; Qiu et al., 2004; Liu and Lu, 2006). The upper layer is controlled by low-frequency divergent airflow; the low-frequency circulation at each altitude layer and the southward transport of cold air in the middle and high latitudes work together, all of which provide favorable conditions for precipitation (Lu and Ding, 1996; Mao and Wu, 2005).
Previous studies have noted that persistent anomalous precipitation is closely related to low-frequency atmospheric oscillations, and its laws have been widely used in extended-range forecasting (Hu and Chen, 1995; Xin et al., 2007). The precipitation in the southwest is also affected by the low-frequency oscillations in the middle and high latitudes, as well as low latitudes. Therefore, it is necessary to study the relationship between the persistent anomalous precipitation in the southwest and the low-frequency oscillations in various latitudes. In the existing research, most of the research objects are in South China, Jianghuai, and North China, and most of them are based on case analysis and less systematic analysis. Many studies have found that the intraseasonal oscillation of the atmosphere is closely related to the monsoon activity and persistent abnormal precipitation in China. The circulation in the Asian monsoon region mainly has 30–50-day and 10–20-day oscillation periods, together affecting the precipitation process in the monsoon region. Lorence (1984) pointed out that this process is mainly realized through the meridional propagation of low-frequency oscillation in the monsoon region. Liang and Ding (2012b) stated that the large value area of plum rain in East Asia is closely related to the transport of warm air at low latitudes and cold air at high latitudes. The research results of many scholars have drawn a similar conclusion that the tropical low-frequency oscillation brings sufficient warm and wet air during its northward propagation. In contrast, the mid-high latitude low-frequency oscillation brings cold air during its southward propagation. The confluence of cold and warm air and the superposition and interaction of the upper, middle, and lower circulation systems lead to the generation of persistent abnormal precipitation, and the low-frequency oscillation of precipitation corresponds to the low-frequency oscillation of the circulation system. At present, domestic and foreign scholars seldom study the low-frequency oscillation of persistent heavy precipitation in Southwest China. Southwest China is an important water source in China due to its complex terrain, diverse climate, and abundant rainfall. Extreme precipitation frequently occurs in the southwest region, seriously threatening the safety of people’s lives and property. The relationship between extreme precipitation and low-frequency oscillation in this study will help provide a theoretical basis for extreme precipitation prediction in this region. Therefore, this study will systematically analyze the persistent anomalous precipitation events in the southwest regions. Research materials and methods are shown in Section 2. Sources and propagation paths of low-frequency systems and configuration and evolution characteristics of low-frequency systems are shown in Section 3. The conclusion and discussion are presented in Section 4.
2 Article types
2.1 Research materials
The precipitation data used in this study are taken from the daily value data set of basic meteorological elements of China’s national surface meteorological stations (V3.0), the time period is from January 1981 to December 2016, and the southwest region’s (e.g., Yunnan province, Sichuan province, Guizhou province, Chongqing municipality) historical data of 364 sites as the research object are selected. In order to ensure the quality of the data, the stations with missing tests for more than 1 month were excluded, leaving 353 stations. The data selected for the NCEP/NCAR daily reanalysis included 500 and 200 hPa geopotential heights, 100–1,000 hPa wind fields, the time length was from January 1981 to December 2016, and the horizontal resolution was 2.5° × 2.5°.
2.2 Research methods
2.2.1 Definition of persistent abnormal precipitation
First, the regional average processing is conducted for the precipitation of stations in the study area from 1981 to 2016. The 95th percentile precipitation value with precipitation records is taken as the threshold value of extreme precipitation. If the threshold value is exceeded, it is defined as extreme precipitation. The abnormal precipitation in this area is defined as continuous abnormal precipitation if it lasts for at least three consecutive days. The first day when the regional precipitation reaches the threshold value is regarded as the 0 day when the persistent abnormal precipitation starts. The date before the precipitation starts is expressed as a negative number, and the date after the precipitation starts is expressed as a positive number.
2.2.2 Synthetic analysis
The average value of meteorological elements during several persistent abnormal precipitation periods will be calculated in turn by time to obtain the time series of composite variables. This method can be used to obtain multiple atmospheric synthetic variables during continuous precipitation.
The advantage of the Butterworth filter (Yao et al., 2005) is that it can freely choose the passband and does not cause information loss at both ends of the data. Its output function of the filter is as follows:
The above formula is the time series of a certain element of
where
where
3 Results
3.1 Sources and propagation paths of low-level and critical low-frequency systems
The time series of monthly precipitation anomaly in Southwest China was decomposed by REOF (Figure 1). The cumulative variance of the first four modes contributes 43%, and the high load area covered most areas in southwest China. The high-value area of the first rotation factor occupied most of Yunnan, the load center value is greater than 0.7, and the variance of this modal interpretation was 12.8%. The interpretation variance of the second rotation factor was 9.07%. The large load area was in northeast Sichuan, and the central value was greater than 0.7. The interpretation variance of the third rotation factor was 12.7%, the large load area was located in Guizhou province, the interpretation variance of the fourth rotation factor was 8.4%, and the large load area was located in Sichuan Basin. The big value center clearly divided the southwest region into four parts without overlapping each other, and only the western Sichuan region did not show it. However, considering the similar terrain, elevation, and climate characteristics of the western Sichuan region, the western Sichuan region was considered a separate region, as shown below.
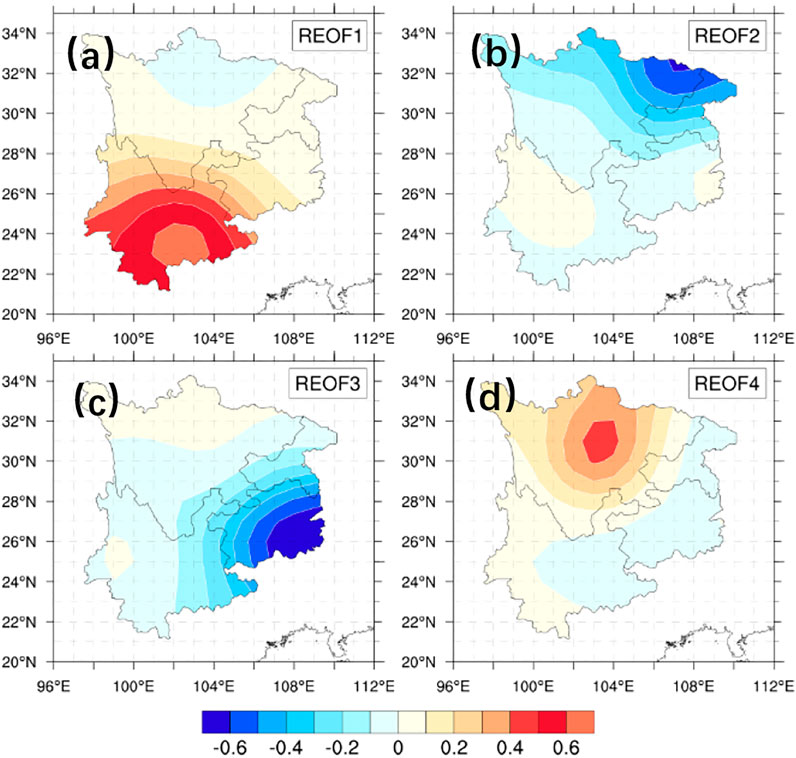
FIGURE 1. The first four REOF modes of precipitation in Southwest China (A–D) are the first, second, third, and fourth modes, respectively.
The distribution results of rainfall REOF eigenvectors showed that the precipitation in this region is inconsistent. The first four major component centers divide the southwest region into four regions. Considering the similarity of the topography and climate of the western Sichuan plateau, the western Sichuan plateau was considered a separate region. Therefore, the southwest region was divided into five regions for discussion. The time of heavy rainfall in each region and the low-frequency impact system were not uniform. Therefore, we needed to discuss each region one by one.
3.1.1 Western Sichuan area
Figure 2 shows that on the second day after the onset of precipitation, the key system remained strong, and the north–south air currents converged in this area to form precipitation. At this time, the position of the cyclone over the western Pacific was eastward, and the southeasterly airflow on the west side had not yet affected the western Sichuan area. The water vapor mainly came from the southwesterly airflow in the north of the Indian Peninsula anticyclone. Therefore, the prevailing southwesterly winds in the Indian peninsula (80°E, 10°N) can be used as the low-latitude early precipitation signal in the western Sichuan region. When there are low-frequency cyclones or low-frequency anticyclones in the north, it is conducive to the occurrence of precipitation in western Sichuan. The low-frequency cyclone in the Sea of Japan originates from the low-frequency cyclone in the Lake Baikal area moving eastward to the south, reaching the Sea of Japan area on the 0 day. Previously, the area was a southwesterly airflow, which was not conducive to the southward movement of cold air at high latitudes. The cold air comes from the low-frequency anticyclone on the east side of Lake Baikal. It can be traced back to 3 days before the start of precipitation. When the low-frequency cyclone in the area moved southeast out of the Lake Baikal area, and there was a northerly wind on the north side, it reached the area and formed an abnormal anticyclone. It is beneficial for the north wind to travel south to the western Sichuan area. A two-tailed Student’s t-test was used for the significance test. The results showed the north–south airflow in the confluence area of western Sichuan and the above key areas, where the low-frequency anticyclones and cyclones that were influenced passed the 95% significance test (p < 0.05).
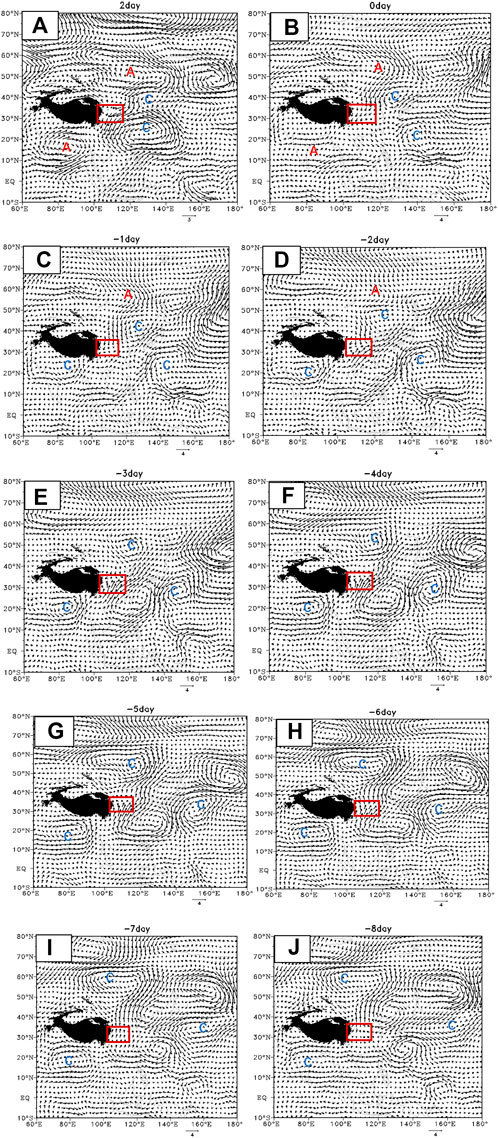
FIGURE 2. Evolution of the low-frequency (15–30 days) wind fields at 850 hPa from 8 days before the precipitation to 2 days after onset in Western Sichuan, unit: m/s (the box is the precipitation area in western Sichuan, A is the key low-frequency anticyclone, C is the key low-frequency cyclone. The same as below).
3.1.2 Basin area
At the beginning of precipitation in the basin, the key low-frequency systems in the lower layers are the low-frequency trough on the east side of Lake Baikal, the low-frequency cyclone in the Sea of Okhotsk, the low-frequency anticyclone on the southeast coast, and the low-frequency cyclone in South China. Five days before the onset of precipitation, the northern part of my country and the Sea of Japan had a southerly airflow, the Lake Baikal trough had not yet been formed, the area of the Sea of Okhotsk had a low-frequency anticyclone, and the low-frequency anticyclone near the Taiwan Strait had not been formed, showing an anticyclonic circulation, and the South China Sea is a low-frequency cyclone. Four days before the onset of precipitation, a low-frequency cyclone was formed in the vast area from Lake Baikal to northern China and gradually moved eastward to the vicinity of the Sea of Japan. Three days before the onset of precipitation, a low trough in Beihu was formed, and the southerly wind turned into a northerly wind and gradually strengthened, which transported cold air southward and merged with warm air in the basin. Therefore, the early signal of the low frequency 850 hPa in the basin is that a low-frequency cyclone was generated in the western Pacific Ocean in the first 13 days and gradually moved northwest to the South China Sea to South China. It moved eastward to the vicinity of the Sea of Okhotsk, and a low-frequency anticyclone formed and stabilized in the Taiwan Strait (Figure 3). The areas affected by cyclones and anticyclones, as well as the confluence areas of south–north airflow in the precipitation area, passed the 95% significance test (p < 0.05).
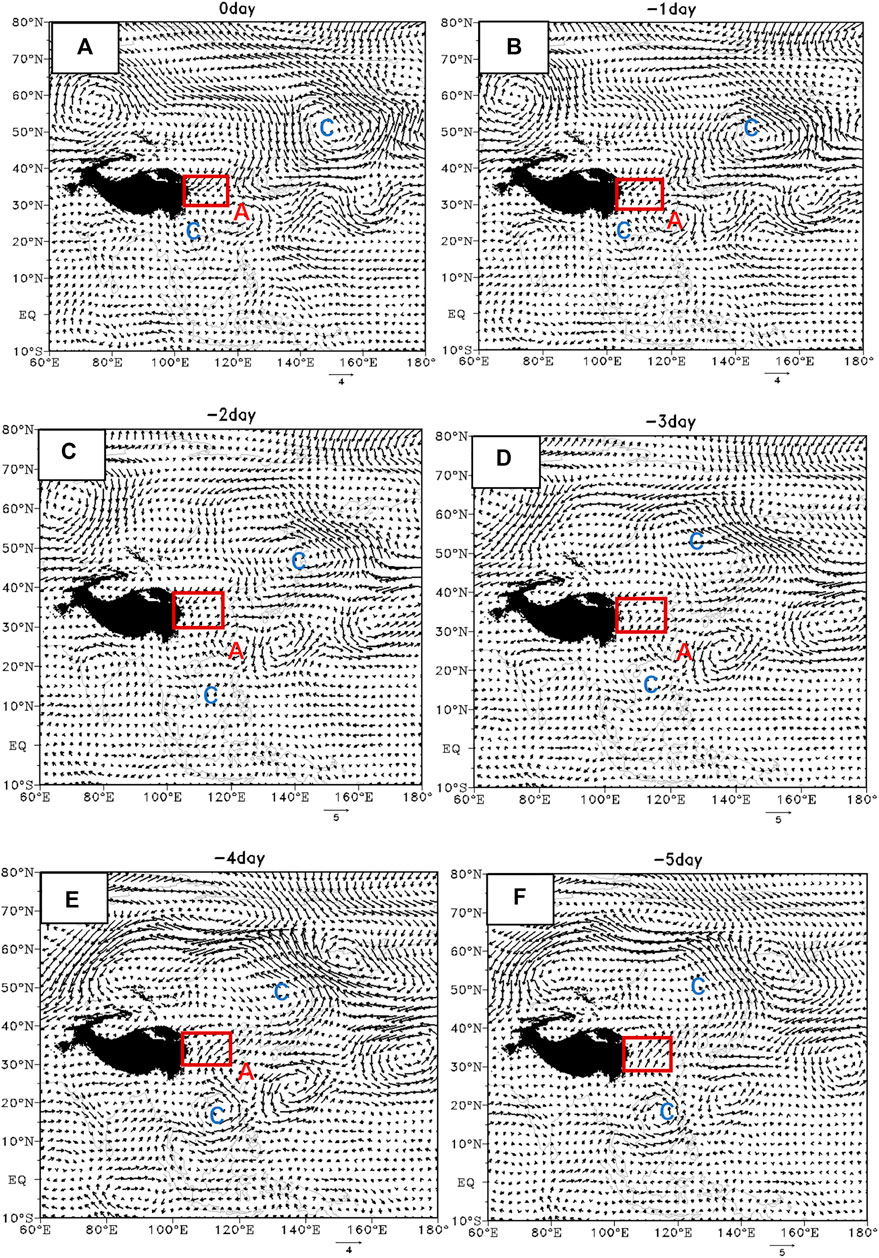
FIGURE 3. Evolution of the low-frequency (15–30 days) wind fields at 850 hPa from 5 days before the precipitation to 0 day after onset in Basin area, unit: m/s.
3.1.3 East Sichuan
In the 15–30 day low-frequency circulation field of 850 hPa in eastern Sichuan, the low-frequency systems affecting precipitation in eastern Sichuan are cyclones of various latitudes located in the east of Beihu, the East China Sea, and the Indo-China Peninsula. The north wind from the west side of the cyclone in the high latitudes moves to the south, and the west side of the cyclone in the East China Sea guides the high-latitude north wind to the middle and low latitudes, making it enter the southwest area, providing cold air for precipitation in eastern Sichuan. However, the cyclone in the Indo-China Peninsula brings precipitation to the South China Sea. The warm and humid airflow makes the cold and warm air converge in the eastern Sichuan area, forming precipitation. By observing the time evolution of the low-frequency system, it can be found that the low-frequency cyclone to the east of Beihu formed 4 days before the precipitation. The northerly wind at high latitudes was the main reason for its formation. Then the intensity gradually increased, bringing the high-latitude cold air down (Figure 4). The areas affected by cyclones and anticyclones, as well as the confluence areas of the south–north airflow in the precipitation area, passed the 95% significance test (p < 0.05).
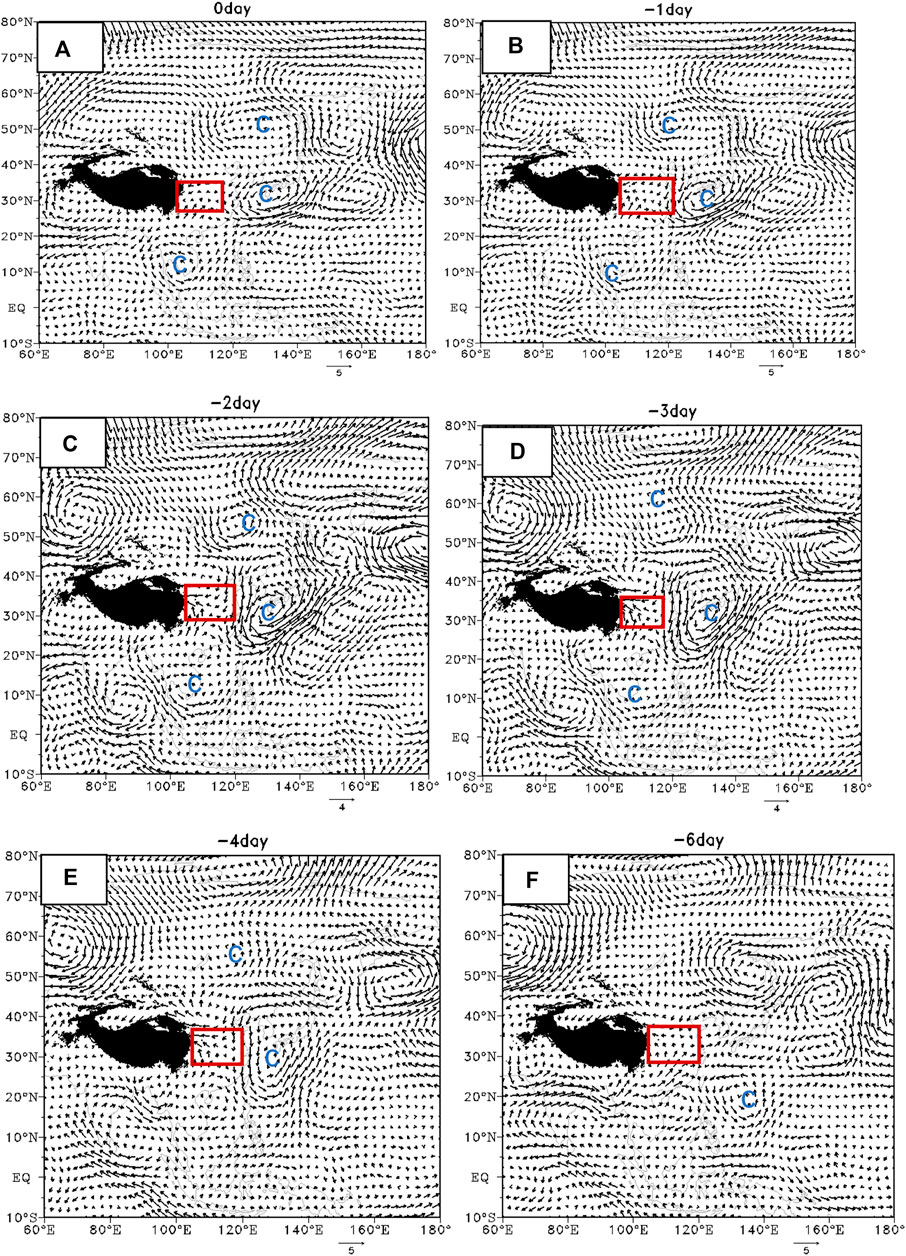
FIGURE 4. Evolution of the low-frequency (15–30 days) wind fields at 850 hPa from 6 days before the precipitation to 0 day after onset in Eastern Sichuan, unit: m/s.
3.1.4 Guizhou area
Figure 5 shows that in the low-frequency circulation field of 850 hPa in Guizhou, the main low-frequency systems affecting Guizhou are the cyclones in the Sea of Okhotsk and the anticyclones in the Northeast of China in the middle and high latitudes and the anticyclones and Indo-China Cyclones near the East China Sea in the middle and low latitudes. The warm and humid airflow mainly comes from the South China Sea and the western Pacific Ocean. The anticyclone to the east of the East China Sea formed 2 days before the precipitation and then developed and expanded, bringing water vapor from the western Pacific to Guizhou. The Indo-China Peninsula cyclone formed on the ocean centered at 5°N, 110°E, and 4 days before the precipitation and then moved northward to the Indo-China Peninsula, bringing South China Sea vapor to Guizhou. The areas affected by cyclones and anticyclones, as well as the confluence areas of south–north airflow in the precipitation area, passed the 95% significance test (p < 0.05).
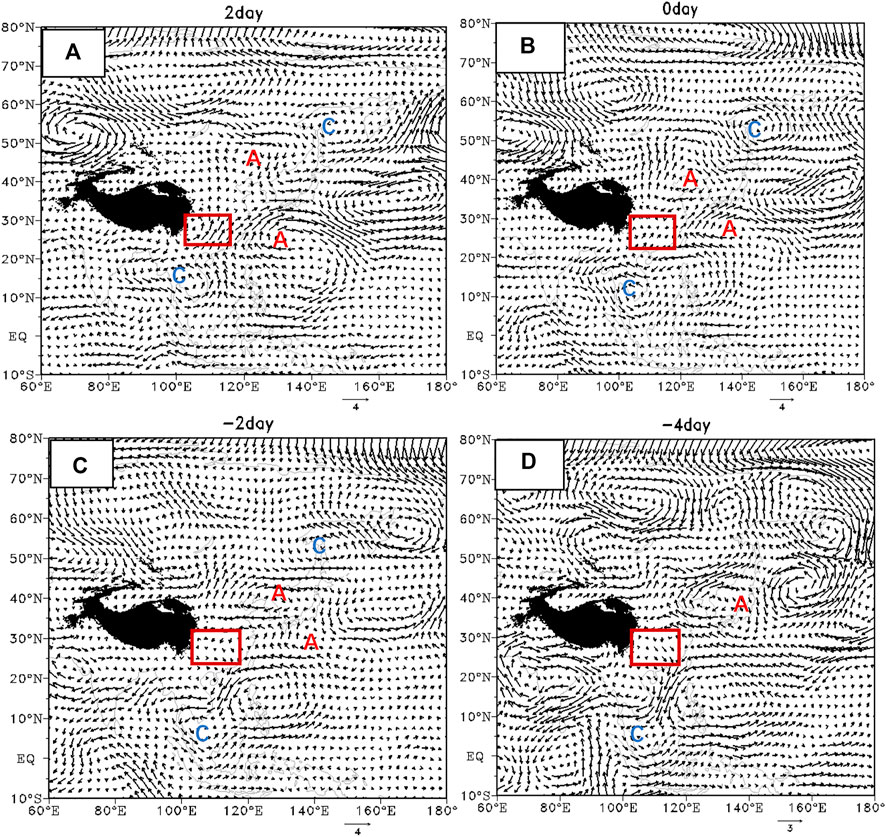
FIGURE 5. Evolution of the low-frequency (15–30 days) wind fields at 850 hPa from 4 days before the precipitation to 0 day after onset in Guizhou Sichuan, unit: m/s.
3.1.5 Yunnan region
In the low-level of the low-frequency circulation field in Yunnan (Figure 6), the key low-frequency systems that affect precipitation were the cyclone in northeastern China and the Bay of Bengal cyclone. These two low-frequency cyclones formed at the same time 3 days before the precipitation. The high-latitude cold air on the west side of the low-frequency cyclone in the Sea of Okhotsk caused northeastern China to be controlled by the northerly wind, which led to the formation of a cyclonic circulation near the Sea of Japan. Subsequently, the cyclone continued to strengthen in this area, increasing the northerly wind going southward. A low-frequency anticyclone exists near the equator in the southern part of the Lake Baikal of Bengal. Its north side has a westerly wind component, which promotes the formation of a low-frequency cyclone in the northern part of the anticyclone. During the precipitation period, the cyclone intensifies, and the southwesterly airflow enters the Yunnan area and merges with the southeasterly wind from the middle and high latitudes. The areas affected by cyclones and anticyclones, as well as the confluence areas of the south–north airflow in the precipitation area, passed the 95% significance test (p < 0.05).
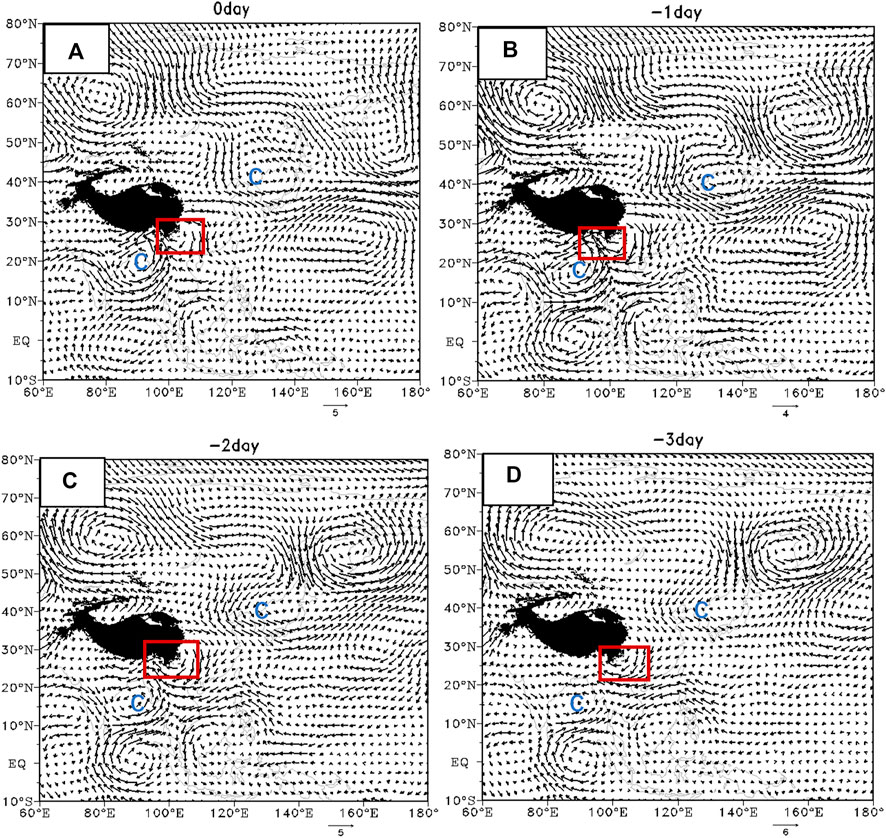
FIGURE 6. Evolution of the low-frequency (15–30 days) wind fields at 850 hPa from 3 days before the precipitation to 0 day after onset in Yunnan region, unit: m/s.
3.2 Sources and propagation paths of mid-level critical low-frequency systems
3.2.1 Western Sichuan
Figure 7 shows that the key low-frequency systems that affect the persistent precipitation in western Sichuan are similar to the low-frequency circulation with an average of 500 hPa during the precipitation period. There is a low-frequency low pressure near northeastern China and the Sea of Japan. It can be seen that the early middle-level signals affecting the persistent precipitation in western Sichuan are those in the first 15 days, there was 15–30-day low-frequency high pressure generated in the Barents Sea, and 14 days before the precipitation, low-frequency low pressure on 15–30 days was generated in Northwest Asia. These two systems tended to the southwest direction, moving to the Beihu area and northeast China and the vicinity of the Sea of Japan, which is beneficial to the cold air affecting the western Sichuan area to form precipitation. Low-frequency high voltage center and low voltage center passed the 95% significance test (p < 0.05).
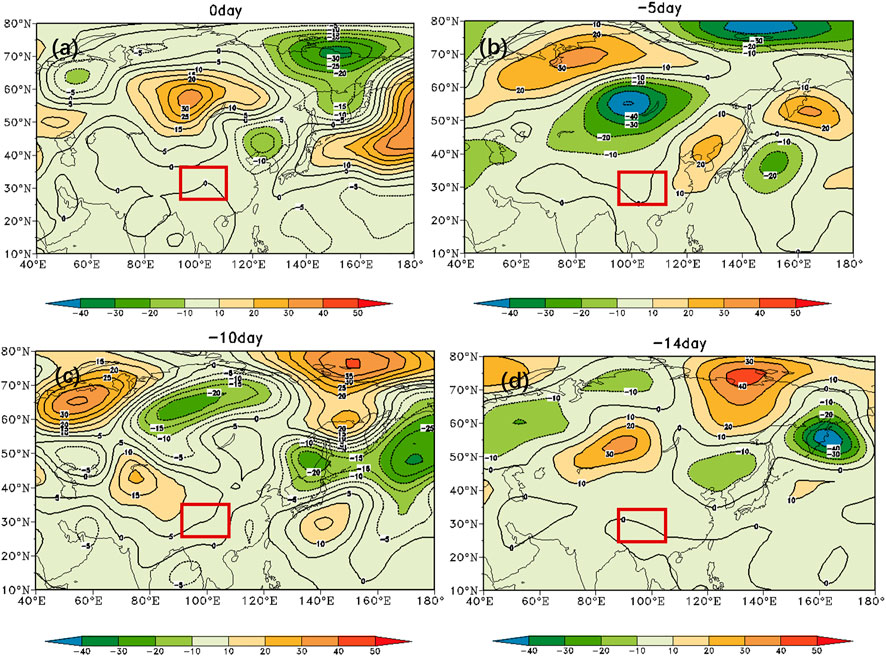
FIGURE 7. Evolution of the low-frequency (15–30 days) geopotential height anomaly at 500 hPa from 14 days before the precipitation to 0 day after onset in western Sichuan, unit: gpm.
3.2.2 Basin area
The evolution of the low-frequency geopotential height anomaly field in the middle layer is shown in Figure 8. In the first 15 days, the Asian inverted “Ω” flow pattern was formed in the middle and high latitudes. Subsequently, the resistance height of Wushan gradually declined and collapsed, which helped the horizontal trough in the polar region to rotate counterclockwise to the south. The small disturbance of the split of the low-pressure center near the Sea of Japan moved to the southwest to the northeast side of the basin (10 days before the precipitation). In the first 5 days before the precipitation, the horizontal trough completely turned vertical and moved to the southeast. The development of the high pressure in the Sea of Okhotsk strengthened and connected with the high-pressure ridge extending from Novaya Zemlya in the north. At the same time, a part of the high-pressure ridge near the Sea of Japan also extended to northeast China. The original negative disturbance over the center basin is completely dead. Subsequently, the small trough of the western low-pressure split spread downstream, and its intensity weakened during the eastward movement. The high-pressure ridge originally located in the northeast region split into a small disturbance center and moved southwestward to the northeast side of the Sichuan Basin, and the high latitude high pressure also moved along with it to the Ural Mountains. At the beginning of the precipitation, the center of low pressure near the Sea of Japan developed strongly, and the center of low pressure in the west moved to Mongolia. The two low pressure and the low-frequency high pressure in the Ural Mountains formed a circulation pattern of high in the west and low in the east. This situation is conducive to the southward movement of cold air, and the northeast direction of the basin is positive. The small disturbance center still exists, causing the mid-to-high latitude airflow to flow eastward around the periphery of the positive disturbance center and then flow back into the Sichuan Basin. Low-frequency high voltage center and low voltage center passed the 95% significance test (p < 0.05).
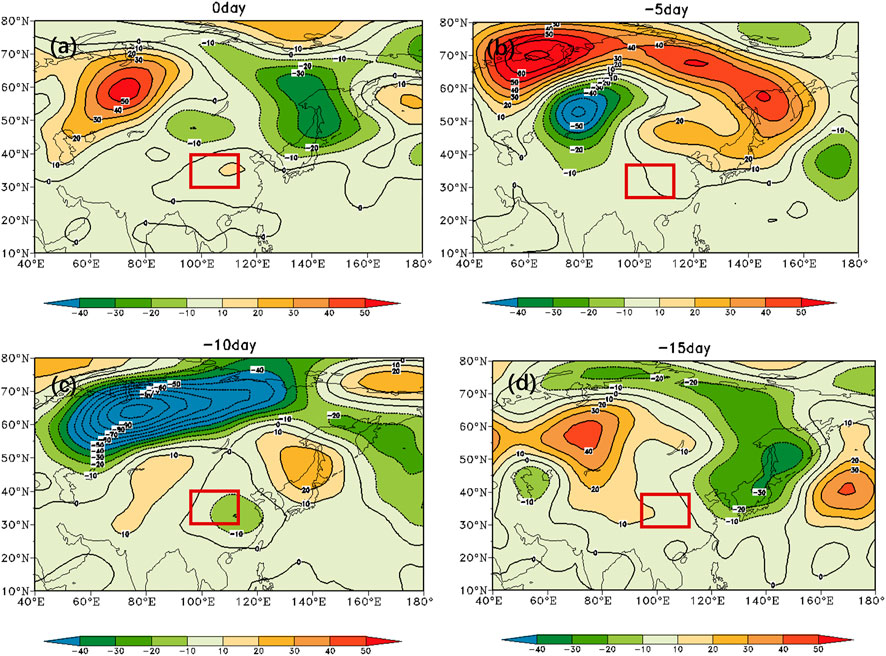
FIGURE 8. Evolution of the low-frequency (15–30 days) geopotential height anomaly at 500 hPa from 15 days before the precipitation to 0 day after onset in Basin area, unit: gpm.
3.2.3 East Sichuan
In the 500 hPa low-frequency height field in eastern Sichuan (Figure 9), the key low-frequency systems are the low pressure extending southward to 25°N in the east of Beihu Lake and the high-pressure trending northeast–southwest in the Black Sea and Aral Sea areas affect the eastern Sichuan area. By tracing the source of the two key systems, it was found that the low-frequency high pressure originated from the Eastern European region (60°N, 45°E), and the high pressure was weak at first, then intensified, and moved to the southeast, passing the Ural Mountains, when the precipitation started (0 day) to the Black Sea, the Aral Sea region. A low-frequency low pressure was formed in the northeastern part of Russia (70°N, 140°E) 8 days before the precipitation. Then, the low pressure gradually moved southward, reaching the Baikal region and continuing to develop southward. Four days before the precipitation, a low-frequency low pressure was also formed near the Bohai and the Lake Baikal and gradually strengthened. On 0 day, the low pressure at the lower part of Beihu Lake was connected with the Bohai the Lake Baikal low pressure, forming a north–south low-pressure center. Low-frequency high voltage center and low voltage center passed the 95% significance test (p < 0.05).
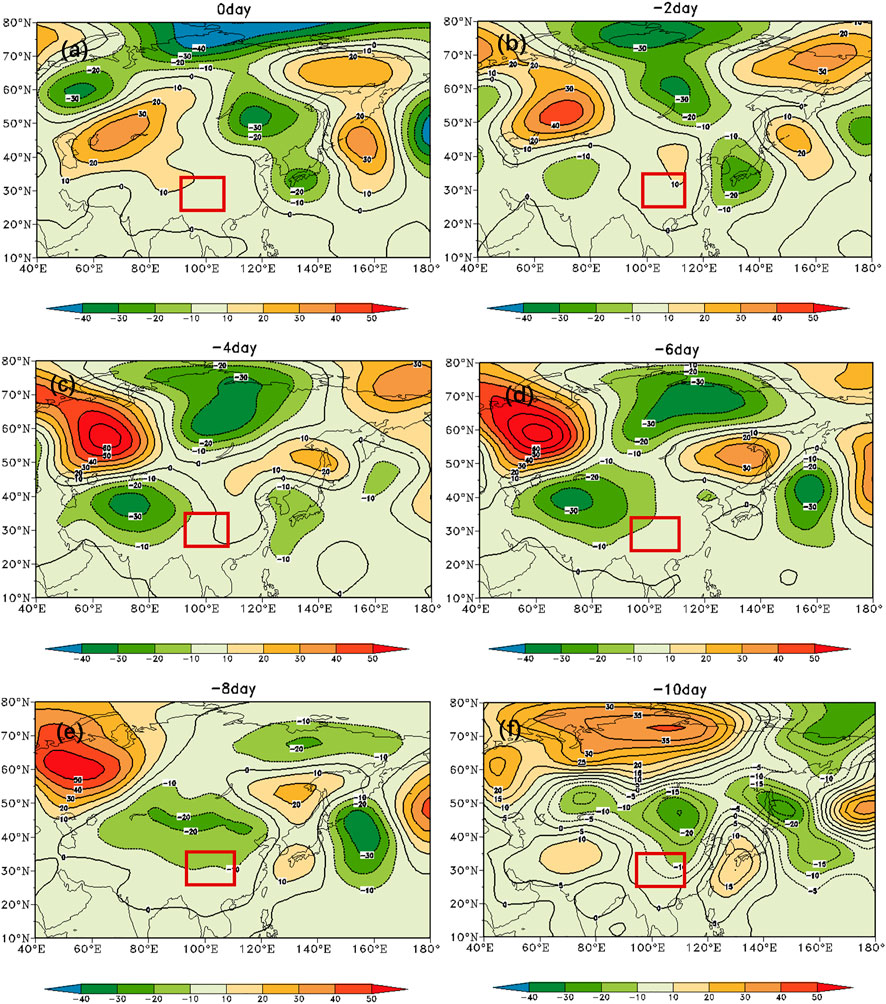
FIGURE 9. Evolution of the low-frequency (15–30 days) geopotential height anomaly at 500 hPa from 10 days before the precipitation to 0 day after onset in East Sichuan, unit: gpm.
3.2.4 Guizhou area
Figure 10 shows that the key low-frequency systems in the 500 hPa height field during the precipitation period in Guizhou are the high pressure extending from the south of Beihu to the Bohai Bay and the low pressure in the Sea of Okhotsk. The high pressure corresponds to the 15–30-day low-frequency anticyclone at 850 hPa. The high-pressure center was formed near Bohai Bay 5 days before the precipitation, finally developed and strengthened, expanded in scope, and extended to the north and south sides, making it evolve into a north–south belt-like distribution, making cold air southward to lower latitudes. The low pressure in the Sea of Okhotsk was formed by moving southward at high latitudes. A small-scale low-pressure center was formed north of Lake Baikal 10 days before the precipitation, then intensified, and moved southward. On −8 days, the south side reached Baikal Lake, and the main body of 5 days before the precipitation located at Lake Baikal moved to the southeast, 3 days before the precipitation, the low presure center does not continue to develop to the south, but extends eastward to the Sea of Okhotsk area On 0 day, the main body reaches the Sea of Okhotsk and develops to the southeast. Low-frequency high voltage center and low voltage center passed the 95% significance test (p<0.05).
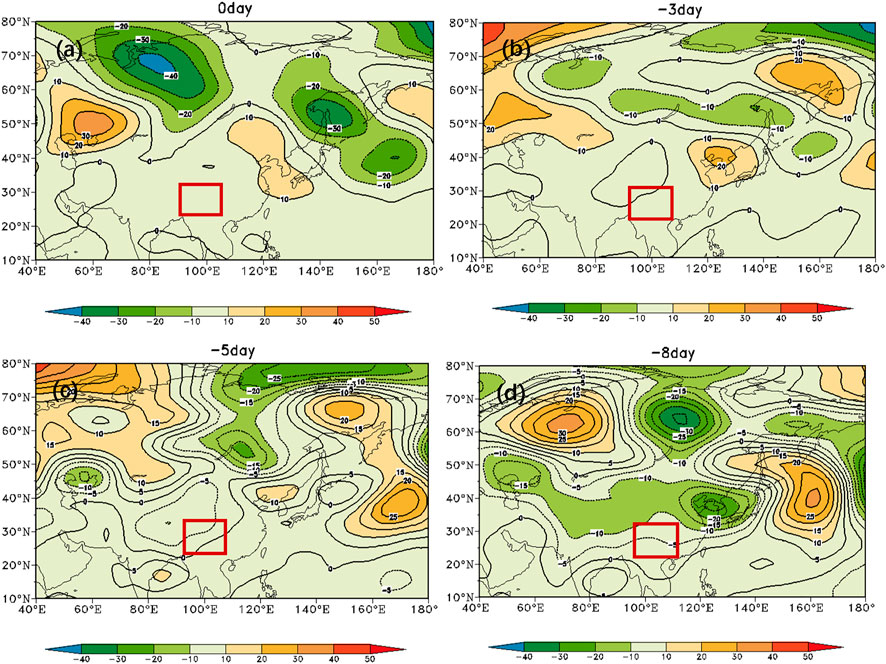
FIGURE 10. Evolution of the low-frequency (15–30 days) geopotential height anomaly at 500 hPa from 8 days before the precipitation to 0 day after onset in the Guizhou area, unit: gpm.
3.2.5 Yunnan region
Figure 11 of the mid-level height field inversion in Yunnan shows that the low-frequency height field in Asia shows a trough-ridge pattern during precipitation, East Asia is a low trough, West Asia is a high-pressure ridge, and the trough and ridge are distributed in a north–south belt, affecting lower latitudes. Yunnan is located behind the ridge anterior and the trough and is easily affected by the cold air from the north. The East Asian low-pressure center originated 6 days before the precipitation, formed in the northern Sea of Japan, and then developed and strengthened. The low-pressure center extended to the north–south, forming a belt-like distribution. The West Asian high-pressure ridge developed from the high-pressure center north of Beihu. On −6 day, the high-pressure center in the north of Beihu developed westward, forming a northeast–southwest trend 4 days before the precipitation. Two days before the precipitation, the center moved to the east of the Ural Mountains and turned to the east on 0 day. The north–south trend affects the Yunnan area. Low-frequency high voltage center and low voltage center passed the 95% significance test (p < 0.05).
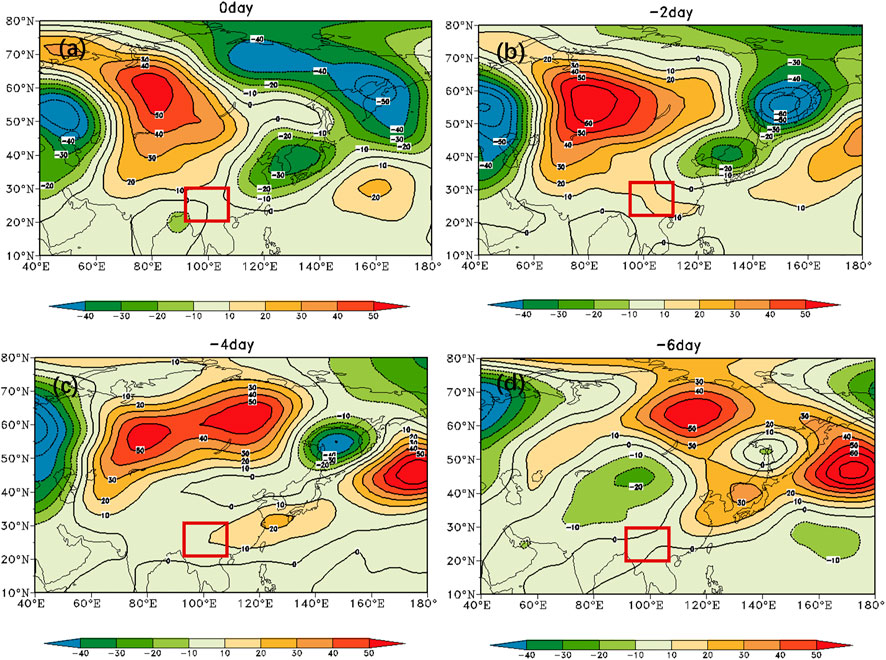
FIGURE 11. Evolution of the low-frequency (15–30 days) geopotential height anomaly at 500 hPa from 6 days before the precipitation to 0 day after onset in Yunnan region, unit: gpm.
3.3 Configuration and evolution characteristics of high-level low-frequency systems
3.3.1 Western Sichuan
The synthesized 200 hPa low-frequency divergence and low-frequency wind fields in western Sichuan are shown in Figure 12. After the onset of precipitation, the area over western Sichuan is low-frequency divergence, and there is a corresponding low-frequency anticyclone. Consistent with the original field analysis, the pumping effect of high-level low-frequency circulation can be strengthened. The upward movement is conducive to the production of precipitation. In order to explore the source of the low-frequency anticyclone and the divergence center, the time is reversed. Five days before the precipitation, the anticyclone and the divergence center are located in the northeastern region of China, with high intensity, and the two basically coincide. Ten days before the precipitation, the anticyclone was located in the Lake Baikal area, and the divergence center was on its southwest side. Ten days before the precipitation, the anticyclone and divergent center moved from west to east, starting 16 days before the precipitation, west of Lake Baikal (55°N, 90°E). The above analysis clearly shows that the moving path of the high-altitude low-frequency anticyclone and the divergent center first moved to the southeast and then turned to the southwest. The positive divergence center passed the 95% significance test (p < 0.05).
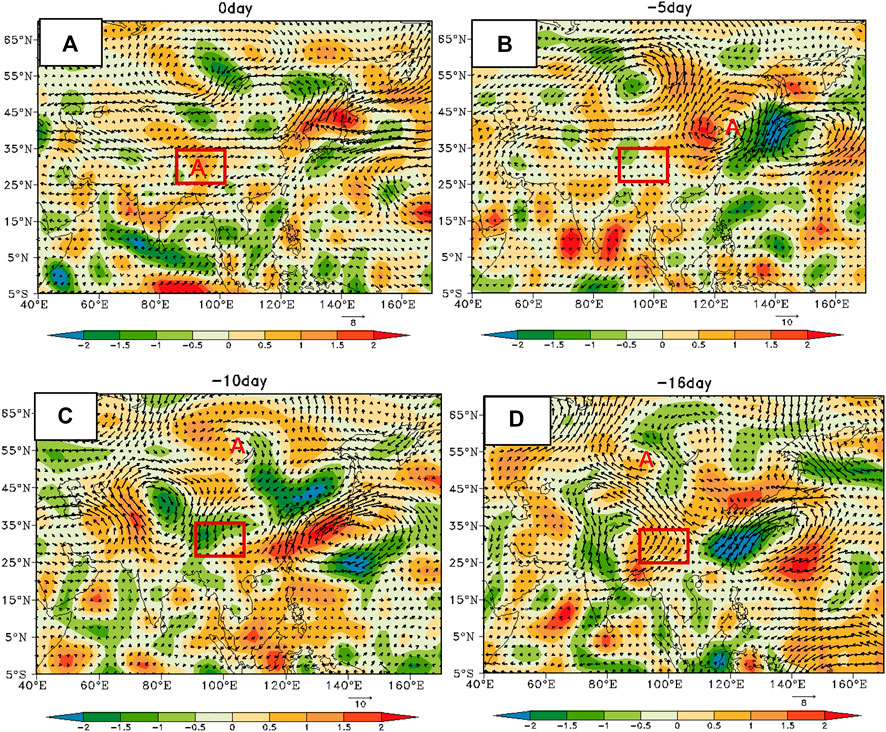
FIGURE 12. Evolution of the low-frequency (15–30 days) divergence (shading, unit: 10−6S−1) and wind (vector, unit: m/s) field at 200 hPa from 16 days before the precipitation to 0 day after onset in western Sichuan, the red box is the western Sichuan area, and A is the low-frequency anticyclone.
3.3.2 Basin area
The 200 hPa low-frequency wind field and divergence field in the basin are shown in Figure 13. Fourteen days before the precipitation, the upper air of the Sichuan Basin is the divergence center. At this time, a low-frequency anticyclone is generated at 45°N, 75°E (Kazakhstan). The left side of the anticyclone corresponds to the divergent center, and the right side corresponds to the convergent center. The anticyclone moves eastward slowly over time. The anticyclone reaches Beihu on the north side of the 10 days before the precipitation anticyclone, and the main body of the −5 day anticyclone reaches the south of Beihu. The divergence center moves with the anticyclone. Then, the anticyclone did not continue to move eastward but developed southward. On 0 day, the center of the anticyclone reached North China, and the easterly airflow on the south side affected the basin. The divergence center is located in Inner Mongolia, Mongolia, and extends southward to affect the Sichuan Basin, resulting in increased divergence over the basin, which is conducive to the production of precipitation. Therefore, the early signal of the circulation over the basin is roughly 14 days before the precipitation. A low-frequency anticyclone and a divergence center were generated in Kazakhstan, moved eastward to the south of Beihu Lake, and then continued to develop and strengthen southward, affecting the basin through Mongolia and North China. The positive divergence center passed the 95% significance test (p < 0.05).
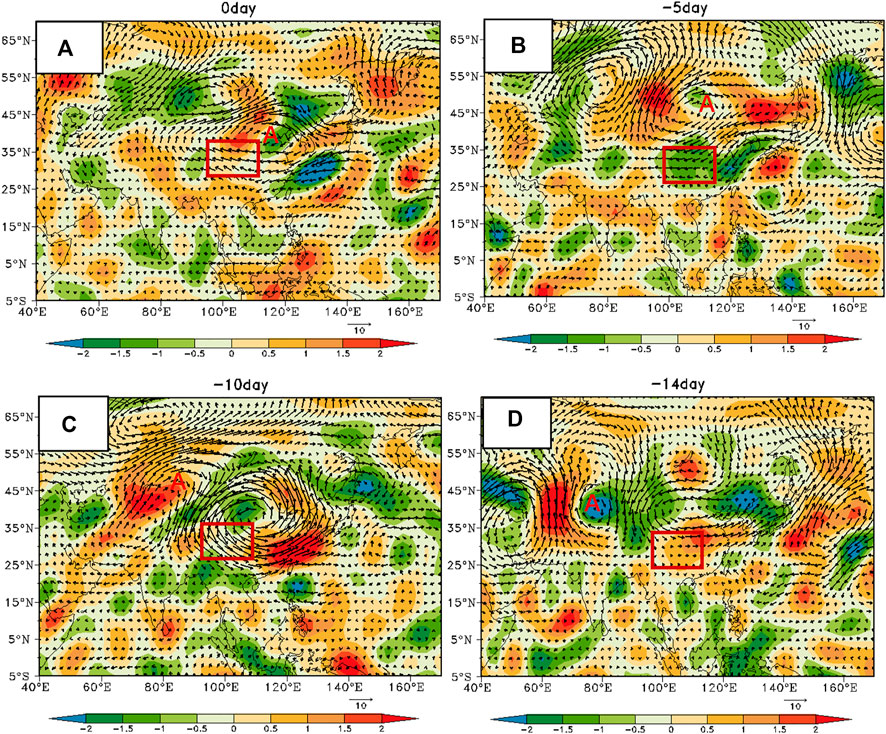
FIGURE 13. Evolution of the low-frequency (15–30 days) divergence (shading, unit: 10−6S−1) and wind (vector, unit: m/s) field at 200 hPa from 14 days before the precipitation to 0 day after onset in the Basin area.
3.3.3 East Sichuan
The 200 hPa, 15–30 day low-frequency circulation pattern in the eastern Sichuan area is shown in Figure 14. After the onset of precipitation, the upper air in the eastern Sichuan area is a low-frequency divergence area controlled by a low-frequency anticyclone. The anticyclone was generated in the Inner Mongolia region of China 6 days before the precipitation, and the divergence value in the eastern Sichuan region was negative at this time, which was not conducive to the divergence of the airflow at high altitudes. The position of the anticyclone remained stable for the next few days, but the intensity continued to increase. The center and west of the anticyclone correspond to the divergence area, and the east side corresponds to the convergence area. As the anticyclone intensifies and moves south, the range of the divergence area continues to expand and move south, at the beginning of the precipitation (0 day), the airflow on the south side of the anticyclone affects the eastern Sichuan, and the corresponding divergence value gradually turns to positive control. The positive divergence center passed the 95% significance test (p < 0.05).
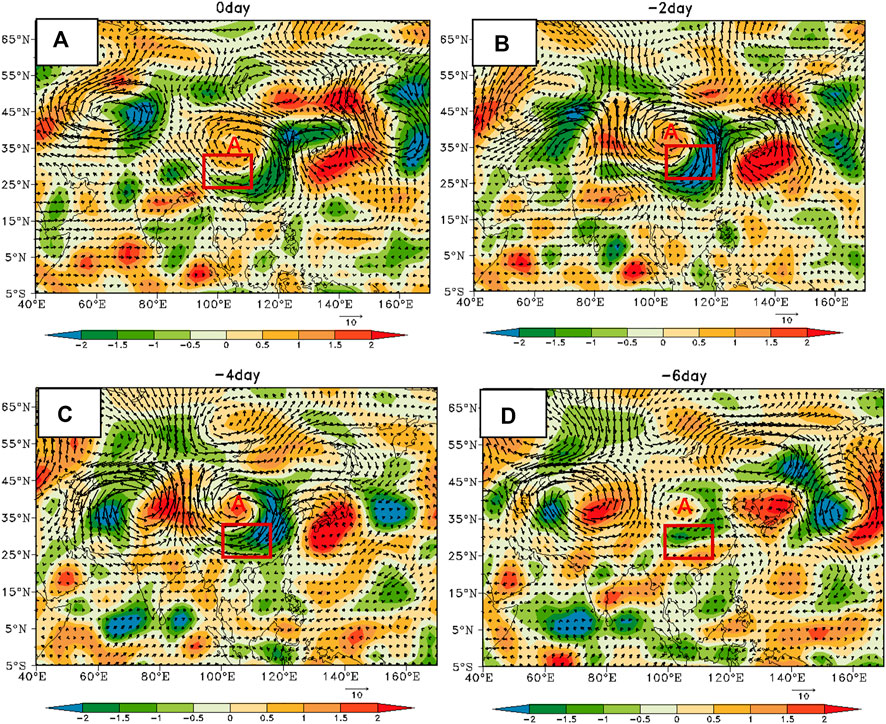
FIGURE 14. Evolution of the low-frequency (15–30 days) divergence (shading, unit: 10−6S−1) and wind (vector, unit: m/s) field at 200 hPa from 6 days before the precipitation to 0 day after onset in East Sichuan.
3.3.4 Guizhou area
In the wind field of low-frequency divergence at 200 hPa in Guizhou (Figure 15), the divergence value over Guizhou is positive, which is beneficial to airflow divergence. However, the divergence area is different from other areas in that it is not in the low-frequency anticyclone. It is at the junction of a low-frequency cyclone and a low-frequency anticyclone. The divergence center and the low-frequency cyclone and anticyclone evolve. The divergence center can be traced back to 18 days before the precipitation, formed at the junction of Mongolia and Xinjiang (90°E, 45°N), and then gradually moved southeast to the sky over Guizhou. The anticyclone corresponds to the middle- and low-level systems. It was formed in the northeastern part of my country on −6 day and then moved southward to the eastern coastal areas of my country. The cyclone can be traced back to 8 days before the precipitation, formed at 80°E, 40°N, then developed and moved to the southeast, and finally stagnated and disappeared in the southwest of China. The positive divergence center passed the 95% significance test (p < 0.05).
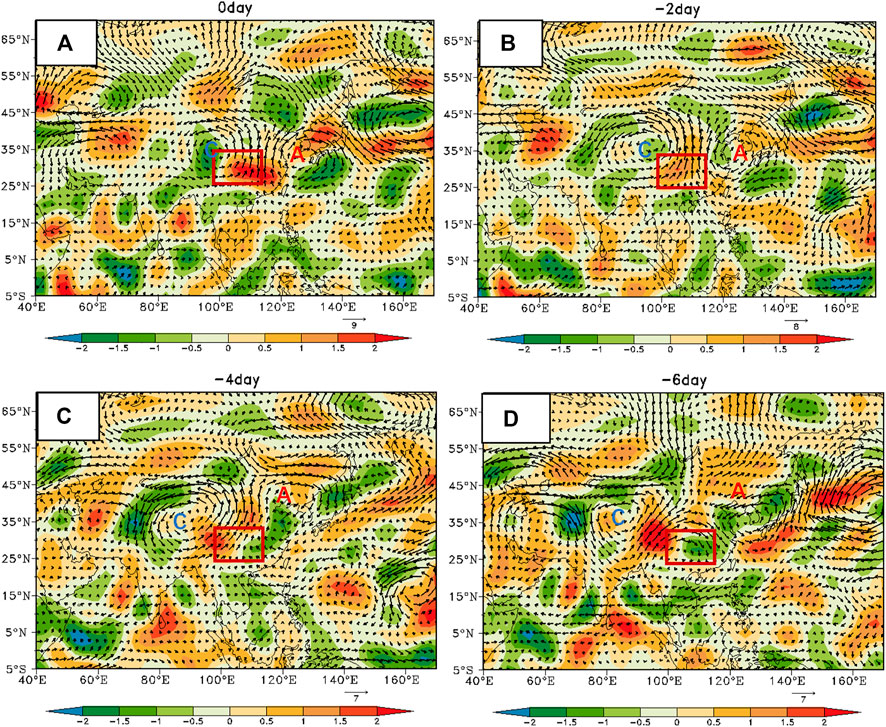
FIGURE 15. Evolution of the low-frequency (15–30 days) divergence (shading, unit: 10−6S−1) and wind (vector, unit: m/s) field at 200 hPa from 6 days before the precipitation to 0 day after onset in the Guizhou area.
3.3.5 Yunnan region
As shown in Figure 16, at 200 hPa, on 15–30 days of low-frequency divergence field and wind field over Yunnan, after the onset of precipitation (0 day), the sky over Yunnan is controlled by the divergence center, which corresponds to the northwest side of the low-frequency anticyclone. The anticyclone center is located in the central and southern parts of the country. Moreover, we found that the divergence center and the anticyclone changed synchronously, and the peninsula was always located in the northwest of the anticyclone. Fifteen days before the precipitation, the low-frequency anticyclone and divergence center were generated in Northwest Asia at 50°N and 90°E, then moved southeastward, entered my country through Xinjiang, reached Inner Mongolia 10 days before the precipitation, and reached North China 5 days before the precipitation. At this time, a strong low-frequency cyclone followed from the west side of the low-frequency anticyclone. While moving to the southeast, it turned in the same direction, forcing the anti-air to rotate to the southwest and its intensity weakened. On 0 day, it passed through the southwestern region of my country and reached Yunnan and the Indo-China Peninsula. During the precipitation, it stayed in the Indo-China Peninsula, then weakened and disappeared. The positive divergence center passed the 95% significance test (p < 0.05).
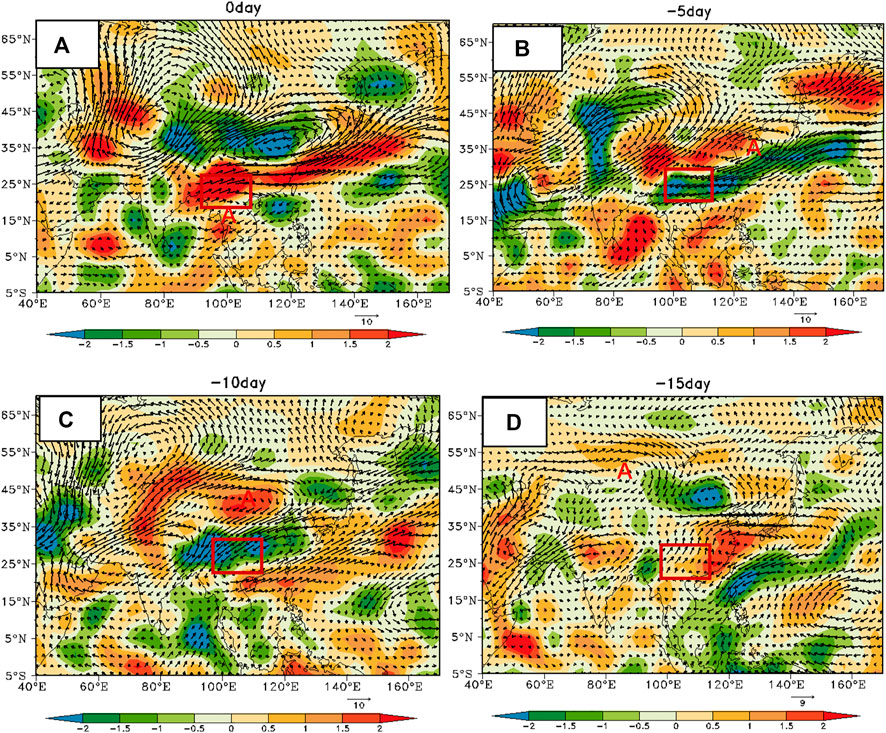
FIGURE 16. Evolution of the low-frequency (15–30 days) divergence (shading, unit: 10−6S−1) and wind (vector, unit: m/s) field at 200 hPa from 15 days before the precipitation to 0 day after onset in Yunnan region.
4 Conclusion and discussion
This study is based on previous studies on the relationship between low-frequency oscillation and precipitation, mainly concentrated in South China, Jianghuai, and North China, Although the research on Southwest China is little. This study selected Southwest China as the research object, discussed the impact of low-frequency oscillation on heavy precipitation, and clearly defined the key area of abnormal precipitation. In addition, it deeply analyzed the propagation characteristics, sources, and propagation paths of low-frequency oscillation at different heights and its impact on precipitation and comprehensively understood the characteristics of atmospheric low-frequency oscillation affecting persistent precipitation in Southwest China from three-dimensional space. Furthermore, this study specifically analyzed the propagation characteristics and origins of key low-frequency systems in each latitude zone and at each altitude for 15–30 days and showed the mutual configuration of low-frequency oscillations in three-dimensional space and their impact on precipitation. The main conclusions were as follows:
(1) During the continuous heavy rainfall, in the 500 hPa height field and 850 hPa wind field before filtering, except for the western Sichuan region, the other four regions showed that the occurrence of extreme precipitation was closely related to the western Pacific subtropical high (based on the 5,880 gpm contour line). During the period of persistent abnormal precipitation, the ridge point of the Western Pacific subtropical high extends westward to around 110°E and has a large control range. It corresponds to a strong low-frequency anticyclone at the middle and lower levels. The southwest warm and wet airflow at the edge of the low-frequency anticyclone is transported to the southwest region, bringing sufficient moisture to the extreme precipitation in the southwest region. In the middle and high latitudes, the low-frequency key areas affecting precipitation were the Ural Mountains, east of Lake Baikal, the Sea of Okhotsk, and the Sea of Japan. The mid-latitude was the control area of the Western Pacific subtropical high. The low latitude was the vicinity of the South China Sea, Indian Peninsula, and Bay of Bengal regions.
(2) In the 15–30 day low-frequency circulation field, the atmospheric low-frequency waves in each region had a certain baroclinic property during the continuous precipitation. The high north spreads to the middle latitudes and merges with the north wind, forming a convergence and rising area of north-south airflow in the rainy area. The middle and lower layers of the vorticity field were positive vorticity centers, and the upper layers were negative vorticity centers, with obvious baroclinicity, providing energy conditions for precipitation.
(3) The low-frequency systems of low-, mid-, and high-latitude tended to move southward and bring cold air to the rainy area, whereas low-latitude systems tended to move northward to bring warm and humid air currents, and the cold and warm air currents met in the rainy area. The center of low-frequency high-low pressure in the middle-level high latitude moved southward, eventually forming a circulation pattern with high west and east low, which helped the cold air move southward along the front ridge and trough. The high-level mainly showed that the positive and negative V wind components propagated from the mid-to-high latitudinal rain area, and the rain area corresponded to the low-frequency divergent system. The detailed high-low-altitude low-frequency system configuration of each area is shown in Figure 17.
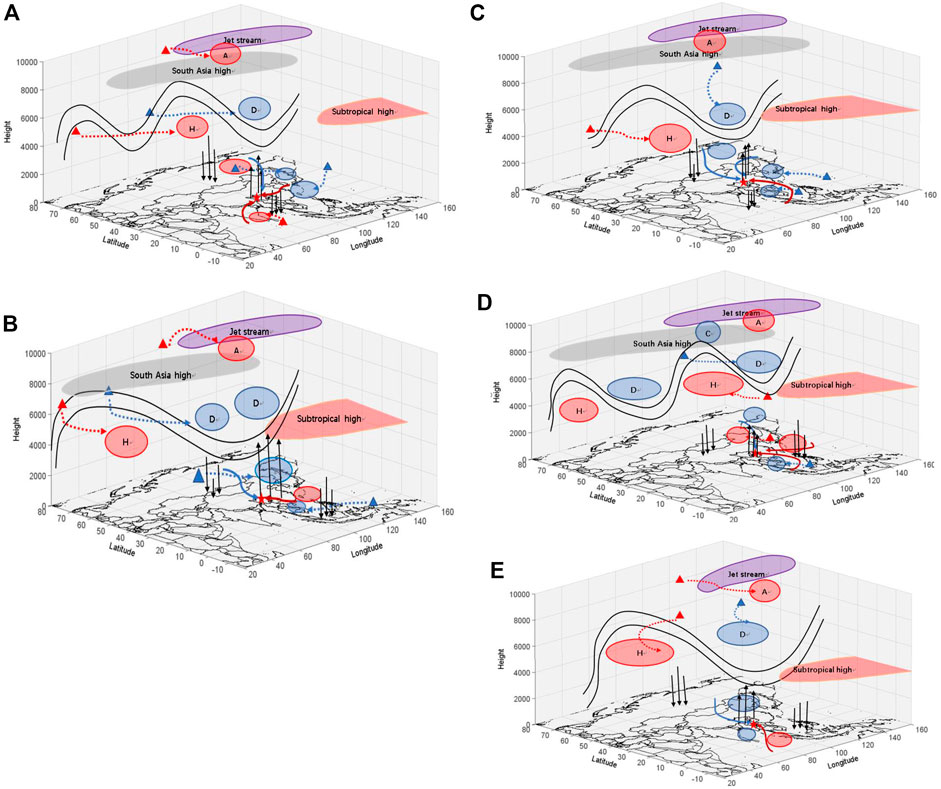
FIGURE 17. Low-frequency system configuration diagram of (A) Western Sichuan (B), Basin (C), Eastern Sichuan (D), Guizhou (E) and Yunnan. Five-pointed star represents the precipitation area, blue (red) ellipse represents cyclone or low pressure (anticyclone or high pressure), blue (red) dotted arrows represent the propagation path of low pressure or cyclone (high pressure or anticyclone), blue (red) solid arrows represent the propagation path of cold air (warm air), black arrows represent vertical airflow, blue (red) triangles represent low pressure or cyclone (high pressure or anticyclone) source, the black solid line represents the high-altitude ridge.
Data availability statement
The raw data supporting the conclusion of this article will be made available by the authors without undue reservation.
Author contributions
TX: formal analysis, writing—original draft. YH: conceptualization, supervision, writing—review and editing. LH and YN: formal analysis, writing—review and editing. All authors have read and agreed to the published version of the manuscript.
Funding
Key R & D Program for Social Development in Yunnan Provincial (in China) (202203AC100006, 202203AC100005); The Second Qinghai-Tibet Plateau Comprehensive Scientific Expedition Research Project (2019QZKK010408); Innovation and Development Project of China Meteorological Administration (CXFZ2021Z010).
Conflict of interest
The authors declare that the research was conducted in the absence of any commercial or financial relationships that could be construed as a potential conflict of interest.
Publisher’s note
All claims expressed in this article are solely those of the authors and do not necessarily represent those of their affiliated organizations or those of the publisher, the editors, and the reviewers. Any product that may be evaluated in this article, or claim that may be made by its manufacturer, is not guaranteed or endorsed by the publisher.
References
Barnes, R. T. H., Hide, R., and Wilson, A. A. W. (1983). Atmospheric angular momentum fluctuations, length-of-day changes and polar motion. Proc. R. Soc. Lond. Ser. A 387, 31–73. doi:10.1098/rspa.1983.0050
He, M., Gong, Z. S., and Xu, L. (2005). The influence of tropical circulation system anomalies on the continuous heavy rain in the Huaihe River in 2003. J. Trop. Meteor 21, 323–329.
Horel, J. D., and Wallace, J. M. (1981). Planetary-scale Atmospheric phenomena associated with the southern oscillation. Mon. Weather Rev. 109 (4), 813–829. doi:10.1175/1520-0493(1981)109<0813:psapaw>2.0.co;2
Hu, J., and Chen, X. F. (1995). Intraseasonal low-frequency oscillations of the atmosphere and the process of heavy rainfall in North China. Acta. Meteor. Sin. 1, 622–630.
Kikuchi, K., and Wang, B. (2009). Global perspective of the quasi-biweekly oscillation. J. Clim. 22 (6), 1340–1359. doi:10.1175/2008jcli2368.1
Li, C. Y. (1990). A kinetic study of 30–50 day oscillations in the tropical atmosphere beyond the equator. Chin. J. Atmos. Sci. 14, 83–92. doi:10.3969/j.issn.1006-9585.2000.04.005
Li, C. Y., and Zhou, Y. P. (1995). Quasi-biweekly (10–20 day) oscillations in the tropical atmosphere. Chin. J. Atmos. Sci. 19 (4), 435–444. doi:10.3878/j.issn.1006-9895.1995.04.06
Liang, P., and Ding, Y. H. (2012b). Climatic characteristics of intraseasonal oscillations during the Meiyu season in East Asia. Acta. Meteor. Sin. 3, 418–435.
Liang, Ping, and Ding, Yihui (2012a). Climatic characteristics of intraseasonal oscillation of Meiyu in East Asia. J. Meteorology 3, 418–435.
Liao, H. Q., and Tao, S. Y. (2004). The seasonal cycle process of the summer atmospheric circulation in East Asia and its role in the formation of regional persistent precipitation anomalies. Chin. J. Atmos. Sci. 28, 835–846. doi:10.3878/j.issn.1006-9895.2004.06.04
Liu, P., and Lu, W. S. (2006). Frequency modulation effect of Pacific-Indian ocean sea surface temperature heating on low-frequency oscillations at mid-high latitudes. J. Nanjing. Inst. Meteor 29 (3), 289–296. doi:10.3969/j.issn.1674-7097.2006.03.001
Liu, Y. J., Ding, Y. H., and Zhao, N. (2005). Research on mesoscale convective systems during the onset of the South China sea monsoon in 1998: I. Large-Scale conditions for the occurrence and development of mesoscale convective systems. Acta. Meteor. Sin. 63, 431–442. doi:10.11676/qxxb2005.043
Lorence, A. C. (1984a). The evolution of planetary-scale 200 mb divergent flow during the FGGE year. Q. J. R. Meteorol. Soc. 100, 427–441. doi:10.1002/qj.49711046408
Lorence, A. C. (1984b). The evolution of planetary-scale 200 mb divergent flow during the FGGE year. Q. J. R. Meteorol. Soc. 100, 427–441. doi:10.1002/qj.49711046408
Lu, E., and Ding, Y. H. (1996). The 1991 Jianghuai torrential rain and the low frequency oscillation of the East Asian atmosphere. Acta. Meteor. Sin. 6, 730–736.
Lu, W. S. (1994). Four-wave quasi-resonance between topographic waves and free Rossby waves in a barotropic atmosphere. Sci. Meteor. Sin. 14 (2), 127–135.
Lu, W. S., Ma, S. J., and Tao, L. (1998). Frequency modulation effect of non-adiabatiheating on low-frequency oscillations at mid-high latitudes. J. Nanjing. Inst. Meteor 21 (3), 336–345.
Luo, D. H. (1998). Oscillation characteristics of modulated Rossby waves in the atmosphere and low-frequency oscillations at mid-latitudes. J. CUIT 21 (3), 336–345.
Mao, J. Y., and Wu, G. X. (2005). The 1991 Jianghuai plum rains and the low frequency oscillation of the subtropical high. Acta. Meteor. Sin. 5, 762–770. doi:10.3321/j.issn:0577-6619.2005.05.020
Qiu, M. Y., Lu, W. S., and Tao, L. (2004). Frequency modulation effects of ENSO events on low-frequency oscillations in the atmosphere at mid-high latitudes. J. Nanjing. Inst. Meteor 27 (3), 365–373. doi:10.3969/j.issn.1674-7097.2004.03.009
Xiao, Z. N., and Li, C. Y. (1992). Numerical simulation of the low-frequency teleresponse of atmospheric external forcing I: Response to SSTA in the equatorial eastern Pacific. Chin. J. Atmos. Sci. 16 (6), 707–717. doi:10.3878/j.issn.1006-9895.1992.06.08
Xin, F., Xiao, Z. N., and Li, Z. C. (2007). The relationship between precipitation anomalies and low-frequency atmospheric oscillations during the flood season in South China in 1997. Meteor. Mon. 33 (12), 23–30. doi:10.3969/j.issn.1000-0526.2007.12.004
Yang, X. Q. (1990). Numerical study of the low frequency response of the atmosphere to tropical heat sources. Sci. Meteor. Sin. 10 (4), 384–393.
Yao, J. X., Wang, P. X., and Li, L. P. (2005). Performance comparison of two kinds of digital filters in the study of intraseasonal oscillation. J. Atmos. Sci. 28 (2), 248–253. doi:10.3969/j.issn.1674-7097.2005.02.014
Zhang, K. S. (1987). The 40-50 day low frequency oscillation of the zonal base flow and its destabilizing effect. Chin. J. Atmos. Sci. 11 (3), 227–236.
Zhang, Q., Ni, Y. Q., Lin, W. Y., and Wang, Z. M. (1992). Characterization of intraseasonal oscillations in the tropics and mid-high latitudes and diagnosis of their dynamics. J. Trop. Meteor 8 (4), 289–296. doi:10.16032/j.issn.1004—4965.1992.04.001
Zhou, J. X. (2000). Experimental study on rainstorms on both sides of the Taiwan Strait and adjacent areas. Beijing, CHN: China Meteorological Press, 180–207.
Keywords: Southwest China, persistent extreme precipitation, low-frequency oscillation, system configuration, low-frequency
Citation: Xiao T-G, Huang Y, Han L and Nong Y-y (2023) The impact of persistent anomalous precipitation in Southwest China caused by low-frequency atmospheric disturbances in different latitudes and altitudes. Front. Earth Sci. 10:982348. doi: 10.3389/feart.2022.982348
Received: 30 June 2022; Accepted: 11 November 2022;
Published: 03 February 2023.
Edited by:
Xiefei Zhi, Nanjing University of Information Science and Technology, ChinaReviewed by:
Weiqiang Ma, Institute of Tibetan Plateau Research (CAS), ChinaXia Wan, China Meteorological Administration, China
Daosheng Xu, Guangzhou Institute of Tropical and Marine Meteorology (GITMM), China
Copyright © 2023 Xiao, Huang, Han and Nong. This is an open-access article distributed under the terms of the Creative Commons Attribution License (CC BY). The use, distribution or reproduction in other forums is permitted, provided the original author(s) and the copyright owner(s) are credited and that the original publication in this journal is cited, in accordance with accepted academic practice. No use, distribution or reproduction is permitted which does not comply with these terms.
*Correspondence: Lin Han, hanlin@cuit.edu.cn