Simulation of collapse failure process of rock slope based on the smoothed particle hydrodynamics method
- 1Key Laboratory of Ministry of Education of China for Efficient Mining and Safety of Metal Mines, University of Science and Technology Beijing, Beijing, China
- 2Faculty of Land Resources Engineering, Kunming University of Science and Technology, Kunming, China
The limit equilibrium method (LEM) or finite element method (FEM) for slope problems most frequently focusses on the stability analysis. There are, however, still some problems with the LEM or FEM when considering damage and failure evolution of a rock slope because of the distortion of mesh. In this work, a mesh-free particle approach, named the smoothed particle hydrodynamics (SPH) method, is presented and is improved to analyze the damage and failure process of a rock slope. In order to better describe the cause and mechanism of brittle failure for a rock slope, the plastic factor was suggested and introduced into the SPH algorithm, and the conservation equations of SPH for brittleness characteristics were obtained. Based on the variation of displacement and time, an effective criterion was proposed to define the factor of safety in SPH simulation. The Drucker-Prager Mohr-Coulomb strength criterion was implemented into the SPH algorithm to describe the elastic-plastic behavior. Then, three rock-slope models with different precast cracks were analyzed to illustrate the performance of the proposed method. It is shown that the proposed SPH algorithm can be effectively applied in the prediction of the deformation and failure process of rock slope.
1 Introduction
Collapse is a widespread phenomenon in both natural and excavated rock slopes. It is a mass movement of rock characterized by downslope sliding, which can involve damage extension, penetration, and collapse. Therefore, the collapse of a rock slope has the obvious characteristics of a large deformation. The large deformation and failure process of rock slopes are so complex that obtaining an analytical solution is very difficult. In this sense, how to correctly describe the large deformation characteristics of rock slopes has been a hot but difficult problem in recent years. Compared with the complexities of experimental research and the limitations of theoretical research (Li et al., 2012), numerical simulation can give accurate solutions and predictions as long as reasonable constitutive relations and calculation parameters are given. Hence, the simulation of the deformation and failure of rock structures has been more and more popular among scholars all over the world.
In recent years, some numerical methods have become increasingly popular to analyze large deformation and post-failure of slope, such as the Discrete Element Method (DEM) (Cundall and Strack, 1979; Wong et al., 1996), the Discontinuous Deformation Analysis (DDA) (Shi, 1991), the Remeshing and Interpolation Technique with Small Strain (RITSS) method (Hu and Randolph, 1998; Sitar et al., 2005; Tian et al., 2014) and Eulerian finite element methods (Wang et al., 2013). The most common software implementation of DEM is PFC2D and PFC3D, which was developed by Itasca. Although the DEM has the advantages of capturing the micromechanics of rock materials and handling large deformation of rock mechanics engineering (Zhang, 2012; Cao et al., 2016; Lin et al., 2019; Wang et al., 2020; Zhang et al., 2021), it is limited to small-scale problems because of the computational cost and large amounts of micro parameters. The DDA is mainly used to study the failure of rock engineering; the entire rock failure process of the slope has not yet been considered and there are difficulties in realistically modelling (Ning et al., 2012; Liu et al., 2019). The other two methods have significant drawbacks are, respectively, computational cost of remeshing in RITSS, and difficulty in handling free surfaces, multiple materials, and history variables in Eularian methods. On the other hand, several mesh-free methods have been developed and applied to solving rock fracture mechanics with large deformation and high non-linearity. Zhang et al. (2005) and Kwok et al. (2015) studied the stability and large deformation failure of the soil slope using the reproducing kernel particle method (RKPM). Wang et al. (2011) presented an efficient Galerkin meshfree formulation for the large deformation failure simulation of soil slope. Guo and Nairn (2006) applied the material point method (MPM) to simulate the large deformation of solids. Although meshless methods are suitable for solving the large deformation failure problem, they have difficulties in imposing an essential boundary condition and still have some limitations (Li and Liu, 2002). For example, the MPM method needs to match the material points through background grids (Zhang et al., 2009). Therefore, a suitable numerical simulation method is urgently needed for better modeling of the evolution process and interpretation of the mechanism of collapse.
A pure Lagrange mesh-less recently numerical method, namely, the smoothed particle hydrodynamics (SPH), was originally used in astrophysical problems (Gingold and Monaghan, 1977; Lucy, 1977). Subsequently, it has been widely applied in solving complex geotechnical problems. For example, Chen et al. (2012) applied the SPH method to the simulation of granular materials under large deformation. Bui and Fukagawa (2013) used the SPH to simulate large deformation and post-failure of the soil slope. Due to its Lagrangian properties, it has a unique advantage in dealing with problems of large deformations and discontinuities. Hence, it also seems promising for a complete rock failure analysis.
The object of this paper is to use the SPH method to model the large deformation and failure process of rock slopes. For large deformation and failure process of slope problems, its essence is the elastic-plastic deformation (Gao et al., 2006; Kong et al., 2014; Drucker and Prager, 2013). In this paper, the Drucker-Prager (D-P) constitutive model with a non-associated plastic flow rule is implemented in the SPH code to simulate the large deformation and failure of a slope. In the following sections, numerical examples involving the collapse of a slope are carried out to demonstrate the effectiveness of the proposed method, which show that SPH is much more efficient than FEM in simulating slope problems, especially where large deformation and failure process are involved. The research results can provide some references for the applications of the SPH method to understand the mechanisms of crack propagation and early warning of rock slope instability.
2 Fundamental theory of SPH
2.1 Basic formulation of SPH algorithms
In the SPH method, an object is expressed as an assembly of particles with associated variables, such as mass, energy, and stress tensors. The basic idea behind this method is to provide stable and accurate numerical solutions for partial differential equations (PDEs) using a group of particles. The SPH method is based on interpolation theory. The governing equations, in the form of PDEs, can be transformed into SPH form through two main steps. The first step is to represent a function in continuous form as an integral representation using an interpolation function:
where the angle brackets < > denote a kernel approximation, x represents the location vector of the particle, Ω is the volume of the integral that contain x, and
where N is the total number of neighboring particles, m is the mass, ρ is the density, and j is the j-th particle. This step makes the SPH method simple without requiring a background mesh for numerical integration.
where
2.2 Governing equations and discretization
In this study, the governing equations are mainly based on the solid mechanics. So, the equations of continuity and motion can be expressed as follows:
Equation of continuity:
Equation of motion:
where
The differential form of the conservation equations can be converted to a discretized weak form as:
where
2.3 Elastic-plastic constitutive model
Here, the elastic-plastic constitutive model of soil material implemented in the SPH code is described in detail. The component of the total strain rate tensor is given by:
For the elastoplastic material, the total strain rate tensor
where the elastic strain rate tensor
where
where
2.4 Drucker-Prager (D-P) model
Rock material is a kind of brittle material. When the load reaches the yield strength, it will be damaged and weakened, at which point it is an elastic-plastic body. In this paper, the D-P criterion is selected as the yield criterion of elastoplastic materials. The expression is as follows:
where
for 2D plane strain conditions and
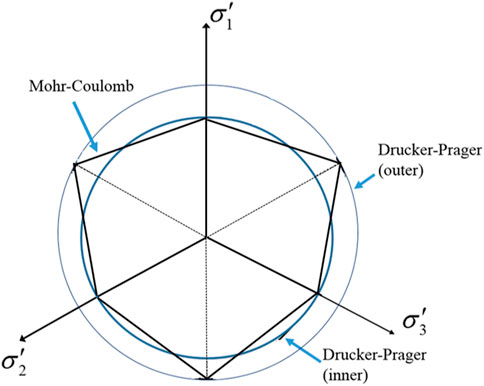
where c and φ are the cohesion internal and friction angle of geomaterials. In the principal stress space, the yield surface of the D-P criterion is a cone, and the yield curves corresponding to different material parameters are circles of different sizes on the off plane (see Figure 1).
In the present study, the non-associated flow rule is considered to determine the stress-strain relationship. The plastic potential function,
where
Here, the D-P yield criterion is employed to determine the plastic region of soils. Plastic strain is initiated from a particle when stresses in the particle satisfy the D-P yield criterion. Once plastic state is reached in one particle, the plastic deformation is initiated from this particle. Therefore, the discrete conservation equations of SPH for plastic characteristics can be expressed as:
where
3 Boundary treatment and verification
3.1 Boundary treatment
Particle deficiency might be encountered near or on a boundary by using the SPH method. Therefore, the boundary condition is a significant input in achieving accurate simulation results. Several methods were put forward to resolve this problem, but the most effective way is to use ghost particles and dummy particles. For the slope problem, this is divided into two kinds of boundary conditions: fixed boundary conditions and free-rolling boundary conditions.
To simulate the fixed boundary, three layers of dummy particles are generated on boundaries. If the support domain of particle i intersects with the wall boundary, the dummy particles in the intersecting region assist to the SPH calculation like real particles, as shown in Figure 2A. The velocity of boundary particles is set to zero, which means the fixed condition. The stress value of boundary particles is given the stress value of the real particle i. As for free-rolling boundary condition, it is modeled by adopting ghost particles. As shown in Figure 2B, if the horizontal distance
where

FIGURE 2. The sketch of two types of boundary condition: (A) dummy particles for fixed boundary; (B) ghost particles for free-rolling boundary.
3.2 Treatment effect verification
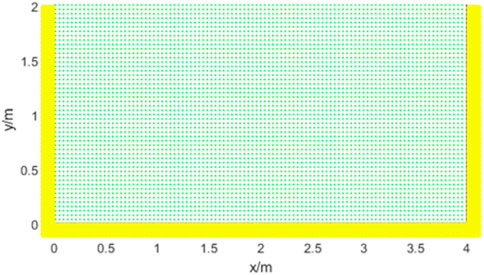
The developed FORTRAN program is validated with a 2D rectangle model. In the SPH simulation, a total number of 5000 real particles and 3000 boundary particles are used to form a rectangular area 4.0 m in length and 2.0 m in height, as shown in Figure 3. The material properties of the simulated rock are: Young’s modulus, E = 1.8MPa; Poisson’s ratio, μ = 0.3; density, ρ = 1850 g/cm3; cohesion, c = 5.0 kPa; and internal friction angle, φ = 30°. The SPH particles are arranged in a square lattice with an initial lattice constant of 0.04 cm and an initial smoothing length of 0.048 cm.The time step is 0.0001s.
Under the action of self weight, the vertical stress distribution of the model is shown in Figure 4. In the model, a fixed boundary is adopted at the bottom and a free-slip boundary is adopted at both sides. It can be seen that the vertical stress distribution is uniform and increases gradually with the depth, which conforms to the general law. Figure 4B shows the boundary without kernel interpolation treatment. Since the dummy particles at the bottom do not generate confining pressure, the constraint on the real particles at the bottom only depends on the repulsion force of the fixed dummy particles, and the selection of the repulsion force is subjective, resulting in obvious layered oscillation of the particle stress at the bottom. By comparison, in Figure 4A the stress distribution of particles at the bottom of the boundary treated by kernel interpolation is uniform, indicating that the boundary treated by kernel interpolation can effectively ensure the stress transfer. Therefore, the stress stratification can be effectively removed by treating the boundary with dummy particles and ghost particles in the SPH method, and the stability of stress transfer can be maintained, which shows that this method is feasible.

FIGURE 4. Comparison of boundary treatment results: (A) Vertical stress distribution of soil after boundary treatment; (B) Vertical stress distribution of soil without boundary treatment.
4 Application of the SPH numerical method
In this section, rock slopes with one and three pre-cracks are simulated using the proposed method. Meanwhile, a determining method for SPH safety factor based on a strength reduction method is proposed. The result is then compared with those of the finite element numerical simulation method (FEM) to verify the correctness of the proposed method. In all examples, the linear cohesive law is adopted, and the smoothing length (h) is chosen to be
4.1 Simulation of a rock slope collapse process with one pre-crack
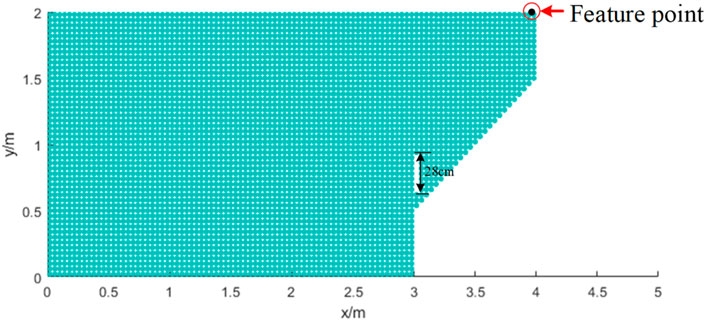
A rock slope model produced by the SPH method is carried out in this section. The purpose of this test is to verify the performance of the proposed numerical framework in simulating slope collapse. The geometry and boundary conditions of this test are shown in Figure 5. The model is 400 cm long and 200 cm height. The initial pre-crack has a width of 4 cm and a length of 28 cm. A total of 4368 particles have been used and the initial distance between particles is
The development process of failure and collapse plotted by accumulated equivalent plastic strain for the rock slope at different times is shown in Figure 6. The development of the velocity of rock failure at different times is shown in Figure 6G–I.
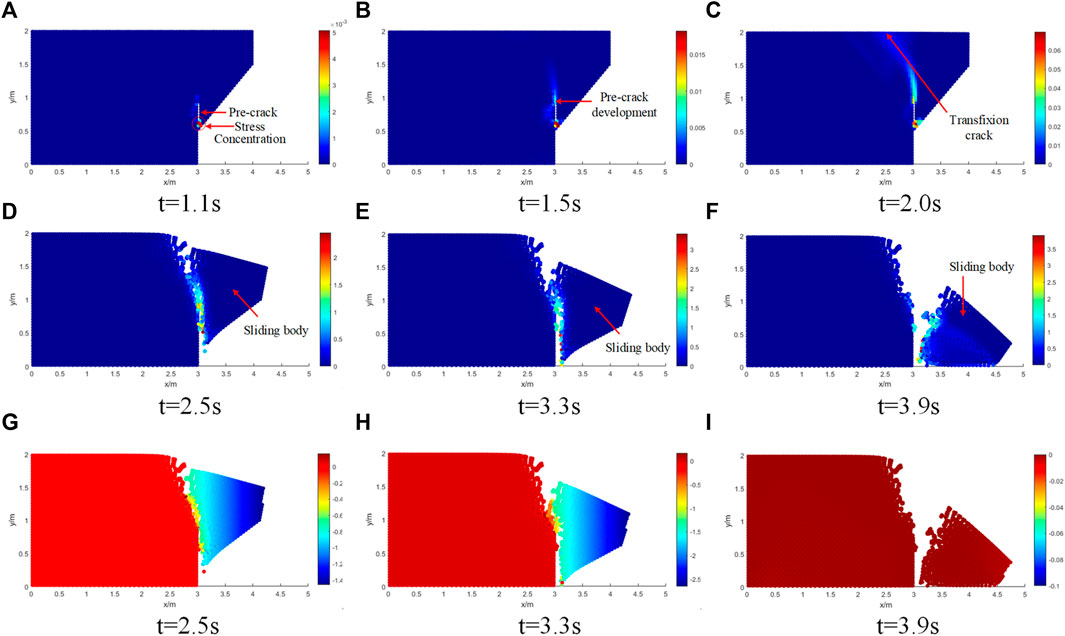
FIGURE 6. Development of collapse and sliding velocity at different times: Cumulative equivalent plastic strain (A-F); Slip velocity (G-I).
Figure 6A shows the stress concentration at the tip of the pre-crack under the action of gravity. Figure 6B shows that the pre-crack development and the slope is in a state of stability but does not completely fail at T=1.5 s, because the accumulated equivalent plastic strain zone is propagating from the toe to the crest at this moment. Then, the plastic shear strains band spreads forwards and upwards, and eventually the plastic shear strains are connected from the crest to the toe of the slope in Figure 6C, forming a slip surface. Figure 6D clearly shows that the slope begins to fail as a block along the surface, and the sliding body is not completely separated from the slope body. As time progresses, the sliding body displacement experiences a significant horizontal direction downwards as completely seen in the discrete block in Figures 6E,F. It can be corroborated by the velocity nephogram, as shown in Figure 6I, that the sliding velocity of slope collapse is zero, which means that the movement and collapse of the slope has stopped.
4.2 Determination of safety factor
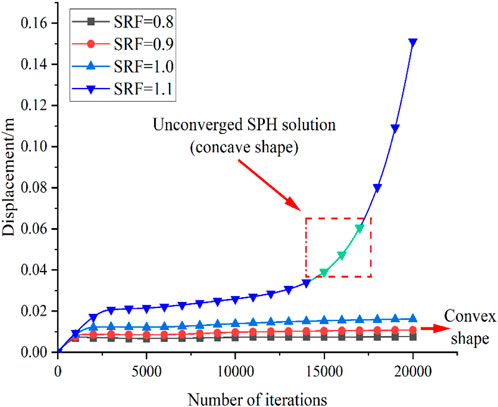
The failure criterion for slope stability analysis in the finite element method with shear strength reduction (SRF) technique, proposed by Griffiths and Lane (1999), is based on consideration of the relation between node displacements and SRF values. If a sudden change is observed in the node displacement within a user-specified maximum number of interactions, the computation is considered to be non-convergent, and the critical value of SRF yielding a non-convergent solution is considered to be the safety factor of the slope. However, the failure criterion for slope stability analysis in SPH is not applicable to the FEM, because SPH simulation cannot cause a non-convergent solution with any reduction factor. Rather, a simple approach is proposed to define the factor of safety in an SPH simulation.
The approach is based on the maximum displacement at the feature point (see Figure 5) during a specified time duration for each value of SRF. If the maximum displacement at the feature point remains unchanged or the value of this maximum displacement is relatively small at a reduction factor, the slope is defined as stable. On the other hand, if the maximum displacement cannot converge to a small and stable value, the failure develops, and the corresponding SRF is considered as the safety factor of the slope.
In this paper, the process of the reduction is described as follows: The reduction factor of the SRF is initially set as 1.0 and then is increased by a step size of 0.1 during the next calculation. Note that if SRF is less than 1.0, this factor would be reduced, and the criterion determining the safety factor of the slope should be adjusted. When a sudden increase in feature point displacement appears, the failure of the slope occurs. Thus, the corresponding SRF at current computation is considered to be the safety factor. Thus, Figure 7 shows the calculation result as a safety factor is 1.1.
4.3 Simulation of a rock slope collapse process with three precast-cracks
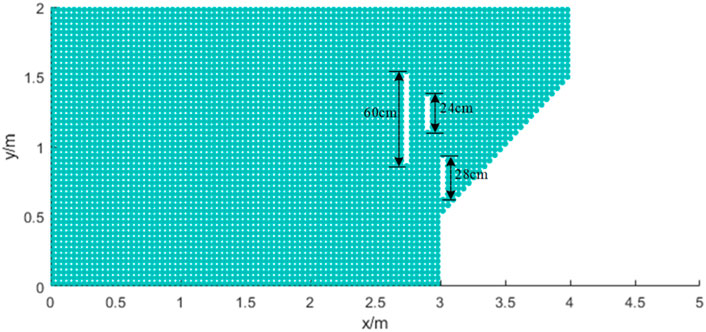
Similarly, in order to further verify the effectiveness of the proposed method in the instability prediction and failure process of a rock slope, a model produced by the SPH method is carried out with three precast cracks. The initial pre-cracks have a width of 4 cm and lengths of 60cm, 28 and 24 cm, respectively (see Figure 8). The material parameters, initial distance between particles and boundary conditions are consistent with those described above (Table 1).
The development process of the failure surface plotted by accumulated equivalent plastic strain for rock slope at different times is shown in Figure 9 and also documents the nature of the slope failure mechanism.
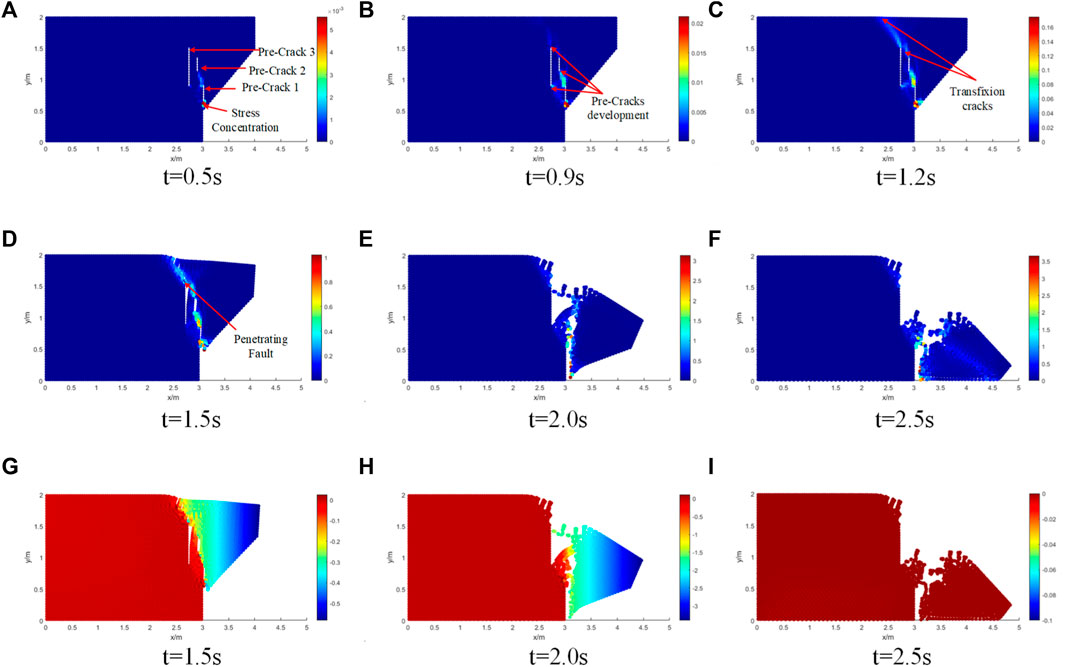
FIGURE 9. Development of collapse and sliding velocity at different times: Cumulative equivalent plastic strain (A-F); Slip velocity (G-I).
As shown in Figure 9A, under the action of self weight, pre-crack one shows stress concentration and expands to crack 2. When the time is equal to 0.9s, cracks one and 2 run through. At the same time, stress concentration occurs at the bottom of crack 3, as shown in Figure 9B. As can be seen from Figure 9C, with the increase of calculation time, the top of crack three runs through the top of the slope, and the stress concentration appears at the top of crack 2 and extends to the top of crack 3.
With the further increase of time, the cracks completely penetrated the whole slope body, the slope body became unstable, and local collapse occurred, as shown in Figure 9D. The collapse is further aggravated, as shown in Figure 9E, but the sliding body is not completely separated from the slope body at this time. Compared with Figure 9H, it is found that the sliding body still has a certain speed at this time, indicating that the slope collapse has not stopped. When the time is equal to 2.5 s, the sliding body completely separates from the slope body. According to the comparison of Figure 9I, the speed of the sliding body is zero at this time, which demonstrates the complete collapse of the slope and reflects the movement characteristics after instability.
5 Conclusion
The SPH code with D-P constitutive model is applied to investigate the collapse of rock slopes for the first time in this paper. For slope stability, the development of the shear band or failure process is well predicted through the accumulated plastic strain. The numerical results show that the SPH method is a reliable and robust method to simulate failure and collapse processes of geomaterials. Meanwhile, the successful application in rock slope collapse modeling indicates that the SPH method should be allowed further developments for other applications in geotechnical engineering.
Data availability statement
The raw data supporting the conclusions of this article will be made available by the authors, without undue reservation.
Author contributions
XZ and ZS were responsible for the work concept or design; XS was responsible for drafting the manuscript; SW were responsible for making important revisions to the manuscript; XZ and SW were responsible for approving the final version of the manuscript for publication.
Funding
The work was supported by the National Natural Science Foundation of China (Nos. 51934003), the Key Laboratory of Ministry of Education of China for Efficient Mining and Safety of Metal Mines (No. ustbmslab201906), the Research Start-up Fund for Introduced Talent of Kunming University of Science and Technology (KKSY201921029), The Yunnan Fundamental Research (NO. 202001AU070027).
Conflict of interest
The authors declare that the research was conducted in the absence of any commercial or financial relationships that could be construed as a potential conflict of interest.
Publisher’s note
All claims expressed in this article are solely those of the authors and do not necessarily represent those of their affiliated organizations, or those of the publisher, the editors and the reviewers. Any product that may be evaluated in this article, or claim that may be made by its manufacturer, is not guaranteed or endorsed by the publisher.
References
Bui, H. H., and Fukagawa, R. (2013). An improved sph method for saturated soils and its application to investigate the mechanisms of embankment failure: Case of hydrostatic pore-water pressure. Int. J. Numer. Anal. Methods Geomech. 37 (1), 31–50. doi:10.1002/nag.1084
Cao, R. H., Cao, P., Fan, X., Xiong, X., and Lin, H. (2016). An experimental and numerical study on mechanical behavior of ubiquitous-joint brittle rock-like specimens under uniaxial compression. Rock Mech. Rock Eng. 49 (11), 4319–4338. doi:10.1007/s00603-016-1029-6
Chen, W., Qiu, Tong., and Asce, M. (2012). Numerical simulations of granular materials using smoothed particle hydrodynamics method. Int. J. Geomechanics 12 (2), 127–135. doi:10.1061/47628(407)20
Cundall, P. A., and Strack, O. D. L. (1979). A discrete numerical model for granular assemblies. Geotechnique 29 (1), 47–65. doi:10.1680/geot.1979.29.1.47
Drucker, D. C., and Prager, W. (2013). Soil mechanics and plastic analysis or limit design. Q. Appl. Math. 10 (2), 157–165. doi:10.1090/qam/48291
Gao, Y. F., Bower, A. F., Kim, K. S., Lev, L., and Cheng, Y. T. (2006). The behavior of an elastic–perfectly plastic sinusoidal surface under contact loading. Wear 261 (2), 145–154. doi:10.1016/j.wear.2005.09.016
Gingold, R. A., and Monaghan, J. J. (1977). Smoothed particle hydrodynamics: Theory and application to non-spherical stars. Mon. notices R. astronomical Soc. 181, 375–389. doi:10.1093/mnras/181.3.375
Griffiths, D. V., and Lane, P. A. (1999). Slope stability analysis by finite elements. Geotechnique 49 (3), 387–403. doi:10.1680/geot.1999.49.3.387
Guo, Y. J., and Nairn, J. A. (2006). Three-dimensional dynamic fracture analysis using the material point method. Comput. Model. Eng. Sci. 16 (1), 141–155. doi:10.1139/T07-900
Hu, Y., and Randolph, M. F. (1998). H-adaptive FE analysis of elasto-plastic non-homogeneous soil with large deformation. Comput. Geotech. 23 (2), 61–83. doi:10.1016/S0266-352X(98)00012-3
Kong, G., Zhou, H., Cao, Z., and Liu, H. (2014). Analytical solution for pressure-controlled elliptical cavity expansion in elastic–perfectly plastic soil. Geotech. Lett. 4 (2), 72–78. doi:10.1680/geolett.14.00004
Kwok, O. L. A., Guan, P. C., Cheng, W. P., and Sun, C. T. (2015). Semi-Lagrangian reproducing kernel particle method for slope stability analysis and post-failure simulation. KSCE J. Civ. Eng. 19 (1), 107–115. doi:10.1007/s12205-013-0550-3
Li, S., and Liu, W. K. (2002). Meshfree and particle methods and their applications. Appl. Mech. Rev. 55 (1), 1–34. doi:10.1115/1.1431547
Li, W. C., Li, H. J., Dai, F. C., and Lee, L. M. (2012). Discrete element modeling of a rainfall-induced flowslide. Eng. Geol. 149-150, 22–34. doi:10.1016/j.enggeo.2012.08.006
Lin, H., Yang, H., Wang, Y., Zhao, Y., and Cao, R. (2019). Determination of the stress field and crack initiation angle of an open flaw tip under uniaxial compression. Theor. Appl. Fract. Mech. 104, 102358. doi:10.1016/j.tafmec.2019.102358
Liu, G., Li, J., and Kang, F. (2019). Failure mechanisms of toppling rock slopes using a three-dimensional discontinuous deformation analysis method. Rock Mech. Rock Eng. 52, 3825–3848. doi:10.1007/s00603-019-01797-6
Lucy, L. B. (1977). A numerical approach to the testing of the fission hypothesis. Astron. J. 8 (12), 1013–1024. doi:10.1086/112164
Ning, Y. J., An, X. M., Lü, Q., and Ma, G. W. (2012). Modeling rock failure using the numerical manifold method followed by the discontinuous deformation analysis. Acta Mech. Sin. 28 (3), 760–773. doi:10.1007/s10409-012-0055-1
Shi, G. H. (1991). Manifold method of material analysis. Transactions of the 9 army conference on applied mathematics and computing. Durham, United States: U. S. Army Research Office.
Sitar, N., Maclaughlin, M. M., and Doolin, D. M. (2005). Influence of kinematics on landslide mobility and failure mode. J. Geotech. Geoenviron. Eng. 131 (6), 716–728. doi:10.1061/(asce)1090-0241(2005)131:6(716)
Tian, Y., Cassidy, M. J., Randolph, M. F., Dong, W., and Gaudin, C. (2014). A simple implementation of ritss and its application in large deformation analysis. Comput. Geotech. 56 (3), 160–167. doi:10.1016/j.compgeo.2013.12.001
Wang, D. D., Li, Z. Y., Li, L., and Wu, Y. C. (2011). Three dimensional efficient meshfree simulation of large deformation failure evolution in soil medium. Sci. China Technol. Sci. 54, 573–580. doi:10.1007/s11431-010-4287-7
Wang, D., Randolph, M. F., and White, D. J. (2013). A dynamic large deformation finite element method based on mesh regeneration. Comput. Geotechnics 54 (10), 192–201. doi:10.1016/j.compgeo.2013.07.005
Wang, J., Wei, W., Zhang, J., and Mishra, B. (2020). Numerical investigation on the caving mechanism with different standard deviations of top coal block size in LTCC. Int. J. Min. Sci. Technol. 30 (5), 583–591. doi:10.1016/j.ijmst.2020.06.001
Wong, R., Chau, K. T., and Wang, P. (1996). Microcracking and grain size effect in yuen long marbles. Int. J. Rock Mech. Min. Sci. Geomechanics Abstr. 33 (5), 479–485. doi:10.1016/0148-9062(96)00007-1
Zhang, B., He, Q., Lin, Z., and Li, Z. (2021). Experimental study on the flow behaviour of water-sand mixtures in fractured rock specimens. Int. J. Min. Sci. Technol. 31 (3), 377–385. doi:10.1016/j.ijmst.2020.09.001
Zhang, H. W., Wang, K. P., and Chen, Z. (2009). Material point method for dynamic analysis of saturated porous media (ii): Dynamic contact analysis between saturated porous media and solid bodies. Chin. J. Geotechnical Eng. 31 (11), 1672–1679. doi:10.1115/1.1431547
Zhang, J. F., Zhang, W. P., and Yao, Z. (2005). A meshfree method and its applications to elasto-plastic problems. J. Zhejiang Univ. Sci. 6 (2), 148–154. doi:10.1631/jzus.2005.a0148
Keywords: rock slope, smoothed particle hydrodynamics, slope collapse, instability process, slope failure
Citation: Zhang X, Song X and Wu S (2023) Simulation of collapse failure process of rock slope based on the smoothed particle hydrodynamics method. Front. Earth Sci. 10:982658. doi: 10.3389/feart.2022.982658
Received: 30 June 2022; Accepted: 31 October 2022;
Published: 05 May 2023.
Edited by:
Bo Li, Tongji University, ChinaReviewed by:
Zhanping Song, Xi’an University of Architecture and Technology, ChinaLinwei Li, Guizhou University, China
Jia Yanchang, College of Geosciences and Engineering North China University of water resources and hydropower, China
Yanbin Yu, Shandong University of Science and Technology, China
Yanlin Zhao, Hunan University of Science and Technology, China
Copyright © 2023 Zhang, Song and Wu. This is an open-access article distributed under the terms of the Creative Commons Attribution License (CC BY). The use, distribution or reproduction in other forums is permitted, provided the original author(s) and the copyright owner(s) are credited and that the original publication in this journal is cited, in accordance with accepted academic practice. No use, distribution or reproduction is permitted which does not comply with these terms.
*Correspondence: Xiaoqiang Zhang, zhangxiaoqiang@kust.edu.cn
 Xiaoqiang Zhang1,2*
  Xiong Song