Convection of snow: when and why does it happen?
 Mahdi Jafari1,2*
  Michael Lehning1,2
- 1CRYOS, School of Architecture, Civil and Environmental Engineering, EPFL, Lausanne, Switzerland
- 2WSL Institute for Snow and Avalanche Research SLF, Davos, Switzerland
Convection of water vapor in snowpacks is supposed to have a major impact on snow density and microstructure profiles with strong implications for the thermal regime and snow stability. However, the process has never been directly measured and only recently been simulated for idealized conditions. The analysis suggests that natural convection is not likely to happen in typical horizontally homogeneous polar or Alpine snow covers. This paper studies the potential impact of heterogeneity induced, e.g., by shrubs on convection of water vapor. We find that natural convection triggered by buoyancy occurs even with sub-critical Rayleigh number as low as 5 due to heterogeneity in snow density. This leads to complementing contributions of diffusive and convective flux divergence on snow density changes. The combined effect of diffusion and convection helps to generate the often-observed low density foot and high-density top of, e.g., Arctic snowpacks. The strongest effect of convection is not for very thin or thick snow covers but for snow covers with thickness in the order of 0.5 m. This scale facilitates the development of convection cells. Further work should address the additional effects of sub-snow lateral temperature variations and assess the effect of convective vapor fluxes on snow microstructure.
1 Introduction
As temporary water storage, snow covers control ground water recharge and energy fluxes at or near the land surface (Groisman et al., 1994), making modeling of the snow cover properties crucial in many applications, e.g., for soil thermal properties and permafrost dynamics (Haberkorn et al., 2017; Bender et al., 2020), climate models, hydrological models for irrigation and hydroelectricity Bavay et al. (2013), etc. Water vapor transport is a dominant dynamical process in the snowpack for detailed modeling of snow cover properties and in particular influences snow density and microstructure. Water vapor fluxes are involved in snow metamorphism (Colbeck, 1983, 1987; Sturm and Benson, 1997; Pfeffer and Mrugala, 2002), snowpack stability and avalanches (Pfeffer and Mrugala, 2002; Woo, 2012), and thermal implications for climate studies (Slater et al., 2001; Callaghan et al., 2011). The basal density in thin Arctic snow can decrease by more than 100 kg m−3 with water vapor flux as the only plausible explanation (Trabant and Benson, 1972; Sturm and Benson, 1997; Domine et al., 2016b). Domine et al. (2019) pointed out that current versions of one-dimensional snow models lack an accurate description of water vapor transport and thus they cannot simulate Arctic snowpacks. At the same time, water vapor flux in snow has never been measured directly. Based on Palm and Tveitereid (1979); Powers et al. (1985), the critical Rayleigh number for the onset of convection ranges between 27 and 40 and it has been concluded that convection is unlikely in most natural snow covers, while Sturm and Johnson (1991) have postulated convection to occur for Rayleigh numbers as low as 4.
The studies conducted by Trabant and Benson (1972); Sturm and Benson (1997); Domine et al. (2016b, 2019) aimed to explain the observed lower density found at the bottom of Arctic snow covers. These studies suggested that water vapor transport is responsible for the decreased snow density profiles, but they were unable to quantitatively distinguish between the effects of diffusion and convection. Earlier numerical studies of water vapor transport in snow focused exclusively on diffusion. This is despite the observation that convection may also occur depending on snowpack conditions (Trabant and Benson, 1972; Johnson et al., 1987; Alley et al., 1990; Sturm and Johnson, 1991; Domine et al., 2016b, 2018) and partly caused by the fact that it is not possible to explicitly model convection with phase change in a one-dimensional snow model (Jafari et al., 2020; Jafari et al., 2022). To address this limitation, Jafari et al. (2022) utilized state-of-the-art numerical simulations to quantitatively investigate the impact of convection on snow density profiles at various snowpack depths, thermal boundary conditions, and Rayleigh numbers using a volume-averaged two-phase model in a two-dimensional domain. Jafari et al. (2022) observed a significant impact of natural convection on snow density distribution, with a lower density layer at the bottom of the snowpack and a higher density layer at the top. However, their idealized snowpack model only partially explained previous density change observations reported above.
Vegetation, e.g., shrubs and herbs, growing on Arctic tundra increases snow height, thermal insulating effect of the snow and affects snow properties (Domine et al., 2016a; Gouttevin et al., 2018). In addition, snow often falls on terrain with a rough surface caused by rocks or pressure ridges on sea ice. As reviewed and pointed out by Domine et al. (2016a), as of yet, there is no extensive study of the impact of shrubs on snow physical properties. The important impacts of vegetation are their limited snow-holding capacity, mechanically reduced compaction, and enhanced grain growth (Domine et al., 2016a; Gouttevin et al., 2018). These effects result in lower initial density due to the presence of vegetation after snowfall (Gouttevin et al., 2018). Since shrubs and other roughness elements have a rather random distribution in space, the resulting heterogeneity in initial snow density may influence convection and enhance the effects of water vapor transport on snow density change. In their Samoylov permafrost observation, Gouttevin et al. (2018) reported vegetation with a typical height of 15–20 cm. It got compressed by snow, reducing vegetation height to 7–10 cm. They chose a fresh snow density of 150 kg m−3 for the best match to end-of-season in situ density observations. At Bylot Island in the Canadian high Arctic, Domine et al. (2016a) reported bushes of 20–40 cm high. They noticed that the network of stems limits snow compaction in shrubs, with observed densities as low as 125 kg m−3. To mimic the limited snow compaction, Domine et al. (2016a) increased the viscosity of dry snow in the presence of shrubs by a factor of 100 up to a snow height of 10 cm and by a factor of 10 to the top of the shrub. In summary, large uncertainties exist relating to snow-holding capacity of vegetation after snowfall, the effective size of low density patches, and the distribution and coverage percentage of vegetation.
In addition to induced heterogeneity by vegetation in the initial snow density, there will be thermal perturbations which lead to lateral temperature gradients in the soil due to presence of vegetation that might strengthen convection effects. Gouttevin et al. (2018) showed that in low-center polygons in permafrost terrain there are large temperature differences in the soil within a short distance, especially during freezing. This is because short-scale differences in soil moisture lead to different freezing dynamics and therefore temperature gradients. Differences in thermal regime between heterogeneity patches filled with vegetation and its neighbouring vegetation-free patches as well as the soil interface all lead to horizontal temperature gradients at the bottom boundary. This has been shown by the recent study (Domine et al., 2022) for thermal bridging through shrub branches. They observe significant perturbations of the permafrost thermal regime by shrub branches. In this paper, we did not consider the thermal feedbacks from vegetation, i.e., modifying the thermal conductivity (considering vegetation as a component in porous material) or imposing a lateral-varying thermal boundary condition at the bottom since this would require simulations coupled with soil, which we consider a subject of future work and beyond the scope of the current analysis.
Thus in this paper, we investigate numerically in how far density heterogeneity can influence convection. We hypothesize that it may facilitate onset and increase strength of convection cells. If the hypothesis can be confirmed, we have contributed to an increased understanding of snow dynamics. In particular, the current state of the art cannot explain the presumed role of convection in shaping typical Arctic density profiles. More frequent and stronger convection is required in our numerical model Jafari et al. (2022) to achieve the desired effect. The following analysis tests the influence of lateral heterogeneity in that context.
2 Materials and methods
Following the work done by Jafari et al. (2022), water vapor transport due to natural convection in idealized snowpacks is investigated numerically using an Eulerian–Eulerian two-phase approach. The snowpack is considered as a two-phase (humid air, ice) porous medium by neglecting the effects of ventilation and snow compaction to focus only on convection.
Applying the volume averaging method (Whitaker, 1999; Faghri and Zhang, 2006), the final set of the equations are mass conservation equations for the gas mixture (humid air), water vapor component, and ice phase, the momentum equation for the gas mixture, and finally the temperature-based energy equations for the gas and ice phases. These equations are solved to update the water vapor and air component densities as ρv and ρa respectively, the snow porosity as volumetric fraction of the gas phase ϵg and ice volumetric fraction ϵi = 1 − ϵg, the snow density ρs = ϵiρi, where ρi is the ice density, the gas flow velocity Ug, the diffusive water vapor flux Jv = −Deff∇ρv where Deff is the effective water vapor diffusivity, the phase change rate
Assuming that herbs and shrubs introduce heterogeneity in the initial snow density, the heterogeneity is modelled as half-circle patches of lower density. Size (radius) and spacing between patches are specified in our two-dimensional snowpack of the depth H and the length L. Note that ρvs is the saturation water vapor density and ρvs0 is the reference saturation density at Tref. Figure 1A shows a sketch of the domain including the heterogeneity patches with the cyclic boundary conditions on lateral sides and impermeable walls with zero flux for the gas phase on top and bottom boundaries. For the heat transfer equations of both phases, the reference temperature is used as the bottom warm boundary condition, Th = Tref, whereas Tc = Tref − ΔT is applied for the top cold boundary. Here, ΔT is the temperature difference between top and bottom boundaries. The sensitivity analysis in Jafari et al. (2022) has shown that the results are not sensitive to the choice of initial temperature and vapor distribution. Thus, the initial conditions (spatially uniform) are the reference temperature for both ice and gas phases and the saturation water vapor density. Extended and fairly homogeneous patches of vegetation would indeed present a wider area of higher flow velocity to form convection cells than scattered shrubs studied in this study shown in Figure 1A. They would nonetheless lead to lateral heterogeneity because they will not have the same height everywhere.
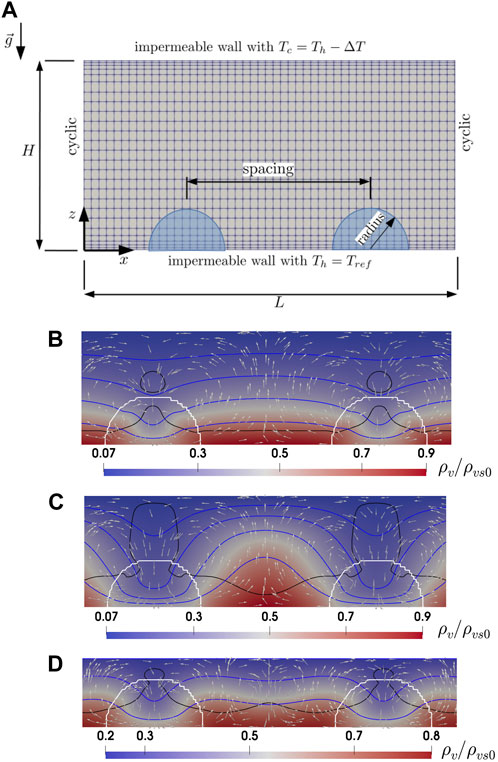
FIGURE 1. A sketch of two-dimensional domain with non-uniform mesh and prescribed boundary conditions shown in subplot (A) and the convection cells, the flow direction, and normalized water vapor distribution between two heterogeneity patches with radius size of 20 cm after a week of simulation for (B)H =50 cm, Ra =5, (C)H =50 cm, Ra =30, and (D)H =30 cm, Ra =30. The white arrows show the flow direction scaled by velocity magnitude. The black line refers to the saturation line where ρv = ρvs. The isotherm lines for the snow temperature are in blue color and are equally spaced by 5K.
As will be discussed later, to analyze the impact of heterogeneity on snow density change, we need to compare the contributions of convective and diffusive terms in the mass conservation of water vapor. As discussed in Jafari et al. (2022), the convective-diffusive heat and mass transfers with phase changes in snowpacks are very slow processes and changes are small enough at each time step to consider a quasi-steady state process. Therefore, with the approximation for the convection term as ∇ ⋅ (ρvUg) ≈ Ug ⋅∇ρv (Jafari et al., 2022), the simplified mass conservation of the water vapor may be written as:
When buoyancy forces, driven by unstable fluid density gradients, are large enough to overcome viscous drag, natural convection in a porous medium is triggered. This can be evaluated by the Rayleigh number when it exceeds the critical value of Rac = 4π2 = 39.48 (Lapwood, 1948). The Rayleigh number as the ratio of buoyancy to viscous forces in a porous medium is defined as:
where, H is the depth of porous layer, K is the intrinsic snow permeability, g is the gravitational acceleration, keff,s is the effective thermal conductivity of snow, and the air density
3 Results and discussion
As noted by Jafari et al. (2022), the thermal regime without phase change may be explained using the Rayleigh number, assuming a homogeneous porous material with fixed thermal boundary conditions. However, with phase change, the thermal and primarily phase change regimes are only partially scaled by Rayleigh number. Despite this, Rayleigh number remains a valid measure for comparison in the heat transfer regimes, as dependence of the phase change regime may be explained partially by dimensional analysis, as discussed in Jafari et al. (2022) and later in this section. We stick the classic definition of Rayleigh number, assuming a uniform porous material with fixed boundary conditions and an initial state of the porous material. As the system evolves through phase change, the porosity and thermo-physical properties change as well. There are studies, for example, NIELD (1997), that use an effective Rayleigh number that takes into account the vertical and horizontal differences in permeability and thermal diffusivity, but this is not as heterogeneous and dynamic as our case study, where porosity changes everywhere in our domain. Therefore, using an effective Rayleigh number by assuming average snow permeability and snow-density dependent thermo-physical properties is cumbersome. As explained earlier, for the parts that are not completely dependent on Rayleigh number, we directly use dimensional analysis.
The three snow heights investigated in this section are H = 30 cm (thin), H = 50 cm (shallow) and H = 75 cm (thicker). For each snow height, four sub-critical Rayleigh numbers of 5, 10, 20 and 30 are considered with corresponding values for initial snow density, respectively, as 221, 188, 157, and 138 kg m−3 for a thin, 272, 237, 204, and 184 kg m−3 for a shallow, and finally 315, 278, 243, and 223 kg m−3 for thicker snowpack. The specific surface area for all cases is 6.54 m2 kg−1. Given the fact that both diffusive and convective terms in Eq 1 depend mainly on the temperature gradient (Jafari et al., 2020; Jafari et al., 2022), we consider the bulk temperature gradient to be the same for all cases as ΔT/H = 60 Km−1. The different initial snow densities used in our study are calculated based on the snow depths, Rayleigh number, and specific surface area (a function of porosity and snow grain diameter which is assumed to be 1 mm). These values are consistent with the sub-arctic snowpack, as, e.g., in Sturm and Benson (1997). The typical properties for such snowpacks are a density of 200 kg m−3 (Sturm and Benson, 1997), an SSA of 10 m2kg−1 (Taillandier et al., 2006), a thermal conductivity around 0.05 Wm−1K−1 (Sturm and Johnson, 1992) and a permeability of around 400 × 10−10 m2 (Domine et al., 2013). Because of the dependency of Ra on initial snow density (Jafari et al., 2022), the larger snowpack must have a larger initial snow density and thus smaller convective velocities. To investigate the impact of heterogeneity in the initial density, we need to analyze the difference between convective and diffusive fluxes as follows:
As a reference, we first discuss the case without heterogeneity. For this case, when Rayleigh number exceeds the critical value, i.e., Ra > 39.48, we see convection cells forming in the domain. The heat and mass transfer regimes in upward and downward flows of a convection cell have been discussed in detail by Jafari et al. (2022). In summary, for the downward flow of a convection cell, we observe mostly a weak sublimation region (almost at saturation water vapor density) except for the region close to the warm bottom boundary with strong sublimation. For the upward flow of a convection cell, after the strong sublimation zone at the bottom, there is a strong deposition zone. As discussed in Jafari et al. (2022), for each convection cell, we have a strong vertically extended deposition zone as well as a strong horizontally extended sublimation one.
The difference between the case with and without heterogeneity for the snow density, convective water vapor flux divergence and diffusive water vapor flux divergence is shown in Figures 2–4, respectively. Note that these quantities are laterally averaged for each level of z excluding the heterogeneous low density patches. As shown in Figure 2 for the sub-critical Rayleigh numbers studied here, the snow density difference between the case with and without heterogeneity ranges from −30 to −75 kg m−3 for the shallow snowpack H = 50 cm and thicker snowpack H = 75 cm. However, the snow density difference is small and less than 30 kg m−3 for the thin snowpack H = 30 cm. It is important to note that convection in a snowpack does not occur in the absence of heterogeneity and phase change. Under the current simulation conditions, where the Rayleigh number is below the critical value (Ra = 5, 10, 20 and 30), no convection is observed without induced heterogeneity, which also influences the Rayleigh number, of course.
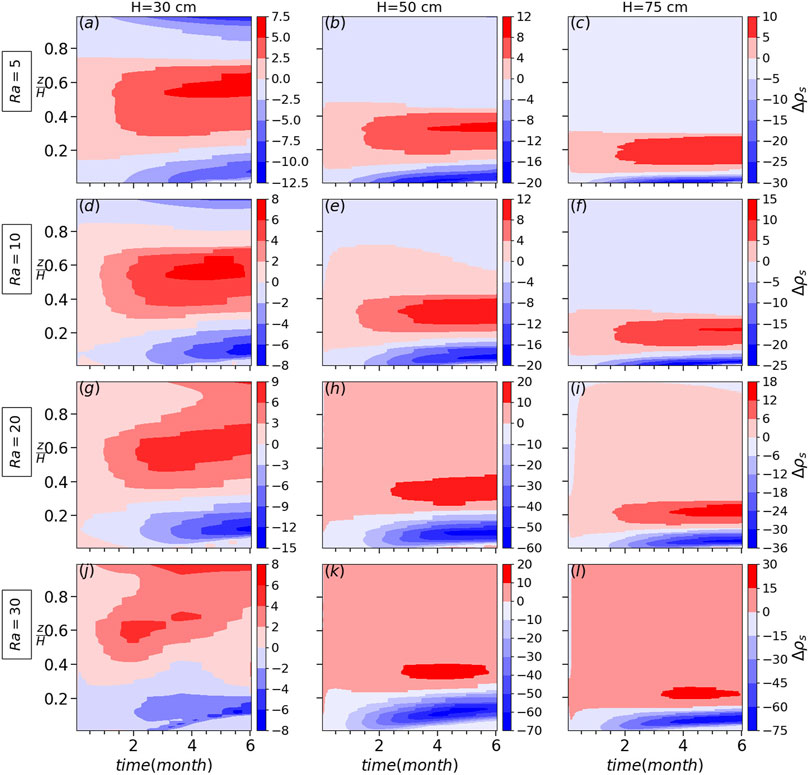
FIGURE 2. The snow density difference between the case with and without heterogeneity for different snow heights and Rayleigh numbers for the setup as shown in Figure 1A with the heterogeneity radius of 20 cm and spacing of 1 m.
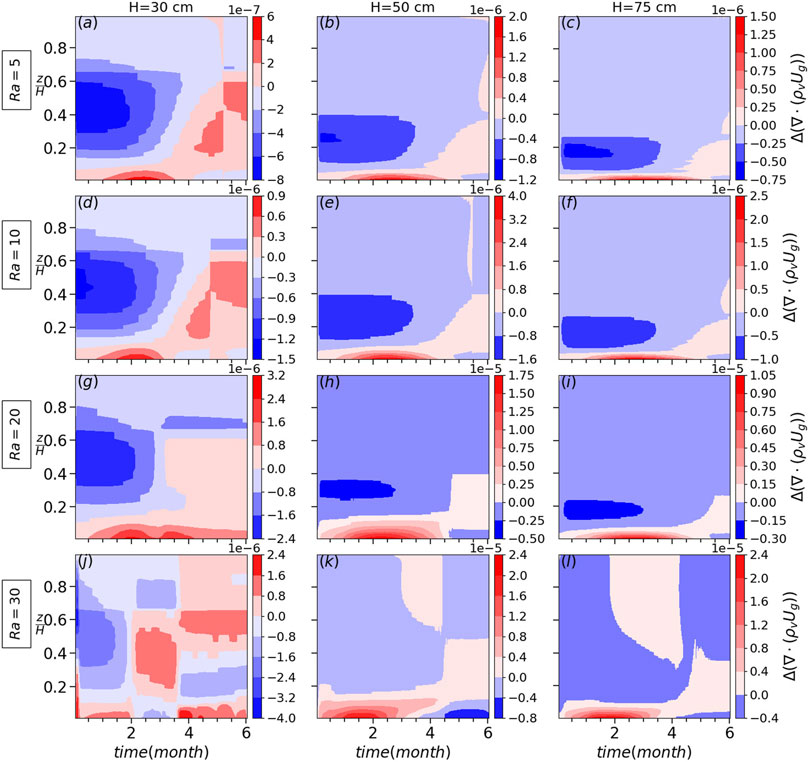
FIGURE 3. The difference in convective flux divergence ∇⋅(ρvUg) between the case with and without heterogeneity for different snow heights and Rayleigh numbers with the heterogeneity radius of 20 cm and spacing of 1 m.
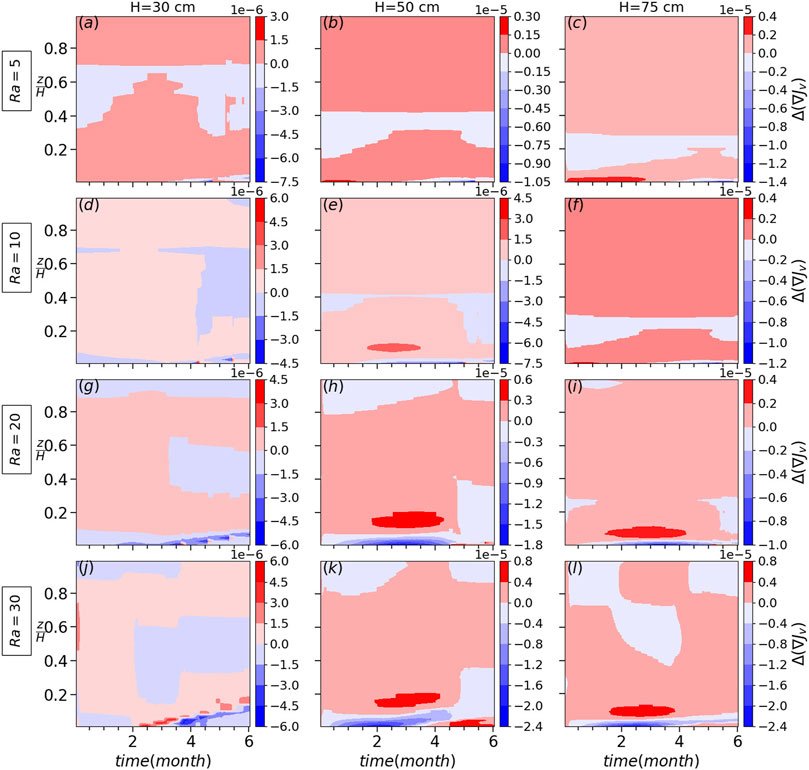
FIGURE 4. The difference in diffusive flux divergence ∇⋅ Jv between the case with and without heterogeneity for different snow heights and Rayleigh numbers with the heterogeneity radius of 20 cm and spacing of 1 m.
Once we introduce heterogeneity in the initial snow density as shown in Figure 1A, we observe convection cells forming even with sub-critical Ra as low as 5, e.g., Figure 1B. Obviously, a higher Rayleigh number results in a stronger convection cell with stronger temperature gradients (comparing isothermals between Figures 1B, C). Due to our initialization choice of a homogeneous (warm) temperature throughout the snow cover, the conductive thermal development initiates from the top. As the cold upper boundary condition starts to show effect and cold air to flow downwards, it looks for the path of minimum resistance which is towards the low density patches. Secondly, due to the lower thermal conductivity within the vertical column through the low density patch, the temperature gradient is locally somewhat smaller than that in neighbouring vertical columns outside of the patch. As a result, the buoyancy-driven upward driving force is stronger there and more homogeneous throughout the snow cover, thus potentially leading for the upward flow to establish in those columns (see the downward flow through heterogeneity patches in Figures 1B, C, and d). It is worth noting that after a few months of simulation, we observe lateral movement of convection cells as explained in detail in Jafari et al. (2022). This transports the water vapor through these patches, which subsequently leads towards the upward flow, which forms between two low density patches. As we have the same low density for the heterogeneous patches for all cases, the convective flow velocities are the same for cases with the same Ra. However, as soon as the flow goes through the domain of higher density (mainly horizontal flow close to the bottom boundary), depending on its snow density (convective flow velocity), the distribution of water vapor density becomes different. For the thicker snowpack H = 75 cm and for Ra = 5 (the lowest Rayleigh number), the flow cannot penetrate deep into the high density region and we have a higher concentration of water vapor compared to medium and small snowpacks. This leads to a higher vertical diffusive flux for larger snowpacks but smaller horizontal diffusive fluxes and flow velocity. This can be seen in Figure 3 comparing the fluxes between the shallow and thicker snowpacks. Note that for the thin snowpack, the horizontal diffusive flux is smaller because more but weaker convection cells are formed between heterogeneity patches. Therefore, ∇ ⋅ Jv (Figure 4) is the dominant term compared to Ug ⋅∇ρv (Figure 3) for larger snowpacks, favoring larger snow density changes for Ra = 5.
The water vapor distribution for Ra = 10 and Ra = 5 is the same except that for Ra = 10, the flow penetrates deeper into the region of larger density between two patches, resulting generally in a smaller vertical diffusive flux but larger horizontal diffusive flux close to low density patches. However, for Ra = 10, the flow still is not strong enough to transfer most of the water vapor far enough from the low density patches, horizontally and vertically, in order to have a comparatively larger horizontal diffusive flux relative to the vertical one (comparing the vapor distribution between Ra = 30 and Ra = 5 in Figure 1). This means that the increase in Ug ⋅∇ρv counteracts the decrease in ∇ ⋅ Jv for Ra = 10 such that the snow density change is smaller or equal compared to Ra = 5 (comparing subplots of Figure 2 for all snow heights between Ra = 5 and Ra = 10). For Ra = 20, the flow is strong enough to transport and accumulate the water vapor at the middle of the region of larger density between heterogeneous patches such that the horizontal diffusive flux is large enough close to the low density patches to have a dominant Ug ⋅∇ρv compared to ∇ ⋅ Jv (comparing related plots in Figures 3, 4 between different Rayleigh numbers). This is the reason for a larger snow density change for Ra = 20 and Ra = 30. For Ra > 20, comparing H = 50 cm and H = 75 cm, the impact of heterogeneity on snow density change is larger for H = 50 cm as a larger Ug causes a larger horizontal diffusive flux and both together result in a larger Ug ⋅∇ρv. However, unlike the reasoning for the shallow and thicker snowpacks, the snow density change is not increased for higher Rayleigh numbers (Ra = 20 and Ra = 30) in the thin snowpack H = 30 cm. This is because in a thin snowpack, a larger number of less intensive convection cells is formed in the region between heterogeneity patches as shown in Figure 1D. This decreases the horizontal diffusive fluxes and results in a smaller Ug ⋅∇ρv. Also, for the thin snowpack H = 30 and Ra = 30, even without heterogeneity in the initial snow density, the convection cells are formed since the initial density itself is small enough to trigger convection cells when the diffusive flux divergence reduces snow density at the bottom of the snowpack. It is worth to compare the convective and diffusive flux divergence (or convergence) by comparing and discussing both Figures 3, 4. Compared to convection, the effective size and the magnitude for diffusive convergence (mainly negative values favoring deposition) increases with Rayleigh numbers. However, the convective term is mainly positive (convective flux divergence) and favors sublimation counteracting the diffusive term effects. Obviously, its effects increases as Rayleigh number increases.
Spacing between and size of heterogeneity patches (shown in Figure 1A) mainly has effects on the number of convection cells formed in the domain as for higher Rayleigh numbers and also smaller snowpacks, more slender cells are expected to form. For example, for a larger spacing of 2 m, the water vapor distribution is shown in Figure 5 for the shallow snowpack H = 50 cm with different Rayleigh numbers. For Ra = 5, two large convection cells are formed (Figure 5A) while for Ra = 10 two smaller cells are added between the two large cells (Figure 5B). However, they are not strong enough to split the vapor distribution into two peaks as it is the case for higher Rayleigh numbers such as Ra=20 and Ra=30 (Figures 5C, D respectively). Comparing Ra=30 (Figure 5D) with Ra=20 (Figure 5C), the flow is stronger in the former and pushes water vapor further away from low density patches. The higher number of cells for the larger spacing of 2 m results in decreased lateral vapor fluxes and this is the reason for smaller effects of convection on snow density change for H = 50 cm (Ra = 20 and Ra = 30) compared to the ones for the smaller spacing of 1 m (comparing Figures 2H, K for spacing of 1 m with Figures 6H, K for spacing of 2 m respectively). Note that due to a smaller number of convection cells for H = 75 cm (only two) they are stronger compared to H = 50 cm. As a result, both lateral diffusive and convection terms are larger and lead to a larger snow density change (comparing all Rayleigh number between H = 75 cm and H = 50 cm in Figure 6). Also, the sensitivity analyses for different heterogeneity radii shows that the snow density change slightly increases as the low density patch size increases (Figure 7). Obviously, for limiting cases, i.e., very large spacing and very small low density patches, the effect of lateral heterogeneity on convection of water vapor transport vanishes. As discussed earlier, for different heterogeneity configurations (spacing and radius), the number of convection cells and the flow strength determine the relative contribution of diffusion and convection for snow density change.
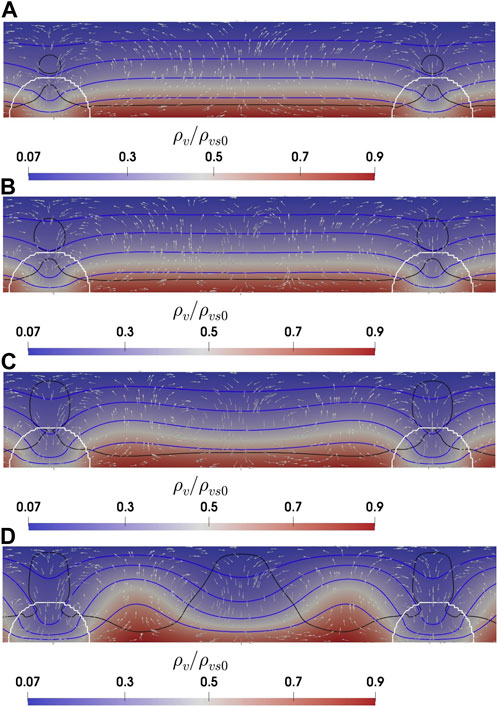
FIGURE 5. The convection cells, flow direction, and normalized water vapor distribution between two heterogeneity patches with radius size of 20 cm and spacing of 2 m after a week of simulation for the shallow snowpack H =50 cm (A)Ra =5, (B)Ra =10, (C)Ra =20, and (D)Ra =30. The arrows show the flow direction but not scaled by velocity magnitude. The black line refers to the saturation line where ρv = ρvs. The isotherm lines for the snow temperature are in blue color and are equally spaced by 5K.
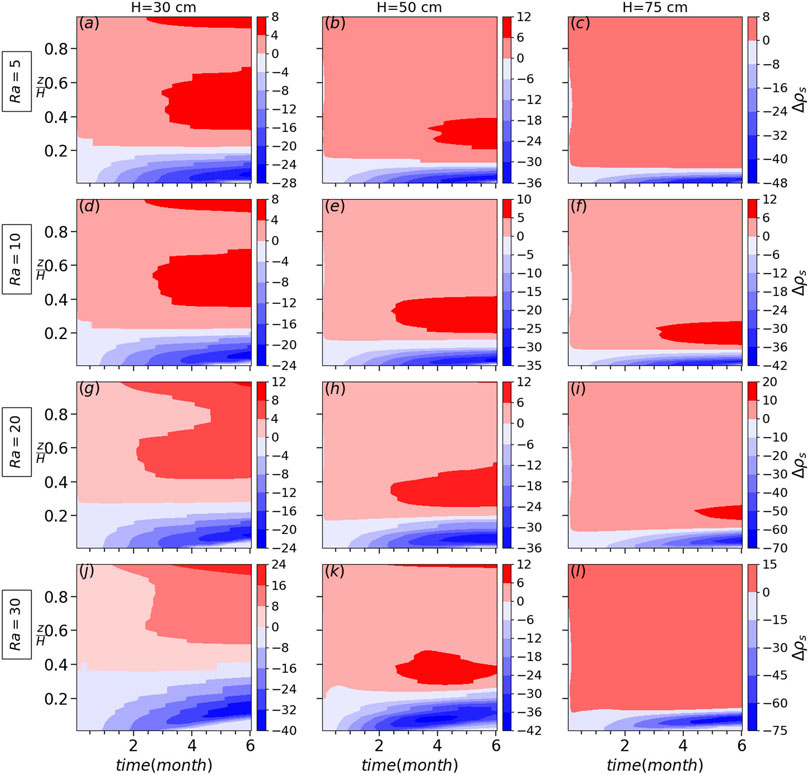
FIGURE 6. The snow density difference between the case with and without heterogeneity for different snow heights and Rayleigh numbers for the setup as shown in Figure 1A with the heterogeneity radius of 20 cm and spacing of 2 m.
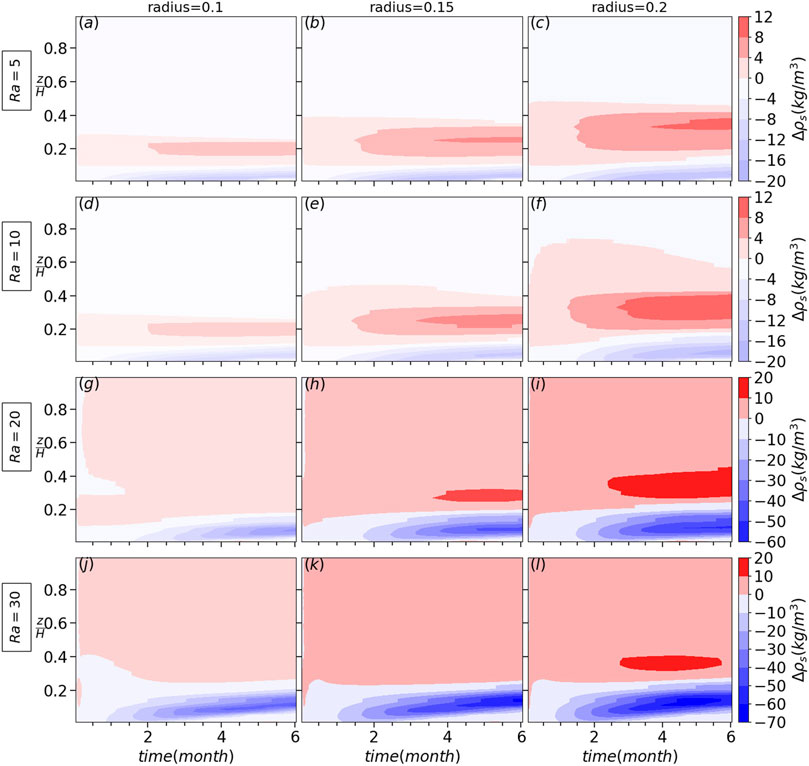
FIGURE 7. The snow density difference between the case with and without heterogeneity for different heterogeneity radii and Rayleigh numbers for the setup as shown in Figure 1A for the shallow snowpack H = 50 cm with spacing of 1 m.
To visualize the local variations in snow density resulting from water vapor transport, a two-dimensional plot of snow density is presented in Figure 8 for H = 50 cm and Ra = 30. The plot shows a decrease in snow density in the low density patches due to sublimation, which develops towards the middle between these patches. Additionally, it reveals the region of deposition at the top in upward flow. It should be noted that the initial snow density for these conditions is 184 kg m−3. After 2 months (Figure 8B), the local density is reduced by 124 kg m−3, resulting in the formation of a low density layer with an effective size of approximately 10 cm.
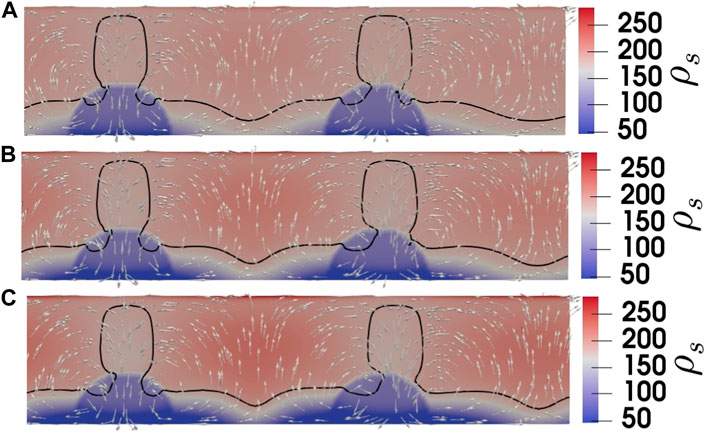
FIGURE 8. The two-dimensional plot of snow density for H =50 cm and Ra =30 with the heterogeneity radius of 20 cm and spacing of 1 m, (A) after a month, (B) after 2 months, and (C) after 3 months of simulation. The white arrows show the flow direction scaled by velocity magnitude. The black line refers to the saturation line where ρv = ρvs.
Investigating the combined effects of convection and diffusion on water vapor transport in real snow covers has not been done numerically thus far. One-dimensional snow models cannot model convection directly, but coupling SNOWPACK with OpenFOAM provides a way to account for convection in real snow covers. In the thesis by Jafari (2022), this has been attempted and valuable insights on the effects of convection has been generated: (1) a detailed analysis of flow velocity, thermal, and phase change regimes can serve as a basis for future parametrizations of convection in one-dimensional snow models without using OpenFOAM directly; (2) convection not only substantially alters the vertical snow density but also induces transient lateral heterogeneity in snow structure; (3) lateral heterogeneity due to convection affects snow properties linked to snow density, such as effective thermal conductivity, viscosity, and compaction; (4) differences in temperature profiles between the upward and downward flow of a convection cell cause temperature-dependent processes, such as metamorphism and melting-refreezing, to vary laterally within the snowpack. The model system simulated in Jafari (2022) provides a better understanding of the potential impacts of convection in snow covers and how it changes the snow structure. However as discussed there, even when the effects of convection are included, significant difference between observed snow density profiles and simulated ones remain. This is not surprising, since the density changing effects of convection are not included in current models of the mechanics of snow settling. This highlights the need for further improvements of the snow model, which is beyond the scope of this contribution. Particularly in the representation of snow settling and wind compaction, further progress is needed. The numerical model used in Jafari (2022) is a direct numerical solution that requires accurate thermo-physical properties, and its comparison with benchmark results shows an accuracy between 3 to less than 10%. Therefore, to make meaningful comparisons between simulations and measurements, these processes need to be modeled with a similar level of accuracy, which we currently cannot achieve.
4 Conclusion
In this paper, a numerical solver based on a volume-averaged two-phase model as previously implemented Jafari et al. (2022) in the open-source fluid dynamics software, OpenFOAM 5.0 (www.openfoam.org) has been used to investigate the role of initial snow density heterogeneity on convection of water vapor in snowbanks for different snow depths. Parameters such as Rayleigh number and the length scale of the heterogeneity have been varied in the investigation.
The study has been motivated by the observation that convection in rather shallow (Arctic) snow covers needs to be stronger than previously predicted by a numerical model. We tested the hypothesis that density variations as, e.g., caused by vegetation may help to trigger convection and lead to stronger vapor fluxes.
We observed that due to heterogeneity convection cells form even with sub-critical Rayleigh number as low as 5. The hypothesis could clearly be confirmed. We found further that the relative importance of diffusive versus convective contributions to snow density change is governed by highly non-linear feed backs: Depending on the flow strength coming from low density patches and penetrating into the region of larger density, the diffusive and convective flux divergences have different contributions for snow density change. For lower Rayleigh numbers, the vertical diffusive flux and its divergence is more dominant while for higher Rayleigh numbers the convective vapor flux divergence is the dominant term because of both higher convective flow velocity and horizontal diffusive flux. For very thin snow covers, a higher number of smaller and therefore weaker convection cells formed between low density patches, splits the accumulation of water vapor into multiple peaks and brings the accumulation peaks closer to the low density patches. This results in a smaller horizontal diffusive flux and finally a smaller convective vapor flux divergence and thus a smaller change in snow density. The results analyzed here showed significant impacts of heterogeneity on the snow density change, overall enhancing the contribution of convection. Hence, future work that aims to improve the one-dimensional physics-based multi-layer snow model by a tight coupling between OpenFOAM and SNOWPACK (Lehning et al., 1999) should take into account impacts of heterogeneity on the snow density change.
We acknowledge that a more direct verification of convection should be attempted at lab scale in future. The observation of convection of water vapor with phase change in snowpacks may be designed according to Figure 1 in Jafari et al. (2022) for snowpacks of depth H, length L, and fixed thermal boundary conditions for top and bottom. Limitations and considerations to be taken into account are as: (1) The length L should be large enough to contain a few convection cells, which means on the order of a few meters, (2) the experiment box containing snowpack should be designed such that the snow density can be measured at different places after laboratory experiment (with time scale of few weeks), (3) the thermal boundary conditions in the direction of thickness must be hold as zero gradient (well insulated).
This study demonstrates some important interactions of vapor transport in snow covers. It is, however, still idealized with respect to the numerical set-up and physical assumptions. Limitations of the work are therefore associated with the two dimensional model used as a basis. It is not given that a fully three-dimensional treatment would give the same quantitative results. A further limitation is the assumption of “no settling” and the non-consideration of laterally varying thermal boundary conditions. Future work should therefore attempt to model the system in three-dimensions and to allow for snow settling. A potential way to address 1) compaction and 2) laterally varying thermal boundary conditions coming from the soil is the coupling with existing snow cover models, which we will attempt as a next step.
Data availability statement
The original contributions presented in the study are included in the article further inquiries can be directed to the corresponding author.
Author contributions
MJ started the project by implementing the convective vapor transport in snowpacks and performed and analyzed the simulations. MJ also prepared the manuscript with the contribution of the second co-author, ML. ML has proposed the main idea behind the project as the supervisor. ML thoroughly revised the paper for submission. All authors contributed to the article and approved the submitted version.
Funding
This project is supported by the Swiss National Science Foundation-SNF, grant number 200021E-154248. Further support by the Swiss National Supercomputing Facility CSCS (grant: S938) is acknowledged. Open access funding by WSL—Swiss Federal Institute For Forest, Snow And Landscape Research.
Conflict of interest
The authors declare that the research was conducted in the absence of any commercial or financial relationships that could be construed as a potential conflict of interest.
Publisher’s note
All claims expressed in this article are solely those of the authors and do not necessarily represent those of their affiliated organizations, or those of the publisher, the editors and the reviewers. Any product that may be evaluated in this article, or claim that may be made by its manufacturer, is not guaranteed or endorsed by the publisher.
References
Alley, R., Saltzman, E., Cuffey, K., and Fitzpatrick, J. (1990). Summertime formation of depth hoar in central Greenland. Geophys. Res. Lett.17, 2393–2396. doi:10.1029/gl017i013p02393
Bavay, M., Grünewald, T., and Lehning, M. (2013). Response of snow cover and runoff to climate change in high alpine catchments of eastern Switzerland. Adv. Water Resour.55, 4–16. Snow–Atmosphere Interactions and Hydrological Consequences. doi:10.1016/j.advwatres.2012.12.009
Bear, J. (1961). On the tensor form of dispersion in porous media. J. Geophys. Res.66, 1185–1197. doi:10.1029/jz066i004p01185
Bender, E., Lehning, M., and Fiddes, J. (2020). Changes in climatology, snow cover, and ground temperatures at high alpine locations. Front. Earth Sci.8, 100. doi:10.3389/feart.2020.00100
Callaghan, T. V., Johansson, M., Brown, R. D., Groisman, P. Y., Labba, N., Radionov, V., et al. (2011). Multiple effects of changes in arctic snow cover. AMBIO40, 32–45. doi:10.1007/s13280-011-0213-x
Calonne, N., Geindreau, C., and Flin, F. (2015). Macroscopic modeling of heat and water vapor transfer with phase change in dry snow based on an upscaling method: Influence of air convection. J. Geophys. Res. Earth Surf.120, 2476–2497. doi:10.1002/2015JF003605
Colbeck, S. C. (1983). Theory of metamorphism of dry snow. J. Geophys. Res. Oceans88, 5475–5482. doi:10.1029/JC088iC09p05475
Colbeck, S. C. (1987). Snow metamorphism and classification. Dordrecht: Springer Netherlands, 1–35. doi:10.1007/978-94-009-3947-9_1
Domine, F., Morin, S., Brun, E., Lafaysse, M., and Carmagnola, C. (2013). Seasonal evolution of snow permeability under equi-temperature and temperature-gradient conditions. Cryosphere7, 1915–1929. doi:10.5194/tc-7-1915-2013
Domine, F., Barrere, M., and Morin, S. (2016a). The growth of shrubs on high arctic tundra at bylot island: Impact on snow physical properties and permafrost thermal regime. Biogeosciences13, 6471–6486. doi:10.5194/bg-13-6471-2016
Domine, F., Barrere, M., and Sarrazin, D. (2016b). Seasonal evolution of the effective thermal conductivity of the snow and the soil in high arctic herb tundra at bylot island, Canada. Cryosphere10, 2573–2588. doi:10.5194/tc-10-2573-2016
Domine, F., Belke-Brea, M., Sarrazin, D., Arnaud, L., Barrere, M., and Poirier, M. (2018). Soil moisture, wind speed and depth hoar formation in the arctic snowpack. J. Glaciol.64, 990–1002. doi:10.1017/jog.2018.89
Domine, F., Picard, G., Morin, S., Barrere, M., Madore, J.-B., and Langlois, A. (2019). Major issues in simulating some arctic snowpack properties using current detailed snow physics models: Consequences for the thermal regime and water budget of permafrost. J. Adv. Model. Earth Syst.11, 34–44. doi:10.1029/2018MS001445
Domine, F., Fourteau, K., Picard, G., Lackner, G., Sarrazin, D., and Poirier, M. (2022). Thermal bridging through branches of snow-covered shrubs cool down permafrost in winter. Nat. Portf., 1–20.doi:10.21203/rs.3.rs-679013/v1
Fourteau, K., Domine, F., and Hagenmuller, P. (2021). Macroscopic water vapor diffusion is not enhanced in snow. Cryosphere15, 389–406. doi:10.5194/tc-15-389-2021
Gouttevin, I., Langer, M., Löwe, H., Boike, J., Proksch, M., and Schneebeli, M. (2018). Observation and modelling of snow at a polygonal tundra permafrost site: Spatial variability and thermal implications. Cryosphere12, 3693–3717. doi:10.5194/tc-12-3693-2018
Groisman, P. Y., Karl, T. R., and Knight, R. W. (1994). Observed impact of snow cover on the heat balance and the rise of continental spring temperatures. Science263, 198–200. doi:10.1126/science.263.5144.198
Haberkorn, A., Wever, N., Hoelzle, M., Phillips, M., Kenner, R., Bavay, M., et al. (2017). Distributed snow and rock temperature modelling in steep rock walls using alpine3d. Cryosphere11, 585–607. doi:10.5194/tc-11-585-2017
Hansen, A. C., and Foslien, W. E. (2015). A macroscale mixture theory analysis of deposition and sublimation rates during heat and mass transfer in dry snow. Cryosphere9, 1857–1878. doi:10.5194/tc-9-1857-2015
Hewitt, D. R., Neufeld, J. A., and Lister, J. R. (2013a). Convective shutdown in a porous medium at high Rayleigh number. J. Fluid Mech.719, 551–586. doi:10.1017/jfm.2013.23
Hewitt, D. R., Neufeld, J. A., and Lister, J. R. (2013b). Stability of columnar convection in a porous medium. J. Fluid Mech.737, 205–231. doi:10.1017/jfm.2013.559
Jafari, M., Gouttevin, I., Couttet, M., Wever, N., Michel, A., Sharma, V., et al. (2020). The impact of diffusive water vapor transport on snow profiles in deep and shallow snow covers and on sea ice. Front. Earth Sci.8, 249. doi:10.3389/feart.2020.00249
Jafari, M., Sharma, V., and Lehning, M. (2022). Convection of water vapour in snowpacks. J. Fluid Mech.934, A38. doi:10.1017/jfm.2021.1146
Jafari, M. (2022). Water vapor transport in snowpacks. Lausanne: EPFL, 154. doi:10.5075/epfl-thesis-9659
Johnson, J., Sturm, M., Perovich, D., and Bens, C. (1987). Field observations of thermal convection in a subarctic snow cover. Int. Assoc. Hydrological Sci. Pulblication162, 105–118.
Lapwood, E. R. (1948). Convection of a fluid in a porous medium. Math. Proc. Camb. Philosophical Soc.44, 508–521. doi:10.1017/S030500410002452X
Lehning, M., Bartelt, P., Brown, B., Russi, T., Stöckli, U., and Zimmerli, M. (1999). Snowpack model calculations for avalanche warning based upon a new network of weather and snow stations. Cold Regions Sci. Technol.30, 145–157. doi:10.1016/s0165-232x(99)00022-1
Nield, D. A. (1997). Notes on convection in a porous medium:(i) an effctive Rayleigh number for an anisotropic layer, (ii) the malkus hypothesis and wavenumber selection. Transp. Porous Media27, 135–142. doi:10.1023/A:1006549930540
Palm, E., and Tveitereid, M. (1979). On heat and mass flux through dry snow. J. Geophys. Res. Oceans84, 745–749. doi:10.1029/JC084iC02p00745
Pfeffer, W. T., and Mrugala, R. (2002). Temperature gradient and initial snow density as controlling factors in the formation and structure of hard depth hoar. J. Glaciol.48, 485–494. doi:10.3189/172756502781831098
Powers, D., O’Neill, K., and Colbeck, S. C. (1985). Theory of natural convection in snow. J. Geophys. Res. Atmos.90, 10641–10649. doi:10.1029/JD090iD06p10641
Slater, A. G., Schlosser, C. A., Desborough, C., Pitman, A., Henderson-Sellers, A., Robock, A., et al. (2001). The representation of snow in land surface schemes: Results from pilps 2 (d). J. Hydrometeorol.2, 7–25. doi:10.1175/1525-7541(2001)002<0007:trosil>2.0.co;2
Sturm, M., and Benson, I. C. S. (1997). Vapor transport, grain growth and depth-hoar development in the subarctic snow. J. Glaciol.43, 42–59. doi:10.1017/s0022143000002793
Sturm, M., and Johnson, J. B. (1991). Natural convection in the subarctic snow cover. J. Geophys. Res. Solid Earth96, 11657–11671. doi:10.1029/91JB00895
Sturm, M., and Johnson, J. B. (1992). Thermal conductivity measurements of depth hoar. J. Geophys. Res. Solid Earth97, 2129–2139. doi:10.1029/91jb02685
Taillandier, A.-S., Domine, F., Simpson, W. R., Sturm, M., Douglas, T. A., and Severin, K. (2006). Evolution of the snow area index of the subarctic snowpack in central Alaska over a whole season. consequences for the air to snow transfer of pollutants. Environ. Sci. Technol.40, 7521–7527. doi:10.1021/es060842j
Trabant, D., and Benson, C. (1972). Field experiments on the development of depth hoar. Geol. Soc. Am. Memoirs135, 309–322.
Whitaker, S. (1999). Theory and applications of transport in porous media: The method of volume averaging. Netherlands: Kluwer Academic Publishers.
Keywords: natural convection, snowpacks, water vapor transport, Rayleigh number, phase change
Citation: Jafari M and Lehning M (2023) Convection of snow: when and why does it happen?. Front. Earth Sci. 11:1167760. doi: 10.3389/feart.2023.1167760
Received: 16 February 2023; Accepted: 30 May 2023;
Published: 15 June 2023.
Edited by:
Satoru Yamaguchi, National Research Institute for Earth Science and Disaster Resilience (NIED), JapanReviewed by:
Takahiro Tanabe, National Research Institute for Earth Science and Disaster Resilience (NIED), JapanHiroyuki Hirashima, National Research Institute for Earth Science and Disaster Resilience, Japan
Copyright © 2023 Jafari and Lehning. This is an open-access article distributed under the terms of the Creative Commons Attribution License (CC BY). The use, distribution or reproduction in other forums is permitted, provided the original author(s) and the copyright owner(s) are credited and that the original publication in this journal is cited, in accordance with accepted academic practice. No use, distribution or reproduction is permitted which does not comply with these terms.
*Correspondence: Mahdi Jafari, mahdi.jafari@slf.ch