New insights into geological setting of the summit area of mount Etna volcano (Italy) inferred from 2D gravity data modelling
 Jaroslava Pánisová1
  Filippo Greco
 Daniele Carbone
 Peter Vajda
- 1Earth Science Institute of the Slovak Academy of Sciences, Bratislava, Slovakia
- 2Istituto Nazionale di Geofisica e Vulcanologia—Sezione di Catania—Osservatorio Etneo, Catania, Italy
Gravimetric observations were carried out in 2015, to image the uppermost portion of the volcanic plumbing system of Mt. Etna (Italy). Gravity measurements were performed using two relative gravimeters, along a profile that crosses the summit craters area (elevations between 2,820 and 3,280 m a.s.l.). Accurate positioning of the gravity observation points was determined through GPS measurements. After applying elevation and terrain corrections, the reduced gravity data were used to build a 2D density model of the uppermost part of the volcano edifice. This model was constrained using to-date knowledge of the structural setting of the area and the available volcanological data. We highlighted the presence of low-density material below the summit craters, down to the depth of about 2.1 km, interpreted as highly altered, fumarolized and structurally weakened material. It is also likely that the close presence of the conduits feeding the summit craters of the volcano contributes to the gravity low in the SW half of the measurement profile. Conversely, the gravity low observed at the northern edge of the profile could reflect the high concentration of faults and eruptive fissures in the Pizzi Deneri area, in correspondence of the Ellittico caldera rim.
Introduction
One of the most important elements characterizing volcanism is the structural setting of the uppermost section of the volcano’s plumbing system. It consists of interconnected magma conduits and reservoirs (Cashman et al., 2017), which directly govern the mobilisation and storage, as well as the transport/ascent, evolution and eruption of magma.
Over the last few decades, significant advances in using geophysical techniques to image the structure of magma plumbing systems have enabled the identification of zones of melt accumulation, crystal mush development, and magma migration (Magee et al., 2018).
Mount Etna (Italy) is an active open-conduit volcano characterized by almost persistent mild explosive activity from the summit craters. This “steady state” is sometimes interrupted by phases of stronger activity from the summit craters or from flank fissures (Calvari et al., 2020). Since detailed information is rarely available about the characteristics of buried structures and faults, it is not clear which role they could play during a magmatic intrusion, and, in particular, if they could be activated and become preferential pathways for magma ascent.
In these conditions, gravity investigations have proven valuable in delivering information about magma chambers, dykes, and sill complex locations and geometries (Locke et al., 1993; Kauahikaua et al., 2000; Schiavone and Loddo, 2007; Fedi et al., 2018; Magee et al., 2018).
With the aim of investigating the geological structure of the uppermost part of the plumbing system of Mt. Etna, a gravity survey was undertaken in the summit craters area. The survey set-up and field work were conditioned by the accessibility of the area, due to the ongoing activity of Mt. Etna.
By means of 2D density modelling, constrained by surface and subsurface geological information, we studied the uppermost portion of the volcanic plumbing system and here we present results on the structural features of this part of the volcano edifice.
This work demonstrates how gravimetry can provide knowledge useful for studying and understanding the processes occurring in the uppermost portion of the volcano edifice.
Geological evolution of the summit part of Mt. Etna
Volcanic activity in the Etna area started more than half a million years ago (De Beni et al., 2011), both with submarine and subaerial fissural eruptions. They covered large portions of the territory with volcanic products that, however, did not build up important reliefs (Branca et al., 2008; Branca et al., 2011a; Branca et al., 2011b). About 110,000 years ago, fissural volcanic activity evolved into central-type activity, and stratovolcanoes began to grow, whose eruptive axes shifted over time along the SE—NW direction (Branca et al., 2008; Branca et al., 2011a; Branca et al., 2011b). Starting from around 60,000 years ago, the main stratovolcano, named Ellittico, began to grow, reaching a maximum elevation of about 3,600 m. The Ellittico activity ended ∼15,000 years ago, with caldera-forming plinian eruptions (Coltelli et al., 2000; Del Carlo et al., 2017). They formed a wide summit caldera, whose preserved rim currently crops out in the Pizzi Deneri (2,846 m a.s.l.) and Punta Lucia (2,930 m a.s.l.) areas (Figure 1A). Inside this caldera, volcanic activity resumed roughly along the same eruptive axis, forming the present volcanic centre, named Mongibello.
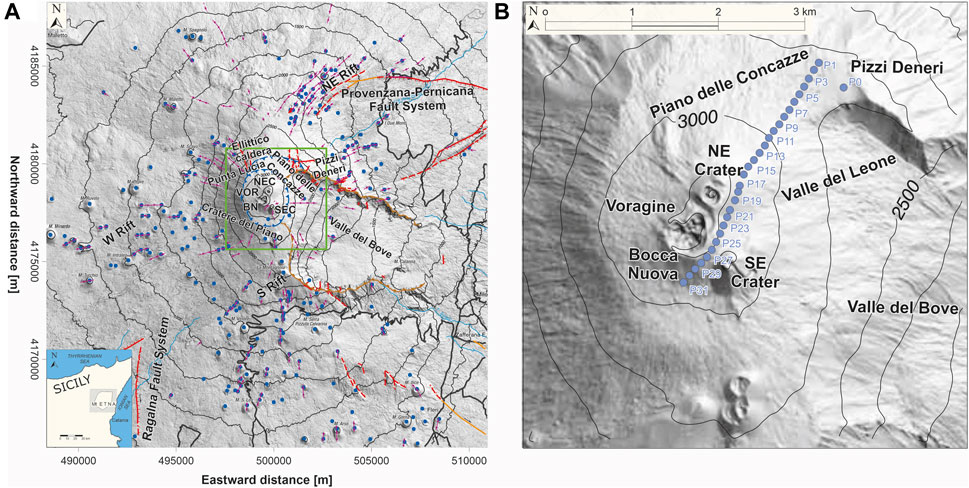
FIGURE 1. (A) Sketch map of Etna showing location of the volcano-tectonic landforms (modified after Azzaro et al. (2012): faults (solid or dashed red lines with barbs); caldera rims (solid or dashed blue lines with barbs); flank collapse rims (solid or dashed brown lines with rounded barbs); eruptive fissures (purple lines with circles); pyroclastic cones (blue points). The inset at the bottom left shows the location of Etna volcano with respect to Sicily. The green square represents the area indicated in (B), which includes the gravimetric profile with 31 measuring points. Geographical coordinates are expressed in UTM projection, zone 33 N.
In 122 BC the largest explosive eruption of Mongibello volcano in Holocene time occurred. This was a Plinian eruption of a basaltic magma (Coltelli et al., 1998) that produced the formation of a new summit caldera (Cratere del Piano; Figure 1A) and caused the disruption of the Ellittico caldera southern rim. The reconstructed original shape of this historical caldera appears slightly elliptical, with diameters of 2.7 and 2.3 km along the N-S and E-W axes (Azzaro et al., 2012; Figure 1A). The eruptive activity of the past 2 ka produced the filling of the Cratere del Piano caldera and the formation of the present-day Etna summit cone. The latter comprises the Central Crater, divided into Voragine (VOR) and Bocca Nuova (BN), surrounded by two craters named Northeast Crater (NEC) and Southeast Crater (SEC), formed in 1911 and 1971, respectively (Figure 1B).
The upper portion of the volcano is characterized by three main rift zones that radiate from the summit (Neri et al., 2011; Azzaro et al., 2012; Cappello et al., 2012): the NE Rift, the S Rift and the W Rift (Figure 1A). These rifts are not directly connected to deep magma reservoirs, but are frequently fed by dikes radiating from the central volcanic conduit (Bousquet and Lanzafame, 2001; Acocella and Neri, 2003; Neri et al., 2011).
Besides occurring from the summit craters or from the rift zones, less frequent eruptions (sub-terminal) can take place from fissures that open in close spatial and structural relation to the summit cones, i.e., on their slopes or at their foot.
Etna’s summit area is also affected by extensional processes in part related to the seaward displacement of its eastern and southern flanks (Borgia et al., 1992; Solaro et al., 2010; Bonforte et al., 2011; Ruch et al., 2012). This unstable area is confined to the north by the Pernicana Fault System (Neri et al., 2004) and to the SW by the Ragalna Fault System (Neri et al., 2007; Branca et al., 2011b). Wide fracture fields formed both around and inside the summit craters, and, after 1995, these fractures developed into a main N–S structural system (Neri and Acocella, 2006). During 1998–2001, this system consisted of a N–S fracture zone with orthogonal extension. In 2004, the fractures propagated towards the SE, cutting the SEC and triggering the 2004–2005 eruption (Neri and Acocella, 2006). The Piano delle Concazze area is also affected by different N–S trending faults that represent extension-accommodation features linked to the extensional tectonic regime of the North-East Rift (Azzaro et al., 2012). These N–S trending faults, whose field evidence is sometimes obscured by accumulation of pyroclastic deposits, were recently investigated (geometry, depth, etc.) through magnetic measurements (Napoli et al., 2021).
Data acquisition and analysis
In 2015 gravity measurements were collected along a profile passing through the summit craters area of Mt. Etna volcano, along a NE-SW direction (Figure 1B). The profile is 3.3 km long and comprises 31 measurement points, with average inter-point distance of 100 m (elevations between 2,820 and 3,280 m a.s.l.; Figure 1B). The profile ranges from the Pizzi Deneri area to the pass between Bocca Nuova and SE Crater, crossing Piano delle Concazze, and arrives at the SW rim of the Cratere del Piano (Figure 1B).
Gravity data were acquired in 3 days between 30 June and 6 July 2015. Measurements were taken using in parallel a Scintrex CG5 and a LaCoste and Romberg mod. G relative gravimeters (Figure 2). The absolute gravity station (P0; Figure 1B), at the Pizzi Deneri volcanological observatory (PDN; 2,820 m a.s.l.), was used as reference (Pistorio et al., 2011; Greco et al., 2012; 2022). At least three readings were taken with both gravimeters at each measurement point of the profile. Furthermore, in order to achieve a reliable model of the daily instrumental drift, we performed measurements at the absolute reference station at the beginning and at the end of each working day, using both gravimeters. Tidal effects were corrected for using the Eterna 3.4 software (Wenzel, 1996). We evaluated an average measurement error on the order of 10 μGal. Spatial coordinates of each point were determined by GPS observations, performed at the same time as the gravity measurements, using a Trimble 5700 GPS receiver (Figure 2). The precision achieved for both horizontal and vertical coordinates is on the order of a few centimetres. Consequently, the maximum error in gravity determinations due to the uncertainty in the elevation data is lower than 0.05 mGal.
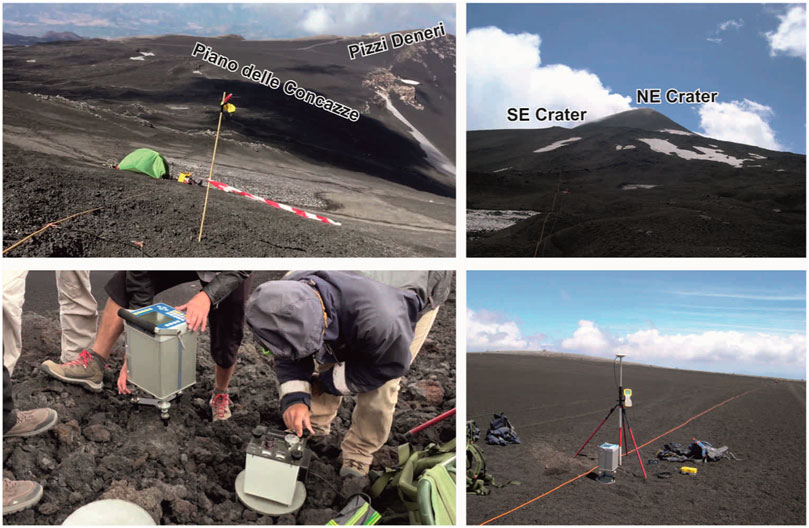
FIGURE 2. Photos taken during the gravimetric survey carried out in 2015. The top pictures provide a view of the investigated area, while, in the bottom pictures, the instruments used for data acquisition (gravimeters and GPS receiver) are shown.
In order to be used for imaging the subsurface density distribution, gravity measurements need to be reduced for (i) the difference in altitude between the reference (P0; Figure 1B) and each observation point (free-air correction) and (ii) the effect of the different distribution of above-ground masses around each measurement point (complete Bouguer correction). Once these corrections are accomplished, gravity measurements are reduced to Bouguer anomalies (Deroussi et al., 2009), which reflect anomalies in the subsurface density structure. Differences in elevation retrieved from the GPS measurements were used to perform the free-air correction. Conversely, the complete Bouguer effect was evaluated at each observation point as the cumulative gravity effect of two arrays of vertically elongated cells (square-based vertical parallelepipeds), having common bottom elevation (bottom of the “Bouguer plate”) and top elevation defined by two DEMs. In particular, the DEM developed by De Beni et al. (2015), featuring a spatial resolution of 4.5 m, was used to define the height of the cells in the near field (an almost square area with sides ∼2 km away from the edge points of the profile), while the DEM by Favalli et al. (2009), featuring a spatial resolution of 10 m, was used to define the height of the cells in the far field (an area of about 26 km x 26 km around the measurement profile). To define their gravity effect, a constant density of 2,400 kg/m3 was assumed for all the prism cells in both the near and far fields.
Direct information (i.e., from boreholes) on the density of the rocks in the summit area of Etna are not available. To choose the most appropriate reference density for the 2D model, we started from the classical Nettleton’s method (Nettleton, 1939). However, this method can lead to misleading estimates of the reference density if applied to data from areas where the properties of rock change significantly (Long and Kaufmann, 2013). In order to obtain a reliable estimate of the reference density, we calculated a set of correlation coefficients between Bouguer anomalies and topography for several lengths of the profile and densities (1,200–3,200 kg/m3; Figure 3). The minimal correlation between the calculated gravity anomaly and the topography is achieved for a density of 2,400 kg/m3 and for a reduced profile length (profile truncated from SW to about half-length). This value is thus chosen as the reference density for the 2D model. It is worth noting that using the whole length of the profile in the calculation leads to underestimation of the reference density, due to the presence of lighter material beneath the summit area of Mt. Etna (curve with square symbols in Figure 3).
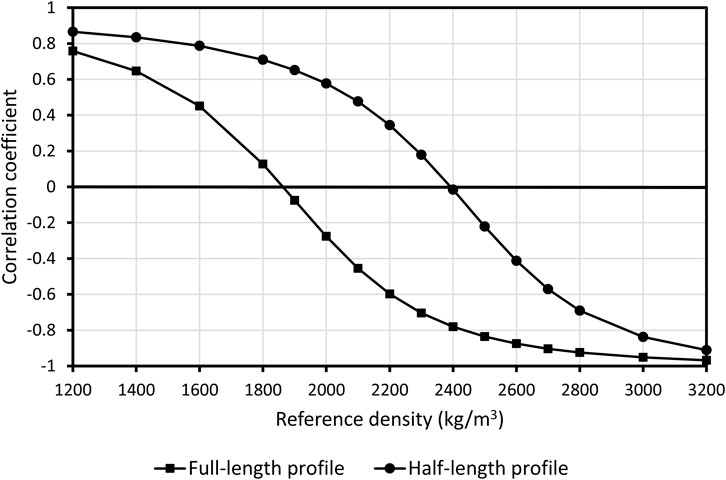
FIGURE 3. Correlation of Bouguer anomalies and topography for different reference densities.
The resulting Bouguer anomalies across the measurement profile are shown in the top panel of Figure 4 (grey solid line; referred as “observed gravity”). The main anomaly has a peak-to-peak amplitude of about 6 mGal and a wavelength of about 2.5 km. Lowest values occur in correspondence of the summit craters area, while moving towards NE and SW, progressively higher values are encountered (upper panel in Figure 4).
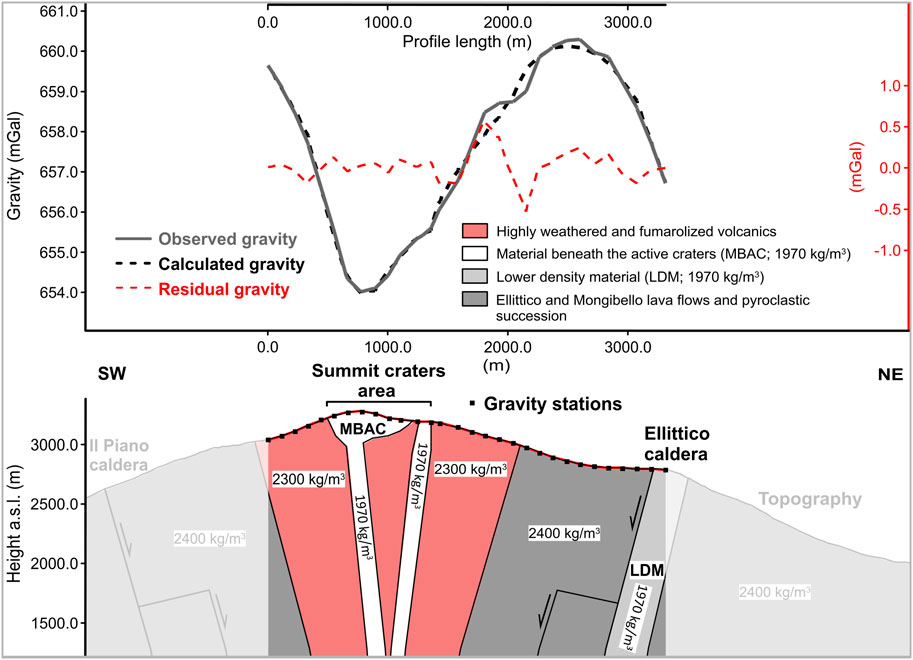
FIGURE. 4. Top panel: observed (solid grey curve) and calculated (black dashed curve) Bouguer profiles. Residuals (observed minus calculated gravity) are depicted by the red dashed curve. Bottom panel: 2D density model of Mt. Etna’s summit area down to a depth of about 2.1 km below the point of the profile at highest elevation. On both sides, the density model is extended beyond the gravity profile (shaded parts), in order to avoid edge effects.
2D density modelling with IGMAS+
It is well-known that the inherent ambiguity in the interpretation of potential fields (gravity and magnetic) implies that a non-unique mathematical model can explain the same observable (Götze, 2014). To constrain the 2D model of the Bouguer gravity anomaly across the uppermost part of the Mt. Etna’s volcano edifice (top panel in Figure 4), we used the to-date knowledge of the structural setting of the area and the available volcanological data (Branca et al., 2011a; b; Branca and Ferrara, 2013; Barreca et al., 2018).
Data modelling was carried out using the IGMAS+ (Interactive Geophysical Modelling Assistant) software, under the assumption of homogeneous density within each modelled geological formations. IGMAS+ allows 3D potential field modelling at different scales (Schmidt et al., 2011; 2015). Based on the analytical solution of Götze and Lahmeyer (1988), it utilizes polyhedrons with triangulated surfaces to approximate deep structures. Triangulated surfaces can be combined with voxel cubes to produce complex (“hybrid”) models, thus allowing to describe the geological structures in a more realistic way (Schmidt et al., 2011; Alvers et al., 2014). The IGMAS+ software can also be used for 2D forward density modelling, as in the present case.
The bottom panel of Figure 4 shows the cross section of Mt. Etna’s summit zone along the SW-NE gravity profile. The 2D density model is defined from the surface down to an elevation of about 1,200 m (about 2.1 km below the highest point of the profile). In order to avoid edge effects, the modelled vertical section is i) extended beyond the edges of the gravity profile (bottom panel of Figure 4) and ii) its edge mirrors (Schmidt et al., 2015) are set far enough (model geometry extended by 50 km). As the geological formations crossed by the profile are lithologically very similar, when developing the model, we aimed at the best compromise between fitting the observed gravity data, while using anomalous bodies with as smaller as possible density contrasts. To constrain the geometry of individual structures, the available scheme published in Barreca et al. (2018), based on geological interpretation, is adopted. Results show a reasonable fit between the calculated (dashed black line) and observed (solid grey line) Bouguer anomalies, with a misfit (dashed red line in Figure 4) ranging between −0.52 and +0.56) mGal and RMS of 0.20 mGal across the whole profile. The proposed model includes the following structural elements (see also the legend in Figure 4).
✓Material beneath the active summit craters (MBAC, white coloured) having a negative density contrast of −430 kg/m3;
✓Lower density material in the Pizzi Deneri zone corresponding with the Ellittico caldera rim (LDM, light grey coloured) having a negative density contrast of −430 kg/m3;
✓Ellittico and Mongibello lava flows and pyroclastic succession (grey coloured) with a zero density contrast;
✓Highly weathered and fumarolized volcanics (light red coloured) having a negative density contrast of −100 kg/m3.
The marked low in the left part of the Bouguer anomaly curve (top panel of Figure 4) indicates the presence of low-density material below the summit craters. To fit this anomaly, we considered two almost vertical bodies, centered beneath the active summit craters (part of the MBAC structural element), whose lateral and vertical extensions are within 100 m and about 2 km (the maximum model depth is controlled by the length of the observation profile), respectively. Considering the position of the gravity profile with respect to the summit craters (Figure 1B), it is likely that the observed Bouguer anomaly is not affected by each volcanic conduit individually, but, rather it images the cumulative near-field gravity effect of the conduits feeding the different craters. Accordingly, it is probable that the conduits feeding the Central (Voragine and Bocca Nuova) and SE craters induce a single gravity effect on the Bouguer curve, while the conduit feeding the NE crater is “seen” as a separate effect. Following this view, the MBAC structural element includes two vertical sub-structures (bottom panel of Figure 4).
Discussion
Our density model (bottom panel of Figure 4) involves three sources of anomaly, with different negative density contrasts, namely, MBAC, LDM and the altered volcanics beneath the active craters zone. The geometries of and boundaries between the modelled structures were defined on the grounds of the available geological constraints.
The dominating gravity low in the left half of the Bouguer curve (top panel of Figure 4) indicates a mass deficiency beneath the summit craters area, due to low-density material. In particular, this gravity low can be attributed to the presence of (i) the conduits feeding the summit craters and (ii) altered and fumarolized rock, weakened by the sustained passage of volcanic gases. A mass deficiency was also detected through gravimetric measurements beneath the summit of Mt. Vesuvius and along its vertical axis (Celli et al., 2007) and interpreted as due to the presence of low-density shattered lava rocks from internal break-ups and collapses during explosive eruptions (Rolandi et al., 2004).
The NE edge of the profile crosses the Pizzi Deneri area, that is cut by several faults and eruptive fissures (Figure 1A). The presence of these structures lowers the overall local density, thus explaining the gravity low observed at the northern edge of the profile (LDM structure in Figure 4). It is important to mention that, with the data at our disposal, we cannot spot possible density differences between the Mongibello and Ellittico volcanics, since the SW edge of the measurement profile does not cross the boundary between these volcanics in the Cratere del Piano area (Figure 1).
The strongest discrepancies between observed and calculated Bouguer curves, namely, the +0.56 mGal and −52 mGal, occurring at distances of between 1,800 and 2,200 from the SW edge of the profile (red dashed curve; top panel of Figure 4) could be due to either unknown shallow geological structures, not accounted for in the 2D model, or errors in the DEM data used to perform the terrain correction, or to a combination of both. It is worth stressing that the morphology of the summit active area of Mt. Etna may undergo rapid and drastic changes, in consequence of intense eruptive activity, and relief changes that are not captured in the DEM data can have significant impact on the accuracy of the terrain correction.
Further errors could come from projecting the complex morpho-tectonic setting onto a 2D profile.
Conclusion
Using gravity and GPS data collected in the summit craters area of Mt. Etna, we produced the first density model of its upper plumbing system. To reduce ambiguities, we used all the available information, mainly geological knowledge and volcanological considerations. Despite their limits, our results represent a valuable starting point for further studies.
One weakness of our results dwells in the fact that a complex setting in an area of steep topography is studied in 2D. In the follow-up work we therefore plan to complement the existing gravity data by new observations, allowing to perform 3D modelling. However, it is noteworthy that harsh environmental conditions and security reasons limit accessibility to the summit area of Mt. Etna.
Another weakness comes from the lack of DEM data acquired at the same time as the gravity data. This may introduce some systematic bias in the computed Bouguer anomalies, which, in turn, translates into bias in the subsurface density model. The acquisition of new gravity data should be thus complemented by the production of an updated DEM of the studied area.
The production of a more detailed 3D density model, covering a deeper portion than the current model, would improve our knowledge of Mt. Etna’s uppermost plumbing system, with important implications for hazard assessments, considering the key role this part of the volcano edifice plays in controlling eruptive activity.
Data availability statement
The raw data supporting the conclusions of this article will be made available by the authors, without undue reservation.
Author contributions
JP performed data modelling. FG designed the work, collected and analysed gravity and GPS data. DC collected and analysed gravity and GPS data. SB provided the volcanological constraints. PV conceptualized the work. All authors contributed to the article and approved the submitted version.
Acknowledgments
This work was partially supported by the Slovak VEGA grant agency under project No. 2/0002/23.
Conflict of interest
The authors declare that the research was conducted in the absence of any commercial or financial relationships that could be construed as a potential conflict of interest.
Publisher’s note
All claims expressed in this article are solely those of the authors and do not necessarily represent those of their affiliated organizations, or those of the publisher, the editors and the reviewers. Any product that may be evaluated in this article, or claim that may be made by its manufacturer, is not guaranteed or endorsed by the publisher.
References
Acocella, V., and Neri, M. (2003). What makes flank eruptions? The 2001 Etna eruption and its possible triggering mechanisms. Bull. Volcanol. 65 (7), 517–529. doi:10.1007/s00445-003-0280-3
Alvers, M. R., Götze, H.-J., Barrio-Alvers, L., Plonka, C., Schmidt, S., and Lahmeyer, B. (2014). A novel warped-space concept for interactive 3D-geometry-inversion to improve seismic imaging. First Break 32, 61–67. doi:10.3997/1365-2397.32.4.74375
Azzaro, R., Branca, S., Gwinner, K., and Coltelli, M. (2012). The volcano-tectonic map of Etna volcano, 1:100.000 scale: An integrated approach based on a morphotectonic analysis from high-resolution DEM constrained by geologic, active faulting and seismotectonic data. Italian J. Geosciences 131 (1), 153–170. doi:10.3301/ijg.2011.29
Barreca, G., Branca, S., and Monaco, C. (2018). Three-Dimensional modeling of mount Etna volcano: Volume assessment, trend of eruption rates, and geodynamic significance. Tectonics 37, 842–857. doi:10.1002/2017tc004851
Bonforte, A., Guglielmino, F., Coltelli, M., Feretti, A., and Puglisi, G. (2011). Structural assessment of mount Etna volcano from permanent scatterers analysis. Geochem. Geophys. Geosystems 12 (2), 1–19. doi:10.1029/2010gc003213
Borgia, A., Ferrari, L., and Pasquarè, G. (1992). Importance of gravitational spreading in the tectonic and volcanic evolution of Mount Etna. Nature 357, 231–235. doi:10.1038/357231a0
Bousquet, J. C., and Lanzafame, G. (2001). New interpretation of the flank eruption fractures on Mt. Etna: Consequences for the tectonic framework of the volcano. Bull. Soc. Geol. Fr. 172 (4), 455–467. doi:10.2113/172.4.455
Branca, S., Coltelli, M., De Beni, E., and Wijbrans, J. (2008). Geological evolution of Mount Etna volcano (Italy) from earliest products until the first central volcanism (between 500 and 100 ka ago) inferred from geochronological and stratigraphic data. Int. J. Earth Sci. 97, 135–152. doi:10.1007/s00531-006-0152-0
Branca, S., Coltelli, M., and Groppelli, G. (2011b). Geological evolution of a complex basaltic stratovolcano: Mout Enta, Italy. Italian J. Geosciences (Bolletino della Soc. Geol. Italiana) 130 (3), 306–317.doi:10.3301/IJG.2011.13
Branca, S., Coltelli, M., Groppelli, G., and Lentini, F. (2011a). Geological map of Etna volcano 1:50,000 scale. Italian J. Geosciences (Bolletino della Soc. Geol. Italiana) 130 (3), 265–291. doi:10.3301/ijg.2011.15
Branca, S., and Ferrara, V. (2013). The morphostructural setting of Mount Etna sedimentary basement (Italy): Implications for the geometry and volume of the volcano and its flank instability. Tectonophysics 586, 46–64. doi:10.1016/j.tecto.2012.11.011
Calvari, S., Di Traglia, F., Ganci, G., Giudicepietro, F., Macedonio, G., Cappello, A., et al. (2020). Overflows and pyroclastic density currents in march-april 2020 at Stromboli volcano detected by remote sensing and seismic monitoring data. Remote Sens. (Basel). 12 (18), 3010. doi:10.3390/rs12183010
Cappello, A., Neri, M., Acocella, V., Gallo, G., Vicari, A., and Del Negro, C. (2012). Spatial vent opening probability map of Etna volcano (Sicily, Italy). Bull. Volcanol. 74 (9), 2083–2094. doi:10.1007/s00445-012-0647-4
Cashman, K. V., Sparks, R. S. J., and Blundy, J. D. (2017). Vertically extensive and unstable magmatic systems: A unified view of igneous processes. Science 355 (6331), eaag3055. doi:10.1126/science.aag3055
Cella, F., Fedi, M., Florio, G., Grimaldi, M., and Rapolla, A. (2007). Shallow structure of the Somma–Vesuvius volcano from 3D inversion of gravity data. J. Volcanol. Geotherm. Res. 161, 303–317. doi:10.1016/j.jvolgeores.2006.12.013
Coltelli, M., De Carlo, P., and Vezzoli, L. (1998). Discovery of a Plinian basaltic eruption of Roman age at Etna volcano, Italy. Geology 26 (12), 1095–1098. doi:10.1130/0091-7613(1998)026<1095:doapbe>2.3.co;2
Coltelli, M., Del Carlo, P., and Vezzoli, L. (2000). Stratigraphic constraints for explosive activity in the past 100 ka at Etna Volcano, Italy. Int. J. Earth Sci. 89, 665–677. doi:10.1007/s005310000117
De Beni, E., Behncke, B., Branca, S., Nicolosi, I., Carluccio, R., D'Ajello Caracciolo, F., et al. (2015). The continuing story of etna's new Southeast Crater (2012–2014): Evolution and volume calculations based on field surveys and aerophotogrammetry. J. Volcanol. Geotherm. Res. 303, 175–186. doi:10.1016/j.jvolgeores.2015.07.021
De Beni, E., Branca, S., Coltelli, M., Groppelli, G., and Wijbrans, J. R. (2011). 40Ar/39Ar isotopic dating of Etna volcanic succession. Italian J. Geosciences 130 (3), 292–305. doi:10.3301/ijg.2011.14
Del Carlo, P., Branca, S., and D’Oriano, C. (2017). New findings of Late Glacial Etna pumice fall deposits in NE Sicily and implications for distal tephra correlations in the Mediterranean area. Bull. Volcanol. 79, 50–17. doi:10.1007/s00445-017-1135-7
Deroussi, S., Diament, M., Feret, J. B., Nebut, T., and Staudacher, Th. (2009). Localization of cavities in a thick lava flow by microgravimetry. J. Volcanol. Geotherm. Res. 184 (1-2), 193–198. doi:10.1016/j.jvolgeores.2008.10.002
Favalli, M., Fornaciai, A., and Pareschi, M. T. (2009). LIDAR strip adjustment: Application to volcanic areas. Geomorphology 111 (3), 123–135. doi:10.1016/j.geomorph.2009.04.010
Fedi, M., Cella, F., D’Antonio, M., Florio, G., Paoletti, V., and Morra, V. (2018). Gravity modeling finds a large magma body in the deep crust below the Gulf of Naples, Italy. Italy. Sci. Rep. 8, 8229. doi:10.1038/s41598-018-26346-z
Götze, H.-J., and Lahmeyer, B. (1988). Application of three-dimensional interactive modeling in gravity and magnetics. Geophysics 53, 1096–1108. doi:10.1190/1.1442546
Götze, H.-J. (2014). “Potential method and geoinformation systems,” in Handbook of geomathematics. Editors W. Freeden, M. Z. Nashed, and T. Sonar (Berlin Heidelberg: Springer-Verlag), 1–21.
Greco, F., Bonforte, A., and Carbone, D. (2022). A long-term charge/discharge cycle at Mt. Etna volcano revealed through absolute gravity and GPS measurements. J. Geodesy 96, 101. doi:10.1007/s00190-022-01692-z
Greco, F., Currenti, G., D'Agostino, G., Germak, A., Napoli, R., Pistorio, A., et al. (2012). Combining relative and absolute gravity measurements to enhance volcano monitoring. Bull. Volcanol. 74, 1745–1756. doi:10.1007/s00445-012-0630-0
Kauahikaua, J., Hildenbrand, T., and Webring, M. (2000). Deep magmatic structures of Hawaiian volcanoes, imaged by three-dimensional gravity models. Geology 28 (10), 883–886. doi:10.1130/0091-7613(2000)028<0883:dmsohv>2.3.co;2
Locke, C. A., Cassidy, J., and MacDonalds, A. (1993). Three-dimensional structure of relict stratovolcanoes in taranaki, New Zealand: Evidence from gravity data. J. Volcanol. Geotherm. Res. 59 (1-2), 121–130. doi:10.1016/0377-0273(93)90081-2
Long, L. T., and Kaufmann, R. D. (2013). Acquisition and analysis of terrestrial gravity data. Cambridge: Cambridge University Press, 171.
Magee, C., Stevenson, C. T. E., Ebmeier, S. K., Keir, D., Hammond, J. O. S., Gottsmann, J. H., et al. (2018). Magma plumbing systems: A geophysical perspective. J. Petrology 59 (6), 1217–1251. doi:10.1093/petrology/egy064
Napoli, R., Currenti, G., and Sicali, A. (2021). Magnetic signatures of subsurface faults on the northern upper flank of Mt. Etna. Ann. Geophys. 64 (1), PE108.doi:10.4401/ag-8582
Neri, M., Acocella, V., Behncke, B., Giammanco, S., Mazzarini, F., and Rust, D. (2011). Structural analysis of the eruptive fissures at Mount Etna (Italy). Ann. Geophys. 54 (5), 464–479.doi:10.4401/ag-5332
Neri, M., Acocella, V., and Behncke, B. (2004). The role of the Pernicana Fault System in the spreading of Mt. Etna (Italy) during the 2002–2003 eruption. Bull. Volcanol. 66 (5), 417–430. doi:10.1007/s00445-003-0322-x
Neri, M., and Acocella, V. (2006). The 2004–2005 Etna eruption: Implications for flank deformation and structural behaviour of the volcano. J. Volcanol. Geotherm. Res. 158 (1-2), 195–206. doi:10.1016/j.jvolgeores.2006.04.022
Neri, M., Guglielmino, F., and Rust, D. (2007). Flank instability on Mount Etna: Radon, radar interferometry and geodetic data from the southwestern boundary of the unstable sector. J. Geophys. Res. 112 (B4), B04410. doi:10.1029/2006jb004756
Nettleton, L. L. (1939). Determination of density for reduction of gravimeter observations. Geophysics 4 (3), 176–183. doi:10.1190/1.0403176
Pistorio, A., Greco, F., Currenti, G., Napoli, R., Sicali, A., Del Negro, C., et al. (2011). High-precision gravity measurements using absolute and relative gravimeters at Mount Etna (Sicily, Italy). Ann. Geophys. 54 (5), 500–509.doi:10.4401/ag-5348
Rolandi, G., Bellocci, F., and Cortini, M. (2004). A new model for the formation of the Somma Caldera. Mineral. Petrol. 80, 27–44. doi:10.1007/s00710-003-0018-0
Ruch, J., Pepe, S., Casu, F., Acocella, V., Neri, M., Solaro, G., et al. (2012). How do volcanic rift zones relate to flank instability? Evidence from collapsing rifts at Etna. Geophys. Res. Lett. 39 (20), L20311. doi:10.1029/2012gl053683
Schiavone, D., and Loddo, M. (2007). 3-D density model of Mt. Etna Volcano (Southern Italy). J. Volcanol. Geotherm. Res. 164 (3), 161–175. doi:10.1016/j.jvolgeores.2007.04.016
Schmidt, S., Barrio-Alvers, L., and Götze, H. J. (2015). IGMAS+: Interactive geophysical modelling ASistant. Available at: http://www.potentialgs.com.59
Schmidt, S., Plonka, C., Götze, H.-J., and Lahmeyer, B. (2011). Hybrid modelling of gravity, gravity gradients and magnetic fields. Geophys. Prospect. 59 (6), 1046–1051. doi:10.1111/j.1365-2478.2011.00999.x
Solaro, G., Acocella, V., Pepe, S., Ruch, J., Neri, M., and Sansosti, E. (2010). Anatomy of an unstable volcano from InSAR: Multiple processes affecting flank instability at Mt. Etna, 1994–2008. J. Geophys. Res. 115 (B10), B10405. doi:10.1029/2009jb000820
Keywords: gravity, density model, plumbing system, Etna volcano, volcano eruption
Citation: Pánisová J, Greco F, Carbone D, Branca SF and Vajda P (2023) New insights into geological setting of the summit area of mount Etna volcano (Italy) inferred from 2D gravity data modelling. Front. Earth Sci. 11:1171884. doi: 10.3389/feart.2023.1171884
Received: 22 February 2023; Accepted: 15 May 2023;
Published: 24 May 2023.
Edited by:
Paolo Capuano, University of Salerno, ItalyReviewed by:
Umberto Riccardi, University of Naples Federico II, ItalyYosuke Aoki, The University of Tokyo, Japan
Copyright © 2023 Pánisová, Greco, Carbone, Branca and Vajda. This is an open-access article distributed under the terms of the Creative Commons Attribution License (CC BY). The use, distribution or reproduction in other forums is permitted, provided the original author(s) and the copyright owner(s) are credited and that the original publication in this journal is cited, in accordance with accepted academic practice. No use, distribution or reproduction is permitted which does not comply with these terms.
*Correspondence: Filippo Greco, filippo.greco@ingv.it