Twenty years of explosive-effusive activity at El Reventador volcano (Ecuador) recorded in its geomorphology
 Silvia Vallejo1*
  Angela K. Diefenbach2
  H. Elizabeth Gaunt1,3
  Marco Almeida1
  Patricio Ramón1
  Fernanda Naranjo1
  Karim Kelfoun4
- 1Instituto Geofísico, Escuela Politécnica Nacional, Quito, Ecuador
- 2U.S. Geological Survey, Volcano Disaster Assistance Program, Vancouver, WA, United States
- 3Department of Earth Sciences, University College London, London, United Kingdom
- 4Laboratoire Magmas et Volcans, Université Clermont Auvergne, Clermont-Ferrand, France
Shifts in activity at long-active, open-vent volcanoes are difficult to forecast because precursory signals are enigmatic and can be lost in and amongst daily activity. Here, we propose that crater and vent morphologies, along with summit height, can help us bring some insights into future activity at one of Ecuador’s most active volcanoes El Reventador. On 3 November 2002, El Reventador volcano experienced the largest eruption in Ecuador in the last 140 years and has been continuously active ever since with transitions between and coexistence of explosive and effusive activity, characterized by Strombolian and Vulcanian behavior. Based on the analysis of a large dataset of thermal and visual images, we determined that in the last 20 years of activity, the volcano faced three destructive events: A. Destruction of the upper part of the summit leaving a north-south breached crater (3 November 2002), B. NE border crater collapse (2017), and C. NW flank collapse (2018), with two periods of reconstruction of the edifice: Period 1. Refill of the crater (2002-early 2018) and Period 2. Refill of the 2018 scar (April 2018–December 2022). Through photogrammetric analysis of visual and thermal images acquired in 11 overflights of the volcano, we created a time-series of digital elevation models (DEMs) to determine the maximum height of the volcano at each date, quantify the volume changes between successive dates, and characterize the morphological changes in the summit region. We estimate that approximately 34.1x10⁶ m3 of volcanic material was removed from the volcano due to destructive events, whereas 64.1x10⁶ m3 was added by constructive processes. The pre-2002 summit height was 3,560 m and due to the 2002 eruption it decreased to 3,527 m; it regained its previous height between 2014 and 2015 and the summit crater was completely filled by early April 2018. Event A resulted from an intrusion of magma that erupted violently; we proposed that Events B and C could be a result of an intrusion as well but may also be due to a lack of stability of the volcano summit which occurs when it reaches its maximum height of approximately 3,590 and 3,600 m.
1 Introduction
Long-term volcanic activity is often accompanied by important morphological changes around the volcanic vents due to both destructive and constructive volcanic processes, e.g., Colima (Walter et al., 2013), Santiaguito (Lamb et al., 2019), Fuego (Aldeghi et al., 2019), Bezymianny (Shevchenko et al., 2020), Arenal (Mora et al., 2022), Merapi (Lube et al., 2011), and Soufrière Hills (Wadge, 2009; Stinton et al., 2014). Crater morphology exerts a significant influence on the spatial distribution of different volcanic products produced by eruptive activity (Arnold et al., 2019), especially those that flow along the surface, such as lava flows and pyroclastic density currents (PDCs). Consequently, the characteristics and distribution of those products can vary and change over time as a result of changes in crater morphology (Di Traglia et al., 2013; Alcalá-Reygosa et al., 2016; Gabrielli et al., 2020; Shevchenko et al., 2020). Identification of the morphological changes of a volcano’s surface can be achieved through regular observations using visual and thermal images (Spampinato et al., 2011; Mania et al., 2019). Direct observations of superficial activity at active volcanoes represent a fundamental tool in volcano monitoring (Spampinato et al., 2011; Vásconez et al., 2022a). These observations contribute to our understanding of volcanic processes occurring during an eruption and are critical in quantifying the distribution and volume of deposits, as well as changes in eruptive dynamics. Images can be obtained through both ground-based and airborne visual and infrared cameras as well as night-vision goggles. An additional use of high-resolution images is the creation of digital elevation models (DEMs), which are a quantitative 3D representation of the topography and morphology of the volcano. By comparing sequential DEMs, estimates of the volume and scale of morphological changes can be quantified (Diefenbach et al., 2013). This method can also provide key information about important eruption parameters such as the discharge rate of magma (Dietterich et al., 2021) and the advancement rate of lava flows. Recent studies have indicated the importance of studying morphological changes in the summit area due to the eruptive activity of El Reventador (Vallejo and Ramon, 2012; Diefenbach et al., 2014; Arnold et al., 2017; Almeida et al., 2019), presenting quantitative and/or qualitative insights into short-term changes.
To carry out this study, we first use volcanic radiative power from MIROVA (Middle Infrared Observation of Volcanic Activity) to define the different phases of activity that occurred between late 2002 and late 2022. Second, we use visual and thermal images taken from airborne and ground-based cameras acquired between 2002 and 2022 to perform a detailed analysis of the activity and present a description of major morphological changes over the summit due to the continuous eruptive activity. Subsequently, by performing photogrammetric analysis using visual and thermal images from overflights, it was possible to construct a time-series of DEMs that provide quantitative analysis of the morphological changes of the summit by determining the volume change due to the removal or addition of material at the summit. We also propose a maximum stable height range for the volcano.
This study shows for the first time a detailed analysis of a unique and large dataset of thermal and visual images of El Reventador acquired by the Instituto Geofísico of the Escuela Politécnica Nacional (IG-EPN) staff since 2002 to describe and quantify morphological changes and discuss the use of this analysis for forecasting transitions in explosive and effusive activity.
2 El Reventador volcano
El Reventador volcano (∼3,578 m asl), located in the sub-Andean region of northeastern Ecuador (Figure 1A) and formed within a compressional tectonic setting (Tibaldi, 2005), is considered one of the most active volcanoes in Ecuador in recent decades (Hall et al., 2008; Naranjo et al., 2016; Arnold et al., 2017; Ramón et al., 2021). The active stratovolcano is in the western portion of a ∼4-km-wide, horseshoe-shaped amphitheater, breached to the east and rises ∼1,100 m above the amphitheater floor (Figure 1B, C). The amphitheater was created by a large debris avalanche collapse that occurred approximately 19,000 yBP (Aguilera et al., 1988). Historical activity of El Reventador includes 20 eruptions recorded after the Spanish conquest in 1532 CE (Hall et al., 1980; Simkin and Siebert, 1994). Hall (1977) described the April and May 1976 eruptions as moderately explosive with Strombolian and Vulcanian activity. The latest and current eruptive period started on 3 November 2002, after 26 years of quiescence with a sub-Plinian VEI 4 eruption, which is the largest eruption to have occurred in the last 140 years in Ecuador (Hall et al., 2004; Samaniego et al., 2008). This eruption was characterized by a magmatic and magma-water fragmentation process at the vent (Delpit et al., 2008). This large eruption involved mixed/mingled magma (Ridolfi et al., 2008) believed to be the result of the intrusion of a more primitive magma into the andesitic reservoir located at ∼7–12 km depth (Samaniego et al., 2008). It destroyed the upper part of the summit and produced a 17-km-high eruptive column and voluminous PDCs that filled the amphitheater floor and traveled 9 km to the east (Hall et al., 2004). A few days later, two lava flows were emplaced on the southeastern flank of the volcano (Hall et al., 2004; Samaniego et al., 2008). Since its reactivation in November 2002, El Reventador has been in continuous eruption (e.g., Wright, 2016) with both explosive and effusive eruptive styles, characterized by weak to strong Vulcanian and Strombolian activity (Vásconez et al., 2022b). Some short-term, seismo-acoustic studies have been developed to characterize superficial eruptive activity in 2005 (Johnson et al., 2006; Lees et al., 2008). The long-term volcanic activity of El Reventador has been described based on seismicity, thermal alerts, occurrence of lava flows, and lava extrusion rates within eruptive phases (Naranjo et al., 2016; Arnold et al., 2017; Vallejo Vargas, 2017). Others have detected volcanic change through time due to both constructive effusive and explosive activity as well as destructive processes through careful analysis of morphological changes over the summit and flanks with high-resolution satellite radar and thermal and visual image analysis (Vallejo and Ramon, 2012; Arnold et al., 2017; 2019).
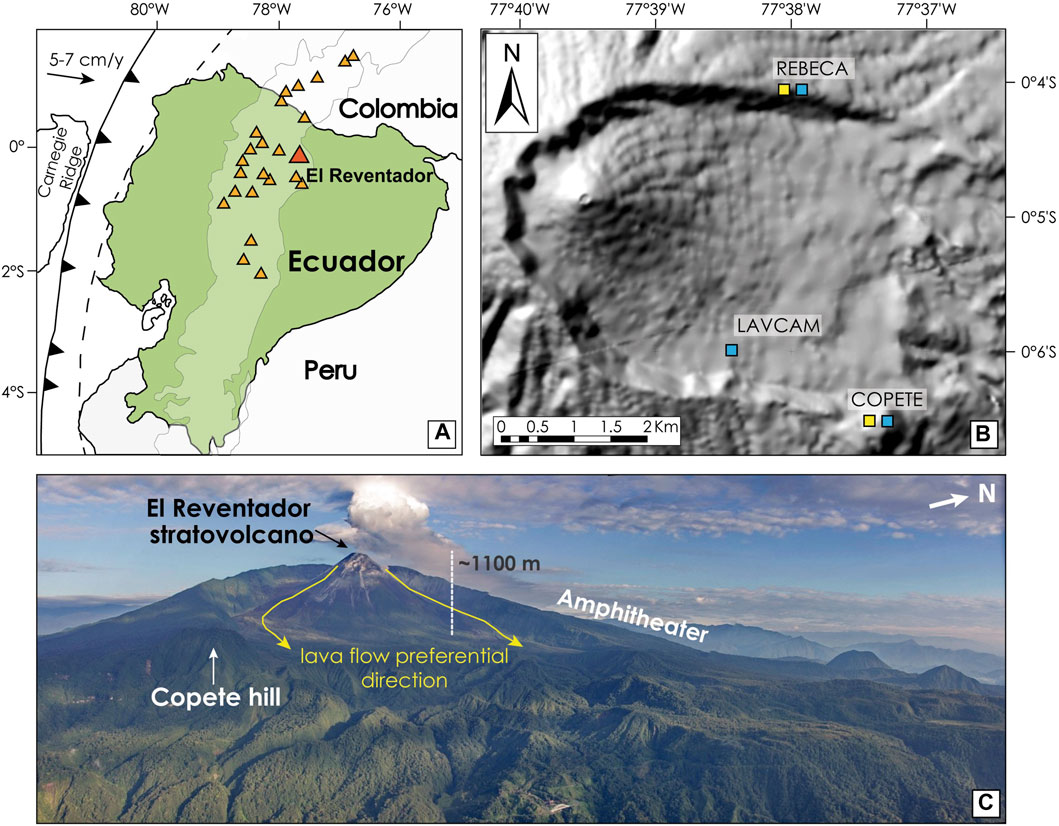
FIGURE 1. (A) Regional location of El Reventador volcano (from Hall et al., 2008). (B) Map of the visual (blue squares) and thermal (yellow squares) network cameras used in this study, source: IG-EPN. (C) Aerial view of the volcano from the southeast, showing the main features including the active stratovolcano, the amphitheater rim, Copete hill, and preferential direction of lava flows; credit: Patricio Ramón, IG-EPN.
El Reventador is monitored by the IG-EPN. The monitoring program started with airborne visual and thermal imaging just after El Reventador’s reactivation in 2002. During the following years, a permanent monitoring network was established with multiple short-period and broadband seismometers, lahar detectors, stationary visual and infrared cameras, a scanning DOAS (Differential Optical Absorption Spectrometer) station, and ash-meters (Figure 1B). Currently, monitoring is complemented by satellite remote sensing data which comprise thermal anomaly detection (e.g., MIROVA), ash plumes (e.g., Volcanic Ash Advisory Center -VAAC), and SO2 (e.g., Monitoring Unrest From Space-MOUNTS). Additionally, field campaigns and overflights include volcanic material sampling, SO2 measurements, and thermal and visual image surveys.
3 Methods
3.1 Definition of study phases
Over the last 20 years of eruptive activity at El Reventador, many notable changes in both the style of eruptive activity and the morphology of the volcano have occurred. Changes in morphology have occurred by both destructive explosive events and the accumulation of lava flows, a tephra cone, and lava domes. Following previous works (e.g., Samaniego et al., 2008; Naranjo et al., 2016), we continue to define eruptive phases based on lava-flow characteristics such as length, duration, and composition. In addition, we include Volcanic Radiative Power data provided by the MIROVA platform in the definition of these phases. The space-based volcanic hot-spot detection system MIROVA combines high sensitivity for the detection of small thermal anomalies with a temporal coverage typical of moderate-resolution sensors. The MIROVA system uses the Middle InfraRed Radiation (MIR method) to detect, locate, and measure the heat radiated from volcanic activity, which is called Volcanic Radiative Power (VRP [MW]) (Coppola et al., 2016; 2020). This system allows us to track short-term and long-term variations in ongoing volcanic activity. The MIROVA webpage (www.mirovaweb.it/) provides thermal maps (50x50 km) and VRP time-series in a range from 1 to 4 h per day, which allows thermal monitoring of a specific target approximately four times per day (Coppola et al., 2016). This study considers the maximum daily VRP values taken at night between November 2002 and January 2023, avoiding the daily solar influence. Nonetheless, cloudy weather can inhibit the detection of additional thermal anomalies. List of all the acronymons used here is shown in Appendix A.
The highest values for VRP measurements were used to define phases that correspond to lava flow emission and deposition (2002–2022), tephra cone construction (2010), and lava dome extrusion (2011).
3.2 Thermal and visual aerial imagery
Imaging of the volcano using both visual and thermal cameras was performed regularly by the IG-EPN staff through overflights and field trips using hand-held infrared cameras: the FLIR (Forward Looking Infrared) P650 model (320x240 pixels) between 2002 and 2009, the FLIR SC660 (640x480 pixels) since 2010, and FLIR T1020 since 2020, and various DSLR cameras. In total, 107 flights were carried out, with an average of six flights per year. Flights were carried out between 3,500 and 4,200 m altitude and always at least 2 km horizontally from the active crater for safety reasons. In addition, ground-based thermal cameras (Figure 1B), COPETE (5.5 km to SW) and REBECA (3.5 km to NE), with a resolution of 320x240 pixels, provided images between 2013–2015 and 2018-present, respectively. Images from the COPETE and REBECA thermal cameras have assisted in the identification of lava flows since 2014 and 2018, respectively. Thermal images were converted to. jpg files using the software ThermaCAM Researcher © 2002 from FLIR. All images were calibrated for the effects of humidity, atmospheric and reflected temperature, distance from the camera, and emissivity parameters. The first two parameters were measured directly during the flight, and the distance to the heat source was estimated using the camera’s GPS location taken with each image. Ambient temperatures were assigned based on correlation with two different weather conditions where clear skies were assigned a temperature of −10°C and cloudy skies a temperature of −5°C. An emissivity value of 0.96 was assigned based on typical values for andesitic rocks. Although all the thermal images were calibrated, only a few were used in this study to estimate the temperature of the different volcanic products. The primary use of thermal images from overflights was to better identify volcanic features and monitor surface changes that were often obscured by the near-continuous presence of gas and ash emissions.
3.3 Photogrammetry analysis
Visual images were acquired by various DSLR cameras via helicopter and airplane, typically with a 50%–75% overlap and at oblique angles because of near-continuous volcanic activity that prevented direct overflights. We apply photogrammetry techniques to a subset of images acquired in the 20 years of overflights based on two main aspects: 1) their quality (clear, minimal ash/gas emission), and 2) those that show significant morphological changes compared to those obtained previously. Therefore, images from 11 flights: 25 November 2005; 20 April 2010; 13 October 2011; 19 October 2013; 19 April 2015; 28 January 2016; 07 June 2017; 12 April 2018; 14 November 2019; 07 October 2020; and 08 December 2022 were processed to create a time-series of DEMs and orthomosaics.
Images were processed in Agisoft Metashape structure-from-motion photogrammetry software following a semi-automatic workflow with an iterative error reduction process (e.g., Over et al., 2021). For image datasets without geospatial location, a network of artificial ground control points (GCPs) was created from easily identifiable stable features within the amphitheater to constrain each model in real-world space (e.g., Diefenbach et al., 2013). The DEMs were exported at 1 m resolution and co-registered using a point-to-plane iterative closest point alignment method to further reduce error, particularly in the z value, and to provide more accurate volume change measurements between successive dates (e.g., Shean et al., 2016).
3.4 Morphological changes and volume quantification
3.4.1 Morphological changes
The identification of morphological features (tephra cone, new vents, lava flows, etc.) was based on the analysis of clear visual and thermal images obtained between 2002 and 2022 during overflights, field campaigns, and ground-based cameras. The lava flows are named using the abbreviation LFn, where n is the number assigned according to temporal order.
Quantitative analysis (dimension and volume estimation) of these morphological features was done in ArcGIS© using the 11 DEMs created here and an additional DEM which represents the pre-2002 morphology of the volcano. First, we made an orthogonal analysis of the 12 DEMs to estimate the dimensions of all the identified features along the studied period. This orthogonal analysis was also used to measure the position of new morphological features with respect to the summit crater and vent position prior to the 2002 eruption in order to track their migration through time. Additionally, we drew two representative cross-sections with two main directions in ArcGIS. We obtained 24 profiles from the combination of the 12 DEMs along two cross-sections. These profiles help to better understand the spatial changes over the summit (destructive events and constructive processes), the location of the vent at each DEM with respect to the pre- November 2002 location, and the maximum summit height differences throughout the studied period.
3.4.2 Volume changes
Volumes reported in this study are focused on the volcano’s active cone and primarily include volume added and removed within the confines of the area impacted by the 2002 VEI 4 event except for the 2018 collapse event that extended to the western amphitheater wall. Volume estimates were produced using a DEM-differencing technique that estimates the cell-to-cell elevation change between successive models within an outlined area (defined polygon) in ArcGIS utilizing an in-house Python script.
3.4.3 Lava flow volume estimations
The volume of lava flows emitted between 2002 and mid-2016 was estimated in previous studies by Naranjo et al. (2016), Arnold et al. (2017, 2019), and Vallejo Vargas (2017). In total, these studies report the volume of 60 lava flow units. In this study, we added the volume of 22 lava flows emitted between late 2016 and January 2023. These estimations were obtained by delineating the surface of the flows in the DEMs and satellite images and multiplying them by a representative thickness value measured in the field or directly from the DEMs.
4 Results
4.1 Eruptive activity between 2002 and 2022
Since 2002, El Reventador has been continuously active. This activity has been split into different phases based primarily on lava flow occurrence and bulk composition by various studies. Samaniego et al. (2008) proposed the first two phases, Phase A (2002) and Phase B (2004–2005); Naranjo et al. (2016) described Phase C (2007) and Phase D (2008–2009). Arnold et al. (2019) added one more phase, Phase E (2012-2017), based on lava flow occurrence. In this study, we added an additional phase, Phase F (2018–2022). The following description characterizes the morphological changes to the crater during each phase between 2002 and 2022 (Figure 2).
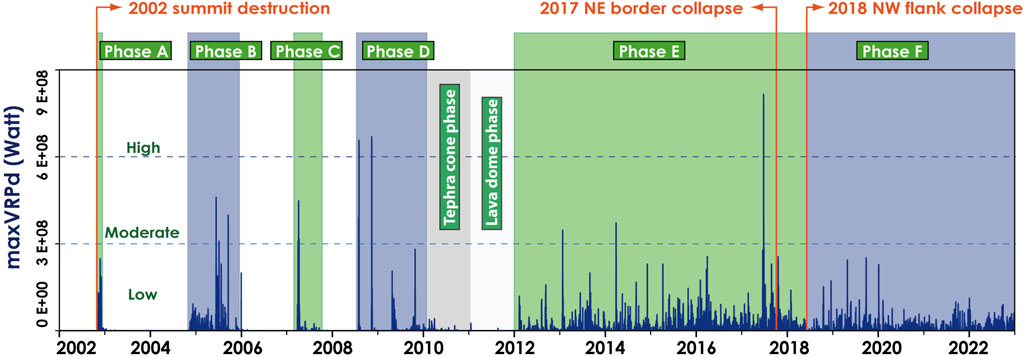
FIGURE 2. Eruptive phases, Phase A–Phase F, of El Reventador volcano identified between 2002 and late 2022 based on maximum daily Volcanic Radiative Power (VRP) (dark blue columns) from MIROVA in watts. November 2002 eruption, northeastern border collapse, and northwestern flank collapse events are represented by orange lines. The duration of each phase is shown in pale green and blue columns. The Tephra cone and lava dome are shown in gray and white columns.
Phase A: 2002 The 3 November 2002, eruption was preceded by an M=4.1 volcano-tectonic event on 6 October 2002, and another nine smaller seismic events. No other seismic or superficial manifestations were registered before the eruption (Hall et al., 2004). This phase was characterized by a high level of activity composed of an initial sub-Plinian eruption and a subsequent effusive phase over the next 2 months. A 17 km eruptive column was produced, and its ash traveled westward and reached the Inter-Andean Valley, approximately 80 km away. The paroxysmal phase lasted ∼45 min and caused the destruction of the summit, leading to the formation of a large, breached crater oriented to the north and the Western (WCB) and Eastern (ECB) Crater Borders, with their corresponding summits (Figures 3A, B). This VEI 4 eruption was the largest one in the last 140 years in the country (Troncoso and Jaya, 2003; Hall et al., 2004; Delpit et al., 2008). Two blocky lava flows were emitted in the following days, one (LF1) through the southern notch and the second one (LF2) from a lateral vent at the SE flank approximately 1 km distance from the new crater (Hall et al., 2004). Thermal activity in these months varied between moderate to high levels. After LF2, no other lava flow was emitted and superficial activity was related only to gas emissions until mid-2004.
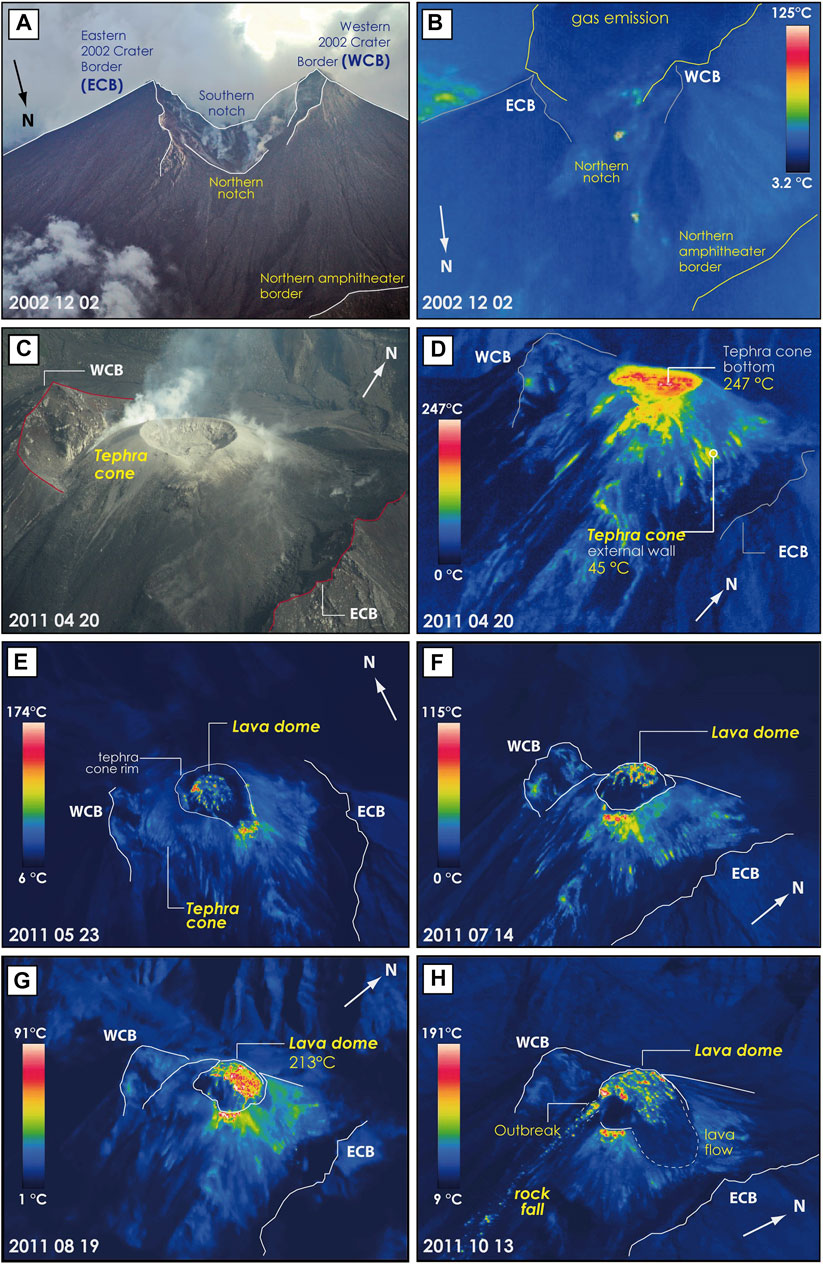
FIGURE 3. Aerial imagery of the crater of El Reventador. (A, B) Visible and thermal images taken from the north in December 2002 showing the Eastern and Western 2002 Crater Borders (WCB and ECB), and the northern and southern notches. (C, D) Visible and thermal images from the southeast on 20 April 2010, showing the Tephra cone with a truncated cone shape, fumarolic activity in the contact between the base of the Tephra cone and the western 2002 crater inner wall. E-H: Evolution of the dome inside the tephra cone between May to October 2011 through thermal images. The dome grew from a small structure situated within a crater at the top of the tephra cone (E), steepening and filling the crater as it grew (F, G) until it had filled the crater, forming a steep-sided central dome with a small lava flow on the east and generating rockfalls to the southwest (H).
Phase B: 2004–2005 After 24 months with no lava flow emission, this new phase started with the emission of a third lava (LF3). It was emitted from the southern notch and traveled over LF1 in November 2004. In 2005, three more flows were emitted through the southern notch (LF4-LF6) (Samaniego et al., 2008) and for the first time a small flow passed through the northern notch, the LF7 in September 2006 (Naranjo et al., 2016). Thermal activity was mostly moderate between November 2004 and May 2005 but drastically increased in July lasting through September and finally decreased altogether by October. Between late 2005 and early 2006, thermal activity was variable. Following the emplacement of LF7, no remarkable superficial activity occurred for nearly a year and a half.
Phase C: 2007 This phase started after nearly a year and a half with no effusive activity until March 2007 when LF8 was emitted through the southern notch, and a few days later, a new flow was identified on the northern flank (LF9) (Naranjo et al., 2016), both showing a high level of thermal activity. This phase ended with a small flow to the north in August 2007 (LF10) with low to moderate thermal activity. After LF10 was emplaced, no superficial activity was observed for almost 1 year.
Phase D: 2008–2009 Eleven months passed until a new lava flow (LF11) was emitted in July 2008, followed by LF12 in November 2008, both on the southeastern flank. In 2009, five more flows were emitted, LF14, LF16, and LF17, to the southeast and LF13 and LF15 to the northeastern flanks. In this phase, moderate and high thermal activities were registered in association with each flow’s emission. Sporadic satellite-based thermal alerts were detected for all of these flows.
During Phases A-D, lava emission was progressively filling the crater created in 2002.
Tephra cone phase: 2009–2010 After LF17, a tephra cone formed over the crater floor (Figures 3C, D). This new feature was formed by the accumulation of pyroclastic material (ash to block size) showing a symmetrical truncated cone shape (Vallejo and Ramon, 2012). Its flanks were gently sloped while the inner walls were steep, and its bottom showed small explosion pits. The tephra cone was observed for the first time on 31 October 2009, and continued to build until 22 October 2010. Additionally, for the first time after the 2002 paroxysm, we observed the occurrence of small PDCs (<300 m length). Thermal activity showed low to moderate levels with few high values. The highest temperature of 247 °C was measured on 20 April 2010 (Figure 3D).
Lava dome phase: 2010–2011 Superficial observations up until March 2011 revealed a small exogenous lava dome building inside the tephra cone (Vallejo and Ramon, 2012; Arnold et al., 2017), starting a new effusive phase. The dome covered the whole tephra cone floor and showed a rough, blocky surface on the top with some hot spots and a cool talus apron around the sides. At this point in time, the dome did not surpass the height of the tephra cone (Figure 3E). Two months later, on July 14, it had grown, and it preserved a regular dome shape with a rounded top and talus apron on all sides (Figure 3F). By August 19, the morphology changed, steep side walls were identified, and the top showed an inclined surface to the east with an intense thermal anomaly of 213 °C (Figure 3G). This anomaly was later related to the initial phase of a small lava flow extruding from the eastern side of the dome, which on October 13 had stopped flowing but had reached the middle section of the tephra cone (Figure 3H). Additionally, on that day, a small outbreak on the southeastern wall of the dome was observed, resulting in hot rockfalls (Figure 3H). On 10 November 2011, another small lava flow was extruded to the south. Temperatures between March and November showed 256 °C and 230 °C corresponding to the lava flow and lava dome surface, respectively. According to Arnold et al. (2017), the volume of the dome by December 2011 was 0.99x10⁶ m3. Over this period, the lava dome continued to grow; only one low-level thermal anomaly was registered. Effusive activity was identified for at least 8 months.
4.1.1 Phase E: 2012–2018
Simultaneous effusive and explosive activity marked the style of this phase (Arnold et al., 2017; Cornejo, 2017). Between 2012 and 2015, superficial activity was concentrated in one vent, the South Vent (SV), located in the center of the crater, producing both effusive and explosive activity (Figures 4A, B). In late 2015, during fieldwork at the base of the volcano, gas/ash emissions from two independent locations at the summit were observed for the first time. Later, during an overflight on 28 January 2016, the existence of two active vents was confirmed (Figures 4C,D), the already existing South Vent (SV) and the new North Vent (NV) (Almeida et al., 2019). The NV generally displayed effusive activity with intermittent explosive activity; meanwhile, SV showed only explosive activity. As the effusive and explosive activities were simultaneous since 2012, the emitted volcanic material led to the continued growth of the stratovolcano. By 2016 (Figures 4C,D), it nearly filled the crater left in 2002; however, both the 2002 ECB and WCB were still identifiable. By 21 July 2017, both vents contained explosive pits, no effusive activity was identified at that time, the 2002 ECB was totally covered, and the slope of the eastern flank was now uniform and continuous; whereas, on the western side, the 2002 WCB was still visible (Figures 4E,F). On 12 April 2018, the summit crater was still circular and shallow, the two vents, NV and SV, continued with their previously described activity. On the other hand, PDCs were identified in September 2013 to the south and southeastern flanks with distances reaching 1.6 km from the crater. Since 2013, PDCs have continued to occur and extended over almost all the flanks. According to Naranjo et al. (2018), on 22 June 2017, a major explosive event took place, accompanied by a small collapse of the northeastern border where PDCs were generated and traveled down the slope to 3.5 km to the northeast. The cumulative volume of these PDCs was estimated to be 1.6 ±0.4x10⁶ m3. Rapidly following the border collapse and PDC emplacement, effusive activity began from a new vent on the northern flank.
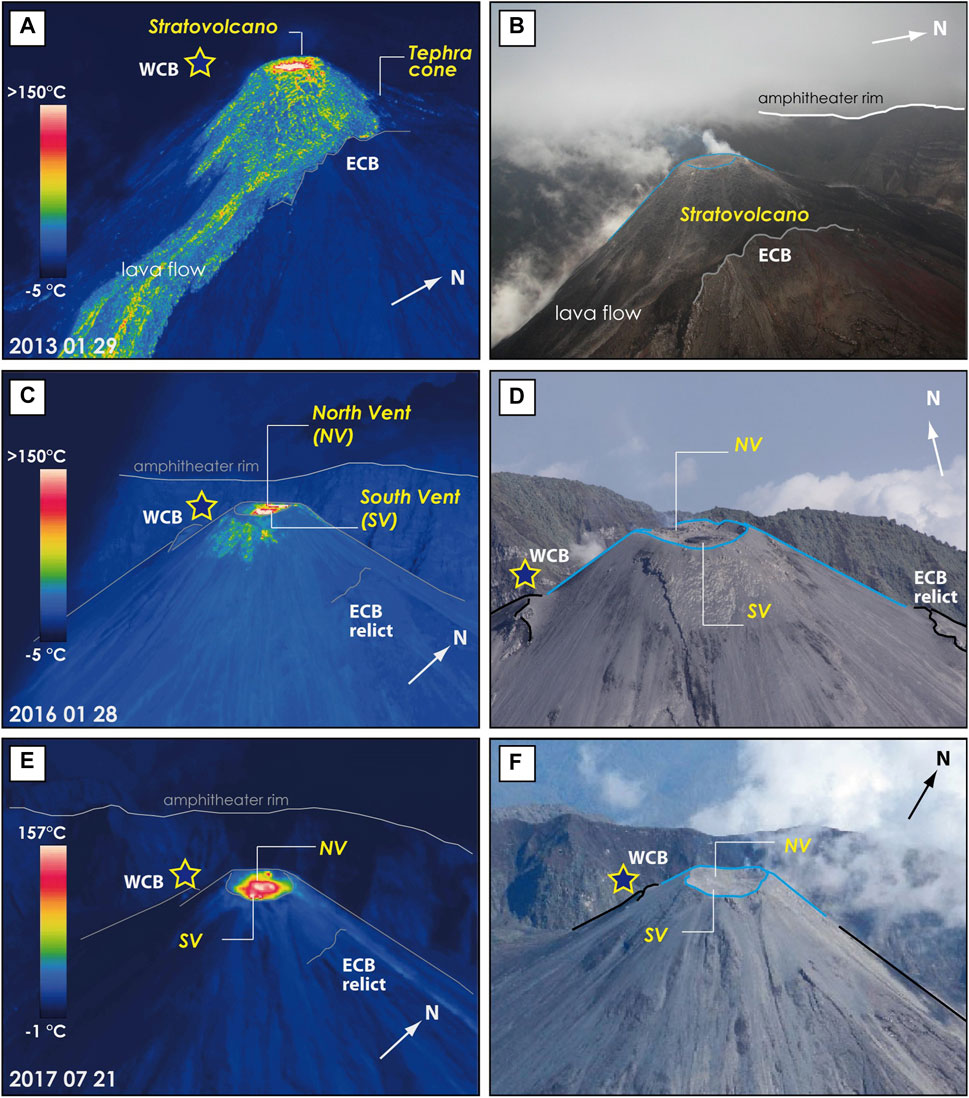
FIGURE 4. Aerial thermal and visible images showing the evolution of the summit morphology between 2013 and 2017. (A, B) The 2002 Western Crater Border (WCB) is represented by the yellow border/blue-filled star. On 29 January 2013, the stratovolcano peak nested inside the summit crater, and the active lava flow descended its southeast flank. (C, D) On 28 January 2016, the crater left in 2002 was almost filled, but the remains of the 2002 WCB were still observable; on the opposite side (east), it was almost unrecognizable. The summit crater morphology is obvious here, with the presence of two vents, the North Vent (NV) and the South Vent (SV). (E, F) A similar structure is shown in images from 21 July 2017, with the two active vents (NV and SV) visible. By this time, the WCB had been almost fully covered by a tephra cone growth.
Between early 2012 and early 2017, 58 lava flows (LF18-LF75) were identified, emitted, and emplaced on the upper part of the cone on the north, south, northeast, southeast, and east flanks: 7 in 2012 (LF18-FL24), 11 in 2013 (LF25-LF35), 9 in 2014 (LF36-LF44), 11 in 2015 (LF45-LF55), 8 in 2016 (LF56-LF63), and 12 in 2017 (LF64-LF75) (Arnold et al., 2017; 2019; Vallejo Vargas, 2017). The cumulative volume of these flows was approximately 78.3x10⁶ m3 (Arnold et al., 2017; Vallejo Vargas, 2017, this work). The lava flow (LF67) emitted after the July 2017 event was emplaced rapidly over ∼5 days and was the largest flow since 2008, 2.6 km in length and 6.6x10⁶ m3 in volume (Naranjo et al., 2018).
4.1.2 Phase F: 2018–2022
On 20 June 2018, during an overflight, it was observed that a large landslide scar had opened on the northwestern flank of the volcano stretching from the eastern summit to the northwestern flank and down to the base of the active cone on the northwestern amphitheater floor (Figures 5A, B). Based on seismo-acoustic signals from stations located on the eastern flank of the volcano and on visual images from the NE, it was estimated that the scar was formed in late April due to continuous and intense explosive activity (Ortiz et al., 2019; Vallejo et al., 2019). Analysis of thermal and visual images from the overflight (June 2018) suggested the presence of three active vents within the amphitheater created in April 2018, two located on the upper part of the scar with explosive activity and was associated with NV and SV (Almeida et al., 2019). A third, western vent (WV), was identified at the bottom of the structure (Figure 5A) and showed explosive and effusive activity. High temperatures were identified in these vents with 119, 144, and 165.2 °C for NV, SV, and WV vents, respectively (Figure 5B). At this stage, the volcano summit corresponded to the head of the scar (eastern side). After 6 months of no lava effusion, a new phase began with the extrusion of a new lava flow (LF76) from the WV, in late April, right after the scar formation. Two more flows were extruded in June 2018 and in May 2019 from this vent (LF77 and LF78). Flow paths were topographically controlled and therefore narrowly confined in the area between the stratovolcano flank and the amphitheater wall. Analysis of images from the ground-based thermal camera REBECA (Figure 1B, northeastern amphitheater rim) identified independent activity from each of the three vents, including the production of eruptive columns from each. Visual observations in November 2019 confirmed that the amphitheater was almost completely filled (Figures 5C, D). At this time, only the eastern border of the 2018 scar remained visible at the summit and a new tephra cone was recognizable. Within the tephra cone, two pits were active at its base, and were the source of explosive activity, depositing ash and ballistic blocks on the flanks. In addition, an inactive lava flow (LF79) was observed on the northwestern flank, originating from a satellite vent (WV, Figures 5C, D) at the middle of the flank, corresponding to the last lava emitted from WV.
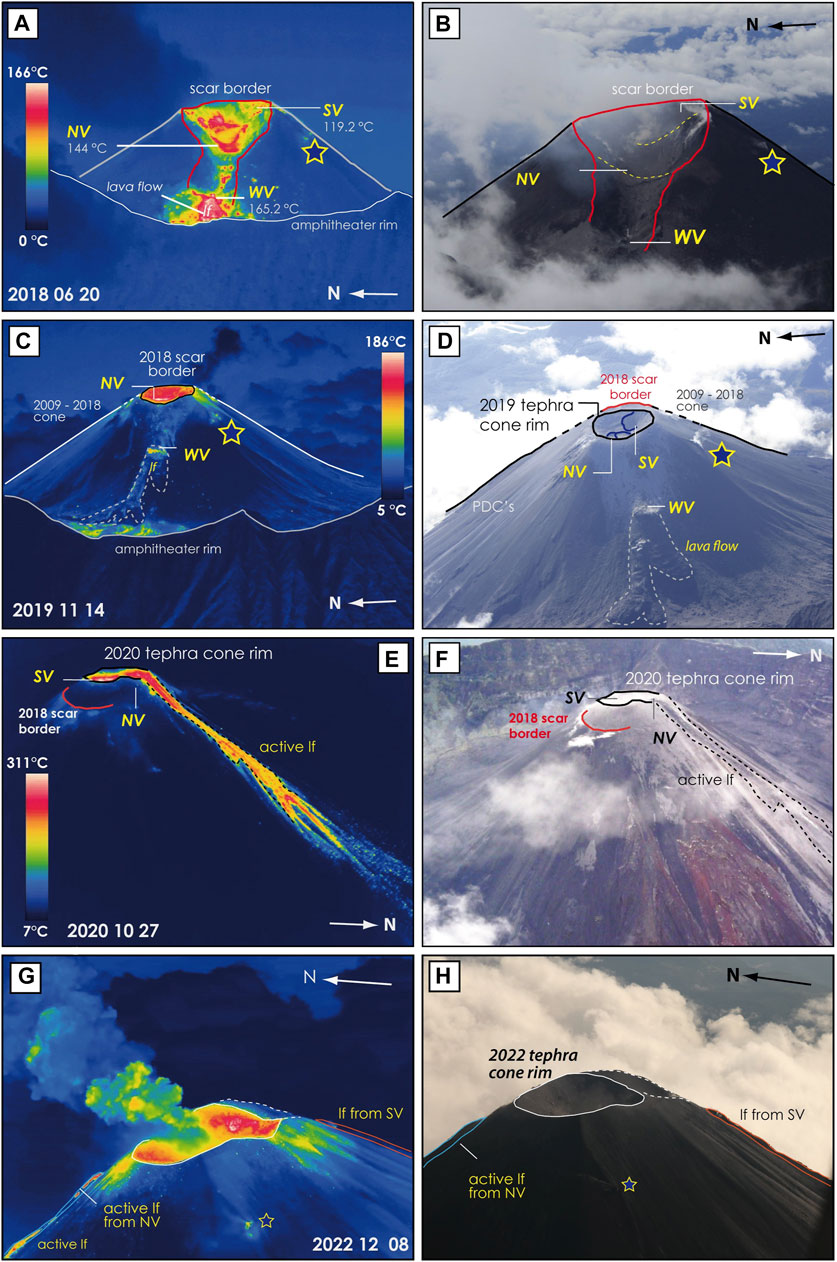
FIGURE 5. (A, B) Aerial thermal and visible view of the northwestern side of the volcano showing the scar formed in late April 2018 and its three vents within it. (C, D) Images taken from the northeast from 27 October 2020, showing the scar was filled with pyroclastic material; a lava flow, LF78, is observed coming from the WV; the lower vent is identified when the scar was opened. (E, F) View of the eastern and northeastern flank showing a tephra cone built in the summit, the 2018 head scar still identifiable; two vents within the cone were active with explosive and effusive activities; one pulsatory lava flow (LF80) was identified from the North Vent (NV) to the northern flank. (G, H) View of the crater from the southwest showing a deep conical crater with continuous explosive activity.
By 27 October 2020, the summit was close to pre-2002 levels but the head of the scar (eastern border) was still visible. Activity was observed on the two preexisting vents, SV and NV (Figures 5E, F). The SV showed only explosive activity meanwhile the NV displayed pulsating effusive activity to the northeast that lasted for approximately 5 months forming a 600 m length lava flow (LF80); this activity was observed from ground-based thermal cameras. Analysis of images from these cameras showed important changes at the summit between 8 April and late May 2021, with the formation of a depression (SE notch) at the southeast crater border due to intense explosive activity during that period, followed by lava dome growth at the eastern crater border (ECB). On 17 May 2021, intense explosive activity was recorded (eruptive columns, PDCs, and explosions) that lasted a few hours and led to the formation of a lava flow (LF81) to the north from the NV. Four days later, another lava flow (LF82) was emitted to the southeast for over 20 days through the SV. The NV was active until January 2023, generating four long-duration pulses of the LF81 to the north and east (Vallejo et al., 2023). Meanwhile, the tephra cone continued to grow at the summit. By 8 December 2022, effusive activity was observed only on the northern flank, at the North Vent (NV) (Figures 5G, H), which was active between May 2021 and January 2023, and due to explosive activity within the crater, this vent was covered by pyroclastic material allowing the continuous formation of a tephra cone in the summit. Recent deposits of PDCs were observed on almost all the flanks of the volcano. Figures 5G, H show the presence of LF81 and LF82 over the north and southeastern flanks. On that date, there was no evidence of the scar border from 2018. Additionally, the summit showed a tall conical tephra cone; only pyroclastic material was observed in this structure (Figure 5H).
Table 1 summarizes 20 years of eruptive activity at El Reventador defined by eruptive periods 1 and 2, destructive events A-C, eruptive phases A-F, and the lava flows that erupted in each of them. Morphological changes, active vents and their locations, and the DEMs and associated dates are also listed.
TABLE 1. Table of eruptive periods, destructive events, eruptive phases, lava flows emitted, associated morphological changes, and location of active vents identified in DEMs.
4.2 Morphological changes from DEM differencing
Morphological changes were observed through visual and thermal images and measured based on differencing consecutive DEMs and interpreted in the context of the aforementioned chronology (Figures 6–8). Before the large eruption on 3 November 2002, the active stratovolcano had a maximum height (hm) of 3,560 m and a well-defined 163x152 m crater at the summit (Figures 6A; Figure 8B). The 3 November 2002, explosive eruption destroyed the top of the stratovolcano, creating a crater that was breached to the north and south and bounded by the WCB and the ECB, measuring a 914 m length and 367 m width on 25 November 2005 (Figure 6B). WCB and ECB summits reached 3,526 and 3,438 m, respectively. Based on differences between the pre-2002 and 2005 DEMs, at least 28.9x10⁶ m3 of material was removed during this explosive event and the lowest point of the breached crater reached 3,120 m (Figure 8B). Furthermore, the location of the vent shifted 166 m eastward after the 3 November 2002, eruption (Figure 6B).
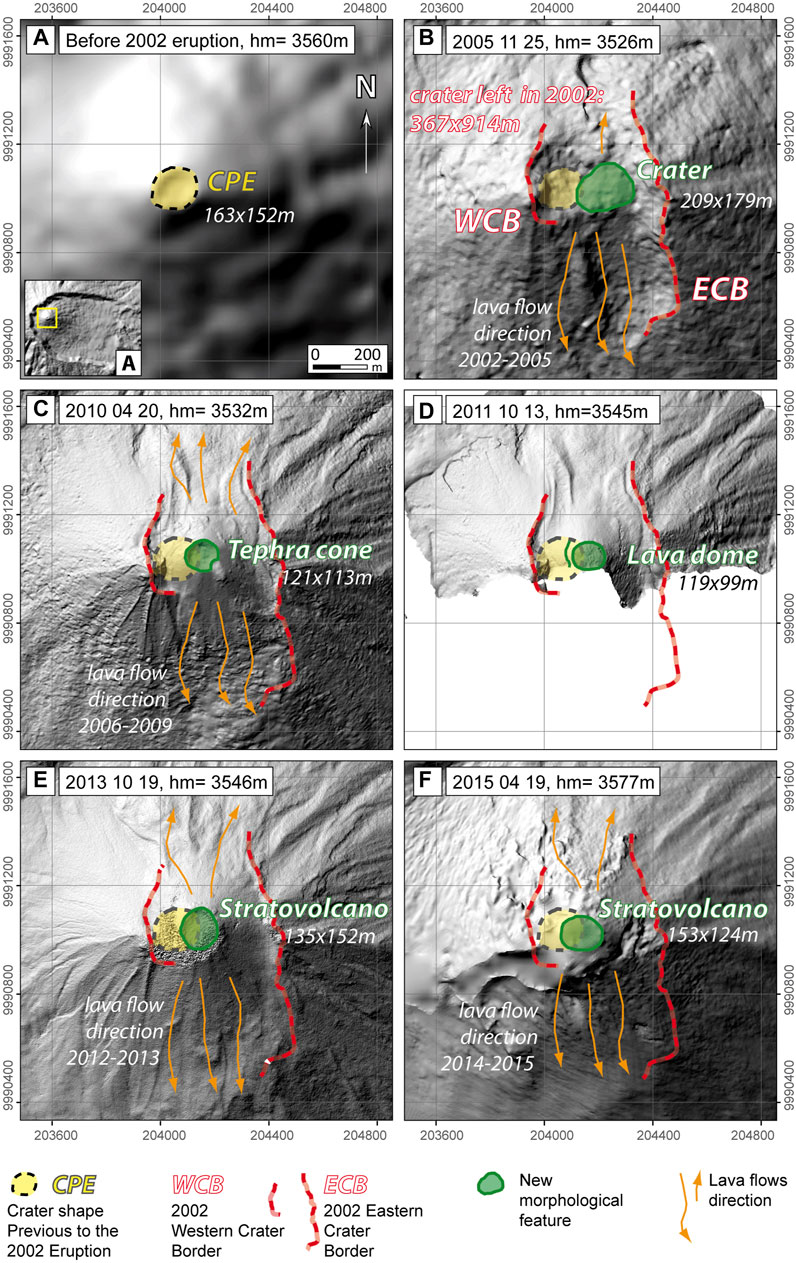
FIGURE 6. (A) Hillshade of El Reventador volcano showing the area (yellow square) used for representing morphological changes of the summit between 2002 and 2015 (A–F). Major structures include Crater shape Previous to the 2002 Eruption (CPE), Eastern and Western 2002 Crater Borders (ECB and WCB), Crater, Tephra Cone, Lava Dome, and Stratovolcano; and lava flow directions are shown.
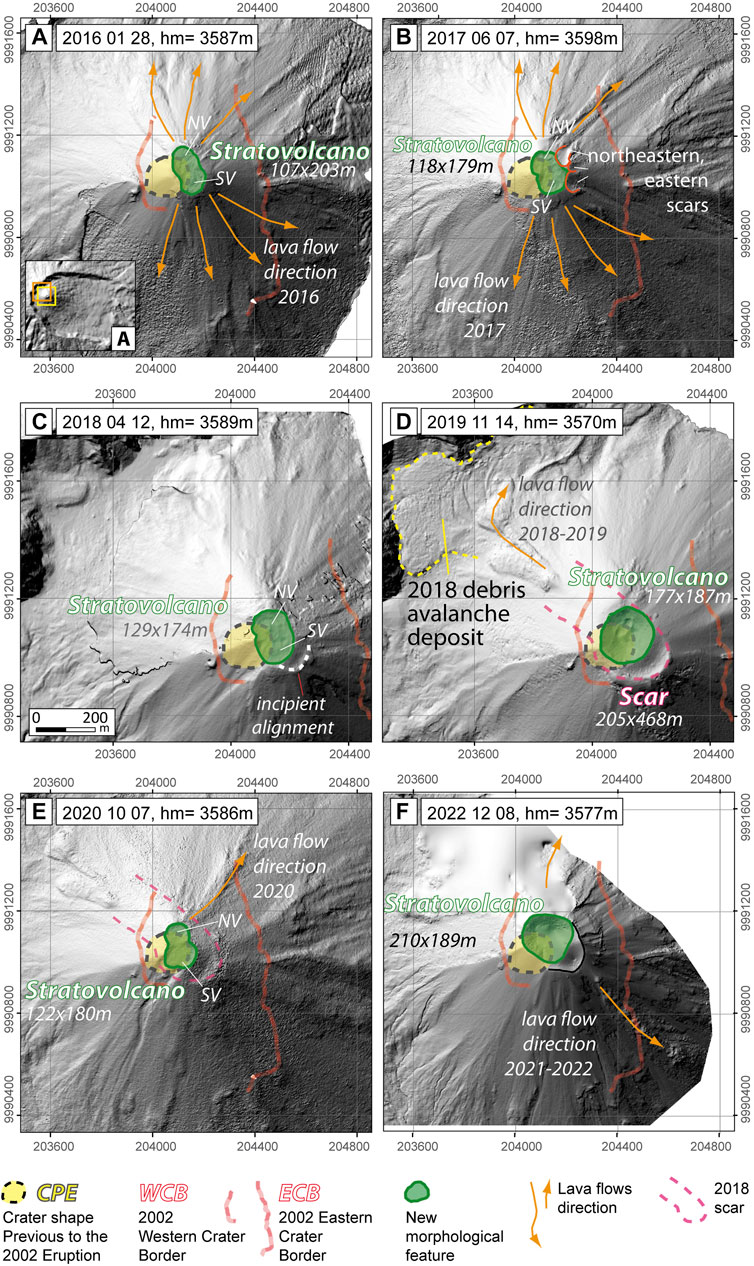
FIGURE 7. (A) Hillshade of El Reventador volcano showing the areas used for representing morphological changes of the summit between 2016 and 2022, yellow square for (A, B, E, F); and orange square for (C, D). Major structures as Crater shape Previous to the 2002 Eruption (CPE), Eastern and Western 2002 Crater Borders (ECB and WCB), Crater, Tephra Cone, Lava Dome, and Stratovolcano; and lava flow directions are shown.
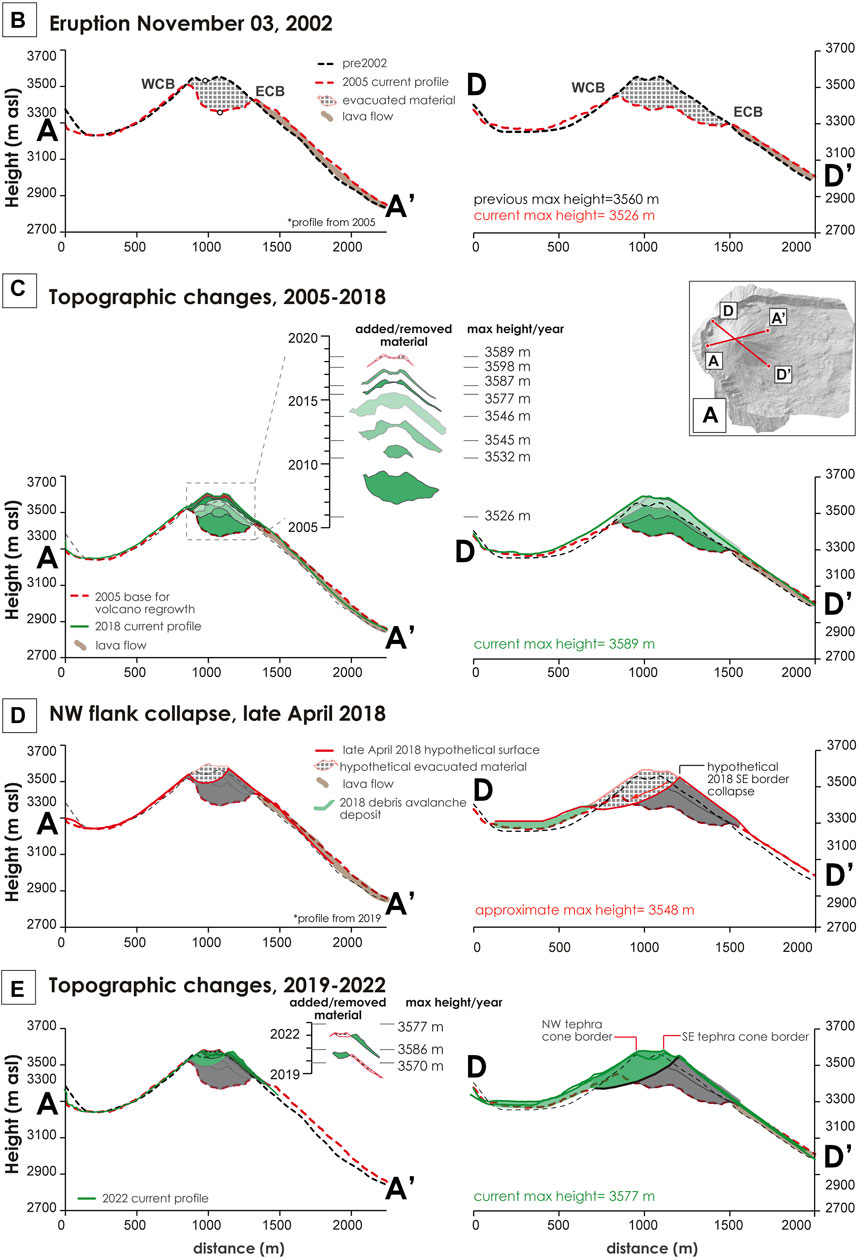
FIGURE 8. Evolution of the summit looking through AA’ (west southwest–east northeast) and D–D’ (northwest - southeast) profiles (A), defined in 12 DEMs from pre-2002 eruption, 25 November 2005; 20 April 2010; 13 October 2011; 19 October 2013; 21 April 2015; 28 January 2016; 07 June 2017; 12 April 2018; 14 November 2019; 07 October 2020, and 08 December 2022. In (B–E), the black dotted line represents the shape of the volcano before the 2002 eruption and the red dotted line represents the profile left by the eruption and seen in November 2005. The area filled with squares represents the evacuated material. Western and Eastern Crater Borders (WCB and ECB) are shown. Brown-shaded areas correspond to lava-flow accumulation in the flanks. Green-shaded areas represent resulting morphologies by constructive processes (lava and pyroclastic material). In (C), the red line corresponds to the inferred shape from the northwestern flank collapse that occurred in April 2018; the square-filled area represents the removed material which was deposited at the base of the western flank between the volcano and the western amphitheater wall and transparent black represents the remaining material added since 2005.
By 20 April 2010 (hm=3,533 m), images of the tephra cone showed a 121x113 m crater (Figures 6C; Figure 8C) with a depth of 26 m. When compared to the previous 2005 DEM, it was calculated that 21.3x10⁶ m3 of volcanic material was added and the center cone was located 93 m to the east from the Crater shape Previous to the 2002 Eruption (CPE) (Figures 6C; Figure 8C). On 13 October 2011 (hm=3,546 m), the rounded lava dome (119x99 m) occupied the whole tephra cone crater floor (Figures 6C; Figure 8C) with a volume and thickness of 5.7x10⁶ m3 and 53 m, respectively. The vent was located 104 m to the east from the CPE. By 19 October 2013 (hm=3,547 m), the summit showed a shallow 135x152 m explosion crater located 83 m to the east from the CPE (Figures 6C; Figure 8C). Since October 2011, 13.6x10⁶ m3 of volcanic material was added, and 13.3x10⁶ m3 between October 2013 and 19 April 2015 (hm=3,578 m). The April 2015 crater was located 77 m east from the CPE (Figures 6F; Figure 8C). By 28 January 2016 (hm=3,587 m), the breached crater created in 2002 was almost fully filled and showed an elongated 107x203 m shallow summit crater oriented to the northwest (Figures 7A; Figure 8C) with 0.07x10⁶ m3 of material added. The two vents, south and north (SV and NV), reported previously by Almeida et al. (2019) were observed and were located 96 m and 110 m to the east and northeast, respectively, from CPE. By 07 June 2017 (hm=3,597 m), an additional 6.4x10⁶ m3 of lava and pyroclastic material was added to the crater, completely filling it. The elongated shallow crater remained at the summit, measuring 118x179 m with the same orientation as in 2016, containing the two vents SV and NV located 88 and 82 m to the east and northeast, respectively, from the CPE. Other minor explosion pits were also present at the summit which reached a height of 3,596 m. Additionally, three small scars were observed to the east and northeast of the crater (55x73 m, 38x59 m, and 68x79 m dimensions) (Figures 7B; Figure 8C). On 12 April 2018 (hm=3,590 m), the shallow crater observed in 2016 and 2017 still appeared at the summit with 129x174 m dimensions and located at 91 and 103 m to the east and northeast, respectively, from the CPE. Differently from 2017, a regular surface that lacked minor pits and small scars was observed at the southeastern crater border near the eastern scars, which was vertically limited by a 153 m incipient alignment (white dotted line, Figures 7C; Figure 8C). Since 2017, 1.9x10⁶ m3 of volcanic material has been added.
On the DEM from 14 November 2019 (hm= 3,570 m), a significant change was identified at the summit due to a second larger summit collapse that occurred in late April 2018 and left a large, breached crater at the summit. Compared with April 2018, the volcano lost 2.6x10⁶ m3 of material. The scar left by the collapse was approximately 205 m wide and 468 m long with the breach oriented to the northwest (Figures 7D; Figure 8D) and the NW vent was still observed, located 269 m northwest from the CPE. Additionally, in this 2019 DEM, we observed a new deposit in the saddle between the northwestern bottom of the volcano and the western amphitheater wall when compared to the 2018 DEM. This deposit was produced by the northwestern flank collapse (debris avalanche). By differencing the DEMs, we estimated a minimum volume of 1.3x10⁶ m3 for this debris avalanche (Figure 7D). On the other side, by 14 November 2019, the collapse scar had been filled in by the large amounts of deposited material, and, in its place, a 177x187 m tephra cone was observed containing some explosion pits. This cone contained both SV and NV, located 76 and 94 m to the east and northeast of the CPE (Figure 7E; Figure 8E). Comparing DEMs between June 2017 and November 2019, we estimated an evacuated volume of 2.6x10⁶ m3 on the summit.
By 7 October 2020 (hm=3,587 m), the summit had regained much of its former shape and now contained a shallow crater 122x180 m across and 12 m deep with two vents (SV and NV), one located 72 m to the east and a second 115 m to the northeast from the CPE. Additionally, a small 66 m wide ravine open to the southeast was observed at the crater border (Figure 7E; Figure 8E). By 8 December 2022 (hm=3,577 m), images of the summit showed an irregular 210x189 m wide 30 m deep crater with only one vent inside, located 83 m to the northeast from the CPE. Additionally, the border of a 333 m long crater formed between 2020 and 2022 at a lower height than the current active crater (Figures 7F; Figure 8E). Between 2020 and 2022, a volume of 1.94x10⁶ m3 was added to the summit.
4.3 Destructive events and constructive processes
Morphological changes recognized over the summit of El Reventador between 2002 and 2022 were due to destructive events and constructive processes. Three major events totally or partially destroyed the summit of the volcano and, in between, two subsequent constructive periods progressively re-built it (Figure 9). Before the VEI 4 eruption on 3 November 2002, the volcano had a regular stratovolcano shape with a small crater at the summit (Figure 6A). This eruption corresponds to the first destructive-explosive event (Event A, Figure 9), where at least 28.9x10⁶ m3 of the summit was removed, leaving a breached crater oriented north-south (Hall et al., 2004; Samaniego et al., 2008) with the western and eastern crater borders (WCB and ECB) at maximum heights of 3,526 m and 3,438 m, respectively (Figure 6B; Figure 9). A few days later, effusive activity started, corresponding to the first period of the constructive process that included refilling of the crater with lava, ash, and PDCs (Period 1, Figure 9) and was accompanied by explosive activity. Effusive activity consisted of the emission of 75 blocky lava flows in five phases, Phase A (2002): LF1-LF2; Phase B (2004–2005): LF3-LF7; Phase C (2007): LF8-LF10; Phase D (2008–2009): LF11-LF17; and Phase E (2012-2018): LF18-LF75, and a lava dome formed in 2010–2011 (Figure 6D; Figure 9). Explosive activity was prominent between 2009–2010, 2013–2018, and 2019–2023, with the formation of tephra cones and sporadic short-medium PDCs (Figure 6C; Figure 7C, F). The spatial distribution of lava flows was controlled initially by the southern and northern notches and subsequently by the amphitheater walls, guiding the flows to the east and then being emplaced over the amphitheater floor. Twelve of the 17 initial lava flows were emitted within the first four phases A–D through the southern notch except for five that were emitted to the north from 2005 to 2009 (Figure 9; e.g., Phase A-D). By 2016, the crater created in 2002 was filling in with lava, ash, and PDCs, causing remnant structures such as the WCB and ECB to be progressively buried (e.g., Figures 7A; Figure 9). This allowed the spatial distribution of lava flows to expand to the southeast, northwest, and northeastern flank until 2018 (Figures 7A,B; 9 [Phase E]). By mid-2017, some scars opening to the eastern and northeastern border craters were observed (Figure 7B). One month later, a second destructive-explosive event (Event B), a small border collapse, took place (Figure 9), modifying the northeastern crater border and leaving a scar of 82 m width, with an evacuated volume of 0.2x10⁶ m3 (Naranjo et al., 2018). Additionally, between 2002 and 2015, a south vent (SV) was identified (e.g., Figure 6E), but by early 2016, a second vent (NV) became simultaneously active (Figure 7A). During Period 1 (2002–2018), 62.1x10⁶ m3 of volcanic material was added to the summit. On the third week of April 2018, a third destructive event took place (Ortiz et al., 2019; Vallejo et al., 2019), Event C, corresponding to the northwestern flank collapse, which led to the formation of a scar open to the northwest (Figures 7D; Figure 9). It is estimated that at least 1.3x10⁶ m3 of material was evacuated from this flank. Additionally, three vents were identified inside this feature, based on thermal images, two at the upper part corresponding to the NV and SV, and a third one at the bottom, the WV, that both had explosive and effusive activities. After Event C, a second constructive period, Period 2, that involved both effusive and explosive activities started to refill the scar left in 2018 with lava, ash, and pyroclastic material. By November 2019, the scar was almost completely filled (Figure 7D). A small tephra cone was observed over the new summit and two vents were observed (NV and SV), whereas the WV was no longer active (Figure 7D). Since the formation of the scar, three lava flows (LF76-LF78) were emitted between 2018 and 2019 from the WV and emplaced to the west and subsequently to the north and east (Figure 9). In 2020, pulsatory effusive activity was observed from NV, allowing the formation of LF79. Between mid-2021 and early 2023, the morphology of the summit allowed the distribution of three more flows to the southeast and north (LF80-LF82) through the NV, located outside the crater on the volcano’s outer flank (Figures 5G, H). Lava flows emitted between 2018 and early 2023 correspond to Phase F. The volume of material added during this period reached 1.9x10⁶ m3. As of November 2023, there is no active lava flow on the volcano.
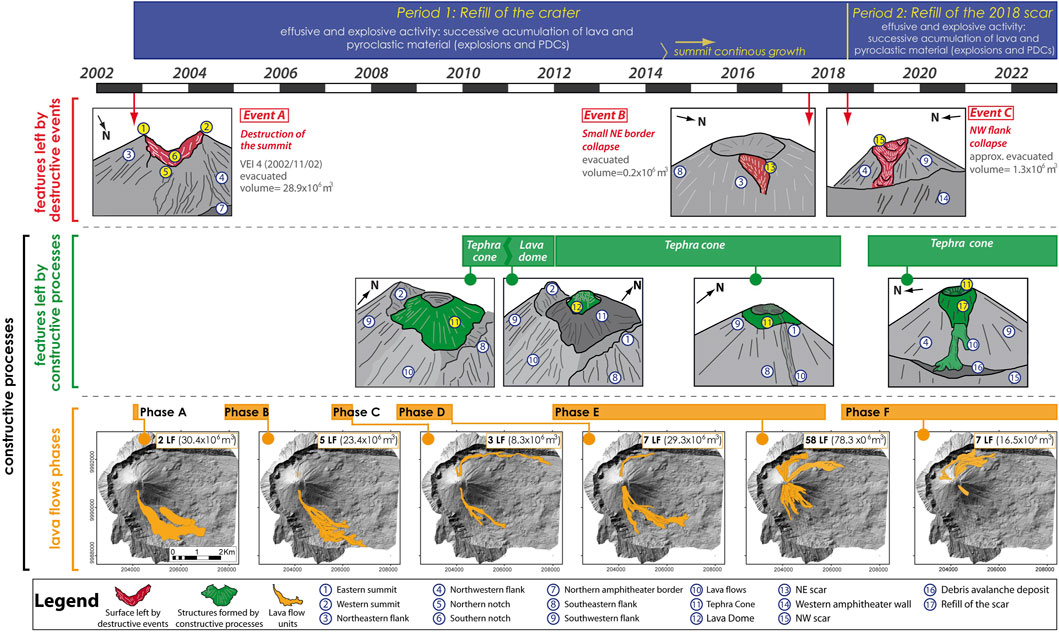
FIGURE 9. Scheme that summarizes the morphological changes of the summit of El Reventador between November 2002 and December 2022 due to destructive events and constructive processes. At the top of the image is shown the two major periods (Periods 1 and 2). The middle panel shows the destructive events: (A) (VEI 4 eruption that destroyed the summit), (B) (small northeastern border collapse), and (C) (northwestern flank collapse). At the bottom is shown constructive processes that covered the features left by those processes and lava flow emission divided in five effusive phases. Here, it is possible to recognize their spatial distribution and covered area over the volcano. Schemes of features left by destructive events and constructive processes do not have the same scale.
5 Discussion
5.1 Explosive-effusive activity and conduit architecture
El Reventador is a volcano traditionally described as an open-vent volcano (Rose et al., 2013) and has been continually active and morphologically dynamic (Figure 9) over the last 20 years. Applying the results obtained in this study from a large data set of thermal and visual images and correspondent DEMs, we can attribute the described morphological changes to a complex interplay of destructive events and constructive processes caused by a combination of explosive and effusive activity controlled by variations in the dynamics and architecture of the shallow magmatic system. Generally, explosive volcanic events are often associated with destructive processes at volcanic craters (e.g., Sato and Taniguchi, 1997) and effusive events with constructive processes (e.g., Branca et al., 2011; Shevchenko et al., 2020). While this is certainly true of Event A (explosive), the other periods and events described here, e.g., Events B and C, show a much more complex relationship between the explosivity of the activity and the resulting morphological changes. Studies of the 2002 VEI 4 sub-Plinian event describe it as a highly explosive magmatic eruption with a phreatomagmatic component (Samaniego et al., 2008). The high degree of explosivity and destructiveness was attributed to elevated pre-eruptive volatile contents due to a new intrusion of basic volatile-rich magma and ascent under closed system degassing conditions (Samaniego et al., 2008). The effusive activity commenced shortly after, filling in the base of the newly formed crater (Figure 9) and beginning this new period and the reconstruction of the cone (Period 1). Effusive activity is common following large explosive eruptions as either lava flows, as seen at Tungurahua, Ecuador, 2006 (Kelfoun et al., 2009); Shinmoedake, Japan, 2011 (Kozono et al., 2013); and Sinabung, Indonesia, 2013 (Nakada et al., 2019), or lava domes such as Novarupta, United States of America, 1912 (Nguyen et al., 2014); Mount St. Helens, United States, 1980 (Swanson and Holcomb, 1990); Mount Pinatubo, Philippines, 1991 (Newhall and Punongbayan, 1996); and Chaitén, Chile, 2008–2009 (Pallister et al., 2013). Slowing magma ascent and efficient outgassing are suggested to be causes of these transitions (Nguyen et al., 2014). In 2009, explosive activity joined effusive activity, continuing the period of cone growth through today, punctuated only by two destructive events that were not related to major explosive activities.
Lava flow accumulation, tephra deposition, and small-scale slope instabilities have resulted in variable cone morphologies and changing vent locations through time. Continued effusive and explosive activity between 2014 and 2015 rebuilt the stratovolcano to its pre-2002 height, but it did not regain its symmetrical shape until early April 2018 (Figure 10). As the stratovolcano rebuilt, small slope failures occurred, including two that produced eastward-directed scars at the eastern and northeastern external crater rim by 7 June 2017. Two simultaneously erupting vents at the summit were confirmed in early 2016, one dominantly explosive and the other effusive. This vent configuration remained stable for at least the following 6 years. Explosive and effusive activities from multiple vents resulted from the branching of the conduit feeding system (e.g., Pioli et al., 2008; Kervyn et al., 2009; Waythomas, 2021). Conduits typically bifurcate at shallow levels (Pioli et al., 2008) due to interactions of the feeding dike system with structures such as lithological contacts and unconformities in addition to local stress conditions and sometimes blockages in the main conduit which cause the rising magma to rupture the conduit walls (e.g., Kervyn et al., 2009). After the 2002 explosive event, layers of lava and tephra filled the crater and eventually reconstructed the cone until 2018 (Figure 10). We suggested that a bifurcation of the conduit occurred at a level at or above the 2002 crater’s structural boundary due to heterogeneities between depositional units, e.g., the tephra cone and lava dome. The segregation of eruptive activity seen at the two vents suggests that the south vent has a more vertical conduit structure beneath giving magma a more direct route to the surface and preferential segregation of volatiles vertically, resulting in more explosive activity (cf. Pioli et al., 2008; Waythomas, 2021). The conduit architecture below the north vent, however, is likely more horizontal, facilitating slower magma ascent and gas loss, resulting in predominantly effusive behavior. This is not the first time that lateral vents have opened on the cone since 2002; a lateral vent also opened 2 days after the 2002 explosive event (Event A) (Figure 9). Although less common, a T-junction conduit/vent configuration and simultaneous effusive and explosive activity is seen repeatedly at Mount Veniaminof, United States (Waythomas, 2021), and has also been previously noted at Parícutin, Mexico (Pioli et al., 2008). Interestingly, at Mount Veniaminof, the T-junction conduit configuration actually resulted in more explosive behavior and higher ash column heights than when a single vertical conduit was present due to volatile segregation in the vertical part of the conduit (Waythomas, 2021). The more regular, persistent daily explosive activity at El Reventador after 2014 is potentially explained by this model of volatile segregation creating more gas-rich pockets of magma ascending to the SV.
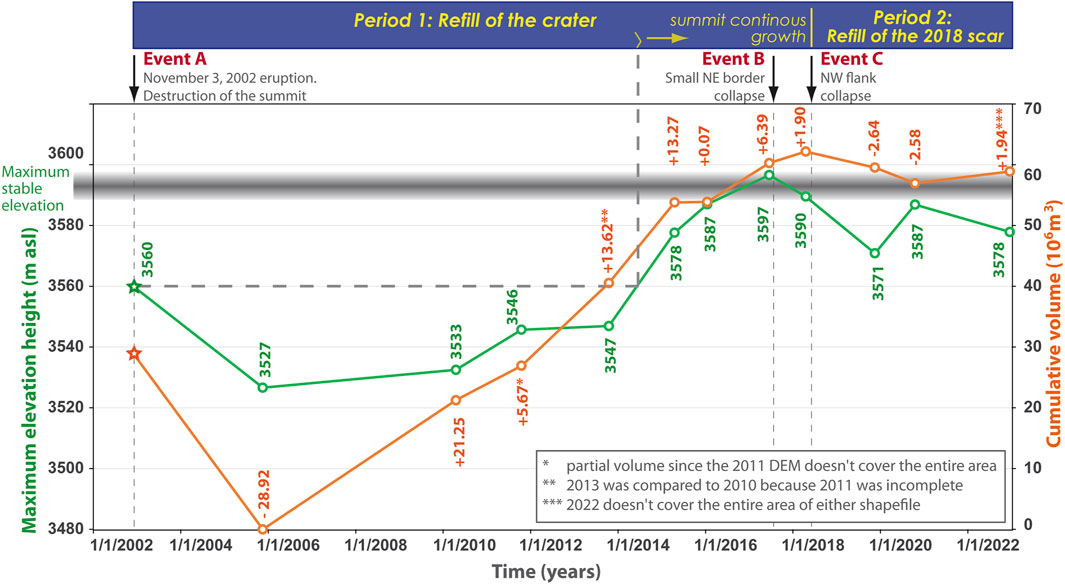
FIGURE 10. Summary of maximum summit height (green star: summit elevation pre-2002 eruption, green dots: summit elevation between 2005 and 2022) in meters above sea level and cumulative volume in 106 m3 (orange star: evacuated volume estimated in 2005, orange dots: volume estimation in comparison to the previous DEM until 2022). It is shown at the top of the two main periods of reconstruction of the volcano, Periods 1 and 2; the three destructive events, A-C with black arrows. The gray area corresponds to the elevation at which the volcano is still stable.
The growth and construction process of stratovolcanoes, particularly those built rapidly, have created inherent instabilities within the edifice (Zernack and Procter, 2021). Rapid construction, continued activity, and development of new branches of the conduit-feeding system at El Reventador have resulted in one small-scale (Event B) and one large-scale (Event C) collapse of the active cone. Following both destructive collapse events, lava was extruded from the base of the collapsed structure. We, therefore, suggested that the formation of a new branch in the conduit system, as occurred in 2002, 2017, and 2018, was the result of an intrusion of magma through a shallow plane of weakness in the cone that destabilized the upper part of the edifice causing a collapse event. In 2002, the intrusion occurred low on the flank and was followed by the paroxysmal explosion and large-scale excavation of the volcano’s summit. In addition, the maximum elevations of the cone before Events B and C were 3,597 and 3,590 m asl, respectively; these elevations corresponded to the greatest height the volcano reached since 2002. Therefore, we inferred that the volcano has a maximum stable summit elevation of 3,600 ± 10 m. We suggested that this cone height corresponded to a lithostatic load threshold, above which underlying magma could no longer ascend vertically, causing either accumulation of overpressure that led to explosive eruption or lateral lava intrusion that could destabilize the edifice and lead to collapse.
However, in the case of Event C, we suggested that an intrusion/new conduit branch occurred in a mid-level zone on the cone destabilizing the flank and resulting in a large collapse and a breached crater at the summit (Figure 9). Magma transport along the new branch to the base of the collapse was short-lived and occurred simultaneously with activity in both summit vents (NV and SV). The reconstruction of the cone was much quicker after this event, only taking around 1 year to fill in the collapse crater through combined explosive and effusive activity (Period 2).
For both Events A (2002) and C (2018), the overall elevation of the cone was reduced, and the volcano lost volume was determined by differencing DEMs (Figure 10). On the other hand, following Event B, elevation was reduced while volume was added through continued eruptive activity. The only available DEM near the time of Event B was created from images taken 9 months after the event, which shows a reduction in summit elevation but a total volume increase as material was deposited in a large area over the summit. After 2020, elevation decreased as well, which could be related to the intense explosive activity that took place in mid-2021, affecting the summit of the volcano; unfortunately, there are no DEM data related to those dates.
Finally, because of the continuous destruction events and reconstruction processes of the summit between 2002 and 2022, the initial spatial distribution of lava flow units and PDCs was changed during the period of study based on the changes over the summit. Arnold et al. (2019) determined these preferential directions for Phases A, B, C, and part of E. For this study, we determined that these directions were also to the NE and NW and controlled by the direction of the crater opening, which was excavated to the northwest in the 2018 flank collapse and did not refill for another year. Additionally, the typical direction for lava flows to the north, northeast, and southeast was only reestablished once the 2002 crater had been refilled.
5.2 Forecasting a long-lived active volcano
Forecasting shifts in activity at long-active, open-vent volcanoes such as El Reventador remains extremely difficult as precursory signals are often enigmatic and can be lost in and amongst the daily activity signals (e.g., Cameron et al., 2018; Kilburn and Bell, 2022; Acocella et al., 2023). As there is an open system and magma can freely ascend, many of the traditional precursory signals are not applicable. In addition, the greatest hazards are usually associated with large explosive activity and large destructive events through, for example, the generation of PDCs while effusive activity is often not hazardous away from the immediate slopes of the volcano. However, as evidenced at El Reventador, both explosive and effusive activities have been linked to both destructive and constructive events. Edifice instability and destructive collapse events extend the hazards associated with the volcano far beyond its flanks. As explosive activity has resulted in non-destructive benign events, it makes it difficult to forecast how dangerous certain types of activity will be. Alternatively, effusive activity or rather the intrusion of new magma into the edifice to form new pathways to the surface through zones of weakness can lead to significant instability and potentially dangerous collapse, as has also been observed at Etna (Andronico et al., 2018). In addition, as of the time of writing, the active cone has rebuilt itself to pre-2002 levels (3,578 m) such that any new material deposited at the summit is unsupported, and collapse of material from the summit and instabilities in the edifice is therefore more likely.
After 20 years of continuous and varied activity at El Reventador volcano, we have learned much about the different eruptive phenomena that have caused both constructive and destructive processes. Given the volcano’s long-lived eruption, with much variability in eruptive style and phenomena, we must reconsider the evaluation of the volcano’s threat. During the initial eruption of 3 November 2002, a VEI 4 event produced pyroclastic flows that reached the Coca River, 8 km downstream from the crater, affecting areas that were not inhabited at that time, but are now. Additionally, this eruption affected existing oil pipelines and communication routes. The large emissions of ash from that eruption directed by the winds, mainly to the west, affected a good part of the Inter-Andean Valley, causing effects even to the city of Quito and other inhabited areas. Given the large amount of pyroclastic material left by the eruption and the frequent and abundant rains that followed, a few weeks later, large debris flows (secondary lahars) began to occur, descending the Marker and El Reventador riverbeds, which drained the interior of the amphitheater and caused significant effects on oil pipelines and roads. Mudflows continue to this date (2023).
Following the large eruption of 2002, the subsequent eruptive phases for the next 20 years were characterized by the occurrence of individual events of VEI=1 to 2. With the explosive activity, PDCs occurred in large quantities, descending all flanks of the cone but always remained within the amphitheater, as did ballistics. The associated ash emissions were much smaller in size than those of 2002 and were mostly directed to the west and northwest. They had local effects but did not reach the Inter-Andean Valley; there were very sporadic reports of ash fall in El Chaco and Baeza, 33 km and 50 km from the crater, respectively. The effusive activity that occurred during the various phases of activity after 2002 resulted in the generation of dozens of lava flows, most of which descended along the southern, southeastern, western, northern, and northeastern flanks, remaining within the amphitheater without reaching >5 km in length and without causing any effects to the population or infrastructure. The large amount of pyroclastic material left inside the amphitheater by the eruption of 2002 in addition to the products of the subsequent activity of the last 20 years, with the persistent and intense rains that occur in the area, can trigger lahars that could affect oil pipelines and interrupt the main road, e.g., lahars occurred along the Reventador River in May 2003.
6 Conclusion
Based on the analysis of a large data set of thermal and visible images combined with DEMs and volcanic radiative power, we presented a detailed description of the eruptive activity of El Reventador volcano between 2002 and the present (November 2023) that varied between Vulcanian and Strombolian activity. This eruptive activity includes three destructive events (November 2002 June 2017, and April 2018) and two constructive periods (Refill of the crater: November 2002-early April 2018 and Refill of the scar: late April 2018-present). The three destructive events and constructive processes since 2002 caused important morphological changes in the crater. As a result, the configuration of the edifice has constantly changed through time. We proposed that the volcano has a maximum stable height of 3,600 ±10 m; however, future observations are required to confirm this idea. Additionally, the changing morphology of the crater influenced the spatial distribution of lava flows and PDCs over the flanks of the volcano. The three destructive events, A-C, were related to magmatic intrusions but only B and C were also influenced by the stability of the volcanic edifice which in both cases had a maximum elevation between 3,590 and 3,597 m.
Our examination of morphological and volume changes demonstrates the strengths of using often simple observational data and complementary methods for understanding eruptive dynamics, especially for long-lived eruptions where gaps in continuous ground-based data exist. Utilizing different 2D and 3D approaches helps to reduce measurement errors even if they have different systematic uncertainties during image acquisition and processing.
At present, after 20 years of eruption, we can evaluate the hazard of the volcano in an improved way, considering what happened during an event of VEI=4 and during the following 2 decades of minor events, from VEI=1 to 2. In this period, we have learned a lot about the hazards of the volcano; however, despite this increased understanding, the overall hazard has increased. In these 20 years, the population in the area near the volcano has increased significantly. Communication routes and oil pipelines were affected on some occasions by the volcano’s threat; however, new infrastructure works are being planned in the same areas affected by past volcanic activity, ultimately increasing vulnerability in the region. It is important to use what we have learned in these 20 years to help mitigate the impacts of future hazardous events at El Reventador.
Data availability statement
The raw data supporting the conclusion of this article will be made available by the authors, without undue reservation.
Author contributions
SV, PR, and AD developed the idea of the research; SV, PR, FN, and KK described the superficial activity; all authors contributed to and performed the fieldwork and data collection; AD created DEMs and orthomosaics; MA and AD estimated volume changes; MA generated the profiles; SV, AD, and MA worked on the results; SV, HG, PR, and AD worked on the data interpretation and discussion. SV, FN, and PR worked on the conclusion. All authors contributed to the article and approved the submitted version.
Funding
This work was carried out as a part of the project “Generación de Capacidades para la Emisión de Alertas Tempranas” funded by the Secretaría Nacional de Planificación y Desarrollo (SEMPLADES). VDAP receives funding from the USAID Bureau of Humanitarian Assistance and the USGS Volcano Hazards Program. Any use of trade, firm, or product names is for descriptive purposes only and does not imply endorsement by the U.S. Government.
Acknowledgments
We thank Dr. Pete Hall, founder of IG-EPN, who initiated research on the activity of El Reventador in the 1970s and for supporting our continued investigation of this volcano. We thank Pablo Samaniego for early discussions, Diego Coppola for allowing us to use the thermal warning data recorded by the MIROVA system during the last 20 years of activity, and Raphaël Paris from LMV who helped to generate the 2015 DEM. OCP (Oleoducto de Crudos Pesados) of Ecuador, through a Cooperation Agreement, provided logistical support to the researchers of the Geophysical Institute (IG-EPN) through helicopter overflights for thermal, gas, and visual monitoring of the volcano activity and for the maintenance of the field monitoring stations. We also thank all the staff of the Instituto Geofísico de la Escuela Politécnica Nacional (IG-EPN) and its authorities for their permanent support of the authors of this article. This research was carried out within the framework of the IG-EPN’s projects: SENACYT (National Secretariat of Science and Technology) and Generation of Capacities for the Issuance of Early Warnings of the IG-EPN, financed by the National Secretariat of Planning and Development (SENPLADES). HEG acknowledges support from her NERC IRF grant (ref: NE/W008033/1). We are thankful to Editor Heather Wright, as well as Sarah Ogburn and two reviewers who helped improve the quality of the paper.
Conflict of interest
The authors declare that the research was conducted in the absence of any commercial or financial relationships that could be construed as a potential conflict of interest.
Publisher’s note
All claims expressed in this article are solely those of the authors and do not necessarily represent those of their affiliated organizations, or those of the publisher, the editors and the reviewers. Any product that may be evaluated in this article, or claim that may be made by its manufacturer, is not guaranteed or endorsed by the publisher.
References
Acocella, V., Ripepe, M., Rivalta, E., Peltier, A., Galetto, F., and Joseph, E. (2023). Towards scientific forecasting of magmatic eruptions. Nat. Rev. Earth Environ. doi:10.1038/s43017-023-00492-z
Aguilera, E., Almeida, E., and Balseca, W. (1988). El Reventador: an active volcano in the sub-Andean zone of Ecuador. Rendiconti della Soc. Ital. Mineral. Petrol. 43, 853–875.
Alcalá-Reygosa, J., Palacios, D., and Zamorano Orozco, J. J. (2016). Geomorphology of the ampato volcanic complex (southern Peru). J. Maps 12 (5), 1160–1169. doi:10.1080/17445647.2016.1142479
Aldeghi, A., Carn, S., Escobar-Wolf, R., and Groppelli, G. (2019). Volcano monitoring from space using high-cadence planet CubeSat images applied to Fuego volcano, Guatemala. Remote Sens. 11 (18), 2151. doi:10.3390/rs11182151
Almeida, M., Gaunt, H. E., and Ramon, P. (2019). Ecuador’s El Reventador volcano continually remakes itself. EOS 100. doi:10.1029/2019EO117105
Andronico, D., Behncke, B., De Beni, E., Cristaldi, A., Scollo, S., Lopez, M., et al. (2018). Magma budget from lava and tephra volumes erupted during the 25-26 October 2013 lava fountain at Mt Etna. Front. Earth Sci. 6, 116. doi:10.3389/feart.2018.00116
Arnold, D. W. D., Biggs, J., Anderson, K., Vallejo Vargas, S., Wadge, G., Ebmeier, S. K., et al. (2017). Decaying lava extrusion rate at El Reventador volcano, Ecuador, measured using high-resolution satellite radar. J. Geophys. Res. Solid Earth 122 (12), 9966–9988. doi:10.1002/2017JB014580
Arnold, D. W. D., Biggs, J., Dietterich, H. R., Vallejo Vargas, S., Wadge, G., and Mothes, P. (2019). Lava flow morphology at an erupting andesitic stratovolcano: a satellite perspective on El Reventador, Ecuador. J. Volcanol. Geotherm. Res. 372, 34–47. doi:10.1016/j.jvolgeores.2019.01.009
Branca, S., Coltelli, M., and Groppelli, G. (2011). Geological evolution of a complex basaltic stratovolcano: Mount Etna, Italy. Italian J. Geosciences 130 (3), 306–317. doi:10.3301/ijg.2011.13
Cameron, C. E., Prejean, S. G., Coombs, M. L., Wallace, K. L., Power, J. A., and Roman, D. C. (2018). Alaska volcano observatory alert and forecasting timeliness. 1989-2017. Front. Earth Sci. 6, 86. doi:10.3389/feart.2018.00086
Coppola, D., Laiolo, M., Cigolini, C., Delle Donne, D., and Ripepe, M. (2016). Enhanced volcanic hot-spot detection using MODIS IR data: results from the MIROVA system. Geol. Soc. Lond. Spec. Publ. 426 (1), 181–205. doi:10.1144/sp426.5
Coppola, D., Laiolo, M., Cigolini, C., Massimetti, F., Delle Donne, D., Ripepe, M., et al. (2020). Thermal remote sensing for global volcano monitoring: experiences from the MIROVA system. Front. Earth Sci. 7, 362. doi:10.3389/feart.2019.00362
Cornejo, P. I. (2017). Analysis of the elastic energy released and characterization of the eruptive episodes intensity’s during 2014-2015 at El Reventador volcano, Ecuador. Int. J. Geol. Environ. Eng. 11 (9), 792–802.
Delpit, S., Le Pennec, J., Samaniego, P., Hidalgo, S., and Robin, C. (2008). Dynamics of the November 3, 2002 eruption of El Reventador volcano, Ecuador: insights from the morphology of ash particles. 7th Int. Symposium Andean Geodyn. 7, 180–183.
Diefenbach, A., Vallejo Vargas, S., Ramon, P., and Schilling, S. (2014). Modeling lava dome growth using visible and thermal imagery at Volcan El Reventador, Ecuador.
Diefenbach, A. K., Bull, K. F., Wessels, R. L., and McGimsey, R. G. (2013). Photogrammetric monitoring of lava dome growth during the 2009 eruption of Redoubt Volcano. J. Volcanol. Geotherm. Res. 259, 308–316. doi:10.1016/j.jvolgeores.2011.12.009
Dietterich, H. R., Diefenbach, A. K., Soule, S. A., Zoeller, M. H., Patrick, M. P., Major, J. J., et al. (2021). Lava effusion rate evolution and erupted volume during the 2018 Kīlauea lower East Rift Zone eruption. Bull. Volcanol. 83, 25–18. doi:10.1007/s00445-021-01443-6
Di Traglia, F., Pistolesi, M., Rosi, M., Bonadonna, C., Fusillo, R., and Roverato, M. (2013). Growth and erosion: the volcanic geology and morphological evolution of La Fossa (Island of Vulcano, Southern Italy) in the last 1000years. Geomorphology 194, 94–107. doi:10.1016/j.geomorph.2013.04.018
Gabrielli, S., Spagnolo, M., and De Siena, L. (2020). Geomorphology and surface geology of Mount St. Helens volcano. J. Maps 16 (2), 585–594. doi:10.1080/17445647.2020.1790048
Hall, M., Ramón, P., Mothes, P., LePennec, J. L., García, A., Samaniego, P., et al. (2004). Volcanic eruptions with little warning: the case of volcán Reventador’s surprise november 3, 2002 eruption, Ecuador. Rev. Geol. Chile 31 (2). doi:10.4067/S0716-02082004000200010
Hall, M. L., Ramon, P., and Yepes, H. (1980). The subaerial origin of Espanola (Hood) Island and the age of terrestrial life in the Galapagos. Not. Gal. 31, 21.
Hall, M. L., Samaniego, P., Le Pennec, J.-L., and Johnson, J. B. (2008). Ecuadorian Andes volcanism: a review of Late Pliocene to present activity. J. Volcanol. Geotherm. Res. 176 (1), 1–6. doi:10.1016/j.jvolgeores.2008.06.012
Johnson, J. B., Lees, J. M., and Yepes, H. (2006). Volcanic eruptions, lightning, and a waterfall: differentiating the menagerie of infrasound in the Ecuadorian jungle. Geophys. Res. Lett. 33 (6). doi:10.1029/2005GL025515
Kelfoun, K., Samaniego, P., Palacios, P., and Barba, D. (2009). Testing the suitability of frictional behaviour for pyroclastic flow simulation by comparison with a well-constrained eruption at Tungurahua volcano (Ecuador). Bull. Volcanol. 71, 1057–1075. doi:10.1007/s00445-009-0286-6
Kervyn, M., Ernst, G. G. J., van Wyk de Vries, B., Mathieu, L., and Jacobs, P. (2009). Volcano load control on dyke propagation and vent distribution: insights from analogue modeling. J. Geophys. Res. Solid Earth 114 (B3). doi:10.1029/2008jb005653
Kilburn, C. R. J., and Bell, A. F. (2022). Forecasting eruptions from long-quiescent volcanoes. Bull. Volcanol. 84, 25. doi:10.1007/s00445-022-01532-0
Kozono, T., Ueda, H., Ozawa, T., Koyaguchi, T., Fujita, E., Tomiya, A., et al. (2013). Magma discharge variations during the 2011 eruptions of Shinmoe-dake volcano, Japan, revealed by geodetic and satellite observations. Bull. Volcanol. 75, 695–713. doi:10.1007/s00445-013-0695-4
Lamb, O. D., Lamur, A., Díaz-Moreno, A., De Angelis, S., Hornby, A. J., Von Aulock, F. W., et al. (2019). Disruption of long-term effusive-explosive activity at Santiaguito, Guatemala. Front. Earth Sci. 6, 253. doi:10.3389/feart.2018.00253
Lees, J. M., Johnson, J. B., Ruiz, M., Troncoso, L., and Welsh, M. (2008). Reventador Volcano 2005: eruptive activity inferred from seismo-acoustic observation. J. Volcanol. Geotherm. Res. 176 (1), 179–190. doi:10.1016/j.jvolgeores.2007.10.006
Lube, G., Cronin, S. J., Thouret, J.-C., and Surono, S. (2011). Kinematic characteristics of pyroclastic density currents at Merapi and controls on their avulsion from natural and engineered channels. Bull. Geol. Soc. Am. 123 (5-6), 1127–1140. doi:10.1130/b30244.1
Mania, R., Walter, T. R., Belousova, M., Belousov, A., and Senyukov, S. L. (2019). Deformations and morphology changes associated with the 2016–2017 eruption sequence at Bezymianny Volcano, Kamchatka. Remote Sens. 11 (11), 1278. doi:10.3390/rs11111278
Mora, M. M., Lesage, P., Taylor-Castillo, W., Vergniolle, S., Fourel, L., and Soto, G. J. (2022). Evolution and dynamics of the open-vent eruption at Arenal volcano (Costa Rica, 1968–2010): what we learned and perspectives. Bull. Volcanol. 84 (7), 66. doi:10.1007/s00445-022-01570-8
Nakada, S., Zaennudin, A., Yoshimoto, M., Maeno, F., Suzuki, Y., Hokanishi, N., et al. (2019). Growth process of the lava dome/flow complex at Sinabung Volcano during 2013–2016. J. Volcanol. Geotherm. Res. 382, 120–136. doi:10.1016/j.jvolgeores.2017.06.012
Naranjo, M. F., Ebmeier, S. K., Vallejo, S., Ramón, P., Mothes, P., Biggs, J., et al. (2016). Mapping and measuring lava volumes from 2002 to 2009 at El Reventador Volcano, Ecuador, from field measurements and satellite remote sensing. J. Appl. Volcanol. 5, 8–11. doi:10.1186/s13617-016-0048-z
Naranjo, M. F., Gaunt, H. E., Vaca, S., Almeida, M., Espín Bedón, P., Ramon, P., et al. (2018). Temporal evolution and characterization of the June 2017 eruption of El Reventador volcano. Proceedings of the Abstract volume of the international meeting Cities on Volcanoes 10. Cities on Volcanoes August 2018, Naples, Italy.
C. G. Newhall, and R. S. Punongbayan (1996). “Fire and mud: eruptions and lahars of Mount Pinatubo, Philippines,” Quezon city: philippine Institute of Volcanology and seismology (Seattle: University of Washington Press), 1126.
Nguyen, C. T., Gonnermann, H. M., and Houghton, B. F. (2014). Explosive to effusive transition during the largest volcanic eruption of the 20th century (Novarupta 1912, Alaska). Geology 42 (8), 703–706. Article 8. doi:10.1130/g35593.1
Ortiz, H. D., Johnson, J. B., Anzieta, J. C., Matoza, R. S., Anderson, J., Vallejo Vargas, S., et al. (2019). Overview of reventador infrasound activity: from january 2015 to June 2019. San Francisco, CA: AGU Fall Meeting Abstracts, V44B–V06.
Over, J.-S. R., Ritchie, A. C., Kranenburg, C. J., Brown, J. A., Buscombe, D. D., Noble, T., et al. (2021). Processing coastal imagery with Agisoft Metashape Professional Edition, version 1.6—structure from motion workflow documentation. (No. 2021-1039). Asheville, NC: US Geological Survey.
Pallister, J. S., Diefenbach, A. K., Burton, W. C., Muñoz, J., Griswold, J. P., Lara, L. E., et al. (2013). The Chaitén rhyolite lava dome: eruption sequence, lava dome volumes, rapid effusion rates and source of the rhyolite magma. Andean Geol. 40, 277–294. doi:10.5027/andgeov40n2-a06
Pioli, L., Erlund, E., Johnson, E., Cashman, K., Wallace, P., Rosi, M., et al. (2008). Explosive dynamics of violent Strombolian eruptions: the eruption of Parícutin Volcano 1943–1952 (Mexico). Earth Planet. Sci. Lett. 271 (1-4), 359–368. doi:10.1016/j.epsl.2008.04.026
Ramón, P., Vallejo, S., Mothes, P., Andrade, D., Vásconez, F., Yepes, H., et al. (2021). Instituto geofísico–escuela Politécnica nacional, the Ecuadorian seismology and Volcanology service. Volcanica 4 (S1), 93–112. doi:10.30909/vol.04.s1.93112
Ridolfi, F., Puerini, M., Renzulli, A., Menna, M., and Toulkeridis, T. (2008). The magmatic feeding system of El Reventador volcano (Sub-Andean zone, Ecuador) constrained by texture, mineralogy and thermobarometry of the 2002 erupted products. J. Volcanol. Geotherm. Res. 176 (1), 94–106. doi:10.1016/j.jvolgeores.2008.03.003
Rose, W. I., Palma, J. L., Delgado Granados, H., and Varley, N. (2013). “Open-vent volcanism and related hazards: overview,” in Understanding open-vent volcanism and related hazards (Boulder, Colorado: Geological Society of America Special Paper), 498.
Samaniego, P., Eissen, J.-P., Le Pennec, J.-L., Robin, C., Hall, M. L., Mothes, P., et al. (2008). Pre-eruptive physical conditions of El Reventador volcano (Ecuador) inferred from the petrology of the 2002 and 2004–05 eruptions. J. Volcanol. Geotherm. Res. 176 (1), 82–93. doi:10.1016/j.jvolgeores.2008.03.004
Sato, H., and Taniguchi, H. (1997). Relationship between crater size and ejecta volume of recent magmatic and phreato-magmatic eruptions: implications for energy partitioning. Geophys. Res. Lett. 24 (3), 205–208. doi:10.1029/96gl04004
Shean, D. E., Alexandrov, O., Moratto, Z. M., Smith, B. E., Joughin, I. R., Porter, C., et al. (2016). An automated, open-source pipeline for mass production of digital elevation models (DEMs) from very-high-resolution commercial stereo satellite imagery. ISPRS J. Photogrammetry Remote Sens. 116, 101–117. doi:10.1016/j.isprsjprs.2016.03.012
Shevchenko, A. V., Dvigalo, V. N., Walter, T. R., Mania, R., Maccaferri, F., Svirid, I. Y., et al. (2020). The rebirth and evolution of Bezymianny volcano, Kamchatka after the 1956 sector collapse. Commun. Earth Environ. 1 (1), 15. doi:10.1038/s43247-020-00014-5
Simkin, T., and Siebert, L. (1994). Volcanoes of the world. Tucson: Geoscience Press for the Smithsonian Institution, 349.
Spampinato, L., Calvari, S., Oppenheimer, C., and Boschi, E. (2011). Volcano surveillance using infrared cameras. Earth-Science Rev. 106, 63–91. doi:10.1016/j.earscirev.2011.01.003
Stinton, A. J., Cole, P. D., Odbert, H. M., Christopher, T., Avard, G., and Bernstein, M. (2014). Chapter 6 dome growth and valley fill during phase 5 (8 october 2009–11 february 2010) at the Soufrière hills volcano, Montserrat. Geol. Soc. Lond. Memoirs 39 (1), 113–131. doi:10.1144/M39.6
Swanson, D., and Holcomb, R. (1990). Regularities in growth of the Mount St. Helens dacite dome, 1980–1986. IAVCEI Proc. Volcanol. 2, 3–24. doi:10.1007/978-3-642-74379-5_1
Tibaldi, A. (2005). Volcanism in compressional tectonic settings: is it possible? Geophys. Res. Lett. 32 (6). doi:10.1029/2004gl021798
Troncoso, L., and Jaya, D. (2003). Caracterización a través de imágenes satelitales de la erupción del volcán El Reventador, 03 de noviembre de 2003. Quintas Jornadas Ciencias Tierra, 106–108.
Vallejo, S., Hernandez, S., Battaglia, J., Ortiz, H. D., Ramon, P., Hidalgo, S., et al. (2019). Partial summit collapse at El Reventador volcano (Ecuador) and its subsequent activity observed in thermal imaging, seismo-acoustic signals and SO2 degasification. San Francisco, CA: AGU Fall Meeting Abstracts, V51K–V0258.
Vallejo, S., and Ramon, P. (2012). Growth and evolution of a scoria cone and dome inside the Reventador volcano crater. 2010-2011. Cities on volcanoes 7. Mexico: Colima.
Vallejo, S., Ramón, P., Hernandez, S., Pino, G., Almeida, M., Vásconez, F., et al. (2023). Pulsatile lava activity at El Reventador volcano, looking through groundbased infrared and optical cameras. Rotorua, New Zealand: IAVCEI Scientific Assembly, 1087.
Vallejo Vargas, S. X. (2017). Numerical models of volcanic flows for an estimation and delimitation of volcanic hazards, the case of Reventador volcano (Ecuador). Auvergne, France: Université Clermont Auvergne, 2017–2020.
Vásconez, F., Moussallam, Y., Bani, P., Battaglia, J., Hidalgo, S., Benbakkar, M., et al. (2022b). Ash and gas discharge during open vent activity at El Reventador (Ecuador): explosion-style transitions driven by conduit capping. Bull. Volcanol. 84 (8), 77. doi:10.1007/s00445-022-01585-1
Vásconez, F., Moussallam, Y., Harris, A. J., Latchimy, T., Kelfoun, K., Bontemps, M., et al. (2022a). VIGIA: a thermal and visible imagery system to track volcanic explosions. Remote Sens. 14 (14), 3355. doi:10.3390/rs14143355
Wadge, G. (2009). “Assessing the pyroclastic flow hazards from dome collapse at Soufriere Hills Volcano, Montserrat,” in Studies in Volcanology: the legacy of george walker, spec. Publ. IAVCEI. Editor T. Thordarson (London: Geol. Soc. of London), 211–224.
Walter, T. R., Legrand, D., Granados, H. D., Reyes, G., and Arámbula, R. (2013). Volcanic eruption monitoring by thermal image correlation: pixel offsets show episodic dome growth of the Colima volcano. J. Geophys. Res. Solid Earth 118 (4), 1408–1419. doi:10.1002/jgrb.50066
Waythomas, C. (2021). Simultaneous effusive and explosive cinder cone eruptions at Veniaminof Volcano, Alaska. Volcanica 4 (2), 295–307. doi:10.30909/vol.04.02.295307
Wright, R. (2016). MODVOLC: 14 years of autonomous observations of effusive volcanism from space. Geol. Soc. Lond. Spec. Publ. 426 (1), 23–53. doi:10.1144/sp426.12
Zernack, A. V., and Procter, J. N. (2021). “Cyclic growth and destruction of volcanoes,” in Volcanic debris avalanches: from collapse to hazard (Berlin, Germany: Springer), 311–355.
Appendix A
Appendix A: Acronyms list
Keywords: El Reventador, photogrammetry, thermal images, visual images, eruptive phases, morphology
Citation: Vallejo S, Diefenbach AK, Gaunt HE, Almeida M, Ramón P, Naranjo F and Kelfoun K (2024) Twenty years of explosive-effusive activity at El Reventador volcano (Ecuador) recorded in its geomorphology. Front. Earth Sci. 11:1202285. doi: 10.3389/feart.2023.1202285
Received: 07 April 2023; Accepted: 29 December 2023;
Published: 01 February 2024.
Edited by:
Heather Michelle Wright, United States Geological Survey (USGS), United StatesReviewed by:
Simona Gabrielli, National Institute of Geophysics and Volcanology (INGV), ItalyBoris Behncke, National Institute of Geophysics and Volcanology, Italy
Copyright © 2024 Vallejo, Diefenbach, Gaunt, Almeida, Ramón, Naranjo and Kelfoun. This is an open-access article distributed under the terms of the Creative Commons Attribution License (CC BY). The use, distribution or reproduction in other forums is permitted, provided the original author(s) and the copyright owner(s) are credited and that the original publication in this journal is cited, in accordance with accepted academic practice. No use, distribution or reproduction is permitted which does not comply with these terms.
*Correspondence: Silvia Vallejo, svallejo@igepn.edu.ec, vallejovargas.silvia@gmail.com