Mechanical behavior analysis and bearing capacity calculation of CFG pile composite foundation on coral sand site
 Xiaobin Li1,2
  Ruiyuan Zhang
- 1CCCC Second Harbor Engineering Co, Ltd., Wuhan, China
- 2First Engineering Co, Ltd. of CCCC Second Harbor Engineering Bureau, Wuhan, China
- 3Design Institute of the First Construction Engineering Co, Ltd. of China Construction Third Engineering Bureau, Wuhan, China
Coral sand foundation formed by hydraulic fill often faces the problem of poor bearing capacity. This paper proposed for the first time to apply CFG pile composite foundation to coral sand sites to verify the feasibility of this scheme and understand its mechanical characteristics. Firstly, taking on-site coral sand as the research object, a pile sand interface shear test was conducted to clarify the mechanism of pile side friction. At the same time, the ultimate bearing capacity of CFG pile and its composite foundation was measured through in-situ static load tests. Then, based on the strength parameters of the pile sand interface revealed by indoor tests, numerical simulations were conducted to analyze the bearing characteristics of CFG piles and their composite foundations. Finally, a method for calculating the vertical bearing capacity of rigid piles in composite foundation considering interface parameters was proposed. The results showed that the bearing capacity characteristic values of single pile and composite foundation meet the design requirements; The interface friction angle and cohesion together increased the ultimate side friction by 64.41%; The load is mainly borne by the pile tip resistance, and the increase of the interface friction angle will make the proportion of the side friction load first increase and then decrease more obviously; The pile soil stress ratio first increased and then tended to stabilize as the interface strength increased. Compared with the field static load test results, the rationality of the calculation method for composite foundation rigid piles was verified. This study may have reference significance for the design and construction of coral sand foundation treatment in offshore island and reef projects.
1 Introduction
Coral sand (Wang et al., 2020) is a kind of rock and soil mass formed by the remains of coral groups under geological action, it is characterized by irregular shape (Liu and Wang, 1998; Smith and Cheung, 2003), many pores (Chang-qi et al., 2016; Xu et al., 2022), easy cementation (Meng et al., 2014), easily broken (Hu, 2008; Donohue et al., 2009), and its engineering mechanical properties are quite different from those of ordinary continental sediments (JIANG et al., 2015; Wang et al., 2017). As the construction site gradually extends to the sea, more and more reclamation projects are being built. Due to the characteristics of high cohesion, large internal friction angle and high residual strength, coral sand has become a good blowing filler and is widely used in island and reef engineering (Wang et al., 2011; Wang et al., 2021); However, due to its engineering characteristics of high porosity, large compressibility, and easy crushing of particles (Coop, 1990; Ma et al., 2022), untreated coral sand foundation often has problems such as large uneven settlement and low foundation bearing capacity (Rittirong et al., 2008), which brings great threats to the engineering construction (Ohno et al., 1999). Therefore, proper foundation treatment measures are suggested be taken.
At present, driven piles and bored piles were mostly used in coral sand sites (Dean, 2009). In the earliest period, Angemeer et al. (1973) used the field static load test to study the bearing characteristics of the driven pile in the coral reef stratum, and it was found that the side friction resistance of the steel pile was very low; through the test of driving pile with openings, the ultimate side friction measured by Dutt and Cheng, (1984) was only 9.2 kPa at the lowest level; Datta et al. (1980) evaluated the bearing capacity of pile foundation in calcareous sand, and they found that the surface friction might be overestimated in the project because that the end bearing may not be fully utilized. During the piling process of the driven pile, the coral sand particles around the pile are damaged to a large extent, which will make the bearing capacity decrease, and even cause pile sliding (Poulos, 1988); Based on the deep mixing technology, Igoe et al., 2014; Spagnoli et al. (2015) proposed a new type of cast-in-place pile with steel casing inside, and systematically studied its bearing capacity. Although the cast-in-place pile can significantly increase the side friction resistance of the pile (Lee and Poulos, 1991) and has little impact on the shape of coral sand around the pile, it has the disadvantages offs high cost and long period. Compared with the construction scheme of above pile foundations, the CFG pile (i.e., pile constructed by granular materials of cement, fly-ash and gravel) composite foundation has many advantages such as small disturbance, small settlement, low cost, etc., but so far, its application in the coral reef site is rarely reported. The mechanism of the pile-soil interface is the key influencing factor for the bearing capacity of pile foundation and has been studied by scholars. By conducting the sand-steel interface shear test, Zhang et al. (2021) studied the shear behavior of this interface under different roughness and compactness. Similarly, Chen et al. (2022) studied the influence of roughness and relative density on the mechanical properties of the sand-concrete pile interface through the interface shear test. Uesugi et al. (1990) found that the maximum friction coefficient of the sand-concrete interface is closely related to the interface roughness and the average diameter of sand. Based on the sand-steel interface shear test, Kou et al. (2021) studied the interaction mechanism between coral sand and steel pipe pile interface under the geological conditions of coral reef. Wang et al. (2022) analyzed the macroscopic shear characteristics and particle crushing characteristics. For the interface of the concrete pile, Li et al. (2022) carried out large-scale direct shear tests to study the shear failure characteristics of coral reef limestone-concrete interface. Aiming to study the bearing capacity of pre-drilled rock-socketed concrete piles on the coral reef debris layer, Liu et al. (2021) conducted the direct shear test on the pile-coral reef debris interface under the condition of constant normal stiffness and analyzed the friction mechanism and shear expansion characteristics of the pile-rock interface. To sum up, the mechanical properties of the interface between continental ordinary sand and steel pipe piles or concrete piles. For the coral reef stratum, some scholars carried out research on the impact mechanism of steel pipe piles on coral sand, except for the action mechanism of concrete piles, while only reef limestone and its clastic layer were involved, and fully classified coral sand (gravel sand, coarse sand, medium sand, fine sand, and silt) was not taken into account.
This article based on a high-rise residential project, which was designed on a hydraulic fill coral sand site in Hulumale Island, Maldives. Based on the special engineering properties of coral sand, the shear characteristics of the interface between the fully classified coral sand and the CFG pile were revealed through the indoor shear test, and a large number of on-site static load tests were conducted on the single pile and composite foundation to evaluate the application effect of this composite foundation. The influence of the interface strength parameters (cohesion and friction angle) on the bearing characteristics of the CFG pile composite foundation was clarified through numerical simulation. Furthermore, it also proposed a calculation method for the bearing capacity of rigid piles in the composite foundation considering the interface strength.
2 Project overview
This high-rise residential project in Hulumale Island, Maldives, is designed in the land area formed by coral sand reclamation and is the largest residential building in this area. This site is mainly distributed by coral sand from top to bottom, and the pile end has quasi-reef limestone. The specific geological overview is introduced in Table 1. In this project, the CFG pile was used for foundation treatment; The pile diameter is 0.4 m, the pile spacing is 1.3 m, and the pile body is made of C30 concrete. These piles were arranged rectangular and drilled using the long spiral, as shown in Figure 1. The pile end entered into the bearing layer of the quasi-reef limestone for 50 cm, the design bearing capacity of the single pile and the composite foundation is 420 kN and 370 kPa, respectively.
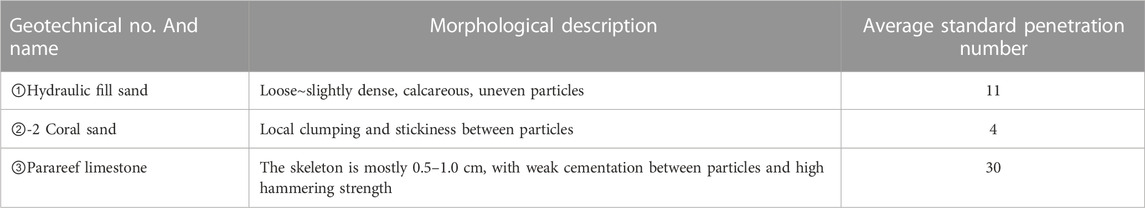
TABLE 1. Geological overview.

FIGURE 1. Construction of CFG pile.
3 Bearing characteristic test
3.1 Indoor direct shear test on interface
After sampling and analyzing the coral sand at the project site for several times, the grain size distribution of the reclaimed coral sand is found to be wide, which can be divided into coral gravel sand, coral coarse sand, coral medium sand, coral fine sand and coral silty sand according to Code for Geotechnical Investigation of Water Transport Engineering (Partial Revision)—Geotechnical Investigation of Coral Reef (General Revision) in Table 2. The strength parameters of the interface bewteen different graded coral sand and piles will directly affect the side friction resistance of CFG piles, and furtherly affect the bearing characteristics of CFG pile composite foundation.
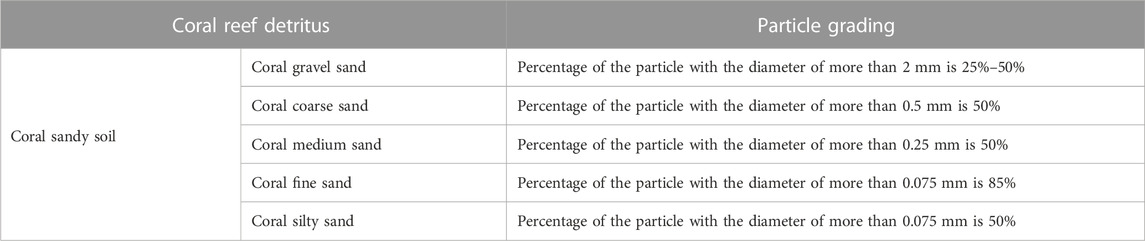
TABLE 2. Classification of coral sand.
3.1.1 Experiment scheme
In this paper, five kinds of coral sand were taken as the research object to carry out the indoor interface shear test, so as to clarify the shear strength parameters of the interface between coral sand and concrete pile. The particle analysis test results of typical samples are shown in Figure 2.
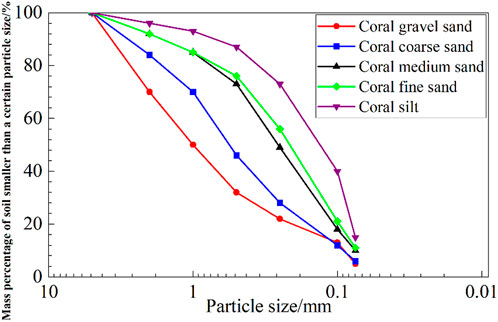
FIGURE 2. Particle grading curve of sample.
According to the particle grading curve in Figure 2, parameters of the restricted particle size d60, medium particle size d30, average particle size d50, effective particle size d10, nonuniformity coefficient Cu and curvature coefficient Cc were all calculated and shown in Table 3.
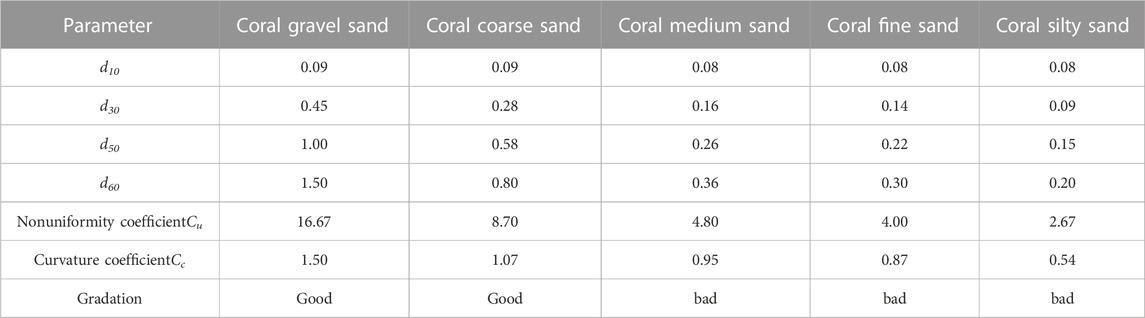
TABLE 3. Grading parameters of coral sand.
Due to the large and uneven particle size of coral sand, a large special direct shear instrument for coral sand was invented, as shown in Figure 3. The cutting box size is 15 × 15 × 15 cm, and the measurement range is 0–50 kN with an accuracy of 0.01 kN while using this special direct shear equipment to carry out mechanical test of pile-sand interface, the sample was processed into the size of 15 cm × 15 cm, and the density is 1.65 g/cm ³. Besides, the normal stress of the test was set as 25, 50, 100, 200, 400 and 800 kPa, and the shear rate was 1 mm/min.
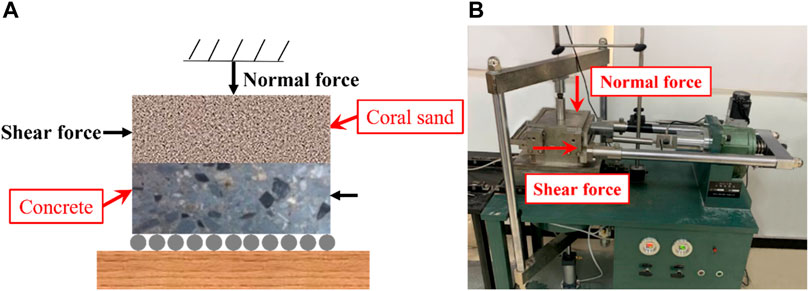
FIGURE 3. Large-scale direct shear test of Pile-coral sand interface (A) Schematic diagram of the large-scale direct shear test; (B) The equipment large direct shear test.
The specific test steps are as follows.
(1) Prefabricated the size to 15× 15 × 7.5 cm concrete block was placed inside the sample box, with the top surface of the concrete block located exactly at the shear plane position;
(2) According to the experimental design density (1.65 g/cm³) and volume (15 × 15 × 7.5 cm) weighed a certain mass of coral sand sample;
(3) Divided the weighed coral sand sample into three parts and placed it in the upper half of the sample box. Vibrated according to the height of the layers, so that the coral sand sample just filled the upper half of the sample box;
(4) Started the instrument and applied normal stress through the cylinder;
(5) Started the lateral pushing device, so that the lower part of the shear box began to shear and move, from which the interface shear strength between the concrete block and the coral sand sample can be obtained.
3.1.2 Experiment results
Figure 4–Figure 8 shows the interface shear curves and the change rule of strength with normal stress. From Figure 4A–Figure 8A, it can be seen that with the increase of shear strain, the shear stress on the coral sand-concrete interface first increased and then basically remained unchanged; this characteristic is similar to the ideal elastoplastic model. Moreover, the interface strength of coral sand-concrete increased with the side pressure. Draw the curve of normal stress and shear strength, Figure 4B–Figure 8B shows the slope of the curves between the interface strength and the normal stress was different under different normal stress, that is, these curves were broken lines, and the inflection point was about 100 kPa. After fitting the collected data, the friction angle and cohesion of the coral sand-concrete interface under different normal stresses are shown in Table 4. It can be seen that the variation of shear stress on the coral sand-concrete interface with the normal stress showed a broken line, with an inflection point of about 100 kPa. When the normal stress was less than 100 kPa, the interface cohesion was between 13.1 and 23.4 kPa, and the friction angle was between 17.2 and 27.7. When the normal stress was greater than 100 kPa, the interface cohesion was close to 0, and the friction angle was between 28.4 and 34.1.
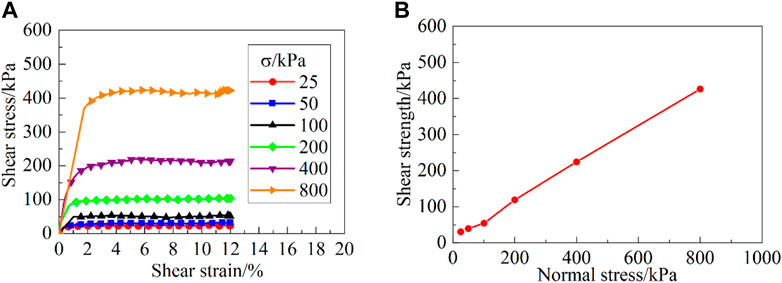
FIGURE 4. Coral gravel sand. (A) Relation curve between shear strain and shear stress; (B) Strength curve.
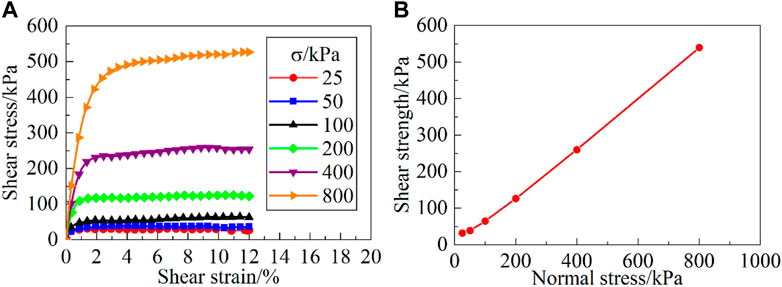
FIGURE 5. Coral coarse sand. (A) Relation curve between shear strain and shear stress; (B) Strength curve.
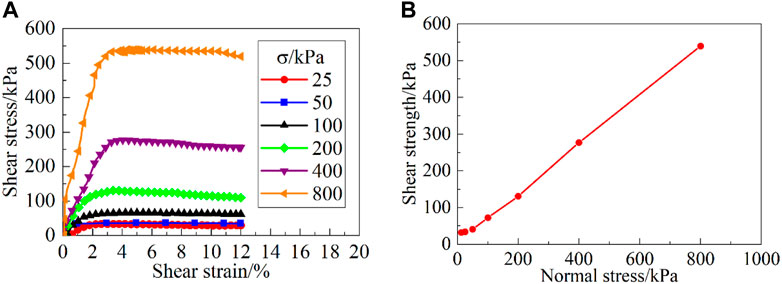
FIGURE 6. Coral medium sand. (A) Relation curve between shear strain and shear stress; (B) Strength curve.
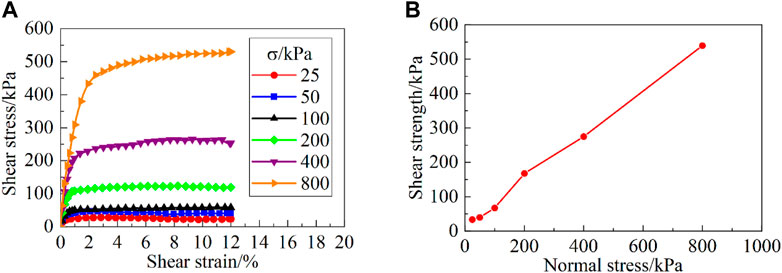
FIGURE 7. Coral fine sand. (A) Relation curve between shear strain and shear stress; (B) Strength curve.
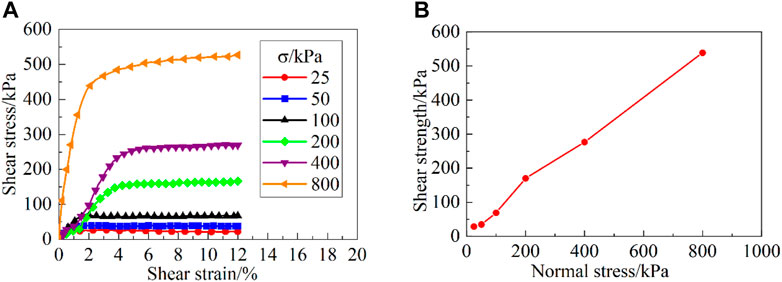
FIGURE 8. Coral silty sand. (A) Relation curve between shear strain and shear stress; (B) Strength curve.
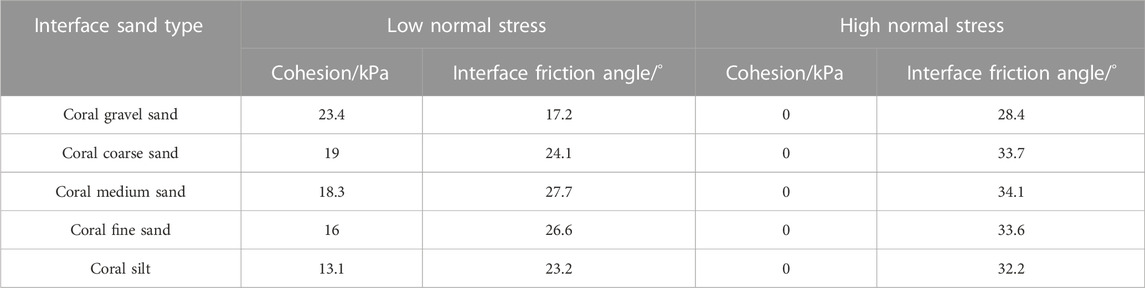
TABLE 4. Statistical table of interface mechanical parameters.
By summarizing the results of the coral sand concrete interface shear test, it can be found that due to the natural multiple edges and irregular shapes of coral sand, these irregular shapes have significant impact on the interface strength when it shears with concrete. Especially under low normal stress, irregularly shaped coral sand will generate significant biting force at the interface and inside the sand, The reason is that the edges and corners between particles are embedded and occluded with each other, forming a strong whole, exhibiting greater biting force than conventional terrestrial sand. At this time, coral sand cannot be simply treated as conventional sand; At the same time, due to the fragility of coral sand, under high normal stress, the irregular edges and corners of coral sand will be broken to varying degrees, and the particle roundness will continue to increase. The embedding and interlocking effect between particles will gradually weaken, and the interfacial interlocking force displayed will continue to decrease, approaching 0. At this time, the cohesive force between coral sand particles is becoming closer to conventional terrestrial sand. During the process of normal stress variation, coral sand itself undergoes a dynamic change process, resulting in a large range of fluctuations in interface bite force. Coral sand and concrete also exhibit different interface strengths, which in turn affect the lateral friction resistance of the pile foundation and have different effects on the bearing characteristics of the pile foundation.
3.2 Site static load test
3.2.1 Static load test results of single pile
A total of 48 single pile static load tests were conducted on site, and the static load test results of two test piles were used as examples to illustrate. The test pile is 14 m long and 0.4 m in diameter. During the static load test of single pile, a ceratin low speed was kept to sustain the load. The maximum stacking load is 1000 kN and is divided into 8 levels, the loading amount of each level is set as 1/10 of the estimated limit load. The 1st level load is applied by 2 times the graded loading amount, and the field loading is shown in Figure 9. As Q-S curves of a single pile shown in Figure 10, after applying the first eight levels of loading, the settlement was observed to be relatively stable. When the load was increased to the 9th level of 1000 kN, there was a significant steep drop in the pile top, indicating that the pile has been damaged; thus, the ultimate bearing capacity of a single pile was taken as 900 kN, and its characteristic value of the vertical bearing capacity was taken as 450 kN, which meets the design and specification requirements.
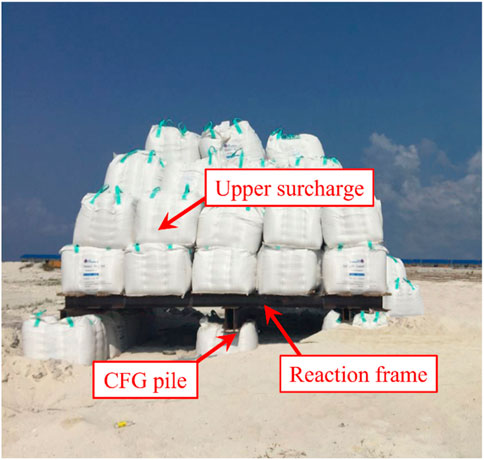
FIGURE 9. Static load test.
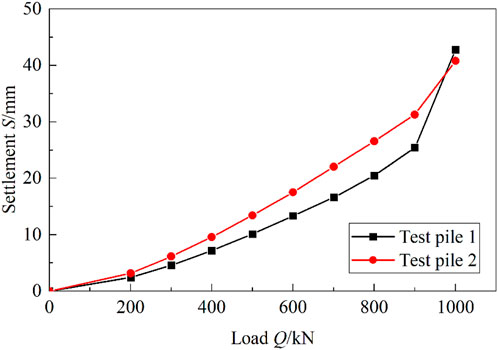
FIGURE 10. Q-S curve of single pile.
3.2.2 Static load test of composite foundation
A total of 48 single pile composite foundation static load tests were conducted on site, and the results of the composite foundation static load tests on two test piles were used as an example to illustrate. The length, diameter and spacing of the test pile is 14 m, 0.4 m, and 1.3 m, respectively; the size of the pressing plate is 1.30 m × 1.30 m. During the test, a ceratin low speed was kept to sustain the load, the maximum load on the pile was set as the ultimate bearable load, which was divided into 9 levels, the loading amount of each level was set as 1/10 of the estimated limit load, and the 1st level of loading took 1/5 of the maximum load. Figure 11 shows the Q-S curve of the composite foundation. It can be seen that the increasing rate of settlement obviously became larger after the last level of the load was applied. According to the key points of the composite foundation static load test, the limit load was taken as 740 kPa, and the characteristic value of the composite foundation bearing capacity was taken as 370 kPa to meet the requirements.
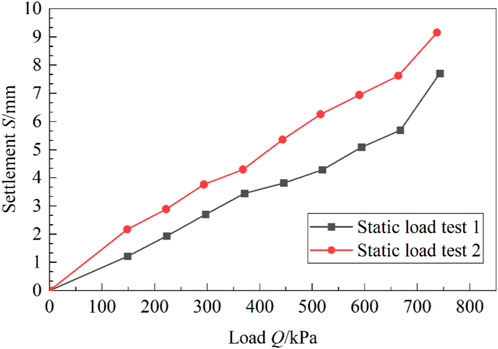
FIGURE 11. Q-S curve of composite foundation.
4 Numerical simulation research
4.1 The establishment of numerical model
The numerical model was established with PLAXIS 3D software, as shown in Figure 12. The pile length was 14 m and the pile diameter was 0.4 m. The side dimension of soil was set as 60 times the pile diameter, and the verticle dimension was set as 2 times the pile length. The horizontal displacement of soil around the pile was fixed, and the bottom was fixed. In this model, 29451 elements were generated and with 45406 nodes in total. The solid element was adopted for CFG pile, and the linear elastic model was selected; Based on the Mohr Coulomb criterion, a hardening soil constitutive model considering small strain stiffness was adopted for the soil layer. The contact interface between piles and soil was set to simulate the real contact between piles and soil, and this interface was regarded as an independent material, and its material parameters were input separately. The specific operation method is to set up a layer of interface unit between the pile and sand when establishing the model. The interface unit does not have actual thickness, and the material properties of the interface unit were customized. By inputting the designed cohesion and internal friction angle values in the material properties, accurate simulation of different interface strengths can be achieved, simulating the interface interaction between the pile and sand, Further results can be obtained on the impact of different interface strengths on the bearing characteristics of pile foundations. The mechanical parameters of all these materials are shown in Table 5.
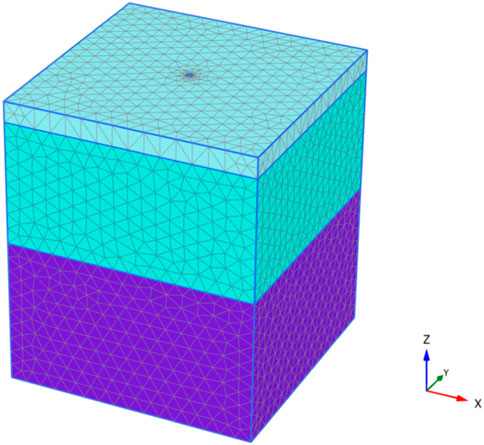
FIGURE 12. Numerical grid model.
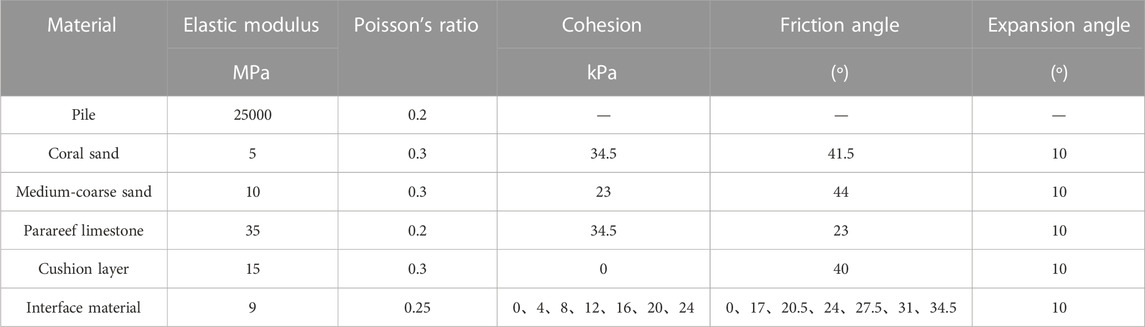
TABLE 5. Mechanical parameters of pile and soil.
4.2 Model validation and analysis
To verify the rationality of the numerical model, the load-displacement curves obtained from numerical simulation and bearing capacity tests of single pile and composite foundation on site were compared, as shown in Figures 13, 14. From Figure 13, it can be seen that in the initial stage of loading, the trend of the two load displacement curves was consistent, and the displacement increased linearly with the load. The slope of the load displacement curve obtained from numerical simulation was larger, and the displacement is greater under the action of primary load; After the primary load, there was a significant change in the slope of both curves, and the on-site measured curves performed more significantly; When the load reached its ultimate bearing capacity, the slope of the curve increased, and then the two showed an approximate linear relationship. The on-site measured load displacement curve showed a sharp drop, indicating that the pile had undergone certain damage and reached its ultimate bearing capacity. However, the slope change of the load displacement curve obtained from numerical simulation was not significant. In the primary and ultimate load stages, there was a deviation between the two curves, especially in the ultimate load stage, where there was a certain deviation in the ultimate bearing capacity obtained by the two curves. However, overall, the calculated values of the two curves were in good agreement with the measured values, verifying the rationality of the numerical simulation.
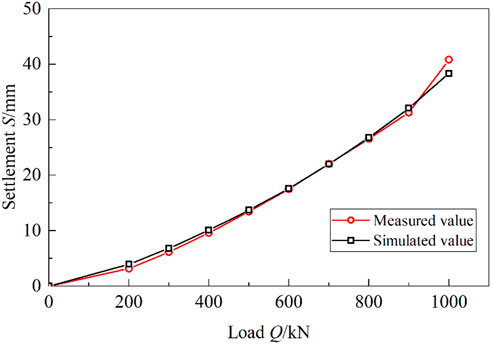
FIGURE 13. Comparison of Q-S curves of single pile.
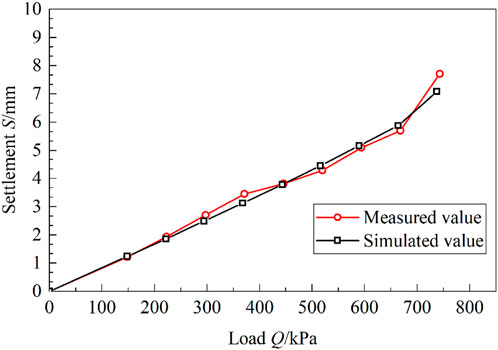
FIGURE 14. Q-S curve comparison of composite foundation.
From Figure 14, it can be seen that in the initial stage of loading, the displacement in the two curves increased linearly with the load. After loading to the primary load, the on-site measured load displacement curve showed different amplitude fluctuations, leading to a certain deviation in the two curves. When the load reached the ultimate bearing capacity, the slope of the curve increases, and then the two showed an approximate linear relationship. The slope of the on-site measured load displacement curve showed a significant change, indicating a certain degree of damage within the composite foundation and reaching the ultimate bearing capacity. However, the slope change of the load displacement curve obtained from numerical simulation was relatively small, and there was a certain deviation in the ultimate bearing capacity values obtained from the two curves. However, overall, the calculated values were in good agreement with the measured values, verifying the rationality of the numerical simulation.
4.3 Influence of interface strength parameters on bearing capacity of composite foundation
The strength parameters of the pile-sand interface have a direct impact on the pile side friction, which furtherly affects the bearing capacity of the pile foundation. Therefore, in this research, the interface strength parameters obtained from the indoor shear test were input in the software as interface parameters to study the impact of different interface strength parameters on the vertical bearing capacity of the pile foundation.
4.3.1 Influence of interface strength parameters on ultimate side friction
The influence of interface strength parameters on the ultimate side friction is shown in Figure 15. It can be seen from Figure 15A that with the increase of interface friction angle, the ultimate side friction increased continuously, and when the interface friction angle was 0, 17, 20.5, 24, 27.5, 31 and 34.5, the corresponding limit side friction was 12, 13.48, 14.71, 15.09, 15.53, 15.99 and 16.31 kPa respectively; it was noticed that when the friction angle was 34.5, the limit side friction resistance increased by 35.92%. It can be seen from Figure 15B that the increase in cohesion led to an increase of ultimate side friction. When the interface cohesion was 0, 4, 8, 12, 16, 20 and 24 kPa, the corresponding limit side friction was 11.76, 12.53, 13.29, 13.77, 14.68, 14.82 and 15.11 kPa respectively. When the cohesion was 24 kPa, the limit side friction increased by 28.49%. The interface friction angle and cohesion together increased the ultimate side friction by 64.41%, indicating that the interface strength parameters are key factors affecting the ultimate side friction, and also indicating that the interface strength parameter is only one influencing factor.
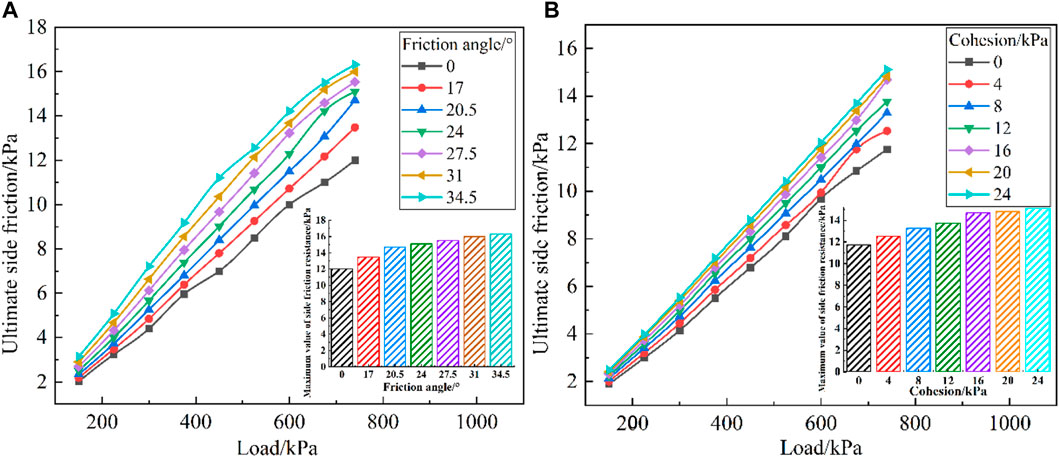
FIGURE 15. Influence of interface strength parameters on ultimate side friction under different loads (A) Influence of interface friction angle on ultimate side friction; (B) Influence of interface cohesion on ultimate side friction.
4.3.2 Influence of interface strength parameters on pile load sharing ratio
The ratio of pile side friction
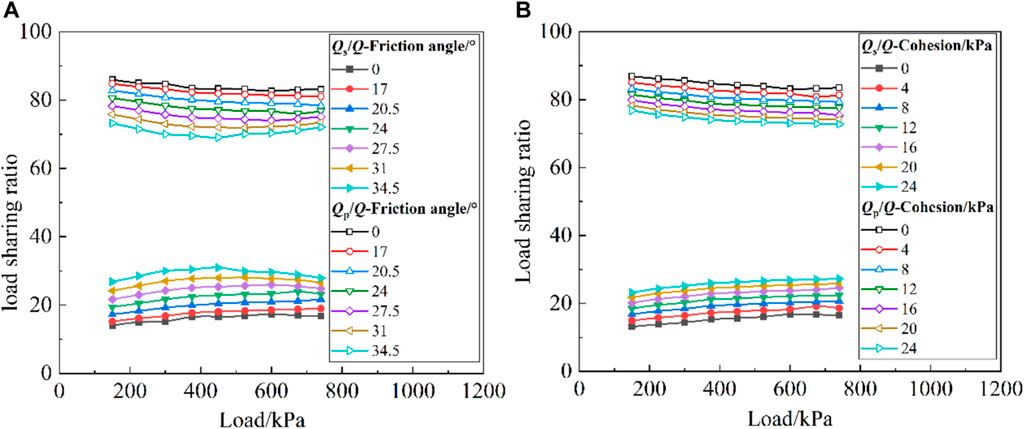
FIGURE 16. Influence of interface strength parameters on load sharing ratio of piles under different loads (A) Influence of interface friction angle on load sharing ratio; (B) Influence of interface cohesion on load sharing ratio.
4.3.3 Influence of interface strength parameters on pile-soil stress ratio
The influence of interface strength parameters on the pile-soil stress ratio is shown in Figure 17. It can be seen that with the increase of interface friction angle and cohesion, the pile-soil stress ratio gradually increased, but the increase ratio gradually slowed down to a stable value; this indicated that with the increase of the upper load, the load sustained by soil between piles gradually decreased, and the pile body sustained more load, reflecting the bearing characteristics of the rigid pile composite foundation.
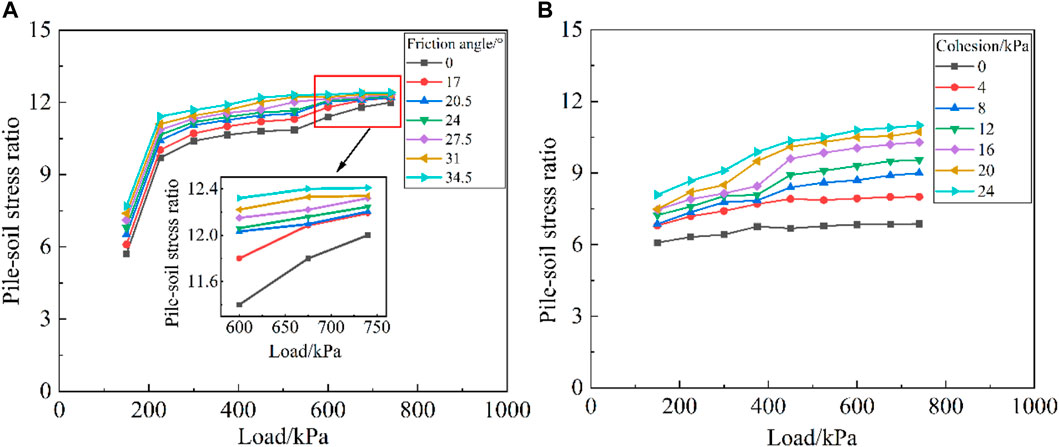
FIGURE 17. Influence of interface strength parameters on pile-soil stress ratio under different loads (A) Influence of interface friction angle on pile-soil stress ratio; (B) Influence of interface cohesion on pile-soil stress ratio.
5 Formula correction of the characteristic value of single pile bearing capacity
According to the Technical Code for Building Foundation Treatment, the characteristic value of the vertical bearing capacity of composite foundation reinforcement single pile can be estimated as follows; Based on the indoor test and the vertical compressive static load test of single pile, the calculation formula of the characteristic value of the vertical bearing capacity of composite foundation rigid single pile is proposed:
Where the pile end bearing capacity is determined by the uniaxial compressive strength
The characteristic value of pile side friction is related to the horizontal effective stress and interface strength parameters, which can be calculated according to the following formula:
Where
5.1 The determination of parameter value
Based on the field static load test of the single pile, the ultimate bearing capacity of each pile was obtained, and its half value was taken as the characteristic value of the vertical bearing capacity of a single pile. Assuming the stratum only distributes medium-coarse sand,
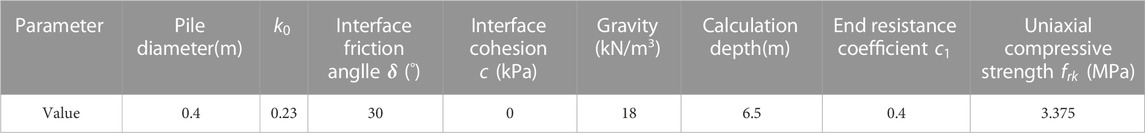
TABLE 6. The determination of parameter value.
5.2 Comparison of characteristic values of pile end resistance
After substituting all characteristic values of the bearing capacity of single pile obtained from the field static load test into Formula (2), the characteristic values of pile end resistance are shown in Figure 18.

FIGURE 18. The characteristic value of pile end resistance in the static load test.
By comparing the characteristic value of pile end resistance obtained from the field static load test of the single pile with that from the modified formula
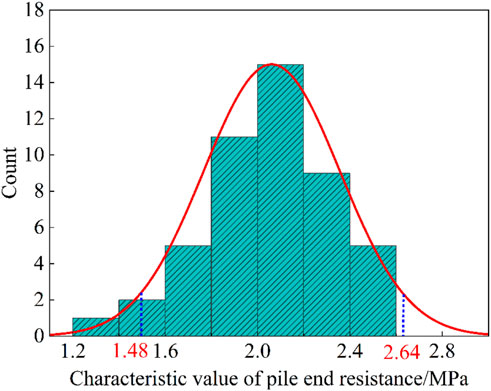
FIGURE 19. Characteristic value interval of pile end resistance with 95% confidence interval.
6 Discussion
Currently, there are few engineering reports on the application of CFG pile composite foundation to coral sand foundation. In this study, it was found that the maximum cohesive force at the pile coral sand interface is 23.4 kPa, which is consistent with the research conclusion that the coral sand bite force is relatively large (Feng et al., 2020; Liu and Li, 2022). At the same time, this study showed that the pile end resistance in coral sand foundation plays a major role in the bearing capacity of CFG piles, with the load sharing of pile side frictional resistance accounting for about 20%, while the remaining 80% of the load is borne by the pile end resistance. The variation law of pile soil stress ratio is basically consistent with that of pile soil stress ratio in general terrestrial strata (Chen et al., 2008; Liu et al., 2023). The difference is that the pile in coral sand foundation always bears a large load, which is due to the relatively poor bearing capacity of coral sand formation formed by hydraulic fill, and the pile end bearing layer is quasi reef limestone, with a large characteristic value of pile end resistance (Zhang et al., 2022). This provides an important reference for the design of similar projects in coral sand foundation. The first point is to pay attention to the design of the vertical bearing capacity of the pile itself, and the pile always bear the main load; The second point is that the design of pile length in composite foundation should be embedded in rock, and the design of pile end resistance should be strengthened (Li et al., 2023). The limitations of the research work in the article are explained as follows: The contact interface between CFG piles and coral sand during on-site construction is rough and complex, and the shear test of coral sand concrete interface failed to consider the influence of interface roughness. The grading range of coral sand listed in the article is limited, and in-depth research is needed on the interfacial shear characteristics of other graded coral sand. Because coral sand is brittle and anisotropic, the influence of these characteristics on the bearing characteristics of pile foundation has not been fully considered in the numerical simulation (Zhang et al., 2023).
7 Conclusion
In this paper, a series of studies have been carried out on the bearing characteristics of CFG pile composite foundation in the reclaimed coral sand site, and the following conclusions can be drawn.
(1) By conducting the shear test on the interface between the concrete pile and coral sand, it is shown that under the low normal stress, the corner bite effect of coral sand is obvious, while the corner is damaged and the bite effect becomes unobvious under the high normal stress. It is also revealed that when the normal stress of pile-sand is less than 100 kPa, the interface cohesion is between 13.1 and 23.4 kPa, and the interface friction angle is between 17.2 and 27.7; When the normal stress of pile-sand is greater than 100 kPa, the interface cohesion is close to 0, and the interface friction angle is between 28.4 and 34.1.
(2) Aiming to the reclamation coral sand site, the treatment method of CFG pile composite foundation was proposed for the first time. The results of the field static load test of single pile and composite foundation show that both the limit bearing capacity and settlement of the pile meet the specification and design requirements, which verifies the reliability and rationality of this foundation treatment. Furthermore, the practical engineerings show that the application of the CFG pile composite foundation in the hydraulic fill coral sand foundation is feasible.
(3) The numerical simulation results show that with the increase of interface strength parameters, the ultimate side friction resistance of the pile increases gradually. With the increase of the interface friction angle, the proportion of the side friction resistance increases first and then decreases more obviously. At the same time, the increase of the interface cohesion leads to a slight increase in the proportion of the side friction resistance of the pile, and the pile end resistance bears the most of load. With the increase of interface strength parameters, the pile-soil stress ratio gradually increases and tends to be stable, reflecting the bearing characteristics of rigid pile composite foundation.
(4) Based on the field load test results, the rationality of the calculation formula of the vertical bearing capacity of composite foundation reinforcement single pile considering the interface strength parameters is verified.
Suggestions for future research work are as follows.
(1) It is recommended to conduct coral sand concrete interface shear tests considering interface roughness to improve the accuracy of testing interface strength parameters;
(2) It is recommended to carry out on-site monitoring of CFG pile composite foundation in coral sand sites, monitor the stress characteristics of the pile foundation during the bearing process, and verify and revise the numerical simulation research results.
(3) Due to the high porosity of coral sand, it is recommended to conduct research on the post grouting technology of CFG piles to enhance the bearing capacity of pile foundations.
Data availability statement
The original contributions presented in the study are included in the article/supplementary material, further inquiries can be directed to the corresponding author.
Author contributions
Methodology, XL and RZ; validation, RZ; formal analysis, RZ and ZY; writing—original draft, RZ; writing—review and editing, RZ; supervision, ZY and PC; project administration, FJ and BW. All authors contributed to the article and approved the submitted version.
Conflict of interest
Authors XL, RZ, ZY, PC, and FJ were employed by CCCC Second Harbor Engineering Co., Ltd. XL was employed by First Engineering Co, Ltd. of CCCC Second Harbor Engineering Bureau. BW was employed by Design Institute of the First Construction Engineering Co, Ltd. of China Construction Third Engineering Bureau.
Publisher’s note
All claims expressed in this article are solely those of the authors and do not necessarily represent those of their affiliated organizations, or those of the publisher, the editors and the reviewers. Any product that may be evaluated in this article, or claim that may be made by its manufacturer, is not guaranteed or endorsed by the publisher.
References
Angemeer, J., Carlson, E. G., and Klick, J. H. (1973). Techniques and results of offshore pile load testing in calcareous soils. Proc. Offshore Technol. Conf. 1984, 1. doi:10.4043/1894-MS
Chang-qi, Z., Hai-feng, L., and Bin, Z. (2016). Micro-structures and the basic engineering properties of beach calcarenites in South China Sea. Ocean. Eng. 114, 224–235. doi:10.1016/j.oceaneng.2016.01.009
Chen, C., Yang, Q., Leng, W., Dong, J., Xu, F., Wei, L., et al. (2022). Experimental investigation of the mechanical properties of the sand–concrete pile interface considering roughness and relative density. Materials 15, 4480. doi:10.3390/ma15134480
Chen, Q.-n., Zhao, M.-h., Zhou, G.-h., and Zhang, Z.-h. (2008). Bearing capacity and mechanical behavior of CFG pile composite foundation. J. Central South Univ. Technol. 15, 45–49. doi:10.1007/s11771-008-0434-8
Coop, M. (1990). The mechanics of uncemented carbonate sands. Géotechnique 40, 607–626. doi:10.1680/geot.1990.40.4.607
Datta, M., Gulhati, S. K., and Rao, G. V. (1980). An appraisal of the existing practice of determining the axial load capacity of deep penetration piles in calcareous sands. Proc. Offshore Technol. Conf. 3836, 1. doi:10.4043/3867-MS
Donohue, S., O'sullivan, C., and Long, M. (2009). Particle breakage during cyclic triaxial loading of a carbonate sand. Géotechnique 59, 477–482. doi:10.1680/geot.2008.t.003
Dutt, R., and Cheng, A. (1984). Frictional response of piles in calcareous deposits. Proc. Offshore Technol. Conf. 4838, 1. doi:10.4043/4838-MS
Feng, Z.-k., Xu, W.-j., and Meng, Q.-s. (2020). Mechanical behaviors of interaction between coral sand and structure surface. J. Central South Univ. 27, 3436–3449. doi:10.1007/s11771-020-4557-x
Hu, B. (2008). Research on the particle breakage mechanical characteristics and constitutive model of calcareous sand under triaxial conditions. Wuhan, China: Institute of Rock and Soil Mechanics, Chinese Academy of Sciences.
Igoe, D., Spagnoli, G., Doherty, P., and Weixler, L. (2014). Design of a novel drilled-and-grouted pile in sand for offshore oil&gas structures. Mar. Struct. 39, 39–49. doi:10.1016/j.marstruc.2014.06.001
Jiang, L., Fan, J., Wang, Z., and Huo, Z. (2015). Mechanical property of calcareous sand under action of compaction. Glob. Geol. 18, 183–187. doi:10.3969/j.issn.1673-9736.2015.03.05
Kou, H.-l., Diao, W.-z., Zhang, W.-c., Zheng, J.-b., Ni, P., Bo-An, J., et al. (2021). Experimental study of interface shearing between calcareous sand and steel plate considering surface roughness and particle size. Appl. Ocean Res. 107, 102490. doi:10.1016/j.apor.2020.102490
Lee, C., and Poulos, H. G. (1991). Tests on model instrumented grouted piles in offshore calcareous soil. J. geotechnical Eng. 117, 1738–1753. doi:10.1061/(asce)0733-9410(1991)117:11(1738)
Li, D.-j., Shi, C., Ruan, H.-n., Li, B.-y., Li, W.-y., and Yao, X.-c. (2022). Study on shear behavior of coral reef limestone–concrete interface. Mar. Georesources Geotechnol. 40, 438–447. doi:10.1080/1064119x.2021.1906365
Li, X., Zhang, X., Shen, W., Zeng, Q., Chen, P., Qin, Q., et al. (2023). Research on the mechanism and control technology of coal wall sloughing in the ultra-large mining height working face. Int. J. Environ. Res. Public Health 20, 868. doi:10.3390/ijerph20010868
Liu, C., and Wang, R. (1998). Preliminary research on physical and mechanical properties of calcareous sand. Rock Soil Mech. 19, 32–37. doi:10.16285/j.rsm.1998.01.006
Liu, H., Zhu, C., Wang, R., Cui, X., and Wang, T. (2021). Characterization of the interface between concrete pile and coral reef calcarenite using constant normal stiffness direct shear test. Bull. Eng. Geol. Environ. 80, 1757–1765. doi:10.1007/s10064-020-02039-8
Liu, S., and Li, X. (2022). Experimental study on the effect of cold soaking with liquid nitrogen on the coal chemical and microstructural characteristics. Environ. Sci. Pollut. Res. 30, 36080–36097. doi:10.1007/s11356-022-24821-9
Liu, S., Sun, H., Zhang, D., Yang, K., Li, X., Wang, D., et al. (2023). Experimental study of effect of liquid nitrogen cold soaking on coal pore structure and fractal characteristics. Energy 275, 127470. doi:10.1016/j.energy.2023.127470
Ma, W., Qin, Y., Zhao, K., and Chen, G. (2022). Comparisons on liquefaction behavior of saturated coral sand and quartz sand under principal stress rotation. Mar. Georesources Geotechnol. 40, 235–247. doi:10.1080/1064119X.2021.1882627
Meng, Q.-S., Yu, K.-F., Wang, R., Qin, Y., Wei, H.-Z., and Wang, X.-Z. (2014). Characteristics of rocky basin structure of yongshu reef in the southern south China sea. Mar. Georesources Geotechnol. 32, 307–315. doi:10.1080/1064119x.2013.764553
Ohno, S., Ochiai, H., and Yasufuku, N. (1999). Estimation of pile settlement in calcareous sans. Eng. calcareous sediments, 1–6. ISBN:90-5809-041-8.
Poulos, H. G. The mechanics of calcareous sediments. Australian Geomechanics 1988: John Jaeger Memorial Address.
Rittirong, A., Shang, J. Q., Mohamedelhassan, E., Ismail, M. A., and Randolph, M. F. (2008). Effects of electrode configuration on electrokinetic stabilization for caisson anchors in calcareous sand. J. geotechnical geoenvironmental Eng. 134, 352–365. doi:10.1061/(asce)1090-0241(2008)134:3(352)
Smith, D. A., and Cheung, K. F. (2003). Settling characteristics of calcareous sand. J. Hydraulic Eng. 129, 479–483. doi:10.1061/(asce)0733-9429(2003)129:6(479)
Spagnoli, G., Doherty, P., Murphy, G., and Attari, A. (2015). Estimation of the compression and tension loads for a novel mixed-in-place offshore pile for oil and gas platforms in silica and calcareous sands. J. Petroleum Sci. Eng. 136, 1–11. doi:10.1016/j.petrol.2015.10.032
Uesugi, M., Kishida, H., and Uchikawa, Y. (1990). Friction between dry sand and concrete under monotonic and repeated loading. Soils Found. 30, 115–128. doi:10.3208/sandf1972.30.115
Wang, R., Guo, J., Lei, S., Wang, X., Rong, W., Yu, Z., et al. (2022). A spike-trimer protein-based tetravalent COVID-19 vaccine elicits enhanced breadth of neutralization against SARS-CoV-2 Omicron subvariants and other variants. Mar. Georesources Geotechnol., 1–13. doi:10.1007/s11427-022-2207-7
Wang, X.-Z., Jiao, Y.-Y., Wang, R., Hu, M.-J., Meng, Q.-S., and Tan, F.-Y. (2011). Engineering characteristics of the calcareous sand in nansha islands, south China sea. Eng. Geol. 120, 40–47. doi:10.1016/j.enggeo.2011.03.011
Wang, X.-Z., Wang, X., Jin, Z.-C., Zhu, C.-Q., Wang, R., and Meng, Q.-s. (2017). Investigation of engineering characteristics of calcareous soils from fringing reef. Ocean. Eng. 134, 77–86. doi:10.1016/j.oceaneng.2017.02.019
Wang, X., Ding, H., Meng, Q., Wei, H., Wu, Y., and Zhang, Y. (2021). Engineering characteristics of coral reef and site assessment of hydraulic reclamation in the South China Sea. Constr. Build. Mater. 300, 124263. doi:10.1016/j.conbuildmat.2021.124263
Wang, X., Wu, Y., Cui, J., Zhu, C. Q., and Wang, X. Z. (2020). Shape characteristics of coral sand from the South China Sea. J. Mar. Sci. Eng. 8 (10), 803. doi:10.3390/jmse8100803
Xu, L.-J., Wang, X.-z., Wang, R., Zhu, C.-q., and Liu, X.-p. (2022). Physical and mechanical properties of calcareous soils: A review. Mar. Georesources Geotechnol. 40, 751–766. doi:10.1080/1064119x.2021.1927270
Zhang, J., Li, X., Qin, Q., Wang, Y., and Gao, X. (2023). Study on overlying strata movement patterns and mechanisms in super-large mining height stopes. Bull. Eng. Geol. Environ. 82, 142. doi:10.1007/s10064-023-03185-5
Zhang, L., Shen, W., Li, X., Wang, Y., Qin, Q., Lu, X., et al. (2022). Abutment pressure distribution law and support analysis of super large mining height face. Int. J. Environ. Res. Public Health 20, 227. doi:10.3390/ijerph20010227
Keywords: coral sand, CFG pile composite foundation, interface strength parameters, static side pressure coefficient, bearing characteristics
Citation: Li X, Zhang R, Yang Z, Chen P, Ji F and Wen B (2023) Mechanical behavior analysis and bearing capacity calculation of CFG pile composite foundation on coral sand site. Front. Earth Sci. 11:1204989. doi: 10.3389/feart.2023.1204989
Received: 13 April 2023; Accepted: 19 May 2023;
Published: 31 May 2023.
Edited by:
Xuelong Li, Shandong University of Science and Technology, ChinaReviewed by:
Chaoxuan Zhang, Institute of Rock and Soil Mechanics (CAS), ChinaYu Xuguang, Tangshan Vocational and Technical College, China
Copyright © 2023 Li, Zhang, Yang, Chen, Ji and Wen. This is an open-access article distributed under the terms of the Creative Commons Attribution License (CC BY). The use, distribution or reproduction in other forums is permitted, provided the original author(s) and the copyright owner(s) are credited and that the original publication in this journal is cited, in accordance with accepted academic practice. No use, distribution or reproduction is permitted which does not comply with these terms.
*Correspondence: Ruiyuan Zhang, 1532272557@qq.com