Analysis of inhomogeneous magnetization using a spinner magnetometer
- Research Center for Knowledge Science in Cultural Heritage, Doshisha University, Kyoto, Japan
The assumption for measuring a discrete sample by spinner magnetometer in paleomagnetism is that the sample under study is a magnetic dipole so that the magnetization vector can be calculated by successive measurements of components along three orthogonal axes. This assumption may not hold for samples with inhomogeneous magnetization, irregular shape, or both, where non-dipole components are no longer ignorable. This study draws attention to their effect on the measurement of remanent magnetization based on an offset dipole model using multipole expansion of magnetic potential. Results from this model are compared with the experimental data measured by a new type of spinner magnetometer featured by high spatial resolution and the capability of measuring the fundamental wave component as well as the harmonic wave components. By using the relative amplitude of the harmonic waves to the fundamental wave, the contribution of non-dipole components can be quantified, leading to assessing how dipolar a sample is. The new analyses and instrumentation will be useful as a new diagnostic tool to obtain more reliable data from the samples collected from tectonically active regions with complicated geological histories.
1 Introduction
When we measure magnetizations of discrete samples of a cylinder or cubic shape, we assume a priori that their magnetization is homogeneous within the sample volume. Though they may have inhomogeneous magnetization or irregular shape, it is expected that if there is a proper distance between a sample and a magnetic sensor the sample can be regarded as a magnetic dipole. This is because the magnetic field at a sufficiently large distance away from a sample behaves as a magnetic dipole due to the rapid decay of the nondipole field. On the one hand, experimental studies of artificial samples (Collinson, 1983) report that the magnetic inhomogeneity can add in some cases large errors to the direction of remanent magnetization. It has been noted that these errors are not random ones that could be averaged out by repeated measurements, but instead are systematic errors or biases most likely reflecting an inhomogeneous distribution of magnetic materials or an irregular, antisymmetric shape (Collinson, 1977).
Kodama (2017) pointed out that another type of systematic error can be produced when measuring by a spinner magnetometer (SPM). This is principally because an SPM measures a fundamental component in the field induced by rotating a sample close to the sensor (Collinson, 1983). Meanwhile, measuring by a superconducting rock magnetometer, a static measurement without rotating a sample, it is often necessary to measure a weakly magnetic sample in a narrower sensing region than usual. In such cases, systematic errors could arise and not easily be removed by simply averaging the outputs. And it is required to precisely determine the sample position whereby appropriate correction can be carried out by taking the geometrical configuration of the sample-sensor system into consideration (Yang et al., 1990).
Collinson (1983) pointed out that the non-dipole effects can be approximated by an offset dipole model where a dipole moment is placed at some distance off the spinning axis of an SPM. The mathematical formulation of the offset dipole was first developed by Schmidt (1934) to better describe the geomagnetic field by the Gauss coefficients of the spherical harmonic functions. Earlier theoretical studies (e.g., Hurwitz, 1960; James and Winch, 1967; Sano, 1991) have proposed different approaches to the offset dipole model, by adopting different degrees of the spherical harmonic expansion, in the quest for a better approximation of the geomagnetic field. Subsequently, with the accumulation of global geomagnetic data, especially by high-resolution satellites, the geomagnetic field can be described by a set of Gauss coefficients, which have been updated every 5 years (e.g., Alken et al., 2021). On the other hand, the magnetic dipole moments and pole positions of the offset dipole for the last 80 years have been described by the Gauss coefficients (Koochak and Fraser-Smith, 2017).
In studies of the paleomagnetic field in the geological past, Wilson (1971) first demonstrated that the long-term, time-varying geological events, such as continental drift and polar wander during Late Tertiary, are not necessarily present but can be better explained by a systematic shift of virtual geomagnetic pole positions caused by the offset dipole. Applications of the offset dipole model to geomagnetism have extended to studies of anomalous features of the geomagnetic field during the Brunhes-Matuyama polarity transition and some other excursions (e.g., González-López, 2021).
In rock magnetism, since pointed out first by Collinson (1983), few theoretical studies have so far been made to apply the offset dipole model to calculating the magnetization of a sample by considering the non-dipole. Kodama (2017) reported by experiments that the magnetic field created by an offset dipole becomes less sinusoidal as the offset increases, but no quantitative interpretation has been accomplished. This study proposes a new theoretical approach based on magnetostatics, allowing for quantitative interpretation of the results measured by a new type of SPM (Kodama, 2017), capable of measuring multiple harmonic wave components with frequencies higher than the fundamental wave. Comparisons of the theoretical and experimental results are carried out using waveforms, associated FFT spectra, and parameters derived from them. The assessments based on the parameters proposed in the following sections will help to obtain reliable data sets from those samples with magnetic inhomogeneity that has been paid little attention previously.
2 Theory
2.1 Multipole expansion model
The model proposed in this study is based on the magnetostatic configuration where a pair of magnetic poles with opposing polarity are emplaced with a finite separation of l (Figure 1). This model approximates a bar magnet with length l. By letting
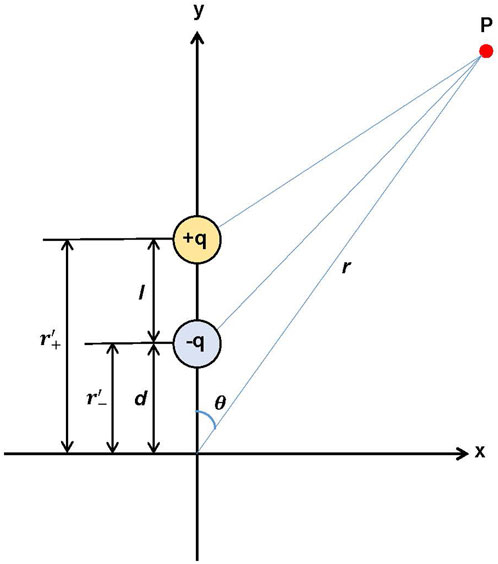
FIGURE 1. Configuration of a pair of magnetic poles with opposing polarity, +q and -q, for the offset dipole model using multipole expansion method.
Therefore, instead of the spherical harmonic expansion, we use an alternative method, the multipole expansion of a magnetic potential, where the magnetostatic potential at an observation point is represented by the sum of the scalar potentials, each being expanded in series of the spherical harmonics (Figure 1).
In this model, each potential can be transformed into the equation described by the Legendre polynomials of the azimuth (Supplementary Appendix A-1, A-2). Meanwhile, an offset dipole can be approximated by displacing the bar magnet from the origin, as well as by letting the length of the bar magnet infinitesimal. These approximations make it possible to describe the magnetic potential of the offset dipole by the equations including the amount of the offset d (Supplementary Appendix A-3–A-6). Consequently, the radial component of the magnetic field along a circular path around the origin can be described (Supplementary Appendix A-7–A-12).
These equations are expressed by the polynomials truncated in the third order. This is because the SPM employed in this study measures the harmonic wave components limited to the third order. Because of the differential sensor configuration of the SPM, where one sensor faces the other by 180°, the second harmonic component is canceled (Supplementary Appendix A-22). Thus, theoretically, the radial component of the field created by the offset dipole can be expressed as the fundamental sinusoidal wave plus the third-order harmonics.
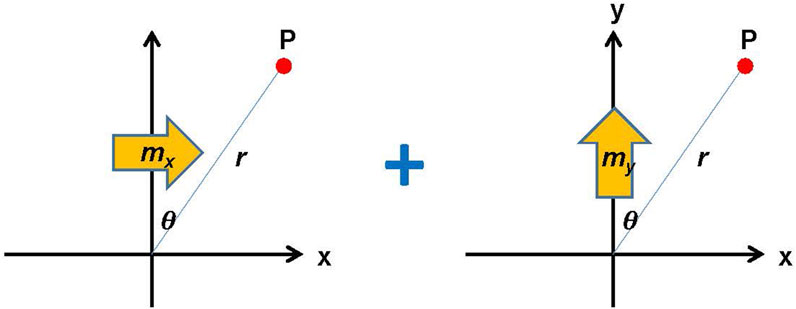
In a more general case (Figure 2), where the offset dipole moment consists of two components as
where r is the distance between the sensor and the origin, δ is the offset scaled by r (δ=
To grasp the contribution of the offset more easily, we calculate the waveforms by giving specific values of mx, my and δ in Eq. 1. Figure 3 shows results from the case where a dipole shifts toward the direction of the magnetic moment with the relative offset varying from 0.1 to 0.4.
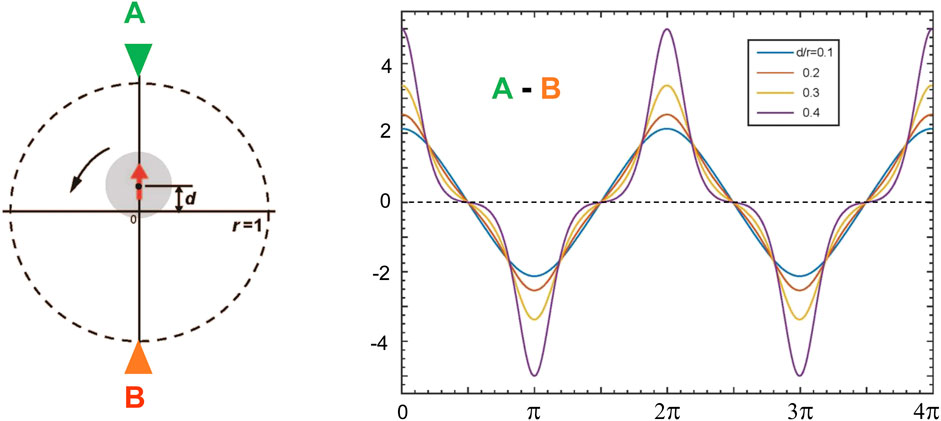
FIGURE 3. Theoretical waveforms of an offset dipole measured along a circle by a pair of magnetic sensors, (A,B) in the differential configuration. The offset, d, directs along the axis magnetic moment. The offset is scaled by the radius of the circle, varying from 0.1 to 0.4.
Figure 4 shows those from another case where the magnetic moment tilts by π/4 with respect to the direction of the offset. It is characteristic in Figure 4 that the curves have greater horizontal asymmetry about π in the phase as the offset increases. Compared with Figure 3, this asymmetry is due to the phase shift of the third-harmonic component that is caused by the component of the magnetic moment directing normal to the offset.
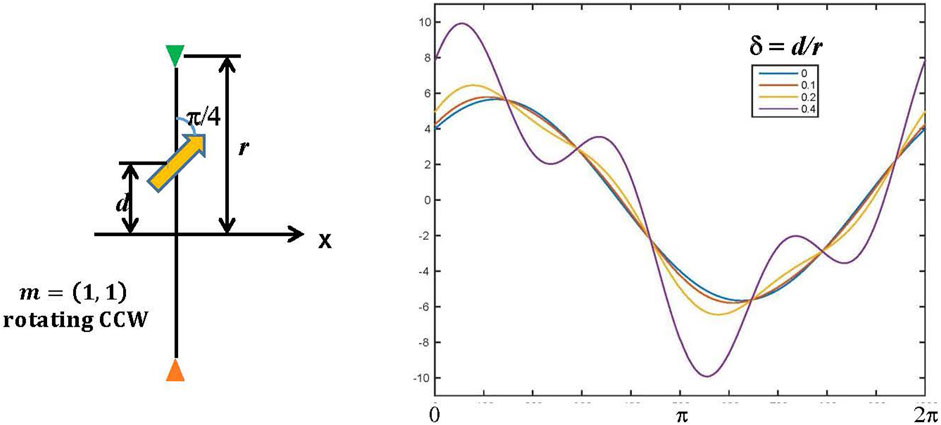
FIGURE 4. Theoretical waveforms of an offset dipole are calculated in the same way as in Figure 3, but the dipole directs π/4 from the axis of the paired sensors. Note that the asymmetry of each waveform increases as the offset does.
2.2 Comparison with experimental data
To interpret experimental data measured by a conventional SPM measuring a fundamental wave component, we deal with just the terms proportional to sinθ or cosθ in Eq. 1. For simplicity, letting r = 1 and neglecting the constant in Eq. 1, the fundamental wave component, F1, can be written as
where
Assuming
where
where
It is generally granted that an SPM, regardless of the offset, outputs the magnetization of a sample by measuring the amplitude (A1) and the phase (φ) of the fundamental component, F1. Meanwhile, Eqs. 4, 5 suggest that not only A1 but also φ are essentially different from those in the non-offset case.
Figure 5A demonstrates how φ changes with different δs. Because 0 <β < 1 in Eq. 5, φ < φ0 always works. The discrepancy,
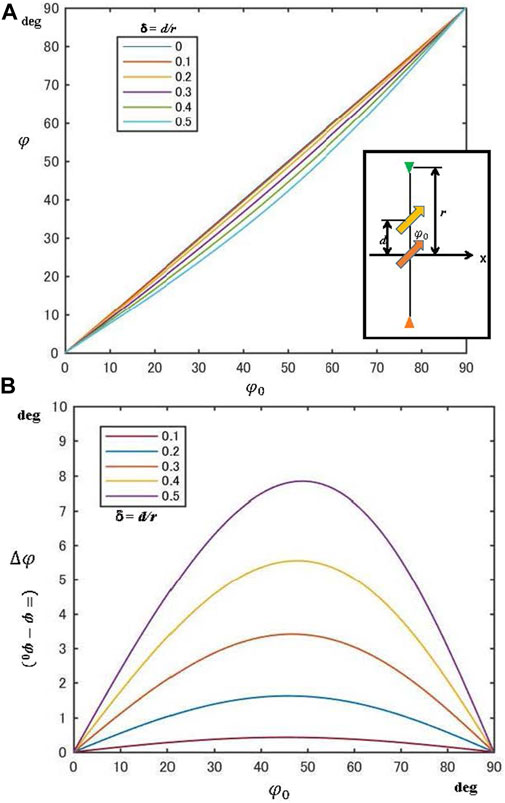
FIGURE 5. (A) Relationship between φ and φ0 for the offset dipole model in Figure 4, with the δs being 0.1 to 0.5. (B) Discrepancy,
Equation. 4 indicates that
3 Discussion
The analysis based on the offset dipole model is useful to interpret an anisotropic magnetization due to the shape anisotropy of a sample. Figure 6 shows examples of the waveform and associated FFT spectrum, the screenshot of real-time plots in the SPM’s operating program.examples of the waveform and associated FFT spectrum, the screenshot of real-time plots in the SPM’s operating program.
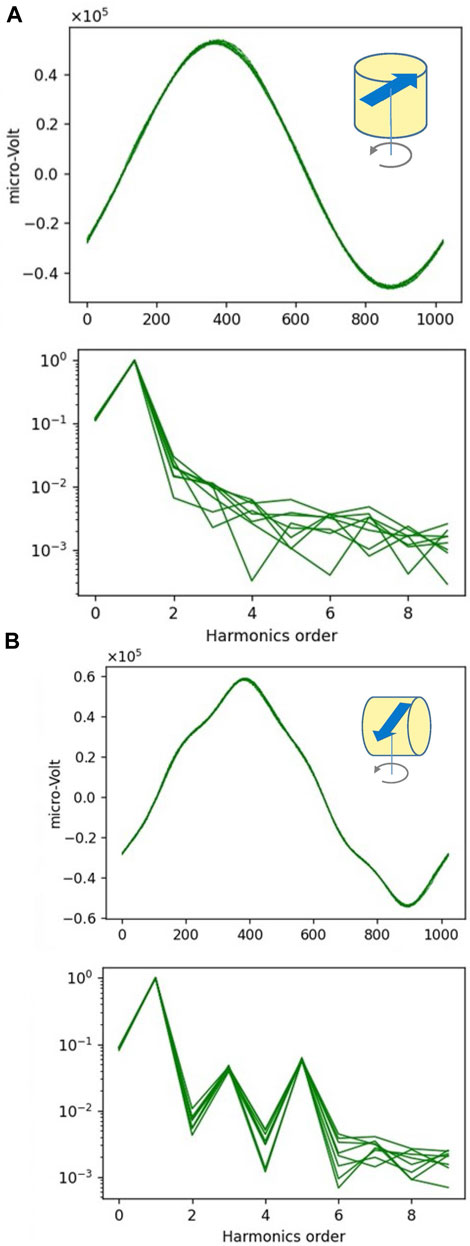
FIGURE 6. Waveforms and FFT spectra from a synthetic sample with homogeneous magnetization within the equatorial plane. Overlapping 8 waveforms, measured by an SPM (reading 1024 points/spin, rotating 2 Hz). (A) Spinning about the z-axis, with an isotropic cross-section. (B) Spinning about an axis in the equatorial plane, with a square cross-section having a shape anisotropy.
One example is from a synthetic sample of 1″-size cylinder, containing SD magnetite, with a uniform magnetization (= 4.2 A/m) directing normal to the z-axis of a cylinder. This sample was measured in two different orientations. In the first case (A), where the sample rotates about the z-axis, the waveform is a sinusoidal curve, obviously an output from a magnetic dipole. In the second case (B), where the sample rotates about a different axis that is normal to the z-axis while holding for the magnetization to rotate in the same plane as in A. The waveform in B is primarily sinusoidal but contains small bumps, indicating an overlap of harmonic waves. This is also demonstrated by the FFT spectrum in B, showing three noticeable peaks corresponding to F1, F3, and F5, respectively. The discrepancy in waveform between A and B reflects the difference in their cross-section in the plane normal to the z-axis: isotropic round shape (A) vs. anisotropic angular square (B). Thus, these results suggest that when analyzing such data involving overlapping harmonic waves it is necessary to consider not only magnetic inhomogeneity but also shape anisotropy.
Assuming the value of f3/f1 (= 0.03) in B to the amplitude ratio of F3 to F1 in Eq. 1, it is possible to assess δ, that is, approximately 0.3. Substituting this value into Eqs. 2–5, the discrepancy in amplitude can be estimated. The resulting amplitude becomes about 3% greater than the initial F1. This suggests that the shape anisotropy in B requires no significant correction. However, though rarely pointed out previously, it may be usually the case that waveforms observed for natural samples include Nth-order (N > 2) harmonics where their contribution to F1 seems no longer ignorable.
Figure 7 shows one such result from an intrusive rock sample. This sample was chosen because there is a non-negligible difference between the measurements by a conventional type of SPM and the new SPM employed in this study. These results are summarized in Table 1.
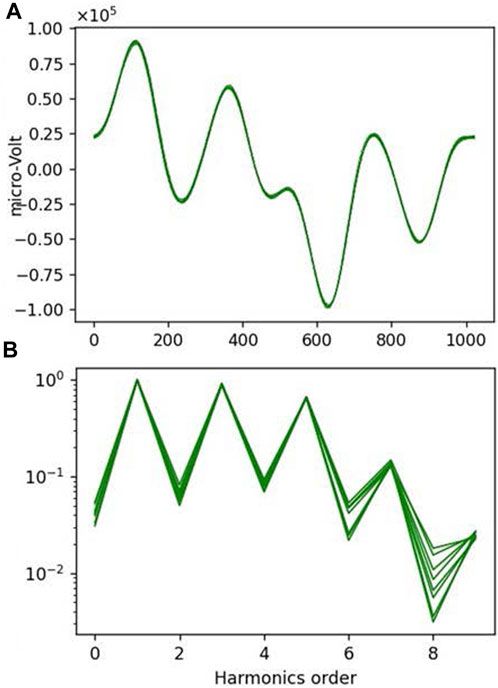
FIGURE 7. Waveform (A) and FFT spectrum (B) from a natural sample (gabbro) with an inhomogeneous magnetization within the equatorial plane. Spinning about the same axis as in case B in Figure 6.

TABLE 1. Measurements of the same intrusive rock sample by different SPMs: a conventional SPM (SMD-88, Natsuhara Giken) and a new SPM (MuSpin, Myuon Instruments).
The waveform in Figure 7 is featured by multiple peaks of the higher-order harmonic waves, indicating they overlap to a much higher degree than in B in Figure 6. The FFT spectrum is characterized by the three prominent peaks of F1, F3, and F5, with their ratio, f3/f1 (= 0.9) and f5/f1 (= 0.3), about two orders of magnitude greater than in B. Because B is the case of only shape anisotropy, the cause of the contrasting waveform in Figure 7 resides within the sample itself. For example, 1) uneven distribution of magnetic particles, 2) preferred orientation of an ensemble of magnetic grains, and 3) uneven mixture of a small number of magnetic grains of various sizes and shapes with different anisotropy.
According to Kodama et al. 2018, the intrusive rock body, from which the sample was collected, shows a weak magnetic susceptibility anisotropy, suggesting a layered Figure 8 structure of the intrusion. However, because there is no distinctive anisotropy in the remanent magnetization, cause 2) is unlikely. A rock magnetic study (Kodama et al., 2018) reveals that the carrier of the remanent magnetizations is magnetite occurring as a submicroscopic inclusion in the host phenocrysts, a special product from the crystallization deep in the accretionary complex (e.g., Floess et al., 2019). Thus, it is more likely that the uneven occurrence of the coarse phenocrysts in the sample leads to the characteristic waveform showing the conspicuous overlap by harmonic waves. Using f3/f1 (= 0.9) in Figure 7, the offset parameter, δ, is estimated to be 0.5, about twice greater than that of B in Figure 6. This leads to the increase of the amplitude, A1, in Eq. 3 by approximately 20%. In terms of the phase, this corresponds to the case with the largest δ (= 0.5) in the simulation in Figure 4, where the discrepancy,
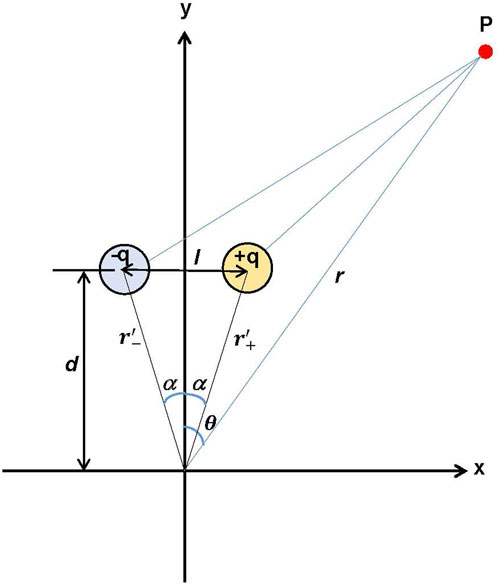
FIGURE 8. Configuration of a pair of magnetic poles with opposing polarity, +q and -q, for approximating an offset dipole magnetized to the x-axis by the multipole expansion method.
4 Conclusion
1) To investigate an inhomogeneous magnetization of a sample, a theoretical method is constructed by applying a multipole expansion analysis to an offset dipole model. The proposed method uses high-resolution measurements by a new type of spinner magnetometer (SPM).
2) The waveform created by an offset dipole consists of not only a fundamental wave but also higher-order harmonic waves. Numerical simulations suggest that the inclusion of the harmonic wave increases the amplitude of the fundamental wave by up to 20% as well as its phase by up to 8°.
3) Comparisons with synthetic and natural samples suggest that there are cases where the contribution of the harmonic waves to the fundamental wave exceeds what is expected by the model. Such a sample can be distinguished by measurement errors several times greater than in common cases.
4) In the measurement with an SPM, we should pay attention to the waveform produced by a rotating sample, which provides a suite of information to see how appropriate it is as a subject of paleomagnetic study.
Data availability statement
The original contributions presented in the study are included in the article/Supplementary Material, further inquiries can be directed to the corresponding author.
Author contributions
The author confirms being the sole contributor of this work and has approved it for publication.
Funding
This research was funded by the Monbusho Kakenhi 15H03718 to the corresponding author. Properties of the SPM employed in this study are provided (https://myuon-inst.com).
Conflict of interest
The author declares that the research was conducted in the absence of any commercial or financial relationships that could be construed as a potential conflict of interest.
Publisher’s note
All claims expressed in this article are solely those of the authors and do not necessarily represent those of their affiliated organizations, or those of the publisher, the editors and the reviewers. Any product that may be evaluated in this article, or claim that may be made by its manufacturer, is not guaranteed or endorsed by the publisher.
Supplementary material
The Supplementary Material for this article can be found online at: https://www.frontiersin.org/articles/10.3389/feart.2023.1212367/full#supplementary-material
References
Alken, P., Thébault, E., Beggan, C. D., Amit, H., Aubert, J., Baerenzung, J., et al. (2021). International geomagnetic reference field: The thirteenth generation. Earth, Planets Space 73, 49–25. doi:10.1186/s40623-020-01288-x
Collinson, D. W. (1977). Experiments relating to the measurement of inhomogeneous remanent magnetism in rock samples. Geophys. J. R. Asfr. Soc. 48, 271–275. doi:10.1111/j.1365-246x.1977.tb01300.x
Floess, D., Caricchi, L., Simpson, G., and Wallis, S. R. (2019). Melt segregation and the architecture of magmatic reservoirs: Insights from the muroto sill (Japan). Contributions Mineralogy Petrology 27, 27–15. doi:10.1007/s00410-019-1563-9
González-López, A., Osete, M. L., Campuzano, S. A., Molina-Cardín, A., Rivera, P., and Pavón-Carrasco, F. J. (2021). Eccentric dipole evolution during the last reversal, last excursions, and holocene anomalies. Interpretation using a 360-dipole ring model. Geosciences 11, 438–516. doi:10.3390/geosciences11110438
Hurwitz, L. (1960). Eccentric dipoles and spherical harmonic analysis. J. Geophys. Res. 65, 2555–2556. doi:10.1029/jz065i008p02555
James, R. W., and Winch, D. E. (1967). The eccentric dipole. Pure Appl. Geophys. 66, 77–86. doi:10.1007/bf00875313
Kodama, K., Byrne, T., Lewis, J. C., Hibbard, J. P., Sato, M., and Koyano, T., 2018. Emplacement of a layered mafic intrusion in the Shimanto accretionary complex of southwest Japan: Evidence from paleomagnetic and magnetic fabric analysis. In Geology and tectonics of subduction zones: A tribute to gaku kimura: Geological society of America special paper 534. ed. by T. Byrne, M. B. Underwood, D. Fisher, L. McNeill, D. Saffer, K. Ujiieet al. United States: The Geological Society of America, 129–140.
Kodama, K. (2017). High-sensitivity multifunctional spinner magnetometer using a magneto-impedance sensor. Geochem. Geophys. Geosyst. 18, 434–444. doi:10.1002/2016gc006615
Koochak, Z., and Fraser-Smith, A. C. (2017). An update on the centered and eccentric geomagnetic dipoles and their poles for the years 1980–2015. Earth Space Sci. 4, 626–636. doi:10.1002/2017ea000280
Lowrie, W. (2011). A student's guide to geophysical equations. United States: Cambridge University Press.
Sano, Y. (1991). A best-fit eccentric dipole and the invariance of the earth's dipole moment. J. Geornag. Geoelectr. 43, 825–837. doi:10.5636/jgg.43.825
Schmidt, A. (1934). Der magnetisehe Mittelpunkt der Erde und seine Bedeutung. Ger. Beit. Geophys. 41, 346–358.
Wilson, R. L. (1971). Dipole offset - the time-average palaeomagnetic field over the past 25 million years. Geophys. J. R. Asfr. Soc. 22, 491–504. doi:10.1111/j.1365-246x.1971.tb03616.x
Keywords: inhomogeneous magnetization, spinner magnetometer, offset dipole, fundamental wave, harmonic wave
Citation: Kodama K (2023) Analysis of inhomogeneous magnetization using a spinner magnetometer. Front. Earth Sci. 11:1212367. doi: 10.3389/feart.2023.1212367
Received: 26 April 2023; Accepted: 03 July 2023;
Published: 19 July 2023.
Edited by:
Satria Bijaksana, Bandung Institute of Technology, IndonesiaReviewed by:
Henglei Zhang, China University of Geosciences Wuhan, ChinaVsevolod Yutsis, Instituto Potosino de Investigación Científica y Tecnológica (IPICYT), Mexico
Copyright © 2023 Kodama. This is an open-access article distributed under the terms of the Creative Commons Attribution License (CC BY). The use, distribution or reproduction in other forums is permitted, provided the original author(s) and the copyright owner(s) are credited and that the original publication in this journal is cited, in accordance with accepted academic practice. No use, distribution or reproduction is permitted which does not comply with these terms.
*Correspondence: Kazuto Kodama, kdma@kochi-u.ac.jp
 Kazuto Kodama