Quantifying the mechanisms of rain-triggered seismicity in karstic regions
 Léa Perrochet
 Giona Preisig2
 - 1Centre d’Hydrogéologie et de Géothermie, Université de Neuchâtel, Neuchâtel, Switzerland
- 2Département du Développement Territorial et de l’Environnement, Service des Ponts et Chaussées, Office des cours d’eau et dangers naturels, Neuchâtel, Switzerland
Seismicity following heavy rainfall events is often considered to be triggered by the pore pressure diffusion front migrating from the surface towards the focal depth, assuming a homogeneous crust. Although this assumption can be justified in some cases depending on local geology (e.g., a homogeneously fractured basement), it is too simplistic for known karst areas. Indeed, the hydraulic behaviour of karst during a flood event is not dominated by pressure diffusion but by highly transmissive karst conduits. This generates rapid and large variations in hydraulic head, possibly leading to large changes in pore pressure at seismogenic depth. We consider the conditions and data from three different case studies with karstic features to evaluate possible seismicity-triggering mechanisms. We identify four potential mechanisms to explain the influence of rainfall on fault stability: crustal loading and its associated poroelastic deformation, pore pressure diffusion, and direct hydraulic connection. We quantify the effect of these mechanisms for parametrisation corresponding to our case studies by considering the specific features of karst and using simplified analytical solutions. Results show that the pore pressure increase resulting from the crustal loading and poroelastic deformation is much smaller than the pore pressure increase resulting from a direct hydraulic connection and its diffusion towards depth over small distances. Moreover, the timing between the intense precipitations and the beginning of seismicity may indicate the mechanism behind the triggering process: no time lag to a time lag of a few hours supposes a direct hydraulic connection, whereas a time lag of a few hours to a few days suggests a coupled solution of a rapid pressure increase resulting from direct hydraulic connection followed by the diffusion process prograding towards the focal depth. Our results highlight the importance of considering the intrinsic properties of karst and its spatial distribution, especially its depth, when studying rain-triggered seismicity in a karstic environment.
1 Introduction
Water at elevated pressures plays a key role in earthquake mechanics. Direct observation of earthquake triggering related to water includes 1) water injection in deep wells (Parotidis et al., 2004; Evans et al., 2012; Ellsworth, 2013; Keranen et al., 2013; Diehl et al., 2017), 2) reservoir impoundment (Gupta, 2002; Kangi and Heidari, 2008) and 3) seasonality or cyclicity in the occurrence of earthquakes due to natural phenomena (Saar and Manga, 2003; Scholz et al., 2019). The latter includes case studies reporting seasonal patterns of seismicity and their relation to groundwater recharge or snow load (Wolf et al., 1997; Saar and Manga, 2003; Bettinelli et al., 2008; Braunmiller et al., 2014; Birhanu et al., 2018; Bragato, 2021). Triggering is observed in a variety of tectonic settings, from intraplate regions to volcanic islands. These regions have different hydrogeologic settings and climate conditions and show a broad range of time lags between the rainfall and the seismicity, varying from hours to months (Costain and Bollinger, 2010). Three case studies show relatively small time lags (hours to days) and have a similar local geology. As pointed out by Miller (2008), the cases of Hochstaufen (Germany) (Kraft et al., 2006), Muotathal (Switzerland) (Husen et al., 2007) and Avignon (France) (Rigo et al., 2008) all occur in known karstic regions. The primary mechanism invoked for explaining seismicity following rainfall is pore fluid pressure diffusion, similar to what is described in reservoir-induced seismicity (Talwani and Acree, 1984; Talwani, 1997), considering a homogeneously fractured crust. However, for the cases of Germany, Switzerland, and France and considering the intrinsic properties of karst, the model of a homogeneously fractured crust might be too simplistic, leading to the necessity to explore other possible mechanisms. The study aims to identify and differentiate which mechanism is more likely to induce seismicity following heavy rainfalls according to local stress conditions and local geology by quantifying their effects using simplified analytical solutions with data from the aforementioned case studies (Germany, Switzerland, and France). The analytical modelling requires several values to be estimated, based either on average values from the literature or using data from existing case studies. We present one scenario for each case study to illustrate orders of magnitude between the different mechanisms for a given set of conditions. The aim is to compare the mechanisms with each other, not to find the best-fitting parameters or propose an extensive and systematic sensitivity analysis.
2 Karst geology, triggering mechanisms, and conceptual model
2.1 Karst-specific features
Mature karst systems consist in well developed channels of various morphologies within a relatively low permeable rock matrix, typically consisting of soluble rocks such as limestones, dolomites or evaporites. Different hydraulic parameters between channels and a matrix lead to the so-called duality of karst (Király, 1994, 1998). On the surface, the epikarst, consisting of a highly altered surface bedrock, is thought to enhance the concentrated infiltration within the karst conduits (Király, 1998). Bonacci (1987) carried out numerous analyses on karst and found that the effective porosity of karst host rock is between 0.1% and 1% on average, being locally much higher in the presence of large caves or conduits. This configuration, i.e., high permeable conduits and a low porosity matrix, explains satisfactorily karstic spring hydrographs following recharge events. Figure 1 illustrates the characteristic hydrographs of springs related to 1) a fractured rock mass Figure 1A, 2) a bare karst Figure 1B, and 3) a fractured rock mass with karst conduits. The shape of the hydrographs depends on the extent of the fractures within the host rock. The hydrograph resulting from the combination of a fractured host rock with karst conduits (Figure 1C) represents the global response of both the high permeable conduits and low permeable matrix in response to recharge events. In this scenario, the recharge event involves the inversion of the flow regime. During flood events, the evacuation capacity of the karst system is exceeded and results in a rapid and large water level increase within the channels. This leads to a flow from the channels to the matrix, recharging the matrix. During low-water periods, the water stored in the matrix flows back to the conduits, maintaining base flow levels. Such hydrographs are typical of karstic regions and are clear evidence of rapid hydraulic head increases. For example, Figure 2 shows the discharge of the Schlichenden spring draining the Hoelloch cave system (Muotathal, Switzerland). During an important recharge event, a cave located 540 m above the permanent water table was flooded Miller (2008).
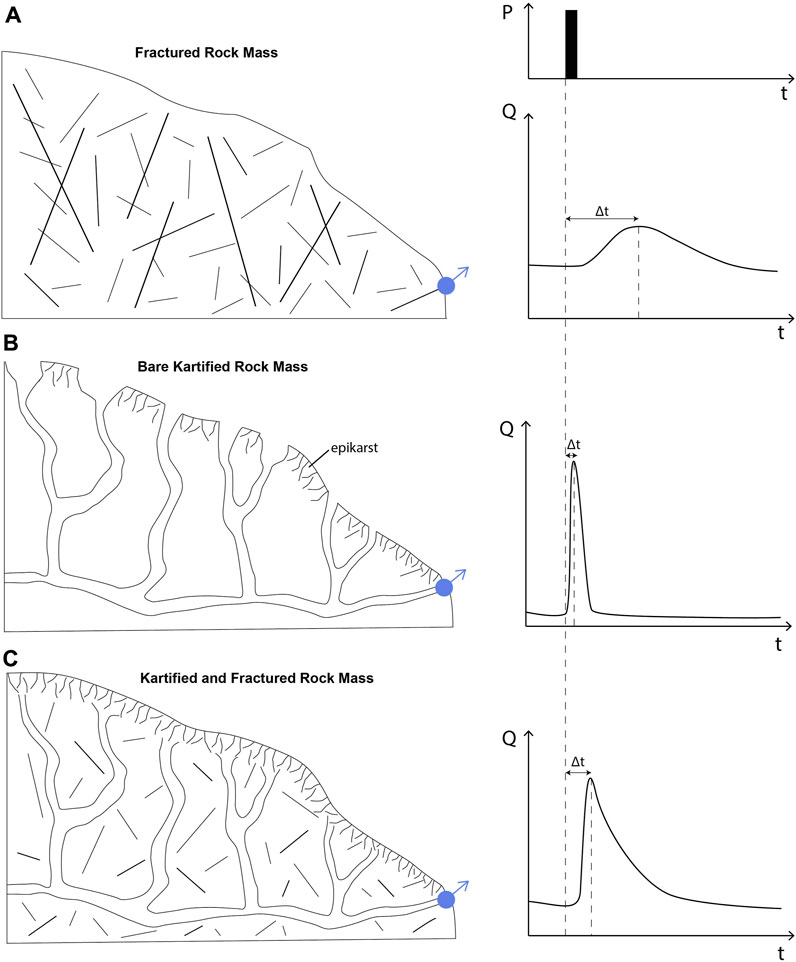
FIGURE 1. Characteristic spring hydrograph for (A) a fractured rock mass, (B) bare karst, and (C) karst conduits in a fractured host rock. Figure has been modified from Bonacci (1993). The form of the hydrograph varies according to the fracture system and the presence or not of karstic conduits.
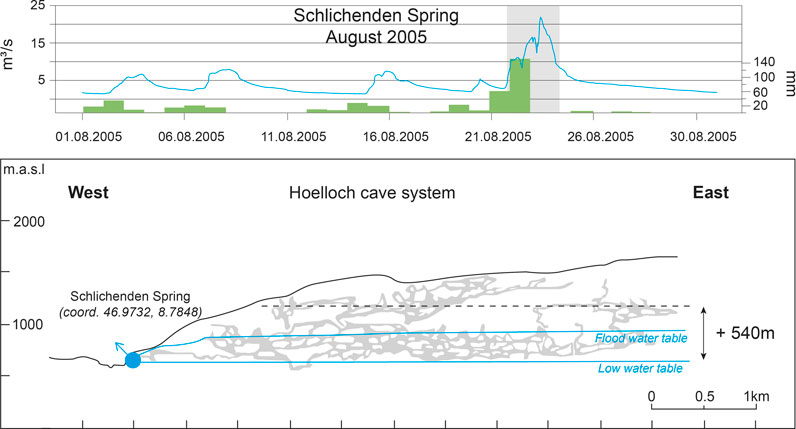
FIGURE 2. Top: Discharge curve at the Schlichenden spring, the main outflow of the Hoelloch cave system in the region of Muotathal, Switzerland, during the month of August 2005 (Federal Office for the Environment - Hydrological data and forecast). The daily precipitations, measured at the meteorological station in Muotathal (Federal Office of Meteorology and Climatology MétéoSuisse), are shown in green. The shaded area illustrates the time at which a cave located 540 m from the spring altitude was flooded. The exact timing is not known. Bottom: Cross-section through the Hoelloch cave system. The low and flood water tables are shown as blue lines. The dashed line represents the level at which a cave was flooded during August 2005. The figure has been modified from Wildberger et al. (2010).
Another important aspect to consider is the relationship that can exist between karst systems and fault zones. A fault zone’s hydraulic properties depend on various parameters and are subject to changes over time and space. Considered either as a barrier or conduits for fluid circulation, their role depends greatly on their anatomy (fault core and damaged zone) and composition (breccia, cataclasite, or ultracatalasite) (Caine et al., 1996; Faulkner et al., 2010), which will influence the spatial distribution of permeabilities (Caine et al., 1996; Evans et al., 1997). Additionally, the hydraulic properties of a fault zone can vary in time as has been observed in laboratory tests (Seront et al., 1998) and modelling experiments (Preisig et al., 2016), in which a shear slip on a fault increases the permeability in response to dilation. As karst development is driven by water flow and faults can favor flow paths, it is likely that karst systems develop in relation to faults and that the two systems are hydraulically connected. However, the exact role of the fault, i.e., whether fluids can pass through the fault zone or flow along, is determined by its internal structure and composition (Matonti et al., 2012). This potential link between karst and faults makes the latter particularly sensitive to rainfall and karst flooding events.
2.2 Possible effects of rainfall on the stability of the fault
External changes in the stress regime might impact the stability of the fault depending on its orientation, initial stress regime, and pore pressure. We identify four potential mechanisms to explain the influence of rainfall on fault stability:
1. crustal loading,
2. poroelastic pore pressure changes associated with crustal loading,
3. pore pressure diffusion and,
4. direct hydraulic connection
The impact of crustal loading 1), i.e., the weight of precipitation as an additional load on the crust, depends on the stress regime. From Anderson’s stress regime classification (Anderson, 1951), an additional load in a normal faulting stress regime (NF) reduces the stability of the fault, increases stability in a thrust-faulting stress regime (TF), and leaves the stability unchanged in a strike-slip stress regime (SS). Additionally, the additional load on the crust modifies normal effective stresses due to increasing pore-fluid pressure through poroelastic deformation 2), reducing the shear strength and hence the stability of the fault. A rising fluid pressure at the surface might also initiate a pressure diffusion front 3), increasing pore pressure and reducing the effective normal stress gradually while the pressure front propagates. A rising water level and a direct hydrogeological connection through the karst between the surface and the fault plane 4) result in an instantaneous increase in pore pressure, impacting the stability of the fault.
2.3 Conceptual model
We propose a conceptual model (Figure 3) that considers specific karst features and rainfall-induced mechanisms that potentially lead to fault instability. An important difference between these mechanisms depends on the relationship between the karstic network and the faulted system and whether a direct hydraulic connection exists (iv) or not (ii and iii). In cases in which the karstic network is connected to a highly permeable fault zone (iv), the groundwater pressure increase at a given depth is quasi-instantaneous. In cases in which the karstic network lies above a fault, and there is no direct hydraulic connection, the mechanism leading to stress changes is similar to the one described for reservoir impoundment, i.e., (ii) a rapid increase in pore pressure resulting from the elastic deformation due to the vertical load and undrained conditions and/or (iii) a delayed response due to fluid migration towards depth. Although an increasing groundwater pressure occurs in all scenarios, they can be differentiated by the timing, which is quasi-instantaneous for (ii) and (iv) and delayed for (iii).
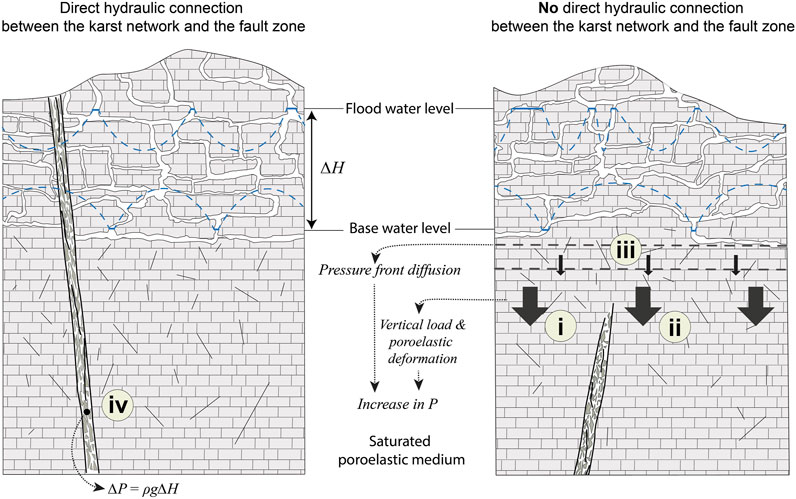
FIGURE 3. Schematised scenarios illustrating mechanisms leading to pore pressure increase in the case in which the karstic network is in direct hydraulic connection with a fault (left) or lying above (right). The vertical load (i) increases pore pressure through poroelastic deformation (ii). (iii) Pore pressure increase is delayed due to the pressure front migration. (iv) Pore pressure increases quasi-instantaneously following an increasing water level. Note that (i), (ii), (iii), and (iv) might act concomitantly.
3 Methodology
3.1 The stability of the fault and Coulomb Failure Stress
According to the classical Mohr–Coulomb failure criterion, failure on a fault initiates when the following stress conditions are met:
where τ is the shear stress, μ the coefficient of internal friction, the effective normal stress
For a fault favorably oriented (θ = 60°) and according to Eqs 1–3, rupture can be initiated by an increasing shear stress τ through an increase of
To evaluate the proximity of a fault to failure, the Coulomb failure stress is a good indicator and is defined as follows (see, e.g., Beeler et al., 2000):
A negative value resulting from Eq. 4 indicates that failure has not been reached, as the shear strength
where Δσn is the change in normal stress and is positive for compression. Positive values of ΔCFS indicate that the fault is closer to failure, whereas negative values indicate that the fault is moving away from the rupture point.
3.2 Direct connection
If the fault zone is in direct hydraulic connection with the karstic network, and considering a simplified environment with no pressure losses, an increasing hydraulic head in the karst conduits due to heavy precipitation will generate a quasi-instantaneous and non-attenuated pressure signal. The increase in pore pressure (and the decrease of the effective principal stresses
The variation in the hydraulic head ΔH [m] depends on the storage coefficient S [-], a considered area A [m2], and the volume of infiltrated water Vw [m3], which is controlled by the (effective) rainfall intensity i [m/d] falling over the area A during a given time dt [d] (Fetter, 2001):
where
In a porous rock mass in which the water table can fluctuate freely, S is equal to the effective porosity, which can range from less than 0.01 to 0.30 in sedimentary karstic rocks. In a porous rock mass in which the water table cannot fluctuate freely, i.e., the piezometric level is above the top of the permeable unit (confined aquifer), S is in the order of 0.005 or less (Fetter, 2001).
3.3 Crustal loading
Considering a karst network without a direct hydraulic connection with the fault zone, fault stability might be influenced by a supplementary load, i.e., the infiltrated water. In such a case, an underlying saturated fault system will behave as a poroelastic medium with increasing pore pressure (and decreasing effective stress) in response to the vertical loading.
3.3.1 Boussinesq’s solution
To evaluate the impact of an increasing load Pa on the vertical stress Δσv beneath the center of a karstic network, Boussinesq’s solution for a circular load on the surface of a semi-infinite elastic space is used, as expressed in Poulos and Davis (1974):
where R is the radius of the circular area and can be seen as the catchment area of the karstic network and z is the depth. This solution is then used to calculate the change in pore pressure resulting from the change in vertical stress (Eq. 11).
3.3.2 Poroelastic deformation
Under undrained conditions, the impact of stress changes on pore pressure is expressed as follows (Rice and Cleary, 1976):
where Δσkk/3 corresponds to (Δσx + Δσy + Δσz)/3 and is the average compressive stress. Assuming that stress changes in only the vertical direction, then Eq. 10 becomes:
where B is the Skempton coefficient and νu is the undrained Poisson’s ratio.
3.4 Fluid pressure diffusion
An increasing hydraulic head will lead to fluid pressure diffusion from zones of high to zones of low hydraulic head. Considering a step increase in pressure at time t = 0, the simplified one-dimensional diffusion problem has the solution (Carslaw and Jaeger, 1959):
where erfc is the complementary error function, p is the pressure at depth z and time t resulting from the applied pressure Pa on a medium with diffusivity D, where D = T/S, with T the transmissivity and S the storage coefficient.
Now considering a step increase in pressure at time t = 0 and a linear decrease over a time τ from Pa to 0, the solution reads as follows (Perrochet P., personnal communication, presented in Supplementary Material S1):
where H(u) is the Heaviside step function (H(u) = 1 when u > 0 and H(u) = 0 when u < 0) and m = Pa/τ. Note that Eqs. 12 and 13 do not consider the coupled poroelastic response.
4 Case studies
Three different case studies in which rain-induced seismicity occurred in karstic regions after a period of intense rainfall are presented and discussed: 1) Mount Hochstaufen in Germany (Hainzl et al., 2006; Kraft et al., 2006), 2) Muotathal and Riemenstalden in Switzerland (Husen et al., 2007), and 3) the Avignon region in France (Rigo et al., 2008). In the following, we present these case studies in a consolidated and homogeneous manner to facilitate comparisons. Relevant data from the three case studies will be considered as input for our simplified analytical models.
4.1 Mount Hochstaufen, Germany
In 2001, the University of Munich, together with the Bavarian State, installed a new seismic monitoring network in Bavaria, as well as a subnet of six stations around Mount Hochstaufen (Kraft et al., 2006). These were installed following preliminary observations made by Schwarzmann (1996), who analyzed 2 months of seismic records from a temporary network installed after a ML 2.7 of 26 June 1995 in the region of Bad Reichenhall. The author suggested a possible relationship between seismicity and rainfall.
Mount Hochstaufen experienced two seismic swarms in 2002, both occurring after an extended period of rainfall in March and August. In August, ∼300 mm fell over the region of Bad Reichenhall (German Weather Service, DWD) in less than 1 week, with a maximum intensity of ∼120 mm/day and ∼110 mm/day on the sixth and the 11th of August, respectively. In all, 1,171 earthquakes were recorded with a maximum event magnitude of ML = 2.4. The located events have epicenters distributed over the Staufen Massif with a focal depth mostly lying between 0 and 3 km depth. Figure 4 summarises the geologic context around the Staufen Massif, which is part of the Northern Calcareous Alps (NCAs), forming an east-west striking fold-and-thrust belt. The NCAs are part of the Upper Austroalpine unit and are commonly divided into three main nappes units: (1) Bajuvaric, (2) Tirolic, and (3) Juvavic. Mount Hochstaufen is part of the Tirolic nappes overthrusting the Bajuvaric Nappes, which are overthrusting the Helvetic and Penninic units (Figures 4A, B) (Tollmann, 1976; Henrich and Zankl, 1981). Mount Hochstaufen is located south of this major thrust fault oriented E-W and north of an important SW-NE sinistral strike-slip fault called the ISAM fault (Innsbruck-Salzburg-Amstetten). Contemporaneous stress filed measurements provided by the Stress Map Germany (Reiter et al., 2016) suggest an N-S maximum horizontal stress orientation.
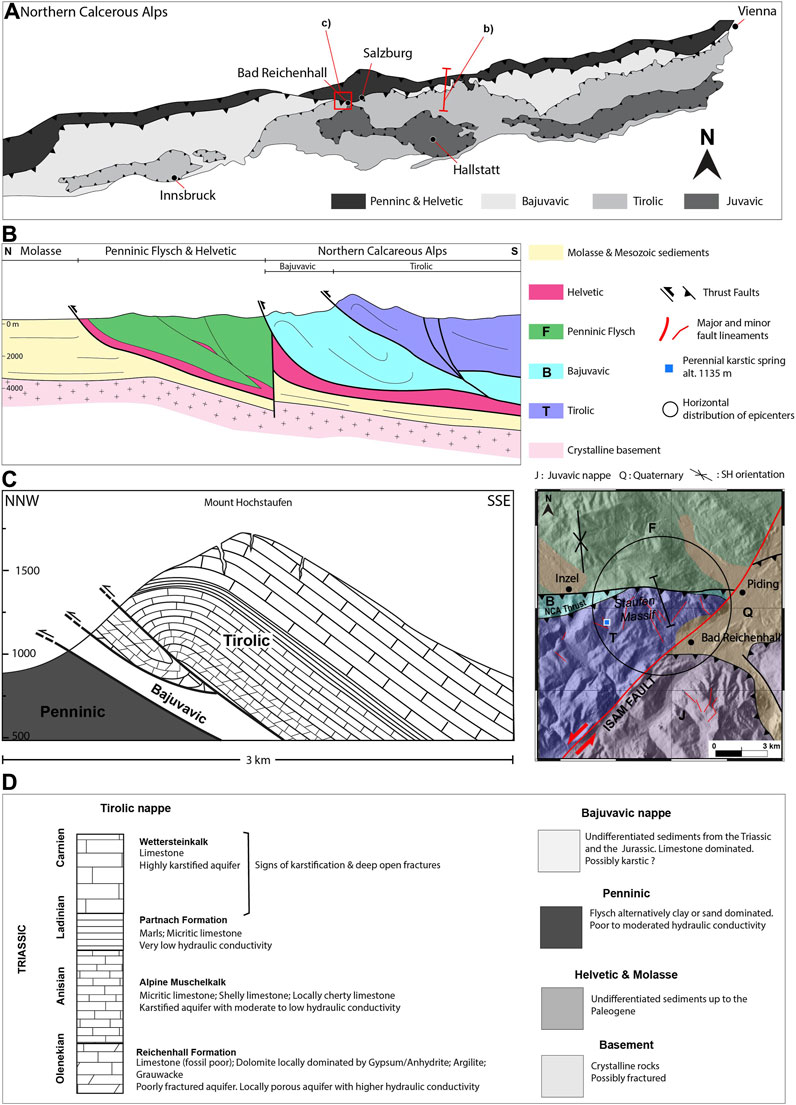
FIGURE 4. (A) Northern Calcareous Alps (NCAs) with the different nappes and indication for the locations of (B,C). (B) Simplified cross-section through the northern part of the NCAs, illustrating the successive thrusting (modified from Leitner and Spötl (2017)). (C) Schematic sketch of Mount Hochstaufen illustrating the different lithologies of the Tirolic unit (left) and simplified tectonic map around Mount Hochstaufen [modified from Schweigl and Neubauer (1997)], and (D), the main hydraulic properties of the lithologies of the Tirolic nappe (left) as well as a brief description of the succession of the unit below the Tirolic towards the basement (right) (Leitner and Spötl, 2017)
The stratigraphic sequence of the Staufen Massif consists in units from the lower to middle Triassic with lithologies mainly dominated by limestones and dolomites. Figures 4C, D show the lithologies, along with their hydraulic properties (Bayerisches Landesamt für Umwelt, last accessed in January 2021) The higher part of the Staufen Massif consists of Wetterstein limestone (Tollmann, 1976). This formation, along with the Dachstein formation outcropping in the southern and eastern NCAs, is the most important karst host rock in the NCAs.
For the analytical modelling, we consider an average altitude of 1,500 m.a.s.l and an average focal depth of 1,000 m.b.s.l. The altitude of a perennial karstic spring located 4.5 km west of Hochstaufen is taken as the base water level. The horizontal distribution of epicenters simplified as a circle with a radius of 5 km is also considered.
4.2 Muotathal and Riemenstalden, Switzerland
In August 2005, the regions of Muotathal and Riemenstalden in central Switzerland experienced a succession of events over a 12-h period after 4 days of heavy rain with a total precipitation of ∼200 mm, with a maximum intensity of ∼75 and 90 mm/day on the 21 and 22 of August. The return period of such intensive rainfall periods is approximately 300 years (Husen et al., 2007). A total of 47 earthquakes were recorded and distributed in two clusters (regions of Muotathal and Riemenstalden). The focal depths are between 0 and 5 km. Muotathal and Riemenstalden are both located in the Helvetic unit in central Switzerland and are part of the Axen nappe (Pfiffner, 2011). The Axen nappe consists of a formation from the Triassic to the Paleogene. In the area of interest, the lithologies are dominated by Cretaceous limestones. Due to extensive thrusting, the units are stacked on top of each other, leading to an important thickness of Cretaceous units Figures 5A and B (Schmid et al., 2004).
A major thrust delimits the Axen nappe with the Drusberg nappe close to the villages of Muotathal and Riemenstalden. Numerous fault lineaments are visible on the geological map and show an N-S general trend as well as minor lineaments showing a WNW-ESE strike. Some of these faults show distinct horizontal offsets, indicating a strike-slip environment. Data provided by the World Stress Map (Reiter et al., 2016) suggest a ∼SE-NW orientation of the maximum horizontal stress for this region.
With a total length of more than 250 km of galleries (Wildberger et al., 2010), the region is a well-known karstic area. The Hölloch cave and Silberen system are part of this karstic network and are located east of the village of Muotathal. Karst developed mostly in the upper Cretaceous, in the Urgonian and Seewen limestones, and as a result of thrusting, the thickness of these karstified rocks can be doubled or tripled (Figure 5C) (Wildberger et al., 2010). The lithologies and their hydraulic properties are presented in Figure 5D.
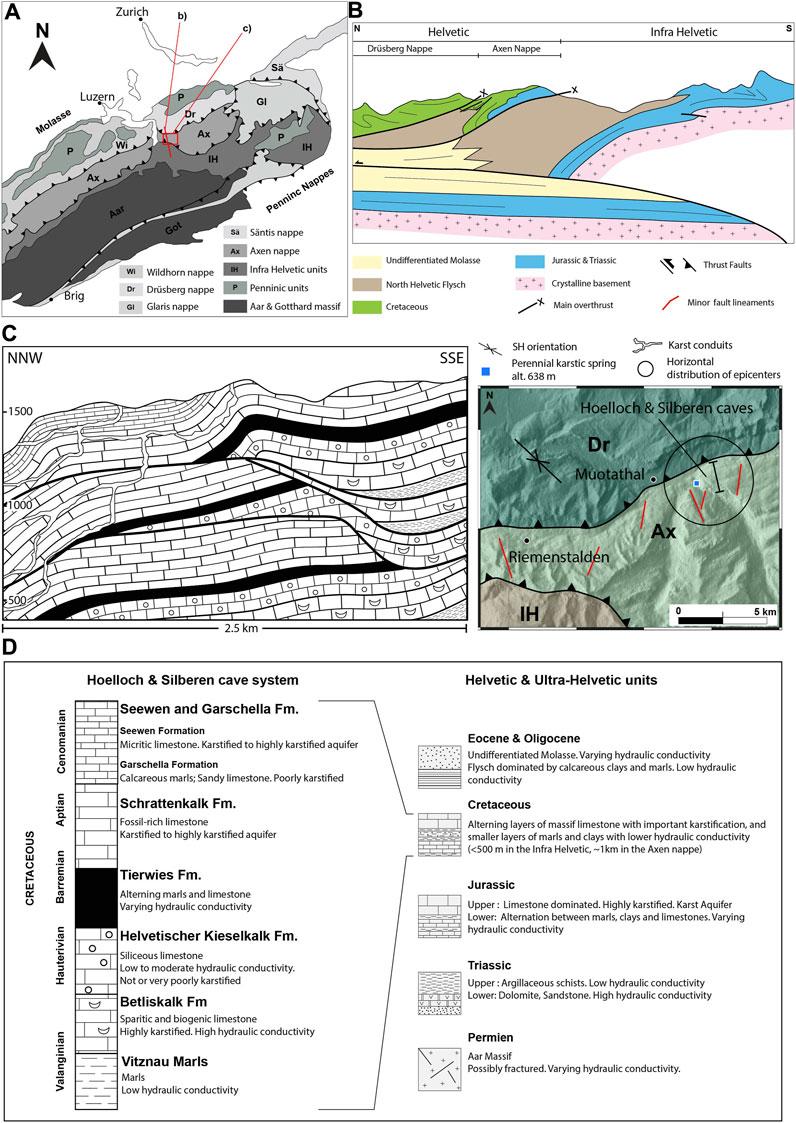
FIGURE 5. (A) Tectonic map around central Switzerland and the different nappes and indications for (B) and (C). (B) Cross-section through the Helvetic and Infra Helvetic near the locations of Muotathal and Riemenstalden (modified from Pfiffner (2011)). (C) (left) Schematic of the Hoelloch and Silberen cave system and (right) a simplified tectonic map around Muotathal and Riemenstalden (modified from the Swiss Tectonic Map, Swiss Federal Office for Topography, swisstopo). (D) Lithologies and associated hydraulic properties of the different Helvetic and Ultra Helvetic units (Nagra, 1996).
For the analytical modelling, we consider an average altitude of 1,400 m.a.s.l. and an average focal depth of 2,000 m.b.s.l. The altitude of the perennial Schlichenden karstic spring, the outlet of the Hölloch cave system, is taken as the base water level. The horizontal distribution of epicenters simplified as a circle with a radius of 2.5 km is also considered.
4.3 Avignon region, France
In south-eastern France, in the Gard department, a catastrophic storm occurred in September 2002. In 2 days, accumulated precipitation reached ∼400 mm in Pujaut Basin, near Avignon, and even reached 650–700 mm further to the north, near the city of Alès. Seismicity increased during the 2 weeks following the storm. Eleven earthquakes were recorded within a temporary network centered around the Pujault Basin, and two events were located outside the network but still relatively close in distance. The focal depth mostly lies between 0 and 10 km (Rigo et al., 2008).
The Gard department located in the Provence region between the Alps in the northeast and the Pyrenees in the southwest. The regional geology consists of a sedimentary cover of Mesozoic and Cenozoic ages, varying in thickness from 2 to 7 km (Figures 6A and B) (Rigo et al., 2008). Three major faults exist in the area of interest: the Nîmes Fault, the Pujaut fault, and the Roquemaure fault. The Nîmes fault has an NE-SW orientation and a senestral strike-slip movement (Schlupp et al., 2001). The Pujaut fault, parallel to the Nîmes fault, corresponds to a normal fault steeply dipping towards the north and is the result of the Oligocene extension regime (Jolivet and Faccenna, 2000). The northern compartment of the Pujaut fault results in a depression called the Pujaut basin or graben. The Roquemaure fault is considered inactive or even non-existent (Rigo et al., 2008). Further east, the Salon-Cavaillon fault system strikes SE-NW and has a normal component possibly combined with a dextral sense of movement (Terrier et al., 2007). The present-day maximum horizontal stress orientation is thought to be N-S to NW-SE (Jolivet and Faccenna, 2000).
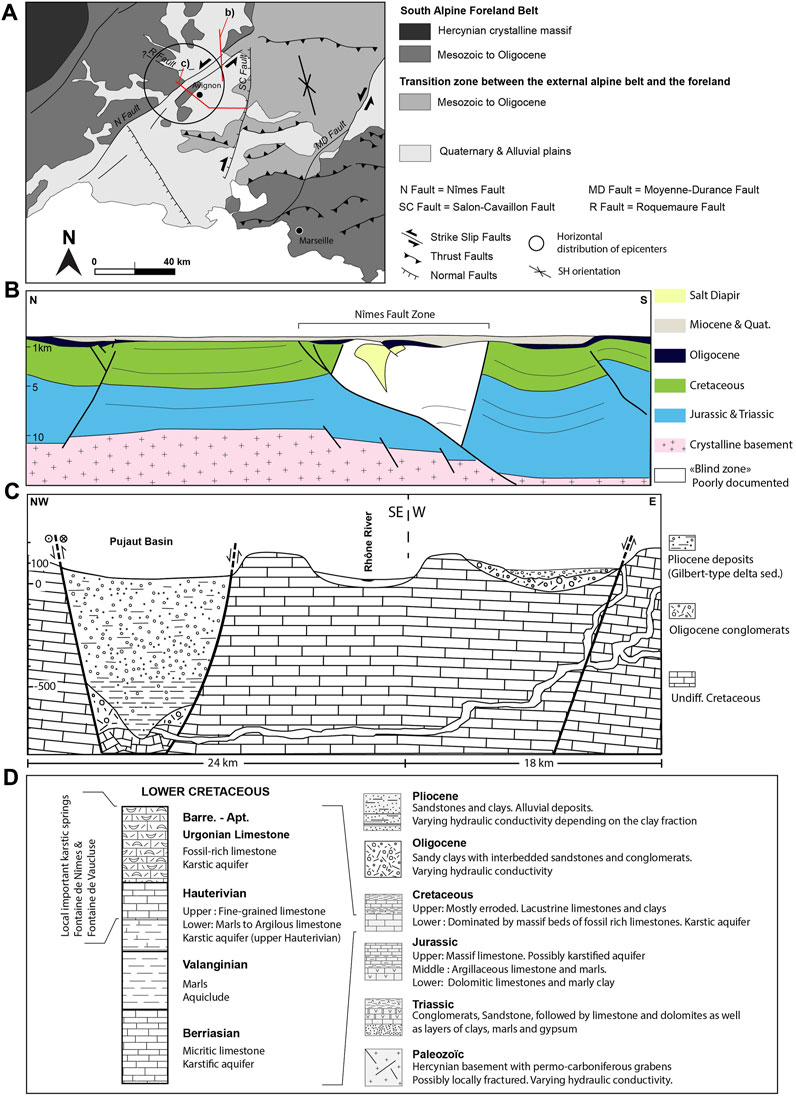
FIGURE 6. (A) Tectonic map of the Provence area with the major deformation structures and location of (B) and (C). (B) Simplified cross-section over the Nîmes fault zone. (C) Schematic of the Pujaut Basin and the development of the karst network during the Messinian crisis. (D) Lithologies and their hydraulic properties.
The area is well known for its deep karstic conduits that developed during the Messinian crisis (Julian and Nicod, 1984; Audra et al., 2004). Exploration by a remotely operated vehicle (ROV) in the Fontaine-de-Vaucluse brought evidence of former epiphreatic karst conduits down to 100 m below sea level (Bayle and Graillot, 1987). From seismic data, drilling, and field observations, evidence shows that canyons are lying approximately 1,000 m below sea level near the city of Avignon (Clauzon, 1982; Gargani, 2004). At the end of the Messinian crisis, the canyons were flooded and filled with terrigeneous sediments Clauzon (1982). Figure 6C shows the relationship between the deep karstic system and the ancient canyons and Figure 6D illustrates the lithologies in the area of interest.
For the analytical modelling, we consider an average altitude of 200 m.a.s.l. and an average focal depth of 3,000 m.b.s.l. The altitude of the Rhone River near Avignon is taken as the base water level. The horizontal distribution of epicenters simplified as a circle with a radius of 19 km is also considered.
4.4 Analytical modelling
We quantify the effect of each mechanism on fault stability for the different case studies by considering a semi-infinite environment with initial stress conditions of σ1, σ3 and the initial pore pressure pinit at depth z, with cohesion c and internal friction coefficient μ. The environment is saturated at depth and unsaturated towards the surface with an unsaturated layer of thickness zunsat (see Figure 7). Further considered is a circular area on the surface of the saturated layer of radius r being loaded with pressure P, which is inferred from the rain intensity i.
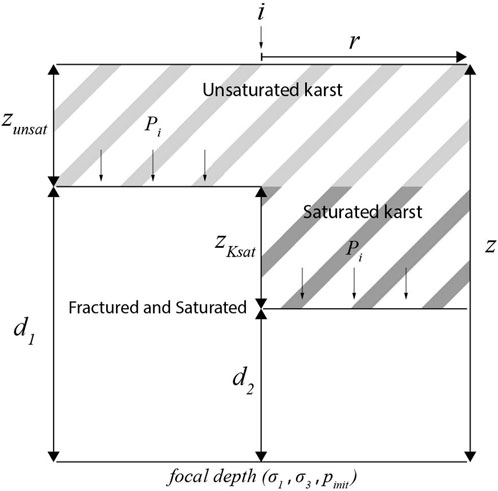
FIGURE 7. Considered environment for the analytical modeling of pressure front diffusion in a karstic area. A two layered semi-infinite environment of thickness z with initial stress conditions of σ1, σ3 and the initial pore pressure pinit at depth z. On top of this semi-infinite environment, a circular area of radius r is loaded with water from the precipitation of intensity i. Pi corresponds to the pressure induced from the load. d1 and d2 correspond to the distance the pore pressure front induced by Pi has to migrate to reach focal depth and depends on the presence or not of a saturated karstic network below the permanent water table. Arrows indicate the layer interface at which the onset of pore pressure diffusion takes place. See text for further explanations.
Values for z, zunsat, r, and P are based on the case studies and initial stress conditions are estimated using average lithostatic and hydrostatic pressure gradients of 0.0225 and 0.0098 MPa/m, respectively. The depth z is inferred from the focal depth, the unsaturated thickness zunsat is calculated by subtracting the altitude of local springs from the average altitude of the area. The radius r corresponds approximately to the horizontal spatial distribution of seismicity. The pressure P is inferred from the rain intensity. In the case of a direct hydrogeologic connection, the pressure is quasi-equivalent to ΔH (Eq. 8). In the case that there is no hydrogeologic connection, the pressure load corresponds to the additional weight of the infiltrated water. For the stress conditions, we consider a strike-slip environment where σH = σ1, which is at least equal to σv, and σh = σ3, which is set to the minimum possible value to have a CFS < 0, meaning that rupture has not yet occurred. Cohesion c is thought to be negligible and a value of 0.6 for the internal friction coefficient μ is taken.
Input values for the analytical modelling are shown in Table 1. Precipitations are inferred from the case studies as shown in Figure 9. Note that we slightly simplify the rainfalls for the analytical modelling by considering only two rainfall events for each case study (i1 and i2). The storage coefficient S is set according to the observed water level fluctuations in the karstic network reported in the literature, which range between a few tens of meters (Lesparre et al., 2017) to several hundreds of meters (Jeannin, 2001). For Muotathal, a water level increase of 540 m for 200 mm of rain corresponds to a storage coefficient of 0.0004 (Eq. 8). As Muotathal is the only case study in which this value can be calculated, we decided to use a more conservative value of S = 0.001, which corresponds to a level fluctuation of 100 m for 100 mm of infiltrated water.
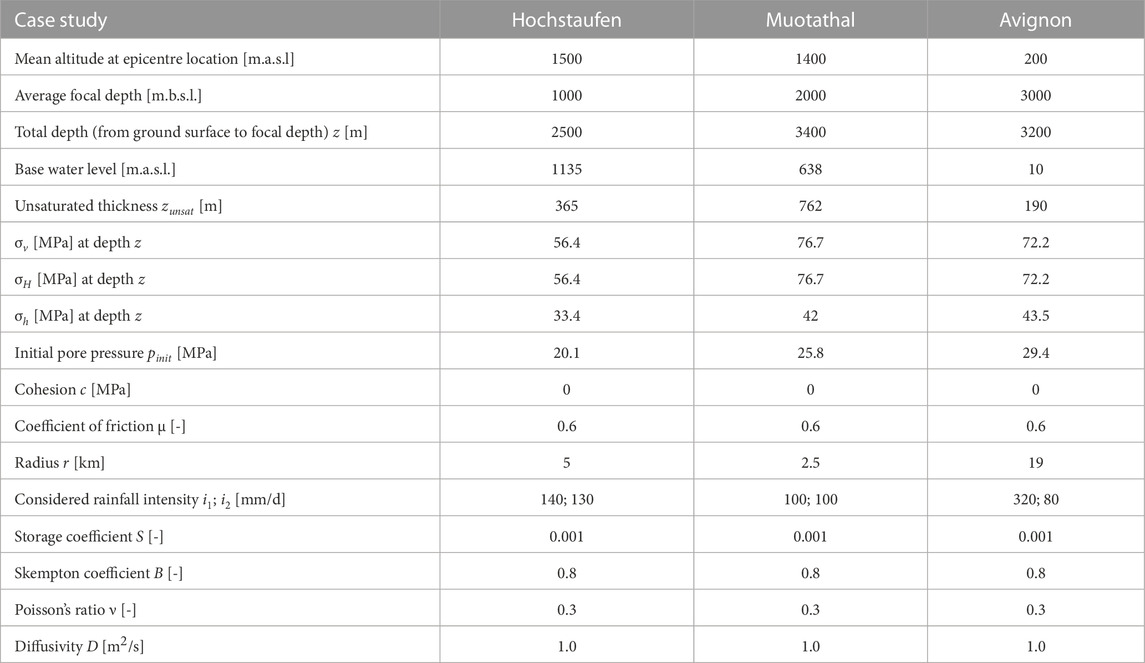
TABLE 1. Input values for the analytical modelling. The initial stress conditions are calculated for the focal depth.
Using Eqs. 1–12 and data from Table 1, changes in pore pressure are calculated, as well as changes in the Coulomb Failure Stress (CFS). Results are separated between direct and delayed effects. Direct effects include changes in pore pressure resulting from the hydraulic head increase, as well as poroelastic deformation resulting from an increasing vertical stress, while the delayed effect is a pore pressure increase resulting from the diffusion process.
For poroelastic computations, we assume undrained conditions. We consider high rainfall intensity events, which implies that the drainage capacity of the karstic network is overcome during the rainfall. This results in a rapid increase in the hydraulic head within the karstic channels. For the delayed effect, simplified drained conditions are considered and represented by a linear decrease occurring over 12 days from the maximum pore pressure increase induced by ΔH at time t = 0 to 0 at time t = 12 days. The diffusion front is considered to migrate from the bottom of the karstic network towards focal depths. The distance d varies according to the extent of the karstic network below the water table. Two different values are tested. The first one, d1, considers that the pressure front starts migrating from the top of the saturated thickness, meaning that the distance d1 corresponds to the total depth z minus the unsaturated thickness zunsat. The second, d2, considers a saturated karstic network with a thickness zKsat of 1,000 m, meaning that the distance d2 corresponds to the total depth z minus the unsaturated thickness zunsat minus zKsat (Figure 7).
Note that the analytical modelling aims to compare the mechanisms with each other, not to conduct a sensitivity analysis of the different parameters.
5 Results and discussion
Figure 8 shows the impact of heavy rainfall on pore pressure through a direct hydrogeologic connection, poroelastic deformation, and diffusion. For the first two processes, the maximum increase occurs rapidly after the precipitations, reaching values of the order of MPa for the direct connection and only kPa for the poroelastic deformation. Pore pressure increase resulting from the diffusion process varies over two orders of magnitude, depending on the distance traveled by the diffusion front. The maximum increase is delayed in regards to the precipitation event. A successive rainfall, even though of smaller intensity, results in an even higher pore pressure change due to the already accumulated water in the system. Thus, not only is the intensity of a given rain event important but also the history of precipitation preceding the event.
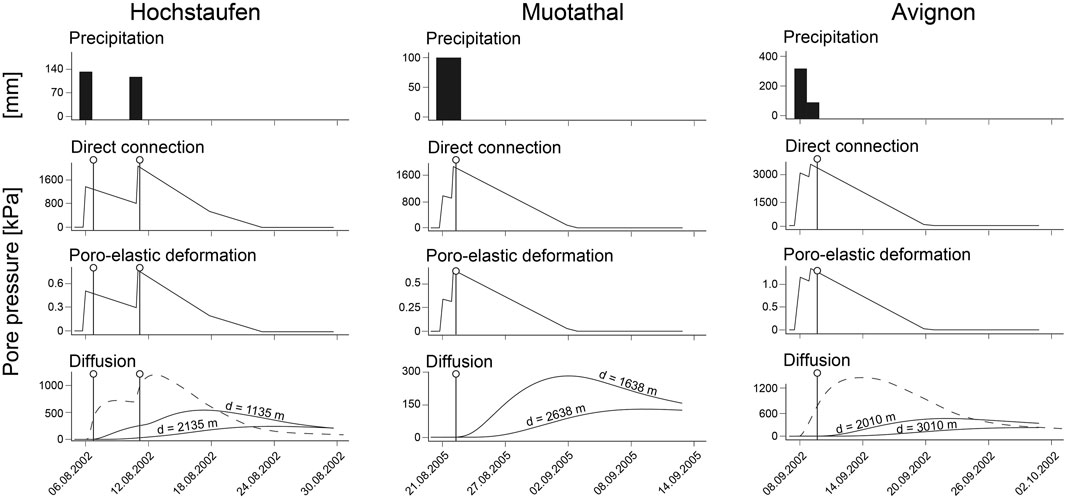
FIGURE 8. Considered rainfall intensity for the analytical modelling and the evolution of pore pressure changes over time for the different mechanisms, considering a linear decrease over 12 days for the system to drain the infiltrated water. Lines with an open circle at the top represent the onset of seismicity. The dashed lines in the first and third case studies show the response in pore pressure considering a hydraulic diffusivity of 10 m2/s and the shorter distance for both cases (1,135 and 2,010 m, respectively).
Table 2 shows the maximum values of pore pressure increase as well as their corresponding CFS changes. Changes in CFS are positive for each process but have different orders of magnitudes: from kPa for the vertical stress increase and the poroelastic deformation, towards the order of MPa when considering the diffusion process, and clearly in the order of MPa for the direct connection.
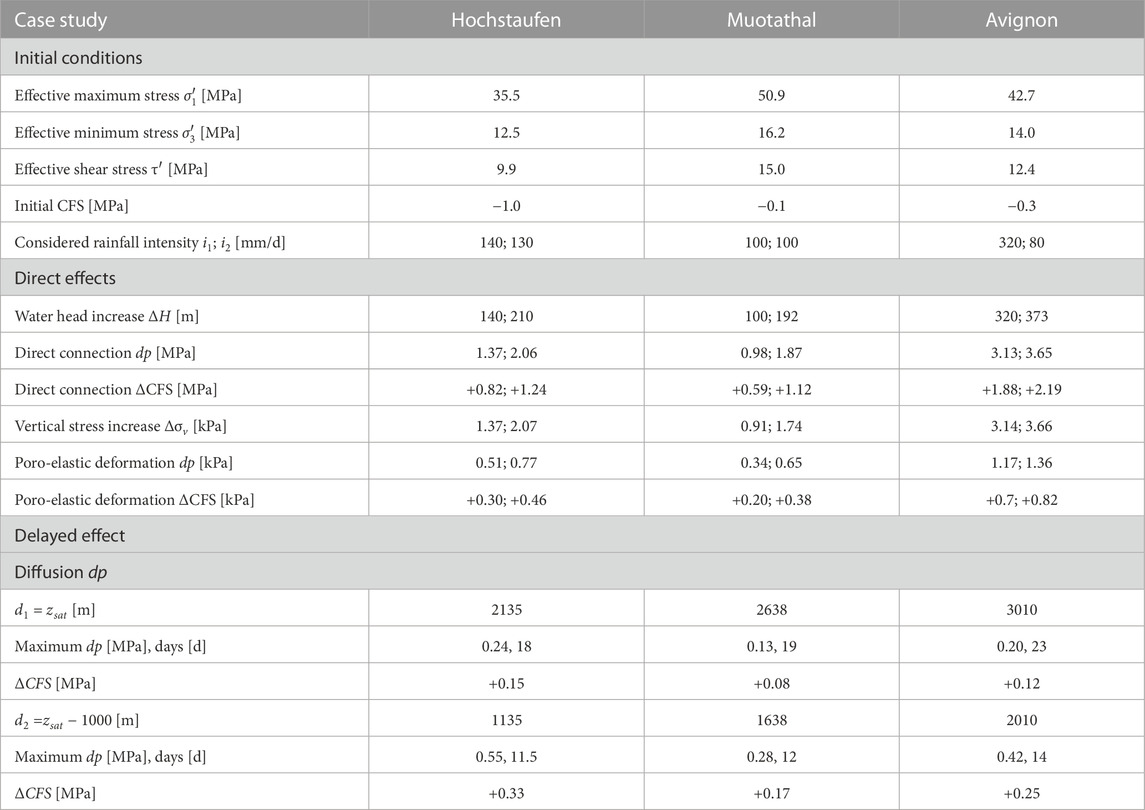
TABLE 2. Estimated initial conditions using the average lithostatic and hydrostatic pressure gradients and the results of the direct and delayed effects and their impact on the CFS.
Based on the timing of the beginning of seismicity at the three test sites with regard to the increasing pore pressure resulting from the different mechanisms, we suggest that seismicity is highly influenced by the direct effect of an increasing hydraulic gradient (direct connection) for all three cases, as seismicity occurs very shortly after the maximum rain intensity. However, the diffusion process can still be considered: setting a higher diffusivity and a smaller distance drastically impacts the response of pore pressure by increasing the amplitude of the change and reducing the time for the pressure front to reach the focal depth. Thus, by adjusting the diffusivity and distance, the response of the diffusion process could also correspond to the beginning of seismicity (dashed line in Figure 8). We propose that for the case of Muotathal and Avignon, the direct connection dominates the triggering mechanisms, as rupture occurs only hours after the maximum pore pressure is reached (1.8 and 3.65 MPa, respectively). For Hochstaufen, we suggest a coupled mechanism between the direct connection and the diffusion process, in which the pore pressure at the bottom of the karstic network induced by the direct connection (up to 2 MPa) diffuses towards the focal depth and triggers seismicity approximately 1 day after the rainfall, when the pore pressure increases 0.5 and 0.8 MPa for the first and second rainfall, respectively.
For the three investigated case studies, authors have determined time lags between the rainfall event and the seismicity. These time lags are often used for comparison when discussing meteorological-triggered seismicity. As Figure 9 shows, these time lags do not correspond to the same time period in each case. For Germany, the time considered is between the onset of the first important rainfall and the maximum increase in seismicity 10 days later. For Switzerland, it is the time between the onset of rain and the beginning of seismicity, and for France, it is the time after the end of the storm and the beginning of seismicity. The case of Germany (Kraft et al., 2006), however, shows that seismicity increases directly after the first important rainfall on the sixth of August. After the second rainfall, on the 11th of August, seismicity increases again to reach its maximum around the 16th of August. For Switzerland, the beginning of the rainfall is considered to be 4 days before the beginning of seismicity; however, Figure 9 clearly shows that more than 80% of the total precipitations fell during the last 2 days. Considering the same time period for each case study, for example, the time between the onset of heavy rainfall and the beginning of seismicity, leads to time lags that are comparable, between 24 and 48 h. These time lags are well below the times observed for the delayed effects (Table 2), but as already mentioned, a change in diffusivity and distance can lead to comparable time lags. Considering the direct effects, one would expect seismicity to occur simultaneously with peak rain intensity; however, a time lag could result from the time needed for the water to be drained towards the water table. A combination of both, the effect of a direct hydraulic connection towards an important depth followed by the diffusion process over a relatively small distance, could also explain a smaller time lag.
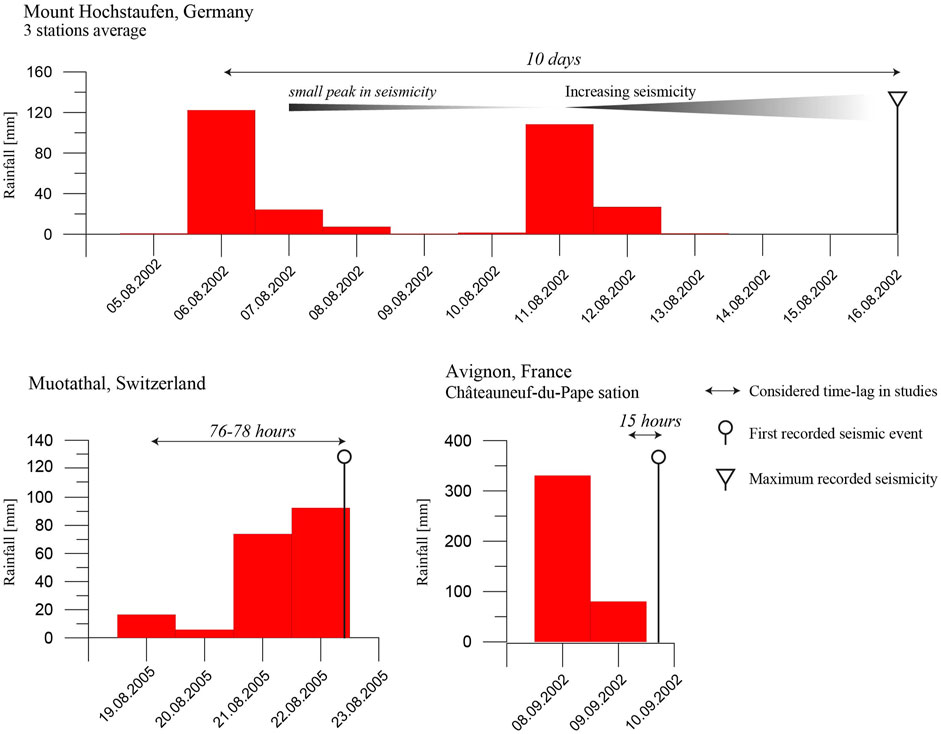
FIGURE 9. Abnormal rainfall event for Germany, Switzerland, and France. The maximum recorded seismicity for Hochstaufen (Germany), the first recorded events for Muotathal (Switzerland) and Avignon (France), and the time lag considered by the authors of the case studies are indicated.
However, setting time lags between the beginning of rainfall and seismicity is not optimal. As each region has its own drainage capacity, depending on the amount of soil and epikarst thickness, the maximum head increase will not be reached at the same time after rainfall. To better evaluate the impact of each mechanism on the stability of the fault for each case study and to simplify comparison, the considered time lag should be taken between the maximum water head increase and the beginning of seismicity. Yet, such data are often difficult to collect, but the time at which a nearby karstic spring reaches its maximum discharge could be taken as a proxy, as the discharge is directly related to the hydraulic head.
The case of Muotathal offers good data to estimate the fluid pressure when seismicity started using spring discharge values and hydraulic head variation observations (Figure 10). The region presents a karstic spring at 635 m.a.s.l. draining the Hoelloch and Silberen karstic system (Jeannin, 2001). During the heavy rainfall of 2005, a cave located 540 m above the permanent water table was flooded (Miller, 2008), implying an increase of approximately 5.4 MPa of fluid pressure. The normal water table fluctuation due to seasonality is between 40 m near the spring to approximately 250 m at a 5,200 m distance from the spring (Jeannin, 2001), meaning a maximum variation of approximately 2.5 MPa between low waters and high waters during a hydrological year. Consequently 5.4 MPa corresponds to an increasing pressure of 2.9 MPa above the maximum usual high water pressure.
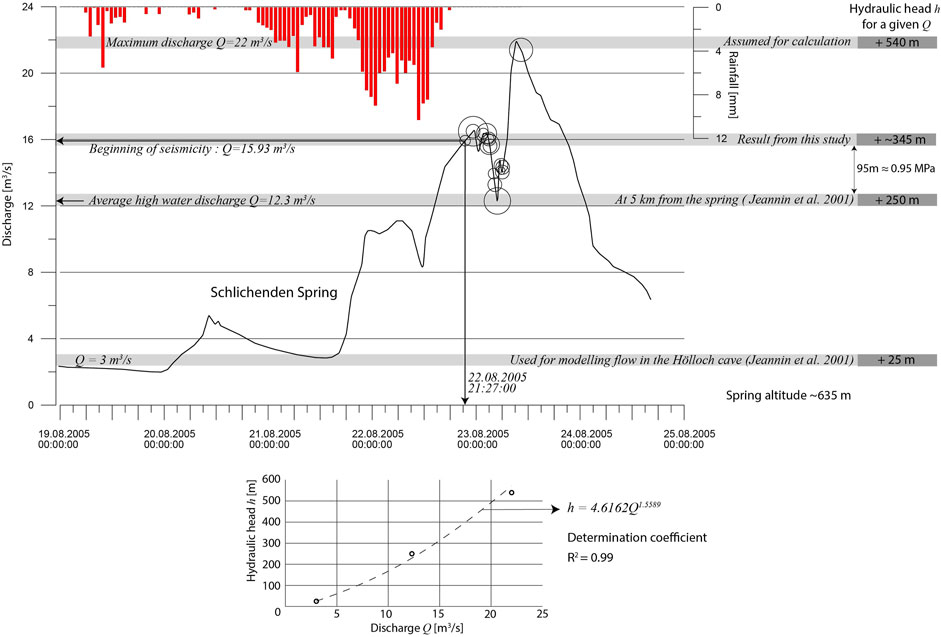
FIGURE 10. Schlichenden spring hydrograph, precipitations (red bars), and observed seismicity at specific discharge values (circles on the hydrograph). The flow rates corresponding to specific water levels are indicated in grey on the right side of the figure. The water levels 25, 250, and +540 m are used for the elaboration of the rating curve (bottom) to obtain a relationship between the flow rate Q and the water level h. The equation of the curve is used to calculate the water level at a given discharge. Additionally, the determination coefficient R2 is shown.
The time at which the cave located at 540 m above the permanent spring was flooded is unknown and cannot be associated with a discharge value at the Schlichenden Brunnen. However, assuming that this cave was flooded during the maximum discharge rate at 22 m3/s (Figure 10), and that during the average high waters the level is approximately 250 m at 5′200 m from the spring, with a discharge of 12 m3/s (Swiss Federal Office for the Environment, 2017), it means that the critical value of the hydraulic head, i.e., the level at which hydroshear slip is enhanced in the faulted system, is between 250 and 540 m above the low water table.
Considering the data from Muotathal (Husen et al., 2007), seismicity starts when the discharge value reaches 16 m3/s (Figure 10). To obtain an approximate estimation of the water column at this discharge rate, an experimental curve using three levels has been calculated. Using the values of 540, 250, and 25 m with, respectively, the discharge values of 22, 12, and 3 m3/s (values 25 m and 3 m3/s are taken from Jeannin (2001)) the following experimental function is found:
For a discharge value of 16 m3/s, and according to the relationship shown in Eq. 14, the water level would be approximately 345 m above the usual low water level and consequently 95 m above the high water level (250 m) at 5′200 m from the spring. In terms of increasing fluid pressure, it represents an increase of 0.95 MPa. This result assumes that during the maximum discharge of 22 m3/s, the groundwater level was at its maximum at 540 m above the altitude of the spring (635 m), which means that this result is a minimum. It is important to note that this value is an estimation based on a relatively poorly constrained rating curve (three values). Supplementary discharge values corresponding to specific groundwater levels are necessary to improve this estimation. However, according to this simple analysis, seismicity starts when the critical value of +0.95 MPa is reached, which is of the same order of magnitude as the results obtain from the analytical modelling, in which seismicity occurs following a pore pressure increase of ≈1.8 MPa.
The literature suggests that the necessary stress changes to trigger seismicity on pre-existing faults can be as low as 0.01–0.1 MPa (Roeloffs, 1988; King et al., 1994; Lockner and Beeler, 1999; Saar and Manga, 2003; Hainzl et al., 2006). The upper bound of these values (10–100 kPa) is found in studies of triggered seismicity resulting from wastewater injection (e.g., Keranen et al., 2014; Stokes et al., 2023). Lower values (1–10 kPa) are similar to stress changes resulting from Earth tide effects (e.g., Tolstoy et al., 2002; Scholz et al., 2019; Zaccagnino et al., 2022). However, although a correlation has been demonstrated between Earth tides and earthquakes globally (Métivier et al., 2009), the high frequency of Earth tides is usually inconsistent with the occurrence of seismicity locally, as demonstrated by Figure 4 in Hainzl et al. (2013). In that sense, we suggest that changes of the order of kPa are insufficient to trigger seismicity, which implies that changes in vertical stress as well as poroelastic deformation due to the increasing load of water can hardly be considered as the triggering process for rain-induced seismicity.
Nonetheless, modelling of seismicity in karstic regions has been performed previously, especially for the case of Hochstaufen, Germany (Hainzl et al., 2006, 2013). The authors found that seismicity was very well correlated with heavy rainfalls but values found to trigger seismicity were of the order of kPa, which is three orders of magnitude lower than the present study. The major difference between the results of Hainzl et al. (2006) and our study principally lies in the difference in magnitude of the input signal used to model pore pressure variation at depth. For the diffusion process, we suggest that the pressure step increase is equivalent to the increasing hydraulic head in the karst conduits (100 m of water level increase ≈1 MPa of pore pressure increase) and that the distance the front has to migrate is the distance from the bottom of the karstic network (which can be several hundreds of meters below the surface) towards the focal depth. Hainzl et al. (2006) use the precipitation data as input signal (mm of water) and the distance the front has to migrate is between the surface and focal depth. The difference in magnitude of the input signal explains the major difference between our results and theirs. Additionally, considering a shorter distance in our study also influences the magnitude of pore pressure change (greater changes at shorter distances). The study by Hainzl et al. (2013) considers possible water accumulation. They observe that an amplification factor of the rainfall signal of at least 10 (simulating water accumulation in open fractures) improves their model. These results corroborate the idea that water accumulation within karstic channels must be considered when modelling seismicity in karstic regions. We suggest that the amplification factor of the rainfall signal should be at least 1,000 to correspond to the observed hydraulic head increase in karst conduits following important rainfalls.
6 Conclusion
From the simplified analytical model tested on three different case studies, neither the increasing vertical load nor the pore pressure increase due to the poroelastic deformation are considered to be sufficient to trigger seismicity following heavy rainfall. Considering the channelling effect of a karst network in direct connection with focal depth, the effect of the water table increasing by several tens of meters rapidly impacts the pore pressure in the range of MPa. A small-time lag between the beginning of the rainfall and seismicity could be explained by the time needed for the system to drain water towards the water table. If the karstic network is not in connection with focal depth, the diffusion process takes over and changes in pore pressure are attenuated over time and distance, but still possibly reaching the range of MPa.
Figure 11 illustrates the final conceptual model and the most important parameters to consider, such as focal depth, water table elevation, and the extent of the karstic network below the water table. To trigger seismicity after an intense rainfall event in a karst environment, we suggest that either the karst network is in direct hydrogeologic connection with focal depth (Figure 11A) or is relatively close to it (Figure 11B), such that the pressure front rapidly reaches the focal depth due to pressure diffusion and the amplitude in pore pressure change is sufficiently large. To accommodate for a relatively small time lag, we propose that the superficial layer is considered to have a possible delaying effect depending on its structure and composition.
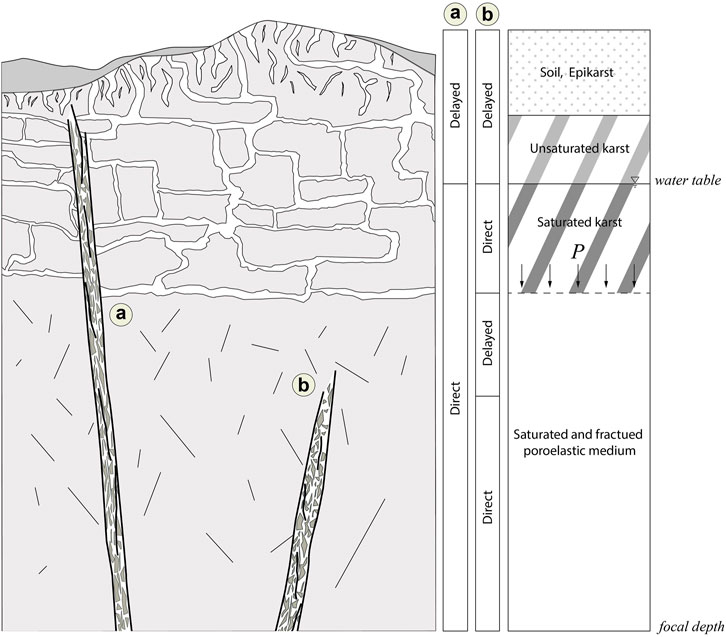
FIGURE 11. Final conceptual model considering the different layers and their impact on the pressure propagation towards the focal depth, whether the pressure is rapidly (direct effect) or slowly (delayed effect) transmitted towards it. (A) Direct connection between the karst network and the fault zone. Drainage of the superficial layers (soil, epikarst, and unsaturated karst) may act as a delaying factor until the water reaches the water table, after which the effect is quasi-instantaneous at the focal depth if the fault acts like a conduit. (B) No direct hydrogeologic connection between the fault zone and the karst network. The superficial layers may act as a delaying factor as in (A). Once the water reaches the water table, the effect of the increasing water column is instantaneous at the bottom of the karst network. From there, the diffusion process takes over and acts as a delaying factor. Once the pore pressure front reaches the fault zone, which possibly acts like a conduit, pressure is transmitted rapidly towards the focal depth.
We suggest that the mechanisms behind seismicity following heavy rainfalls in karstic regions can be inferred from the observed time lag between the maximum discharge rate and the beginning of seismicity: no time lag to a time lag of a few hours supposes a direct connection between the karstic network and the focal depth, whereas a time lag from a few hours to a few days suggests a coupled solution of rapid fluid pressure diffusion towards the bottom of the karstic network followed by the diffusion process prograding towards the focal depth. Based on our analysis, we conclude that the mechanisms behind the seismicity of the three case studies are mainly driven by the direct connection, especially in the cases of Muotathal and Avignon, where seismicity occurs only hours after the end of the precipitations, suggesting well-developed and well-connected karst networks for both sites. For Mount Hochstaufen, the direct effect might be coupled with the diffusion process as the beginning of seismicity is delayed for a day after the maximum rain intensity.
Although the pore pressure diffusion process alone is not ruled out as a mechanism, we advocate that the important hydraulic head variation in a karstic network and the extent of the depth of the network are the most important parameters to consider. Hence, having a deeper comprehension of the geological and hydrogeological setting is essential.
Data availability statement
The original contributions presented in the study are included in the article/Supplementary Material, further inquiries can be directed to the corresponding author.
Author contributions
LP carried out the analysis and wrote the manuscript with support and verification from BV and GP. All authors contributed to the article and approved the submitted version.
Funding
This work is part of the Jurahydrotectonic project conducted at the University of Neuchâtel and financially supported by the Swiss Federal Office of Topography (swisstopo) and the Swiss Federal Office of Energy (OFEN). Open access funding by University of Neuchâtel.
Conflict of interest
The authors declare that the research was conducted in the absence of any commercial or financial relationships that could be construed as a potential conflict of interest.
Publisher’s note
All claims expressed in this article are solely those of the authors and do not necessarily represent those of their affiliated organizations, or those of the publisher, the editors and the reviewers. Any product that may be evaluated in this article, or claim that may be made by its manufacturer, is not guaranteed or endorsed by the publisher.
Supplementary material
The Supplementary Material for this article can be found online at: https://www.frontiersin.org/articles/10.3389/feart.2023.1234856/full#supplementary-material
References
Anderson, E. M. (1951). The dynamics of faulting and dyke formation with applications to britain. 2 edn. Edimburgh: Oliver & Boyd.
Audra, P., Mocochain, L., Camus, H., Gilli, r., Clauzon, G., and Bigot, J. Y. (2004). The effect of the messinian deep stage on karst development around the mediterranean sea. Examples from southern France. Geodin. Acta 17, 389–400. doi:10.3166/ga.17.389-400
Bayle, B., and Graillot, D. (1987). Fontaine de Vaucluse: compte-rendu hydrogéologique de l’opération Spélénaute du 2 août 1985. Karstologia revue de karstologie de spéléologie physique 9, 1–6. doi:10.3406/karst.1987.2150
Beeler, N. M., Simpson, R. W., Hickman, S. H., and Lockner, D. A. (2000). Pore fluid pressure, apparent friction, and Coulomb failure. J. Geophys. Res. solid Earth 105, 25533–25542. doi:10.1029/2000jb900119
Bettinelli, P., Avouac, J.-P., Flouzat, M., Bollinger, L., Ramillien, G., Rajaure, S., et al. (2008). Seasonal variations of seismicity and geodetic strain in the Himalaya induced by surface hydrology. Earth Planet. Sci. Lett. 266, 332–344. doi:10.1016/j.epsl.2007.11.021
Birhanu, Y., Wilks, M., Biggs, J., Kendall, J. M., Ayele, A., and Lewi, E. (2018). Seasonal patterns of seismicity and deformation at the Alutu geothermal reservoir, Ethiopia, induced by hydrological loading. J. Volcanol. Geotherm. Res. 356, 175–182. doi:10.1016/j.jvolgeores.2018.03.008
Bonacci, O. (1987). “engKarst hydrology: with special reference to the Dinaric karst,” in Springer series in physical environment. 1st ed (Berlin: Springer-Verlag), 2.
Bonacci, O. (1993). Karst springs hydrographs as indicators of karst aquifers. Hydrological Sci. J. 38, 51–62. doi:10.1080/02626669309492639
Bragato, P. L. (2021). Systematic triggering of large earthquakes by karst water recharge: statistical evidence in northeastern Italy. Front. Earth Sci. 9, 1–11. doi:10.3389/feart.2021.664932
Braunmiller, J., Nábělek, J. L., and Tréhu, A. M. (2014). A seasonally modulated earthquake swarm near Maupin, Oregon. Geophys. J. Int. 197, 1736–1743. doi:10.1093/gji/ggu081
Byerlee, J. (1978). Friction of rocks. Pure Appl. Geophys. PAGEOPH 116, 615–626. doi:10.1007/BF00876528
Caine, J. S., Evans, J. P., and Forster, C. B. (1996). Fault zone architecture and permeability structure. Geology 24, 1025–1028. doi:10.1130/0091-7613(1996)024<1025:fzaaps>2.3.co;2
Carslaw, H. S., and Jaeger, J. (1959). Conduction of heat in solids. Second edition. Oxford: Clarendon Press.
Clauzon, G. (1982). Le canyon messinien du Rhone; une preuve decive du desiccated deep-basin model (Hsue, Cita and Ryan, 1973). Bull. Soc. Geol. Fr. S7-XXIV, 597–610. doi:10.2113/gssgfbull.S7-XXIV.3.597
Costain, J. K., and Bollinger, G. A. (2010). Review: research results in hydroseismicity from 1987 to 2009. Bull. Seismol. Soc. Am. 100, 1841–1858. doi:10.1785/0120090288
Diehl, T., Kraft, T., Kissling, E., and Wiemer, S. (2017). The induced earthquake sequence related to the St. Gallen deep geothermal project (Switzerland): fault reactivation and fluid interactions imaged by microseismicity. J. Geophys. Res. solid Earth 122, 7272–7290. doi:10.1002/2017JB014473
Ellsworth, W. L. (2013). Injection-induced earthquakes. Science 341, 1225942–1225948. doi:10.1126/science.1225942
Evans, J. P., Forster, C. B., and Goddard, J. V. (1997). Permeability of fault-related rocks, and implications for hydraulic structure of fault zones. J. Struct. Geol. 19, 1393–1404. doi:10.1016/S0191-8141(97)00057-6
Evans, K. F., Zappone, A., Kraft, T., Deichmann, N., and Moia, F. (2012). A survey of the induced seismic responses to fluid injection in geothermal and CO 2 reservoirs in Europe. Geothermics 41, 30–54. doi:10.1016/j.geothermics.2011.08.002
Faulkner, D. R., Jackson, C. A., Lunn, R. J., Schlische, R. W., Shipton, Z. K., Wibberley, C. A., et al. (2010). A review of recent developments concerning the structure, mechanics and fluid flow properties of fault zones. J. Struct. Geol. 32, 1557–1575. doi:10.1016/j.jsg.2010.06.009
Gargani, J. (2004). Modelling of the erosion in the Rhone valley during the Messinian crisis (France). Quat. Int. 121, 13–22. doi:10.1016/j.quaint.2004.01.020
Gupta, H. K. (2002). A review of recent studies of triggered earthquakes by artificial water reservoirs with special emphasis on earthquakes in Koyna, India. Earth-Science Rev. 58, 279–310. doi:10.1016/S0012-8252(02)00063-6
Hainzl, S., Ben-Zion, Y., Cattania, C., and Wassermann, J. (2013). Testing atmospheric and tidal earthquake triggering at Mt. Hochstaufen, Germany. J. Geophys. Res. solid Earth 118, 5442–5452. doi:10.1002/jgrb.50387
Hainzl, S., Kraft, T., Wassermann, J., Igel, H., and Schmedes, E. (2006). Evidence for rainfall-triggered earthquake activity. Geophys. Res. Lett. 33, L19303. doi:10.1029/2006GL027642
Henrich, R., and Zankl, H. (1981). Die Geologie des Hochstaufenmassives in den Nördlichen Kalkalpen. Verhandlungen der Geologischen Bundesanstalt (Wien, 31–57.
Husen, S., Bachmann, C., and Giardini, D. (2007). Locally triggered seismicity in the central Swiss Alps following the large rainfall event of August 2005. Geophys. J. Int. 171, 1126–1134. doi:10.1111/j.1365-246X.2007.03561.x
Jeannin, P. Y. (2001). Modeling flow in phreatic and epiphreatic karst conduits in the Hölloch cave (Muotatal, Switzerland). Water Resour. Res. 37, 191–200. doi:10.1029/2000WR900257
Jolivet, L., and Faccenna, C. (2000). Mediterranean extension and the africa-eurasia collision. Tectonics 19, 1095–1106. doi:10.1029/2000TC900018
Julian, M., and Nicod, J. (1984). Paléokarsts et paléo-géomorphologie néogènes des Alpes Occidentales et régions adjacentes. Karstologia revue de karstologie de spéléologie physique 4, 11–18. doi:10.3406/karst.1984.939
Kangi, A., and Heidari, N. (2008). Reservoir-induced seismicity in karun III dam (southwestern Iran). J. Seismol. 12, 519–527. doi:10.1007/s10950-008-9104-4
Keranen, K. M., Savage, H. M., Abers, G. A., and Cochran, E. S. (2013). Potentially induced earthquakes in Oklahoma, USA: links between wastewater injection and the 2011 Mw 5.7 earthquake sequence. Geology 41, 699–702. doi:10.1130/G34045.1
Keranen, K. M., Weingarten, M., Abers, G. A., Bekins, B. A., and Ge, S. (2014). Sharp increase in central Oklahoma seismicity since 2008 induced by massive wastewater injection. Science 345, 448–451. doi:10.1126/science.1255802
King, G. C., Stein, R. S., and Lin, J. (1994). Static stress changes and the triggering of earthquakes. Bull. - Seismol. Soc. Am. 84, 935–953. doi:10.1016/0148-9062(95)94484-2
Király, L. (1994). “Groundwater flow in fractured rocks: models and reality,” in 14. Mintrop Seminar über Interpretationsstrategien in Exploration und Produktion (Ruhr Universität Bochum), 1–21 Available at: https://libra.unine.ch/entities/publication/ace73156-8be9-4ed1-8cc9-631b13d1e310/details.
Király, L. (1998). Modelling karst aquifers by the combined discrete channel and continuum approach. Bull. Cent. d’Hydrogéologie l’Université Neuchâtel 15, 77–98.
Kraft, T., Wassermann, J., Schmedes, E., and Igel, H. (2006). Meteorological triggering of earthquake swarms at Mt. Hochstaufen, SE-Germany. Tectonophysics 424, 245–258. doi:10.1016/j.tecto.2006.03.044
Leitner, C., and Spötl, C. (2017). The eastern Alps. Elsevier Inc. doi:10.1016/b978-0-12-809417-4.00022-7
Lesparre, N., Boudin, F., Champollion, C., Chéry, J., Danquigny, C., Seat, H. C., et al. (2017). New insights on fractures deformation from tiltmeter data measured inside the Fontaine de Vaucluse karst system. Geophys. J. Int. 208, 1389–1402. doi:10.1093/gji/ggw446
Lockner, D. A., and Beeler, N. M. (1999). Premonitory slip and tidal triggering of earthquakes. J. Geophys. Res. solid Earth 104, 20133–20151. doi:10.1029/1999jb900205
Matonti, C., Lamarche, J., Guglielmi, Y., and Marié, L. (2012). Structural and petrophysical characterization of mixed conduit/seal fault zones in carbonates: example from the Castellas fault (SE France). J. Struct. Geol. 39, 103–121. doi:10.1016/j.jsg.2012.03.003
Métivier, L., de Viron, O., Conrad, C. P., Renault, S., Diament, M., and Patau, G. (2009). Evidence of earthquake triggering by the solid earth tides. Earth Planet. Sci. Lett. 278, 370–375. doi:10.1016/j.epsl.2008.12.024
Miller, S. A. (2008). Note on rain-triggered earthquakes and their dependence on karst geology. Geophys. J. Int. 173, 334–338. doi:10.1111/j.1365-246X.2008.03735.x
Nagra, (1996). Technischer Bericht 96-01: geosynthese Wellenberg 1996 - ergebnisse der Untersuchungsphase I und II. Tech. Ber. 96-01.
Parotidis, M., Shapiro, S. A., and Rothert, E. (2004). Back front of seismicity induced after termination of borehole fluid injection. Geophys. Res. Lett. 31, 1–5. doi:10.1029/2003GL018987
Pfiffner, O. A. (2011). Structural Map of the Helvetic Zone of the Swiss Alps including Vorarlberg (Austria) and Haute Savoie (France), 1:100 000. Geological Special Map 128 (Swiss Federal Office of Topography swisstopo).
Poulos, H., and Davis, E. (1974). Elastic solutions for soil and rock mechanics. John Wiley & Sons, Ltd.
Preisig, G., Eberhardt, E., Gischig, V., Roche, V., Baan, M., Valley, B., et al. (2016). Development of connected permeability in massive crystalline rocks through hydraulic fracture propagation and shearing accompanying fluid injection. Crustal Permeability 335, 335–352. doi:10.1002/9781119166573.ch26
Reiter, K., Heidbach, O., Müller, B., Reinecker, J., and Röckel, T. (2016). Stress map Germany 2016. doi:10.5880/WSM.Germany2016
Rice, J. R., and Cleary, M. P. (1976). Some basic stress diffusion solutions for fluid-saturated elastic porous media with compressible constituents. Rev. Geophys. 14, 227–241. doi:10.1029/RG014i002p00227
Rigo, A., Béthoux, N., Masson, F., and Ritz, J. F. (2008). Seismicity rate and wave-velocity variations as consequences of rainfall: the case of the catastrophic storm of September 2002 in the Nîmes Fault region (Gard, France). Geophys. J. Int. 173, 473–482. doi:10.1111/j.1365-246X.2008.03718.x
Roeloffs, E. A. (1988). Fault stability changes induced beneath a reservoir with cyclic variations in water level. J. Geophys. Res. 93, 2107–2124. doi:10.1029/jb093ib03p02107
Saar, M. O., and Manga, M. (2003). Seismicity induced by seasonal groundwater recharge at Mt. Hood, Oregon. Earth Planet. Sci. Lett. 214, 605–618. doi:10.1016/S0012-821X(03)00418-7
Schlupp, A., Clauzon, G., and Avouac, J. P. (2001). Mouvement post-messinien sur la faille de Nîmes: implications pour la sismotectonique de la Provence. Bull. Soc. Geol. Fr. 172, 697–711. doi:10.2113/172.6.697
Schmid, S. M., Fügenschuh, B., Kissling, E., and Schuster, R. (2004). Tectonic map and overall architecture of the Alpine orogen. Eclogae Geol. Helvetiae 97, 93–117. doi:10.1007/s00015-004-1113-x
Scholz, C. H., Tan, Y. J., and Albino, F. (2019). The mechanism of tidal triggering of earthquakes at mid-ocean ridges. Nat. Commun. 10, 2526–2527. doi:10.1038/s41467-019-10605-2
Schwarzmann, A. (1996). Untersuchung der seismischen Aktivität im Raum Bad Reichenhall. Thesis. University of Munich.
Schweigl, J., and Neubauer, F. (1997). Structural evolution of the central northern calcareous Alps: significance for the jurassic to tertiary geodynamics in the Alps. Eclogae Geol. Helvetiae 90, 303–323. doi:10.5169/seals-168161
Seront, B., Wong, T. F., Caine, J. S., Forster, C. B., Bruhn, R. L., and Fredrich, J. T. (1998). Laboratory characterization of hydromechanical properties of a seismogenic normal fault system. J. Struct. Geol. 20, 865–881. doi:10.1016/S0191-8141(98)00023-6
Sibson, R. H. (1985). A note on fault reactivation. J. Struct. Geol. 7, 751–754. doi:10.1016/0191-8141(85)90150-6
Stokes, S. M., Ge, S., Brown, M. R., Menezes, E. A., Sheehan, A. F., and Tiampo, K. F. (2023). Pore pressure diffusion and onset of induced seismicity. J. Geophys. Res. solid Earth 128. doi:10.1029/2022JB026012
Talwani, P., and Acree, S. (1984). Pore pressure diffusion and the mechanism of reservoir-induced seismicity. Pure Appl. Geophys. PAGEOPH 122, 947–965. doi:10.1007/BF00876395
Talwani, P. (1997). On the nature of reservoir-induced seismicity. Pure Appl. Geophys. 150, 473–492. doi:10.1007/s000240050089
Terrier, M., Courrioux, G., Martelet, G., Bitri, A., and Hanot, F. (2007). Etude de la faille de Salon-Cavaillon (région PACA, France) - rapport final. Tech. Rep. BRGM RP-55989-Fr.
Tollmann, A. (1976). Der Bau der Nördlichen Kalkalpen. Orogene Stellung und regionale Tektonik, 3. Wien: Deuticke.
Tolstoy, M., Vernon John A Orcutt Frank K Wyatt, F. L., and Green, I. M. (2002). Breathing of the seafloor: tidal correlations of seismicity at Axial volcano. Tech. Rep. 6. doi:10.1130/0091-7613(2002)030<0503:BOTSTC>2.0.CO;2
Wildberger, A., Geyh, M. A., Groner, U., Häuselmann, P., Heller, F., and Ploetze, M. (2010). Dating speleothems from the silberen cave system and surrounding areas: speleogenesis in the muota valley (Central Switzerland). Z. fur Geomorphol. 54, 307–328. doi:10.1127/0372-8854/2010/0054S2-0016
Wolf, L. W., Rowe, C. A., and Horner, R. B. (1997). Periodic seismicity near Mt. Ogden on the Alaska-British Columbia border: a case for hydrologically triggered earthquakes? Bull. Seismol. Soc. Am. 87, 1473–1483. doi:10.1785/bssa0870061473
Keywords: karst, rain-triggered, seismicity, pore-pressure, diffusion
Citation: Perrochet L, Preisig G and Valley B (2023) Quantifying the mechanisms of rain-triggered seismicity in karstic regions. Front. Earth Sci. 11:1234856. doi: 10.3389/feart.2023.1234856
Received: 05 June 2023; Accepted: 25 September 2023;
Published: 20 October 2023.
Edited by:
Nibir Mandal, Jadavpur University, IndiaReviewed by:
Yawar Hussain, Sapienza University of Rome, ItalyMatteo Picozzi, University of Naples Federico II, Italy
Copyright © 2023 Perrochet, Preisig and Valley. This is an open-access article distributed under the terms of the Creative Commons Attribution License (CC BY). The use, distribution or reproduction in other forums is permitted, provided the original author(s) and the copyright owner(s) are credited and that the original publication in this journal is cited, in accordance with accepted academic practice. No use, distribution or reproduction is permitted which does not comply with these terms.
*Correspondence: Léa Perrochet, leaperrochet@gmail.com