The impact of climate and land use changes on nitrogen and phosphorus pollution in the Luhun Lake Basin, China
 Xu Yang
 Shike Qiu*
 - Institute of Geographical Sciences, Henan Academy of Sciences, Zhengzhou, China
Introduction: Water is an important ecological factor, and non-point source pollution (NPSP) seriously affects water security. In recent years, NPSP has affected water security and human survival in China.
Methods: The Luhun Lake Basin has been selected as an example region of Yellow River Basin (YRB) in China, and the trends and impacts of nitrogen (N) and phosphorus (P) has been quantitatively evaluated by using geographic information system (GIS), remote sensing (RS) and InVEST model.
Results: The results show that (1) the arable land and water bodies decreased, while forest land, grass land, construction land and unutilized land increased in the 20 years. The average annual precipitation increased from the northeast to the southwest in the 20 years; (2) the N and P exports first increased in 2000–2010 and then decreased in 2010–2020, and finally increased in 2000–2020; (3) with the increase of precipitation, the N and P exports decreased in 2000–2010, 2010–2020 and 2000–2020; (4) the amount of N and P exports on arable land and construction land were more than that on the other land use types. The N and P exports on each land use type all first increased and then decreased, and the overall change trend all increased in 2000–2020.
Discussion: This study demonstrates how geographic information system (GIS), remote sensing (RS) and InVEST model can be used to assess nitrogen and phosphorus pollution in data scarce regions.
1 Introduction
Non-point source pollution (NPSP) including nitrogen and phosphorus pollution refers to pollutants entering water bodies through runoff from non-specific locations and causing water pollution. Nitrogen and phosphorus pollution is an important issue of eutrophication (Ongley et al., 2010; Shen et al., 2012; Collick et al., 2015). Globally, NPSP has become the main cause of water pollution. Since the 1980s, developed countries have devised strategies to control NPSP and improve water quality. The problem of NPSP in China is very prominent, wherein the amount of nitrogen (N) and phosphorus (P) pollutants accounted for 40%–60% of the total amount of pollutants entering the river (Zou et al., 2020). China has emphasized the prevention and control of NPSP in the “13th and 14th Five-Year Plans” for the protection of ecological environment. However, due to vast territory, complex natural conditions, and insufficient monitoring networks, technologies, and methods, it is more difficult to study and manage NPSP in China. Therefore, clarifying the issues of NPSP is important for ecosystem security, human survival, and socioeconomic development in China.
The Yellow River (YR) plays an important role in achieving ecological sustainability and economic growth in China. However, the pollution is more serious in the Yellow River Basin (YRB) (Tao et al., 2021). In 2019, Chinese President Xi Jinping emphasized pollution control and identified the YRB as a major national strategy area (Xinhua News Agency, 2019). Luhun Lake is a tributary of the YR, providing water support for Luoyang City and making contributions to regional agricultural and socioeconomic development. However, more than 105 tons of chemical fertilizers and 750 tons of pesticides enter the upper reaches of Luhun Lake through runoff every year (Zhang et al., 2022). In recent years, the water quality has been improved by the implementation of a series of measures in Luhun Lake, but eutrophication still exists as indicated by the presence of NPSP which is more difficult to control and manage. NPSP in Luhun Lake mainly comes from three aspects. First, NPSP originates from the urban area of Song County on the left bank of the lake with densely populated and low vegetation cover, and a large amount of urban living garbage and feces flows into the lake through surface runoff. Second, NPSP originates from the towns and villages around Luhun Lake, and these areas produce a large amount of domestic garbage and sewage, which are discharged into the lake area through the river and ditch. Third, NPSP originates from farmland in the upper reaches of the lake, where soil erosion is more serious, and large amounts of pesticides and fertilizers are used on farmland in the confluence area, leading to agricultural NPSP. This NPSP accumulation causes serious problems in the Luhun Lake Basin, which affects the ecological environment, people’s health, and socioeconomic development of the Luhun Lake Basin, and is not conducive to the sustainable development of the YRB. With increasing population and rapid development, the use of agricultural production materials (i.e., fertilizers and pesticides) continues to increase (Gu et al., 2012; Huang et al., 2019), exacerbating NPSP in the Luhun Lake Basin, making its control and management challenging. Therefore, conducting research on NPSP in the Luhun Lake Basin contributes to water security and human survival in the basin and responds to the major national strategy of the YRB.
The assessment of NPSP is important for ecological environmental protection and management (Terrado et al., 2014), but it is difficult to quantitatively assess NPSP due to its complexity. Chinese researchers developed some NPSP models at the regional scale in China, but these models need more proof for better application in wider areas of China. Currently, there are some methods to assess NPSP, including math models and modular integrated models. The math models are expensive and require a great deal of resources for sampling. The evaluation results are mostly from a microscopic perspective, do not reflect the macroscopic pollution status of land or water bodies, and cannot provide efficient support for management and decision-making. However, with the development of geographic information system (GIS) and remote sensing (RS) technology, the modular integrated models can assess NPSP at low cost, rapid throughput, and large scales and discover the spatio-temporal characteristics and mechanisms of pollutants. The modular integrated models include Soil and Water Assessment Tool (SWAT) (FitzHugh and Mackay, 2000), Integrated Valuation of Ecosystem Services and Tradeoffs (InVEST) (Huang et al., 2022), Storm Water Management Model (SWMM) (Lee et al., 2022), Water Erosion Prediction Project (WEEP) (Yeghiazarian and Montemagno, 2001), Annualized Agricultural Non-Point Source Pollution Model (AnnAGNPS) (Zhang et al., 2020), MIKE Système Hydrologique Européen (MIKE SHE) (Hou et al., 2021), geomorphology-based non-point source pollution (GBNP) model (Wang et al., 2016), Hydrological Simulation Program-FORTRAN (HSPF) (Wang et al., 2015), the model of rainfall-runoff and NPSP (Han et al., 2011), binary-structure model (Hong et al., 2012a; Hong et al., 2012b), Distributed Time Variant Gain Hydrological Model (DTVGM) (Zhao et al., 2019), and Areal Nonpoint Source Watershed Environment Response Simulation (ANSWERS) model (Bouraoui and Dillaha, 2000). Overall, these models have different mechanisms and expertise in simulating pollutants, and the foreign-developed NPSP model applied directly to China may cause errors because of the country’s distinct regional characteristics. Therefore, considering the difficulty in monitoring and localized application, the InVEST model due to its advantages of easy access to data, less input data and parameters, and good local adaptation is very appropriate for studying NPSP, and this model has been used to assess NPSP in China and other countries (Redhead et al., 2018; Bai et al., 2019; Yang et al., 2019; Qi et al., 2020; Liang et al., 2021; Wu et al., 2021). Currently, the use of the InVEST model in China is lagging behind compared to foreign countries, and there is still a large application space for the study of nitrogen and phosphorus at home and abroad. Existing studies have more often used traditional methods or other modeling techniques to study nitrogen and phosphorus pollution. The InVEST model has been less applied to the study of nitrogen and phosphorus pollution in the YRB and has not been carried out in the Luhun Lake Basin.
In this study, the Luhun Lake Basin was selected as the study region, and N and P pollutants in this region were studied by finding reliable answers to the following questions: 1) what are the spatio-temporal characteristics of N and P exports? 2) How do N and P exports change during the study periods? 3) What are the effects of precipitation and land use changes on the N and P exports? By combining GIS, RS, and InVEST model, this study provides new ideas for the quantitative assessment of N and P in areas with limited data, demonstrates its ability to efficiently assess N and P exports on a large scale, and lays the foundation for future research in the regional control of N and P exports.
2 Study region
Luhun Lake is located in Song County, Luoyang City, Henan Province, China, and in the upper reaches of the Yihe River, which is a secondary tributary of the YR, controlling a watershed area of 3,492 km2, accounting for 57.9% of the Yihe River Basin (Zhou et al., 2022) in Figure 1. A dam of 55 m high is constructed at the outlet of Luhun Lake, with a total storage capacity of 13.16 × 10⁸ m3 (Ge et al., 2022). Luhun Lake has an average annual runoff of 10.25 × 10⁸ m3, average annual flow rate of 32.5 m3/s, average annual sand transport of 3×10⁶ ton, and average sand content of 3.2 kg/m3 (Zhou et al., 2022). More than 90% of the sediment is concentrated during the flood season from July to October, and the water is clear during the non-flood season (Zhou et al., 2022). Luhun Lake is a large reservoir of type I, which is one of the five large reservoirs in Luoyang City.
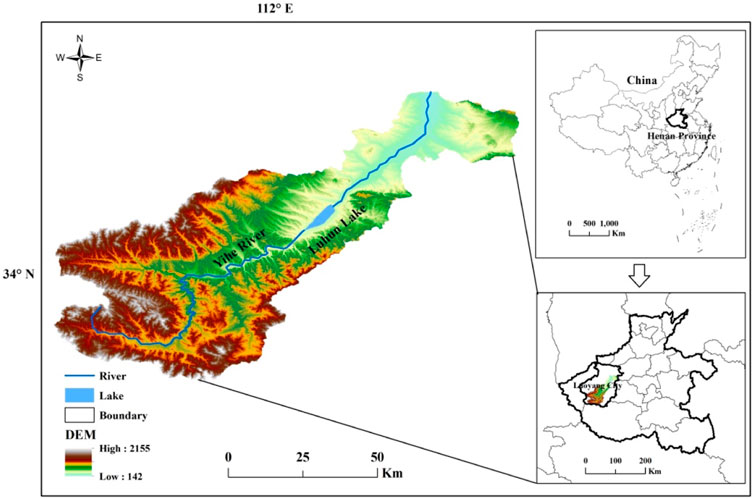
FIGURE 1. Geographical location of the Luhun Lake Basin.
3 Materials and methods
3.1 Data source and pretreatment
The digital elevation model (DEM), land use, precipitation, and watershed data were used in this study. The DEM data with 90 m resolution were downloaded from the United States Geological Survey (USGS) (https://earthexplorer.usgs.gov/). The land use data with 1 km resolution were downloaded from the Resource Environmental Science and Data Center of Chinese Academy of Sciences (https://www.resdc.cn/). The precipitation data were downloaded from the Climate Research Unit of the East Anglia University of the United Kingdom (https://crudata.uea.ac.uk/cru/data/hrg/) and the World Climate Data Network (http://www.worldclim.org/). The watershed data were obtained by processing DEM data using ArcSWAT software. The parameters including load, efficiency, and critical length in the InVEST model were obtained from the relevant studies (Xia et al., 2020; Fang et al., 2021; Xia et al., 2022; Wang and Xu, 2023) and the InVEST User Guide, and these parameters were adjusted to match the local characteristics.
3.2 Research methods
3.2.1 Delta method
The delta method was selected to improve data resolution after analysis and comparison (Getirana et al., 2011; Liu et al., 2011; Mahmood and Babel, 2013) because of few meteorological stations and low-resolution data assimilation products. The delta method is a downscaling method used to obtain the long-time-series, high-resolution meteorological data. First, the low-resolution precipitation data of the desired month are selected, and the low-resolution outlier is obtained from the monthly scale precipitation of the desired year divided by the average of the summed monthly scale precipitation for the same month at the reference annual scale; then, this low-resolution outlier is interpolated into the high-resolution outlier; finally, the high-resolution outlier is summed with the average of the summed monthly scale precipitation for the same month at the reference annual scale to obtain the high-resolution precipitation data of the desired month. The calculation formula (1) and formula (2) are as follows:
where i is the series value at the annual time scale, a is the reference time period, j is the series value at the monthly scale, dij is the long-time-series and low-resolution precipitation data, Daj is the long-time-series and high-resolution reference precipitation data, eij is the low-resolution outlier, and Eij is the high-resolution outlier obtained by interpolation of eij, and Pij is the downscaled precipitation data.
3.2.2 InVEST model
The nutrient delivery ratio (NDR) in the InVEST model describes the source and transport process of nutrients in a basin and estimates the quantity of N and P. The NDR model uses the mass conservation method to simulate the spatial transformation of nutrients. The equation (3) and (4) are as follows:
where Xexpton is the total amount of the export of nutrients (kg/yr) and Xexpi is the amount of the export of each grid of nutrients (kg/yr). loadsurf,i and loadsubs,i are the nutrient load on the surface and subsurface (kg/ha·yr−1), respectively, and NDRsurf,i and NDRsubs,i are the nutrient transfer rate of the surface and subsurface, respectively.
NDRsurf,i is calculated using the following equation (5)–(11):
where NDR0,i is the retention efficiency; IC0 and k are the correction parameters; IC0 is the terrain index; k is a non-physical parameter representing the empirical factor of terrain, where the default value is 2;
NDRsubs,i is calculated using the following equation (12)–(16):
The nutrient loads of the grid are corrected by the local runoff potential using the following formula:
where modified.load(x,i) is the modified nutrient loads of the grid; RPIi is the runoff potential index of grid i; RPi is the runoff agent of grid i; and RPav is the average runoff agent of the grid.
3.2.3 Spatial analysis method
Spatial analysis has been performed using GIS and RS. The data management tools and spatial analyst tools of ArcGIS software and the change detection statistics of Environment for Visualizing Images (ENVI) software have been used to analyze and map the results.
4 Results
4.1 Land use changes in 2000–2020
The land use types in the Luhun Lake Basin include arable land (AL), forestland (FL), grassland (GL), water bodies (WB), construction land (CL), and unutilized land (UL) in 2000, 2010, and 2020 (Figure 2). The arable land and forestland constitute the major land use types; the arable land and forestland are mainly distributed in the northeastern and southwestern part of the basin, respectively; grassland, water bodies, and construction land are scattered in the basin; and unutilized land is very poorly distributed in the basin.
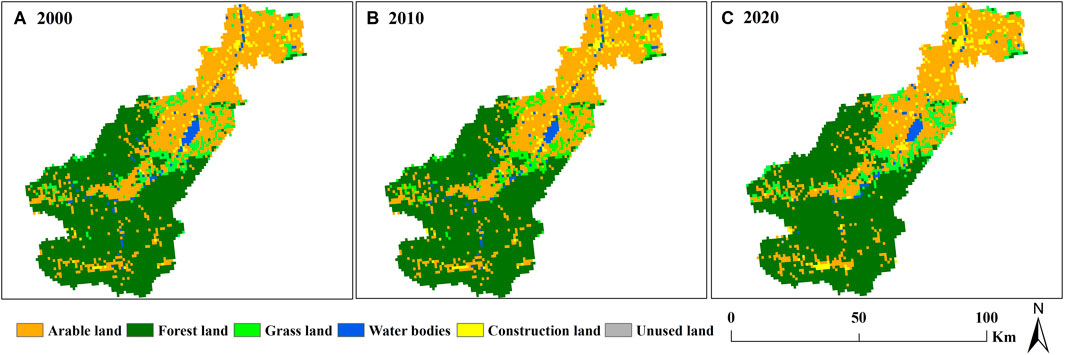
FIGURE 2. Spatial distribution of land use of the Luhun Lake Basin in 2000, 2010, and 2020.
The areas of different land use types of the Luhun Lake Basin in 2000, 2010, and 2020 are shown in Table 1. The results showed that forestland covered the largest portion of the basin; arable land covered the larger portion of the basin; grassland, water bodies, and construction land covered smaller portions of the basin; unutilized land does not exist in the basin in 2000 and 2010; and there is a very small area of the basin until 2020. The portions of arable land and water bodies decreased, while those of forestland, grassland, construction land, and unutilized land increased in the last 20 years. However, there were very small changes in the area of six land use types.
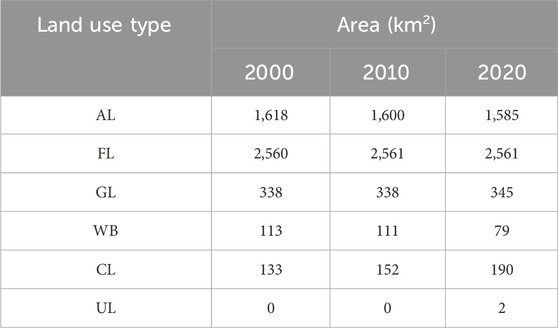
TABLE 1. Area of different land use types of the Luhun Lake Basin in 2000, 2010, and 2020.
The land use changes in 2000–2010 were very few, while there were more changes and similar changes in 2010–2020 and 2000–2020, respectively (Figure 3). The changes in 2000–2010 were scattered in the central, northeastern, and southwestern areas of the basin, and the changes in 2010–2020 and 2000–2020 were distributed in the whole basin.
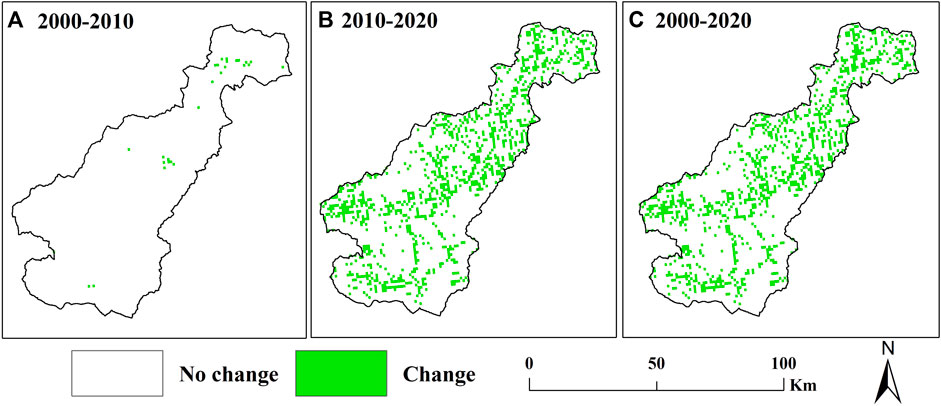
FIGURE 3. Spatial distribution of land use change in the Luhun Lake Basin in 2000–2010, 2010–2020, and 2000–2020.
The land use transfer matrix of the Luhun Lake Basin in 2000–2010, 2010–2020, and 2000–2020 was calculated, as shown in Table 2. The change in land use types from 2000 to 2010 was found in few areas, while the change in land use types in 2010–2020 and 2000–2020 was found in more areas. Less area of forestland was converted to unutilized land. Most of the land use types were converted to forestland, grassland, and construction land in the last 20 years.

TABLE 2. Land use transfer matrix of the Luhun Lake Basin in 2000–2010, 2010–2020, and 2000–2020 (unit: km2).
4.2 Precipitation changes in 2000–2020
The average annual precipitation replaces the nutrient runoff proxy as an input data to the InVEST model according to the InVEST User Guide, which indicates the capacity of runoff to transport nutrients. The average annual precipitation in the Luhun Lake Basin increased from northeast to southwest during 2000–2020 (Figure 4), which was related to the vegetation and terrain (Figures 1, 2).
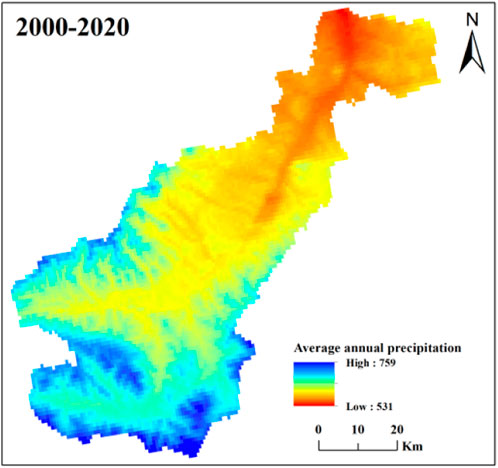
FIGURE 4. Spatial distribution of average annual precipitation of the Luhun Lake Basin in 2000–2020.
4.3 Spatio-temporal changes in nitrogen and phosphorus exports
The results of N and P exports of the Luhun Lake Basin in 2000, 2010, and 2020 are shown in Figure 5. The spatial distribution of N and P exports in 2000, 2010, and 2020 was similar, but the values of N and P exports were different. The values of N export were generally higher than those of P export in 2000, 2010, and 2020.

FIGURE 5. Spatial distribution of nitrogen (A,C,E) and phosphorus exports (B,D,F) of the Luhun Lake Basin in 2000, 2010, and 2020.
Table 3 shows that the N export was much more than the P export in the Luhun Lake Basin in 2000, 2010, and 2020. The total and average N and P exports of the Luhun Lake Basin first increased in 2000–2010 and then decreased in 2010–2020, reaching a maximum value in 2010, and they increased in 2000–2020. The 66.15% growth rate of the N export was less than the 77.92% growth rate of the P export in the last 20 years.
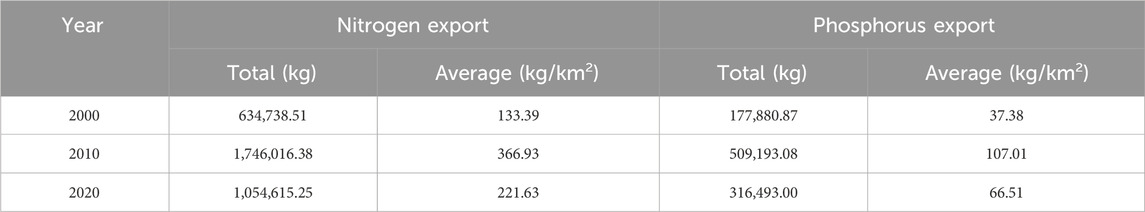
TABLE 3. Amount of nitrogen and phosphorus exports of the Luhun Lake Basin in 2000, 2010, and 2020.
The N and P export changes in the Luhun Lake Basin in three periods (2000–2010, 2010–2020, and 2000–2020) were different (Figure 6). The N and P exports in 2000–2010 and 2000–2020 mainly increased, while the N and P exports in 2010–2020 mainly decreased. However, partial changes were recorded in areas in the same period, and the changes in three periods covered the whole basin.
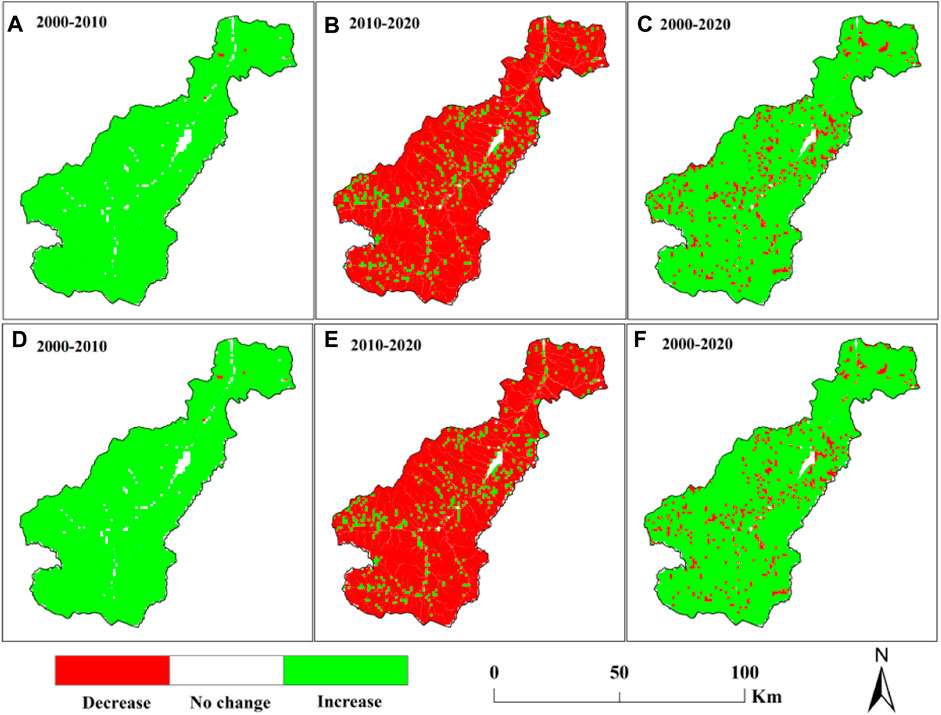
FIGURE 6. Spatial distribution of nitrogen (A–C) and phosphorus (D–F) export changes in the Luhun Lake Basin in 2000–2010, 2010–2020, and 2000–2020.
The area with N and P export changes in the Luhun Lake Basin in 2000–2010, 2010–2020, and 2000–2020 was different (Table 4). The areas with no changes in N and P exports were relatively small, and there were a few area with changes in the amount of N and P exports in three periods. More areas with decreased N and P exports were in 2010–2020, while more areas with increased N and P exports were in 2000–2010 and 2000–2020. The areas with decreased N and P exports showed an increase in N and P exports, while the areas with increased N and P exports showed a decrease in N and P exports between the first period (2000–2010) and second period (2010–2020). However, the areas with decreased N and P exports were less than the areas with increased N and P exports in 2000–2020. The N and P pollution is still an important ecological environment issue for the past 20 years.
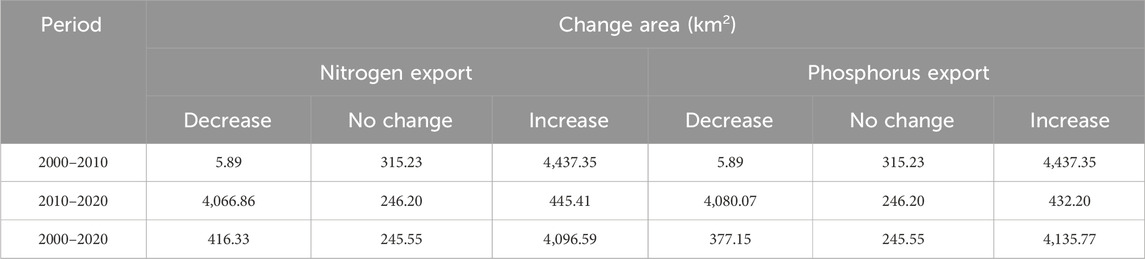
TABLE 4. Change areas of nitrogen and phosphorus exports of the Luhun Lake Basin in 2000–2010, 2010–2020, and 2000–2020.
4.4 The impact of precipitation and land use changes on nitrogen and phosphorus exports
The average annual precipitation instead of nutrient runoff proxy in the InVEST model was selected to analyze the impact of precipitation changes on N and P exports. Since different areas in the basin have different average annual precipitation values, the average value (total N or P export divided by the area) was used to analyze the relationship between the N or P export and different average annual precipitation values (Figure 7). The average values of the N export were larger than those of the P export versus the same average annual precipitation values in 2000, 2010, and 2020. The change trends of the average N or P export versus the average annual precipitation values in 2000, 2010, and 2020 were similar. The average N and P exports decreased in a fluctuating manner in the three periods with increasing precipitation. All the values of average N and P exports were largest in 2010 and lowest in 2000, while a few values of average N and P exports in 2020 were larger than those in 2010.
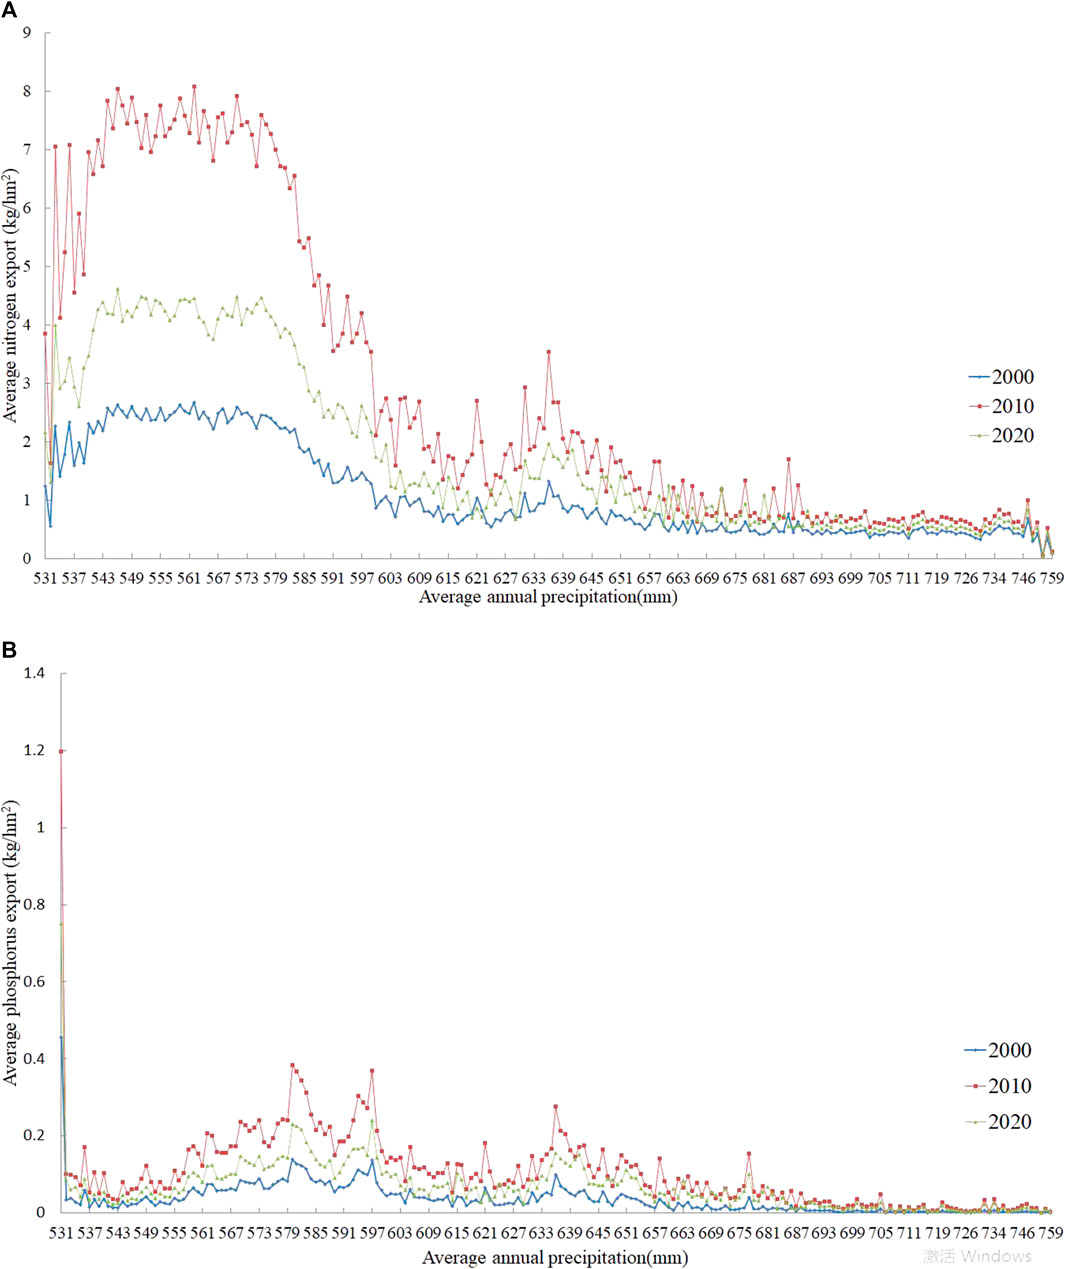
FIGURE 7. Average nitrogen and phosphorus exports versus average annual precipitation of the Luhun Lake Basin in 2000, 2010, and 2020.
The change trends of average N and P exports versus the average annual precipitation values in 2000–2010 and 2000–2020 were similar, while they were different in 2010–2020 (Figure 8). The average N and P export changes decreased in a fluctuating manner in the three periods with increasing precipitation. The changes were larger at low precipitation and lower at high precipitation in the three periods. However, the changes in 2000–2010 and 2000–2020 were positive; the changes in 2010–2020 were negative, while a few changes were positive.
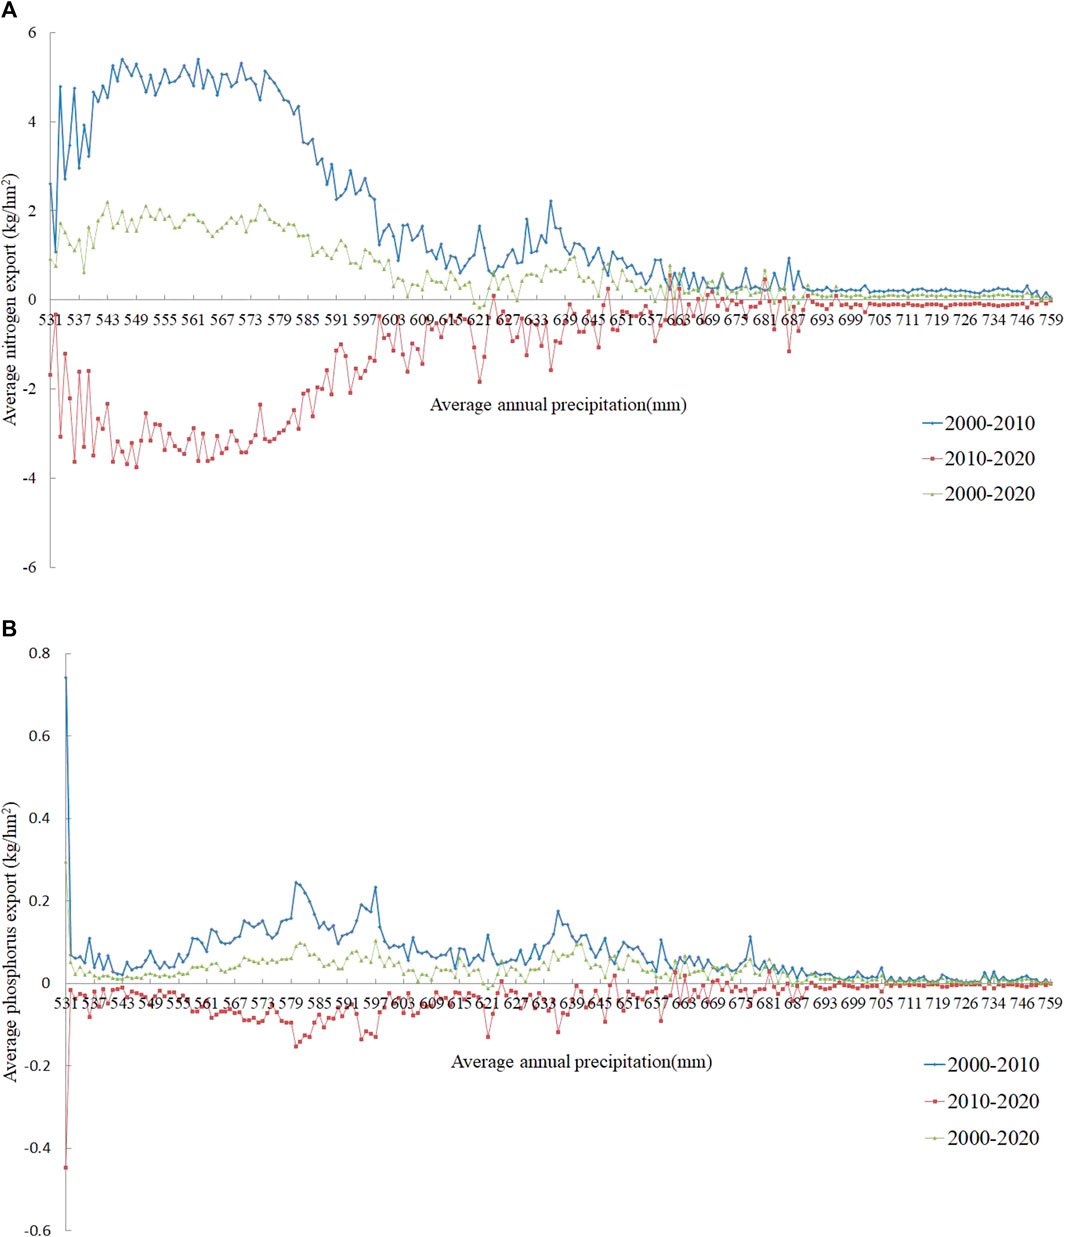
FIGURE 8. Changes in average nitrogen and phosphorus exports versus average annual precipitation of the Luhun Lake Basin in 2000–2010, 2010–2020, and 2000–2020.
There were large differences in the N and P exports on different land use types of the Luhun Lake Basin in 2000, 2010, and 2020 (Table 5). Since different areas in the basin had different average annual precipitation values, the average value (total N or P export divided by the area) was used to analyze the relationship between the N or P export and different average annual precipitation values (Figure 7). The values of average N and P exports were largest on arable land, larger on construction land, lower on forestland, grassland, and water bodies, and lowest on unutilized land in 3 years. In addition, no amount of average N or P export on unutilized land in 2000 and 2010 were found because there was no unutilized land. The average N or P export on different land use types first increased and then decreased, and the overall change showed an increasing trend from 2000 to 2020.
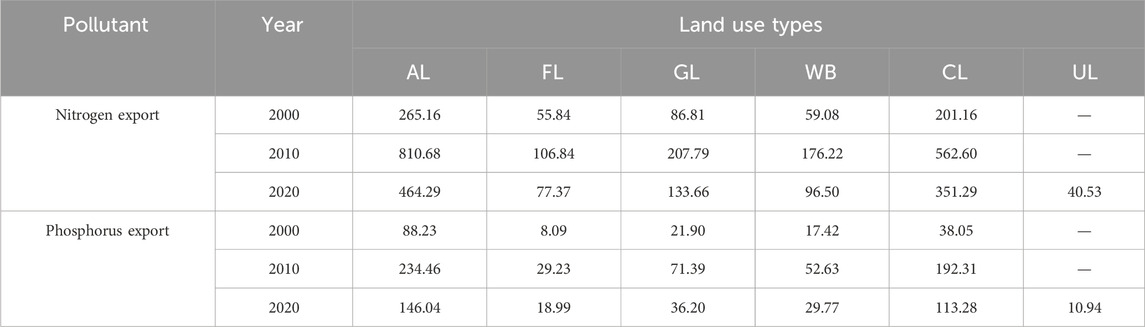
TABLE 5. Average nitrogen and phosphorus exports on land use of the Luhun Lake Basin in 2000, 2010, and 2020 (unit: kg/km2).
5 Discussion
5.1 Trends and attribution of nitrogen and phosphorus pollution
In the last 20 years, population growth and socioeconomic development have led to more demand for production and living standards, which have increased N and P pollution. The Chinese government has taken measures to control and prevent NPSP to reduce pollutants including N and P, but the measures need time to be effective on N and P pollution, and the anthropogenic damage to the environment cannot be eliminated. Therefore, the N and P pollution cannot be eradicated immediately and completely. According to the statistical data in the China Statistical Yearbook (China National Bureau of Statistics) and Henan Statistical Yearbook (Henan Province Bureau of Statistics) and the results of existing studies (Zhang et al., 2014; Tao et al., 2021; Zhang et al., 2022; Zheng et al., 2023), the change in N and P pollution in the Luhun Lake Basin in the last 20 years shows a single-peaked upward trend.
The causes of N and P pollution are complex; we selected the precipitation and land use as the impact factors in this study, considering the input dataset and actual situation. Precipitation mainly affects the pollutant transport, and the results indicate that there is an inverse relationship between precipitation and N or P export. Moreover, a small amount of precipitation is found in plain areas with more arable land and construction land, and a large amount of precipitation is found in mountainous areas with more forestland and grassland. These show that the N and P exports are more closely related to land use, which is further related to the load and purification of N and P, i.e., pollution source and natural purification. The average N or P export on arable land and construction land was more than that on the other land use types in 3 years. More number of pollution sources (i.e., fertilizers, pesticides, solid, liquid, or gaseous living waste) and hardened roads and the lack of vegetation in arable land and construction land have resulted in large load and less natural purification of N and P. A considerable number of pollution sources (i.e., fertilizers, pesticides, feces, and decaying matter) in forest land and grassland cause certain pollution, and the purification of vegetation is high. There are a few pollution sources and vegetation in water bodies and unutilized land causing little load and purification, so the N and P exports on the two land use types are less. These results are consistent with existing studies (Hoyer and Chang, 2014; Yang et al., 2019), showing that the N and P exports are mainly driven by land use.
5.2 Policy implications and suggestions to control nitrogen and phosphorus pollution
In order to control and prevent environmental pollution, the State Council of the People’s Republic of China has formulated “The Five-Year Plan for Ecological Environmental Protection.” In 2021, the Central Committee of the Communist Party of China officially issued the “Opinions on Deepening the Battle of Pollution Prevention and Control,” including treatment of rural toilet, domestic sewage, and garbage, reduction and efficiency enhancement of fertilizers and pesticides, recovery of agricultural films, strengthening the integration of planting and breeding, utilization of livestock and poultry manure, and treatment of aquaculture wastewater; the State Council of the People’s Republic of China issued “Outline of the Plan for Ecological Protection and High-quality Development of the Yellow River Basin,” including the use of clean production technology and advanced equipment, the construction of ecological interception and purification facilities for nitrogen and phosphorus, cleaning of plastic films and packaging, and the coordination control of total nitrogen pollution in the middle and lower reaches of the Yellow River. In 2022, the State Council of the People’s Republic of China jointly issued the “14th Five-Year Plan for the Protection of Soil, Groundwater, and Rural Ecological Environment,” including the prevention and control of soil and groundwater pollution, the governance of agricultural and rural environment, and improvement of supervision capacity of ecological environment. The People’s Government of Henan Province also issued a series of policies and regulations, such as “Pollutant Emissions Reduction Regulations” in 2013, “Three-Year Action Plan for the Battle of Pollution Prevention and Control (2018–2020)” in 2018, “Notice on Soil Pollution Prevention and Food Security on Agricultural Land” in 2020, “Soil Pollution Prevention and Control Regulations” in 2021, and “Work Program of New Pollutant Management” in 2023. These policies and regulations to control and prevent nitrogen and phosphorus pollution in Henan Province have focused on reducing the use of fertilizers and pesticides, utilizing livestock and poultry manure, prohibiting illegal discharge and dumping of harmful substances, recycling agricultural films and packaging, and optimizing the structure of planting and breeding. In addition, the People’s Government of Luoyang City issued “Regulations on the Protection of Drinking Water Sources in Luhun Reservoir” in 2019, including prohibiting the installation of sewage outlets; new construction, renovation, and expansion projects that discharge pollutants; dumping harmful substances such as garbage and industrial waste into water bodies; livestock and poultry farming; operating catering, accommodation, and entertainment with pollutant emissions; and engaging in tourism activities without taking protective measures.
The N and P pollution can never be eradicated in the short term, and the increment and stock of pollutants need to be controlled and removed in the long term. With socioeconomic development (i.e., agriculture, livestock husbandry, aquaculture, and tourism) and population growth in the Luhun Lake Basin, pollution sources (i.e., fertilizers, pesticide, domestic waste, and production waste) need to be controlled for reducing pollution loads, and the underlying surface needs to be changed for improving purification. Several measures could be implemented, such as soil consolidation or depressed space, reasonable increase in the mix of forest and grass, aquaculture control, strict prohibition of illegal discharge and dumping of toxic and harmful substances, and implementation of projects for biological or physical protection.
5.3 Limitations and prospects
Although this study used the technology of geographic information system and remote sensing to assess N and P pollution in the data-scarce region, there are limitations in the current study. Some input parameters were obtained from the official user guide and official statistics data as well as from existing relevant studies. If monitoring data can be used in the future to calibrate the input parameters, the results can be improved. The existing studies also did not use parameters obtained from monitoring data. However, compared with other studies, GIS, RS, InVEST model, and delta method employed in this study improved data precision and scale for studying nitrogen and phosphorus pollution in the basin and provided quantitative results for the spatial evaluation of the impact of precipitation and land use on nitrogen and phosphorus pollution.
6 Conclusion
This study analyzed trends of precipitation and land use and trends and impacts of N and P pollution in the Luhun Lake Basin. The main findings are as follows:
(1) The spatio-temporal trends of land use and precipitation are heterogeneous. The portions of arable land and water bodies decreased, while the portions of forestland, grassland, construction land, and unutilized land increased in the last 20 years. A few areas of forestland were converted to unutilized land. Most of the land use types were converted to forestland, grassland, and construction land in the last 20 years. The land use changes were scattered in the central, northeastern, and southwestern areas of the basin in 2000–2010, and the changes were distributed in the whole basin in 2010–2020 and 2000–2020. The average annual precipitation increased from the northeast to the southwest in the last 20 years.
(2) The trends of N and P exports have distinctive characteristics at different spatio-temporal scales. The N and P exports first increased in 2000–2010, decreased in 2010–2020, and then increased in 2000–2020. The areas that showed no changes in the amount of N and P exports were relatively small, and the areas that showed changes in the amount of N and P exports in 2000–2010, 2010–2020, and 2000–2020 were few.
(3) There is an inverse relationship between precipitation and N or P export, while the land use is the primary driver. With the increase in precipitation, the changes in average N and P exports showed a decreasing trend in 2000–2010, 2010–2020, and 2000–2020; the changes were larger at low precipitation and lower at high precipitation in 2000–2010, 2010–2020, and 2000–2020. The amount of N and P exports on arable land and construction land was more than that on the other land use types. The N or P export was largest on arable land, larger on construction land, lower on forest land, grass land, and water bodies, and lowest on unutilized land in 2000, 2010, and 2020. The N and P exports on each land use type first increased and then decreased, and the overall change showed an increasing trend in 2000–2020.
In the last 20 years, although some measures have been taken to protect the water resources of the Luhun Lake Basin, there are still ecological risks that pose a serious threat to water security and human survival. The management institutions of the Luhun Lake Basin should strengthen the protection of water resources and vegetation and control the use of agricultural production materials and the expansion of construction land. This study has reference value for the control and prevention of nitrogen and phosphorus pollution in the Luhun Lake Basin, and the research ideas can also be applied to other regions.
Data availability statement
The original contributions presented in the study are included in the article/Supplementary Material; further inquiries can be directed to the corresponding author.
Author contributions
XY: Data curation, Formal Analysis, Investigation, Resources, Supervision, Writing–original draft. SQ: Conceptualization, Investigation, Project administration, Resources, Writing–review and editing. CW: Investigation, Software, Validation, Writing–original draft. LH: Formal Analysis, Investigation, Supervision, Visualization, Writing–original draft.
Funding
The author(s) declare financial support was received for the research, authorship, and/or publication of this article. This work was supported by the Basic Research Business Fund Project of Henan Academy of Sciences [Grant Number 220601003], Joint Fund for Scientific and Technological Research and Development Program of Henan Province [Grant Number 222103810100], Science and Technology Project of Henan Province [Grant Number 222102320257], Central Government Guidance on Local Fund for Scientific and Technological Development [Grant Number 211201004], Special Project for Team Building of Henan Academy of Sciences [Grant Number 230501008], and Henan Academy of Sciences Ecological Environment Quantitative Remote Sensing and Intelligent Analysis Innovation Team.
Conflict of interest
The authors declare that the research was conducted in the absence of any commercial or financial relationships that could be construed as a potential conflict of interest.
Publisher’s note
All claims expressed in this article are solely those of the authors and do not necessarily represent those of their affiliated organizations, or those of the publisher, the editors, and the reviewers. Any product that may be evaluated in this article, or claim that may be made by its manufacturer, is not guaranteed or endorsed by the publisher.
References
Bai, Y., Ochuodho, T. O., and Yang, J. (2019). Impact of land use and climate change on water-related ecosystem services in Kentucky, USA. Ecol. Indic. 102, 51–64. doi:10.1016/j.ecolind.2019.01.079
Bouraoui, F., and Dillaha, T. A. (2000). ANSWERS-2000:non-point-source nutrient planning model. J. Environ. Eng. 126 (11), 1045–1055. doi:10.1061/(asce)0733-9372(2000)126:11(1045)
Collick, A. S., Fuka, D. R., Kleinman, P. J. A., Kleinman, P. J. A., Buda, A. R., Weld, J. L., et al. (2015). Predicting phosphorus dynamics in complex terrains using a variable source area hydrology model: MODELLING P DYNAMICS IN COMPLEX TERRAINS. Hydrol. Process. 29 (4), 588–601. doi:10.1002/hyp.10178
Fang, L. L., Wang, L. C., Chen, W. X., Sun, J., Cao, Q., Wang, S., et al. (2021). Identifying the impacts of natural and human factors on ecosystem service in the Yangtze and Yellow River Basins. J. Clean. Prod. 314, 127995. doi:10.1016/j.jclepro.2021.127995
FitzHugh, T. W., and Mackay, D. S. (2000). Impacts of input parameter spatial aggregation on an agricultural nonpoint source pollution model. J. Hydrology 236 (1-2), 35–53. doi:10.1016/s0022-1694(00)00276-6
Ge, W., Jiao, Y. T., Wu, M. M., Li, Z., Wang, T., Li, W., et al. (2022). Estimating loss of life caused by dam breaches based on the simulation of floods routing and evacuation potential of population at risk. J. Hydrology 612, 128059. doi:10.1016/j.jhydrol.2022.128059
Getirana, A. C. V., Espinoza, J. C. V., Ronchail, J., and Rotunno Filho, O. (2011). Assessment of different precipitation datasets and their impacts on the water balance of the Negro River basin. J. Hydrology 404 (3-4), 304–322. doi:10.1016/j.jhydrol.2011.04.037
Gu, B. J., Ge, Y., Ren, Y., Xu, B., Luo, W., Jiang, H., et al. (2012). Atmospheric reactive nitrogen in China: sources, recent trends, and damage costs. Environ. Sci. Technol. 46 (17), 9420–9427. doi:10.1021/es301446g
Han, L. X., Huo, F., and Sun, J. (2011). Method for calculating non-point source pollution distribution in plain rivers. Water Sci. Eng. 4 (1), 83–91. doi:10.3882/j.issn.1674-2370.2011.01.008
Hong, G. D., Teng, F. G., Ming, H. L., and Xu, D. (2012a). Comprehensive assessment model on heavy metal pollution in soil. Int. J. Electrochem. Sci. 7 (6), 5286–5296. doi:10.1016/s1452-3981(23)19621-0
Hong, Q., Sun, Z., Chen, L., Liu, R., and Shen, Z. (2012b). Small-scale watershed extended method for non-point source pollution estimation in part of the Three Gorges Reservoir Region. Int. J. Environ. Sci. Technol. 9, 595–604. doi:10.1007/s13762-012-0094-y
Hou, C. Y., Chu, M. L., Botero-Acosta, A., and Guzman, J. A. (2021). Modeling field scale nitrogen non-point source pollution (NPS) fate and transport: influences from land management practices and climate. Sci. Total Environ. 759, 143502. doi:10.1016/j.scitotenv.2020.143502
Hoyer, R., and Chang, H. (2014). Assessment of freshwater ecosystem services in the Tualatin and Yamhill basins under climate change and urbanization. Appl. Geogr. 53, 402–416. doi:10.1016/j.apgeog.2014.06.023
Huang, C. B., Zhao, D. Y., Fan, X., and Liu, C. (2022). Landscape dynamics facilitated non-point source pollution control and regional water security of the Three Gorges Reservoir area, China. Environ. Impact Assess. Rev. 92, 106696. doi:10.1016/j.eiar.2021.106696
Huang, G. R., Yao, G. L., Zhao, J., Lisk, M. D., Yu, C., and Zhang, X. (2019). The environmental and socioeconomic trade-offs of importing crops to meet domestic food demand in China. Environ. Res. Lett. 14 (9), 094021. doi:10.1088/1748-9326/ab3c10
Lee, J., Kim, J., Lee, J. M., Jang, H. S., Park, M., Min, J. H., et al. (2022). Analyzing the impacts of sewer type and spatial distribution of LID facilities on urban runoff and non-point source pollution using the Storm water management model (SWMM). Water 14 (18), 2776. doi:10.3390/w14182776
Liang, J., Li, S., Li, X. D., Liu, Q., and Meng, Q. (2021). Trade-off analyses and optimization of water-related ecosystem services (WRESs) based on land use change in a typical agricultural watershed, southern China. J. Clean. Prod. 279, 123851. doi:10.1016/j.jclepro.2020.123851
Liu, Z. F., Xu, Z. X., Charles, S. P., Fu, G., and Liu, L. (2011). Evaluation of two statistical downscaling models for daily precipitation over an arid basin in China. Int. J. Climatol. 31 (13), 2006–2020. doi:10.1002/joc.2211
Mahmood, R., and Babel, M. S. (2013). Evaluation of SDSM developed by annual and monthly sub-models for downscaling temperature and precipitation in the Jhelum basin, Pakistan and India. Theor. Appl. Climatol. 113, 27–44. doi:10.1007/s00704-012-0765-0
Ongley, E. D., Zhang, X. L., Yu, T., Xiaolan, Z., and Tao, Y. (2010). Current status of agricultural and rural non-point source pollution assessment in China. Environ. Pollut. 158, 1159–1168. doi:10.1016/j.envpol.2009.10.047
Qi, Y., Lian, X. H., Wang, H. W., Zhang, J., and Yang, R. (2020). Dynamic mechanism between human activities and ecosystem services: a case study of Qinghai lake watershed, China. Ecol. Indic. 117, 106528. doi:10.1016/j.ecolind.2020.106528
Redhead, J. W., May, L., Oliver, T. H., Hamel, P., Sharp, R., and Bullock, J. M. (2018). National scale evaluation of the InVEST nutrient retention model in the United Kingdom. Sci. Total Environ. 610, 666–677. doi:10.1016/j.scitotenv.2017.08.092
Shen, Z. Y., Liao, Q., Hong, Q., and Gong, Y. (2012). An overview of research on agricultural non-point source pollution modelling in China. Sep. Purif. Technol. 84, 104–111. doi:10.1016/j.seppur.2011.01.018
Tao, Y., Xu, J., and Ren, H. J. (2021). Spatiotemporal evolution of agricultural non-point source pollution and its influencing factors in the Yellow River Basin. Trans. Chin. Soc. Agric. Eng. 37, 257–264. doi:10.11975/j.issn.1002-6819.2021.04.031
Terrado, M., Acuña, V., Ennaanay, D., Tallis, H., and Sabater, S. (2014). Impact of climate extremes on hydrological ecosystem services in a heavily humanized Mediterranean basin. Ecol. Indic. 37, 199–209. doi:10.1016/j.ecolind.2013.01.016
Wang, A., Tang, L. H., and Yang, D. W. (2016). Spatial and temporal variability of nitrogen load from catchment and retention along a river network: a case study in the upper Xin'anjiang catchment of China. Hydrology Res. 47 (4), 869–887. doi:10.2166/nh.2015.055
Wang, H. L., Wu, Z. N., and Hu, C. H. (2015). A comprehensive study of the effect of input data on hydrology and non-point source pollution modeling. Water Resour. Manag. 29, 1505–1521. doi:10.1007/s11269-014-0890-x
Wang, P., and Xu, M. (2023). Dynamics and interactions of water-related ecosystem services in the Yellow River Basin, China. J. Geogr. Sci. 33 (8), 1681–1701. doi:10.1007/s11442-023-2148-0
Wu, Y. F., Zhang, X., Li, C., Xu, Y., Hao, F., and Yin, G. (2021). Ecosystem service trade-offs and synergies under influence of climate and land cover change in an afforested semiarid basin, China. Ecol. Eng. 159, 106083. doi:10.1016/j.ecoleng.2020.106083
Xia, H. J., Liu, L. S., Bai, J. H., Kong, W., Lin, K., and Guo, F. (2020). Wetland ecosystem service dynamics in the Yellow River estuary under natural and anthropogenic stress in the past 35 Years. Wetlands 40, 2741–2754. doi:10.1007/s13157-020-01368-4
Xia, P., Chen, B., Gong, B., Liu, Z., He, C., and Wang, Y. (2022). The supply and demand of water purification service in an urbanizing basin on the Tibetan Plateau. Landscape Ecol. 37 (7), 1937–1955. doi:10.1007/s10980-022-01455-3
Xinhua News Agency (2019). The important speech of Xi Jinping at the symposium on ecological protection and high-quality development of the Yellow River Basin. Soil and Water Conserv in China. (10), 1–2. doi:10.14123/j.cnki.swcc.2019.0226
Yang, X., Ji, G. X., Wang, C., Zuo, J., Yang, H., Xu, J., et al. (2019). Modeling nitrogen and phosphorus export with InVEST model in Bosten Lake basin of Northwest China. PLoS ONE 14 (7), e0220299. doi:10.1371/journal.pone.0220299
Yeghiazarian, L. L., and Montemagno, C. D. (2001). Incorporation of the water erosion prediction project (WEPP) in the modeling of transport of pathogenic microorganisms from non-point sources of pollution. American Society of Agricultural and Biological Engineers, 127–130.
Zhang, T., Yang, Y. H., Ni, J. P., and Xie, D. (2020). Best management practices for agricultural non-point source pollution in a small watershed based on the AnnAGNPS model. Soil Use Manag. 36 (1), 45–57. doi:10.1111/sum.12535
Zhang, X. L., Wang, Q., Gilliam, F. S., Wang, Y., and Cha, F. (2014). Spatial variation in carbon and nitrogen in cultivated soils in Henan Province, China: potential effect on crop yield. PLoS ONE 9 (10), e109188. doi:10.1371/journal.pone.0109188
Zhang, X. Q., Chen, P., Dai, S. N., and Han, Y. (2022). Analysis of non-point source nitrogen pollution in watersheds based on SWAT model. Ecol. Indic. 138, 108881. doi:10.1016/j.ecolind.2022.108881
Zhang, Y., Li, Z., Ge, W., Wang, J., Guo, X., Wang, T., et al. (2022). Evaluation of the water pollution risk of dam and dike-break floods in the inundated area. Environ. Sci. Pollut. R. 29 (50), 76365–76377. doi:10.1007/s11356-022-20742-9
Zhao, C. S., Yang, Y., Yang, S. T., Xiang, H., Zhang, Y., Wang, Z., et al. (2019). Predicting future river health in a minimally influenced mountainous area under climate change. Sci. Total Environ. 656, 1373–1385. doi:10.1016/j.scitotenv.2018.11.430
Zheng, J. Q., Cao, X. H., Ma, C. Z., Weng, N., and Huo, S. (2023). What drives the change of nitrogen and P loads in the Yellow River Basin during 2006-2017? J. Environ. Sci. 126, 17–28. doi:10.1016/j.jes.2022.04.039
Zhou, Z. Z., Xu, Y., and Dai, Z. (2022). Pollution characteristics of surface sediments in Luhun drinking water reservoir in the Middle China. Nat. Environ. Pollut. Technol. 21 (1), 309–313. doi:10.46488/nept.2022.v21i01.037
Keywords: nitrogen, phosphorus, precipitation, land use, Luhun Lake Basin
Citation: Yang X, Qiu S, Wang C and Hao L (2024) The impact of climate and land use changes on nitrogen and phosphorus pollution in the Luhun Lake Basin, China. Front. Earth Sci. 11:1302804. doi: 10.3389/feart.2023.1302804
Received: 27 September 2023; Accepted: 11 December 2023;
Published: 09 January 2024.
Edited by:
Alex Hay-Man Ng, Guangdong University of Technology, ChinaCopyright © 2024 Yang, Qiu, Wang and Hao. This is an open-access article distributed under the terms of the Creative Commons Attribution License (CC BY). The use, distribution or reproduction in other forums is permitted, provided the original author(s) and the copyright owner(s) are credited and that the original publication in this journal is cited, in accordance with accepted academic practice. No use, distribution or reproduction is permitted which does not comply with these terms.
*Correspondence: Shike Qiu, qiushike@igs-has.cn