Modelling runoff components and hydrological processes in glaciated catchments of the inner Tien-Shan, Kyrgyzstan
 Sanjar Sadyrov
 Kenji Tanaka2
  Temur Khujanazarov
 Yoshiya Touge
 Koji Fujita
- 1Graduate School of Engineering, Kyoto University, Kyoto, Japan
- 2Disaster Prevention Research Institute, Kyoto University, Uji, Kyoto, Japan
- 3Tien Shan High Mountain Research Center, National Academy of Science of the Kyrgyz Republic, Bishkek, Kyrgyzstan
- 4Graduate School of Environmental Studies, Nagoya University, Nagoya, Japan
Accurately quantifying runoff sources and understanding hydrological processes in glaciated mountain basins is essential for effective water resource management in the face of climate change. This study aimed to determine the contributions from various runoff sources in glaciated basins within the inner Tien-Shan mountains of Kyrgyzstan by utilizing integrated land surface, glacier energy-mass balance, and river routing models. To account for local topographic influences on solar radiation and cloud transmissivity processes, gridded meteorological forcing data were downscaled. The integrated models were then evaluated against observed discharge, glacier mass balance, and snow water equivalent, with a focus on the Kara-Batkak glacier reference site. Shortwave radiation correction was particularly important for improving the accuracy of model simulations. The results indicate that the peak glacier melt contribution occurs in July and August, with some basins reaching up to 54%. On an annual basis, the average contribution from glaciers across the basins was found to be 19%, while the ratios of snowmelt and rainfall were 58% and 23%, respectively. This study highlights the utility of integrated modelling approaches in understanding and quantifying runoff components in data-scarce high mountain regions. The incorporation of observed glacier data proved to be crucial for accurately representing hydrological processes under current climatic conditions. These findings underscore the significance of considering glacier dynamics and their influence on water resources to inform effective water management strategies in glaciated mountain basins.
1 Introduction
Climate change is exerting profound impacts on mountainous regions, marked by rising temperatures, shrinking glaciers, altered precipitation patterns, and increased risks of natural hazards (Pepin et al., 2015; Hock and Huss, 2021). The consequences of these changes necessitate immediate attention to mitigate their effects on water resources, economic prosperity, and social stability. The melting of glaciers, degradation of permafrost, and alterations in river flows stand as pivotal factors that will significantly affect lives of global communities (Rasul and Molden, 2019). This transformation is particularly pronounced in the arid climate of Central Asia, where glaciers and snowmelt contribute significantly to the overall water balance of transboundary rivers (Immerzeel et al., 2010; Chen et al., 2016). The shifting seasonality in flow patterns and the variability of peak water availability have the potential to inflame domestic tensions, both economically and politically, and disrupt social stability in the region (Bernauer and Siegfried, 2012). It is imperative, to understand the processes of water flow formation to correctly estimate runoff sources for adaptation strategies of the countries in the downstream, which may face significant reductions by the end of the century (Sorg et al., 2012; Huss and Hock, 2018; Van Tricht and Huybrechts, 2023). This understanding not only serves as a means to anticipate the potential consequences on water resources, and conflicts over them on future agriculture in the region and thus economy, and society but also facilitates informed strategies to address and mitigate the challenges posed by climate-induced transformations in these critical regions.
Remoteness of glaciated mountainous regions and limited observations exacerbate the challenges for precise estimations. The intricate nature of these environments, coupled with their inaccessibility, presents a substantial barrier to acquiring accurate and timely data on the evolving climate dynamics. The difficult terrain complicates efforts to establish monitoring stations and gather critical field data for accurate predictions. The ability to accurately predict the amount of meltwater generated from snowpacks is crucial for a variety of applications, including water resource management and climate change risk assessment (Leavesley, 1994). In the context of determining the sources of runoff in glacial basins, hydrological models have been widely applied as accessible and extensively utilized tools in mountainous regions (Farinotti et al., 2012; Immerzeel et al., 2013; Ragettli et al., 2015; Luo et al., 2018). The ease of use associated with availability of global reanalysis data and acceptable output results that helps to understand past and future river flow dynamics. Accuracy of the prediction varies, highlighting the importance of input data and extensive data quality control, and requirement of the comprehensive snow/glacier melting model for the water flow formation (Chen et al., 2016). More complex physically based hydrological models are known for their ability to accurately describe natural processes, although they require extensive data sets to produce accurate results (Finger et al., 2011).
In the glaciated basins, incorporation of radiation data is crucial to enhance the performance of hydrological models, especially in the estimation of glacier melt (Pellicciotti et al., 2011). Solar radiation directly affects the speed of the snow and glacier melting and thus is essential for accurate predictions. Furthermore, the influence of glacier dynamics on streamflow response in river basins has been highlighted as a complex issue due to the limitations of most existing physically based distributed hydrological models in representing glacier dynamics (Naz et al., 2014). In application of glaciological models in conjunction with radiation data, the matter of downscaling the radiation data becomes relevant. This is particularly significant in the context of glacier melt estimation and its influence on overall runoff (Eidhammer et al., 2021). The integration of radiation data and glaciological models in physically based hydrological modelling presents challenges, including the need for downscaled high resolution radiation data of the glacier and its potential influence on glacier melt estimation and overall runoff. Addressing these challenges is vital for enhancing the accuracy and reliability of hydrological models in glacier-dominated hydrology.
Previous studies in the Tien-Shan Mountains have shown the importance of glacial runoff for all basins. In the Northern Tien-Shan, its contribution to the river flow ranged from 18-28% and peaked at 40–70% during summertime, as calculated by temperature-index model (Aizen et al., 1996). By end-member mixing analysis, the ratio of glacier meltwater contribution to the total runoff in Central Tien-Shan and Northern Tien-Shan have been estimated as 42% and 36%, respectively (Chen et al., 2019). In the Tarim basin, the contribution of icemelt, snowmelt and rainfall were evaluated as 44, 28 and 29% for the Kumalike river and 23, 26 and 51% for the Toxkan River, respectively, using enhanced Variable Infiltration Capacity (VIC) model (Zhao et al., 2013). Although it is still challenging to assess runoff contribution with high temporal and spatial scales, distributed models may contribute to understanding the future change of snow and glacier melt dynamics (Unger-Shayesteh et al., 2013).
A meta-analysis based review of glacio-hydrological studies estimated that about 94% used the temperature-index method for modelling purposes, and only 6% used the energy-balance approach (He et al., 2021). One of the reasons for the widespread use of temperature-index and degree-day models is their requirement for relatively minimal input data, which makes them practical and accessible for various applications (Martinec and Rango, 1986; Hock, 2003). Indeed, in high mountainous areas, establishing an observation network with a wide spectrum of measurements is labour-intensive, and in most cases, air temperature is the only available data metric. On the other hand, the implementation of physically-based models relying on energy balance, while offering substantial advantages, demands a more intricate process of data processing and quality control. The dissolution of the Soviet Union resulted in a deterioration of the meteorological observation network in Kyrgyzstan, particularly in high-altitude regions (Hoelzle et al., 2017), thereby constraining the availability of data sources.
An advantage of physical-based models is that they are based on fundamental physical principles, such as conservation of mass and energy, allowing for a more robust and accurate representation of the modelled system. This approach can lead to a better understanding of the underlying physical processes and improve projections for future scenarios. Despite the scarcity of observations, it remains feasible to reanalyze meteorological data in the glaciated basins modelling, and solar radiation is one of the main components that should be studied.
In this study, we utilize a cutting-edge land surface model with an integrated glaciological model to determine the runoff components of glaciated basins in the inner Tien-Shan. To accurately represent the high mountain conditions, we employ gridded reanalysis meteorological forcing data, which are validated using observational data in each step of the input dataset, including data from the glacier itself. The data preprocessing stage focuses on performing topographic downscaling of incoming solar radiation, taking into account slope, aspect, shading by surrounding topography, and cloudiness at a specific time. This comprehensive analysis allows us to assess the impact of these factors on ice and snow melt processes. Furthermore, we compare the results of discharge, the mass balance of reference glaciers, and Snow Water Equivalent (SWE) with observed data. By employing this approach, we aim to gain a better understanding of the hydrological dynamics in glaciated basins and the role of various factors in influencing runoff. The comparison of model results with observed data provides crucial insights into the accuracy and reliability of the modelling framework and helps to validate the performance of the integrated model in simulating the hydrological processes at each stage in the study area.
2 Study area and data
Glaciers in Kyrgyzstan are primarily concentrated in the inner Tien-Shan and within the Ak-Shiyrak range, where the rivers of the Syrdarya basin, headwaters of the Tarim basin and the rivers of the closed endorheic Lake Issyk-Kul have their origins (Figure 1A). According to Dyurgerov (2010) the area of glaciation in the Tien-Shan mountain system decreased by almost 17% between 1960 and 2006. The study basins (Figure 1B) of the Chon-Kyzyl-Suu, Kichi-Kyzyl-Suu and Djuuku rivers are located on the northern slope of Terskey Ala-Too and flow into Lake Issyk-Kul. Characteristics of this basins are listed in Table 1. The region of Lake Issyk-Kul is highly susceptible to the impacts of climate variability, making it important to identify and understand variations in rainfall patterns. Accurate characterisation of rainfall variations is essential for effective water resource planning and management within the Lake Issyk-Kul basin (Alifujiang et al., 2020).
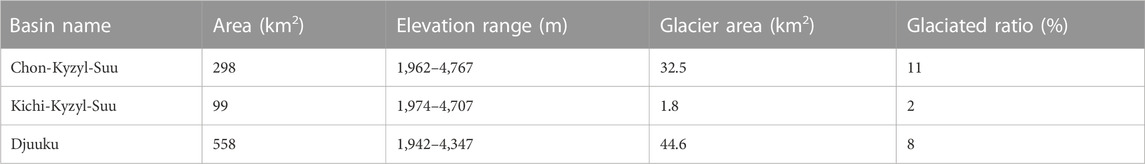
Table 1. Summary of study catchments.
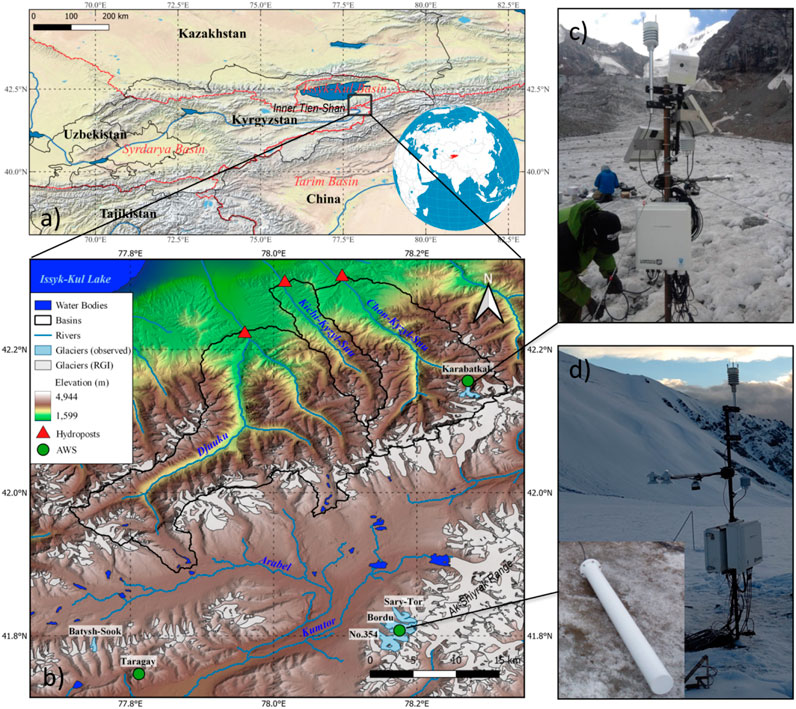
Figure 1. Study area map. (A) Country and large basin map, (B) regional map of studied glaciers and catchments, (C) automatic weather station (AWS) on Kara-Batkak Glacier, and (D) AWS on Bordu Glacier with an instrument for snow water equivalent (SnowFox).
The study area includes the Chon-Kyzyl-Suu river basin, where instrumental meteorological and glaciological monitoring has been conducted since the 1950s. However, some data has a particular gap in the 1990s, and observations have been resumed after 2007 (Satylkanov, 2021) by the Tien-Shan High Mountain Scientific Center of the Academy of Sciences of Kyrgyzstan monitors Kara-Batkak glacier located in the Chon-Kyzyl-Suu river basin.
Since July 2017, observations on Kara-Batkak Glacier began with an automatic weather station (AWS). The main components are downward and upward shortwave and longwave solar radiations, measured by Hukseflux NR01 sensor. Temperature, atmospheric pressure, wind speed and humidity are measured by Vaisala WXT536. In August 2018, a similar system has been installed on Bordu Glacier. The data are used to improve the quality of the forcing data for simulations.
The Chon-Kyzyl-Suu river basin has a continental climate with cold winters and warm summers. Monthly temperatures range from an average low of −10.7°C in January to an average high of 10.5°C in July (Figure 2). Monthly precipitation is highest in the summer, with an average of 100.7 mm in July, and lowest in winter, with an average of 16.9 mm in January. Monthly discharges are lowest in winter, with an average of 2.18 m³/s in January and highest in summer with an average of 16.55 m³/s in July.
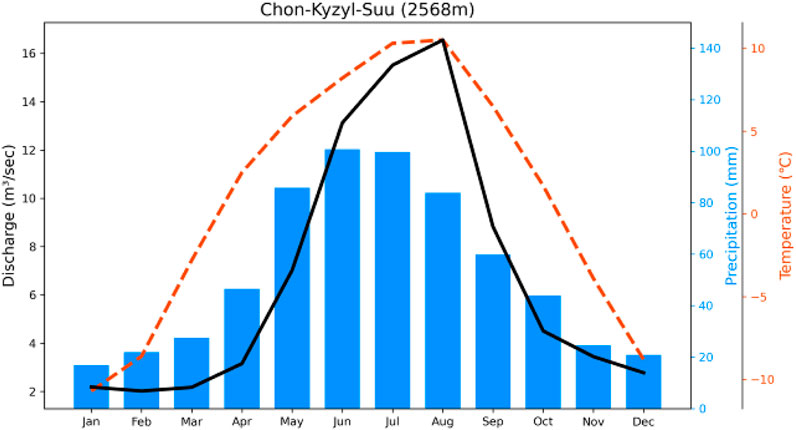
Figure 2. Monthly climatology and hydrograph in Chon-Kyzyl-Suu Basin (2002–2020).
High mountain regions, where most glaciers are located, are often understudied due to their severe environmental conditions and remoteness. These areas are characterised by extreme weather, difficult terrain, and logistical challenges, making it difficult to collect data. As a result, the existing data coverage in these regions is often sparse, leading to uncertainties in model inputs and potential limitations in accurately simulating the complex processes involved in glaciated basins. Gridded reanalysis meteorological forcing data (Table 2) were used for the high mountain conditions of the inner Tien-Shan, which were subsequently validated with the observational data.
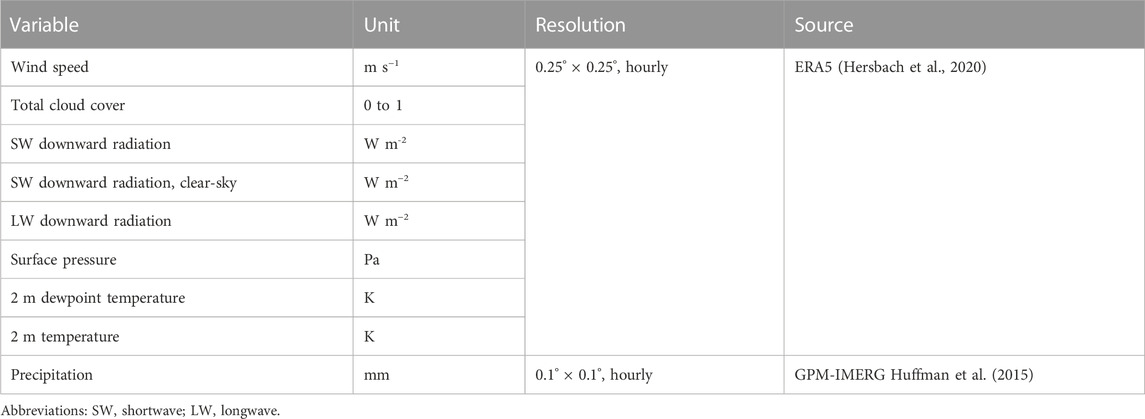
Table 2. Meteorological forcing data used in this study.
3 Methodology
The methodology involved multiple steps, including data preprocessing, model integration, and validation with observed data, to ensure the accuracy and reliability of the results (Figure 3). Before conducting the analysis, a data preprocessing stage was performed to downscale the incoming solar radiation to account for topographic effects such as slope, aspect, shading by surrounding topography, and cloudiness in the area during a specific time period. Downscaling involves transforming global or regional scale information into local scale data that better represent the unique conditions at specific sites. It has been shown to improve estimates of both surface energy fluxes and air temperature over mountainous regions (Hoelzle et al., 2001). This allowed for a comprehensive analysis of the impact of these factors on the ice and snow melt processes. Water balance components were analysed by comparing the results of discharge, the mass balance of reference glaciers and SWE with observed data. This comparison allowed for an assessment of the accuracy of the land surface model and its ability to capture the hydrological processes in glaciated basins.
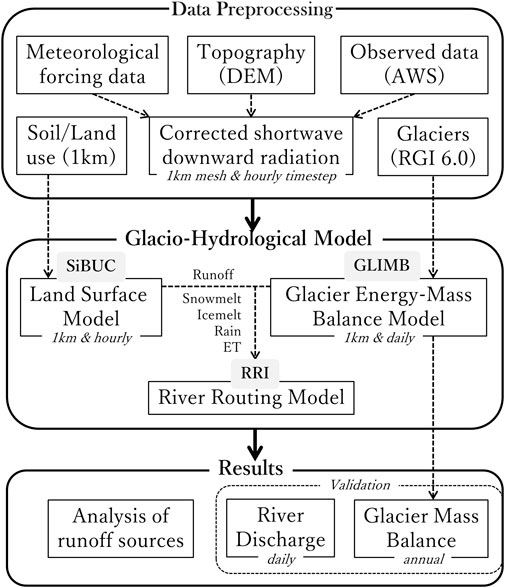
Figure 3. Flowchart of the study.
3.1 Downscaling
The air temperature is one of the main forcing data in addition to solar radiation. In this study, the reanalysis data for 2-m height temperatures over the ground surface were downscaled according to the elevation grid. The main component of the downscaling is the temperature lapse rate. This value varies greatly depending on many factors, especially in mountainous areas with complex topography (Marshall et al., 2007; Minder et al., 2010; Shen et al., 2016; Jobst et al., 2017). A commonly used value of 6.0°C per kilometre, which represents the average decrease in temperature with increasing elevation in mountainous areas, was used in this study. This value is close to previously observed temperature lapse rate of 5.8°C per kilometre in the Tien-Shan mountains (Aizen and Aizen, 1997).
Solar radiation is a key driver of energy exchange at the Earth’s surface, and accurate representation of its spatial and temporal distribution is essential for simulating and understanding hydrological processes at local and regional scales. Particularly, the correction of input data for energy balance modelling is essential (Garen and Marks, 2005), and radiation data should be downscaled. Downscaling techniques typically rely on reanalysis datasets which provide global coverage but are limited in spatial resolution. These methods involve incorporating local topographic features into the dataset by utilising high resolution (30–100 m) digital elevation models (DEMs) to simulate shadowing effects and other local influences on solar radiation patterns. This provides more accurate predictions of incoming shortwave irradiance at a given site, enabling improved simulations of snowmelt processes (Lehning et al., 2006).
We used a 30 m DEM produced with ALOS satellite data (AW3D, Tadono et al., 2014) to create a detailed topography representation of the study area. The downscaling method was based on the difference between the two conditions for incoming solar radiation. The coefficients (
Shortwave downward radiation has been divided into direct
Cloudiness is one of the most critical factors affecting solar radiation. Cloud transmissivity is challenging to assess under data scarcity, especially in high-altitude areas, where topography also affects cloud formation. Studies conducted on Kara-Batkak Glacier have shown that cloud intensity can be parameterised using precipitation data (Rybak et al., 2021). When cloud transmittance coefficients are defined more broadly to correspond to clear-sky situations, we see a significant improvement in ice melt modelling performance (Pellicciotti et al., 2011).
In this study, we used a simple approach to correct clear-sky solar radiation using an expression by Greuell et al. (1997) to define cloud transmissivity (
The total cloud cover (n) data was taken from the ERA5 reanalysis. The coefficients (
Where
3.2 Models
Land surface and energy balance models are often used as boundary layers in Global Climate Models (GCM) (Verseghy, 1991; Cox et al., 1999), especially when determining the future state of the system. The resolution has a significant impact, particularly in mountainous areas with complex topography. A general description of the modelling methodology involves the introduction of an additional class of glacial component into the mosaic scheme of the land surface gridded model. The land surface model SiBUC was applied to the area to determine the energy and water balance of the area. The glacial energy and mass balance algorithm was carried out separately by the GLIMB model. Combined runoff sources and evaporation from two models were used as inputs for the river routing model (RRI).
3.2.1 Land surface model: SiBUC
Simple Biosphere including the Urban Canopy model (SiBUC) is a land surface model using water-energy balance in the grid system (Tanaka, 2004). Based on the Simple Biosphere model (SiB) (Sellers et al., 1986) and SiB2 (Sellers et al., 1996) models, it utilises processes for several mosaic schemes: green area, water body and urban area. Accounting for additional processes in the mountain environment such as glacier melt in regional simulations can improve the overall understanding of the system (Zhao et al., 2013).
Two surface temperatures for canopy and ground (
Where
Where
When a snowfall of more than 5 mm w.e. occurs, the number of days (d) is set to 0,
3.2.2 Glacier energy-mass balance model: GLIMB
To incorporate glaciological processes into the overall scheme, we used the GLIMB model previously applied to glaciers in the Tibetan region and in the Himalayas (Fujita and Ageta, 2000; Fujita and Sakai, 2014). Glacier surface temperature (
Ice surface albedo (
Where
Where
The further explanation of the model can be found in Fujita and Ageta (2000) and Fujita and Sakai (2014). Data from GAMDAM Glacier Inventory (Nuimura et al., 2015; Sakai, 2019), which was incorporated into the global glacier inventory (Randolph Glacier Inventory (RGI) version 6.0, RGI Consortium, 2017), was used to determine the percentage of glaciated mask in the gridded model. Thus, the processes occurring on the glacier surface are determined by GLIMB and on the ground surface by SiBUC.
3.2.3 River runoff model: RRI
The Rainfall Runoff Inundation (RRI) model is a mathematical framework developed by Sayama et al. (2012) to simulate the complex relationships between rainfall, runoff and inundation. The model incorporates a variety of physical processes, such as surface runoff, subsurface flow and overland flow, to accurately simulate the hydrological behaviour of a given terrain. Its primary purpose is to help decision-makers assess the impacts of different hydrological scenarios, such as rainfall intensity and duration, on the potential for flooding. The RRI model is based on a set of equations which are designed to capture the spatial and temporal variability of rainfall, runoff, and inundation within a given area. In addition, the equations consider interactions between different components, such as the amount of infiltration and evaporation and the effects of slope and surface roughness.
In our study, we utilised a land surface and glaciological model in combination with RRI to improve the estimation of hydrological processes within the catchment. The RRI component was used to simulate river flow and consider lateral subsurface flow based on soil parameters. This was particularly important for accounting for the permeability of the permafrost layer in high mountainous areas. Due to the lack of subsurface data and the limited availability and challenges associated with obtaining geological research, we presumably determined the occurrence of permafrost by elevation according to earlier studies in the Tien-Shan Mountains (Zhao et al., 2010). The land surface model component accounted for processes such as soil and vegetation interception, soil moisture dynamics, and the energy budget, which are crucial for accurately estimating variables such as low-flow conditions, flood onset, peak discharges, and inundation depths. This integrated modelling approach, as highlighted by previous studies (Rasmy et al., 2019), provides a comprehensive framework for capturing the complex dynamics of water flow in mountainous regions.
4 Results
4.1 Correction of data, shortwave radiation
A comparison of the results obtained with the observed data on Kara-Batkak glacier (Figure 4B) shows that the influence of clouds is significant, especially in the summertime. The maximum values of daytime radiation during the warm period can be reduced on cloudy days, and the total values depend on the topography’s characteristics. We also compared the values of the ERA5 default data (Figure 4A), where the clouds’ influence is already considered to some extent (Hersbach et al., 2020). On Kara-Batkak glacier, the default values showed an MAE and Pearson correlation coefficient of 79.63 (W m-2) and 0.88, respectively, while the corrected data showed 38.15 (W m-2) and 0.85. It is worth noting that one AWS is located on the ablation tongue of Kara-Batkak glacier and is surrounded by steep slopes. In contrast, the station on the Bordu glacier is located on a flatter, more open slope. This can be observed in (Figure 4C), where the lower values in the cold period have a slight deviation compared to Kara-Batkak site.
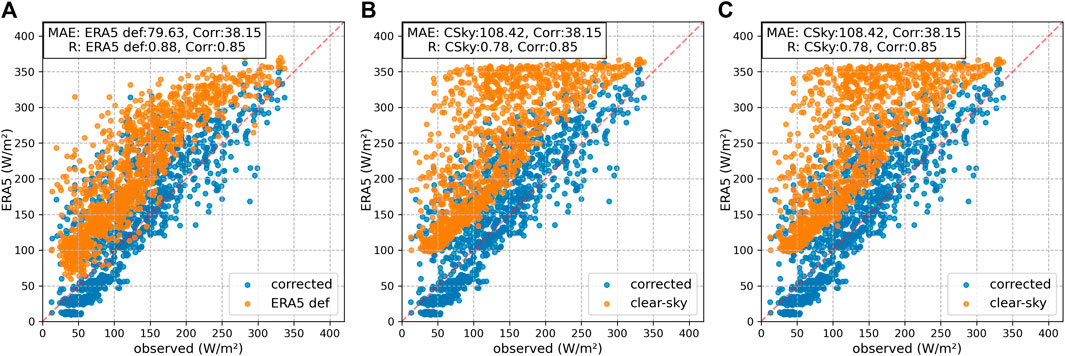
Figure 4. Correction of shortwave radiation. (A) Data from AWS on Kara-Batkak glacier with default ERA5 (B) Kara-Batkak with clear-sky (C) Bordu with clear-sky.
4.2 Evaluation against discharge data
The evaluation of hydrograph simulation is typically conducted using several evaluation metrics, most commonly the Nash-Sutcliffe efficiency (NSE), Kling-Gupta efficiency (KGE), and percent bias (PBIAS). The NSE is a widely used metric for hydrologic simulations that quantify the overall performance of a model by comparing the simulated and observed values (Nash and Sutcliffe, 1970). The KGE is a more recently developed metric (Gupta et al., 2009) that is based on the correlation coefficient and the standard deviation ratio of observed and simulated data. Finally, the PBIAS (%) metric measures the overall bias of the simulations, with values near zero indicating a good fit (Moriasi et al., 2015). Each of these metrics provides an important aspect of the simulation, with the NSE providing an overall evaluation of the model performance and the KGE and PBIAS providing a more detailed view of the model accuracy.
The Chon-Kyzyl-Suu river basin (Figure 5A), due to its large area of glaciation, reaches its highest point in July-August. This fact was validated through the simulation results, which resulted in NSE, KGE, and PBIAS values of 0.785, 0.75, and 9.67%, respectively. Unfortunately, data for part of 2008 was lost due to a malfunction of the runoff gauge.
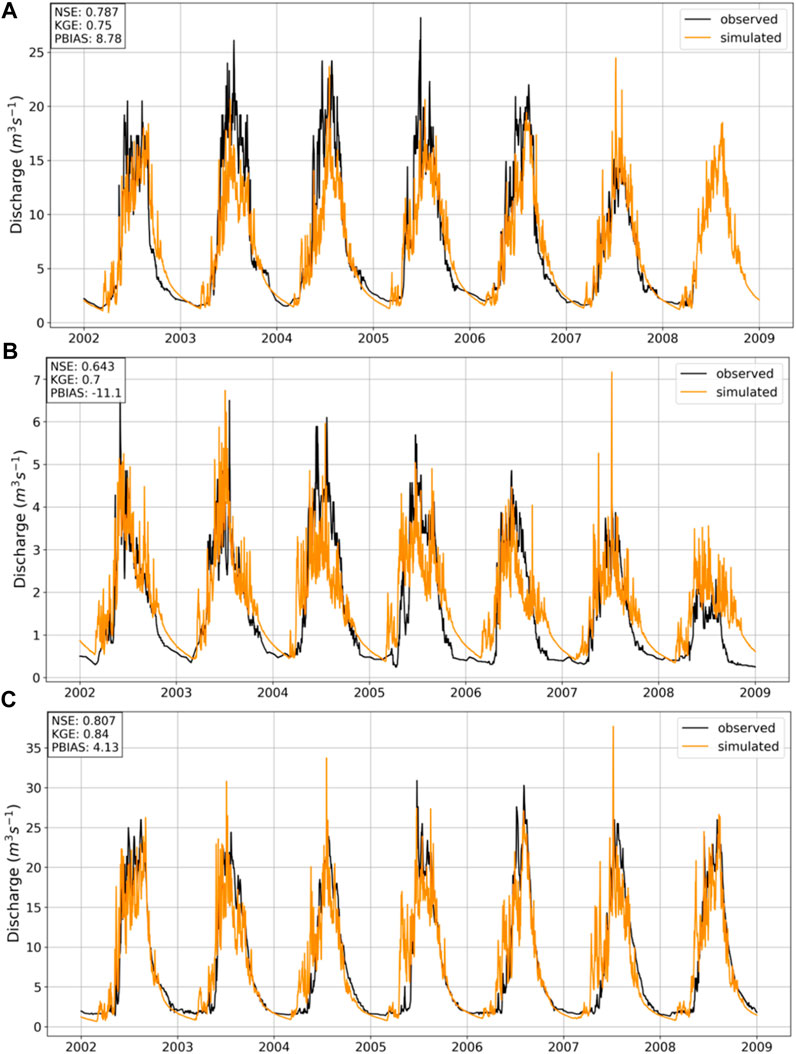
Figure 5. Discharge between 2002 and 2009 of (A) Chon-Kyzyl-Suu, (B) Kichi-Kyzyl-Suu, and (C) Djuuku basins.
The Kichi-Kyzyl-Suu small basin (Figure 5B) is relatively less studied and meteorological data is not available, making it difficult to assess its climatic features. Nevertheless, the hydrograph simulation returned NSE, KGE, and PBIAS values of 0.643, 0.72, and −9.49%, respectively.
The Djuuku River basin (Figure 5C) has the largest area amongst the studied basins, but due to its position in the west, Lake Issyk-Kul has less influence on the precipitation. Meteorological data is not available, and the simulation results of the hydrograph yielded a NSE value of 0.806, KGE of 0.84, and PBIAS of 4.57%. This is relatively similar to the Chon-Kyzyl-Suu basin, and suggests that the model captures the influence of glaciers on the overall water balance and streamflow dynamics.
The three study basins have different ratios of glaciation and distinct precipitation patterns. The Issyk-Kul Lake basin exhibits a precipitation gradient due to moisture transfer from the lake, primarily from west to east. This variation in precipitation affects the seasonal patterns of runoff in each basin. The Kichi-Kyzyl-Suu basin experiences maximum runoff in May-June, while the Chon-Kyzyl-Suu and Juuku basins show peak values in July-August, primarily due to glacial runoff.
4.3 Glacier mass balance
The results of the mass balance were taken from the regional gridded simulation of the models. The simulation’s start and end of the glaciological season correspond to the dates from the WGMS report on the observed data. Thus, we analysed the reference glaciers Kara-Batkak, Sary-Tor, Bordu, No. 354, and Batysh-Sook, though only Kara-Batkak Glacier is located in the studied catchments (Figure 1B). This allows us to evaluate the performance of our models in capturing the mass balance dynamics across a range of glacier systems in the region. This validation process provides valuable insights into the overall robustness and credibility of our modelling approach.
Figure 6 shows that the values vary depending on the climatic characteristics of the location of the glaciers. The results of mass balance simulations on Kara-Batkak glacier showed great agreement with the observed data, including the evaluation of discharge data from the Kashkator river (Figure 7). The values on the Sary-Tor and Bordu glaciers have a slight deviation, but on average they coincide. The significant deviation observed for Glacier No. 354, compared to neighbouring glaciers like Bordu, can be attributed to differences in the methods used for calculating the mass balance. In particular, the discrepancy may arise from variations between geodetic mass balance calculations and instrumental stake observations (Kronenberg et al., 2016). It was difficult to demonstrate the results on Batysh-Sook glacier due to the small size of the glacier and the relatively low resolution of the model. It can be observed that the model grid resolution cannot completely cover the altitudinal zones on the glacier’s tongue (Supplementary Figure S3).
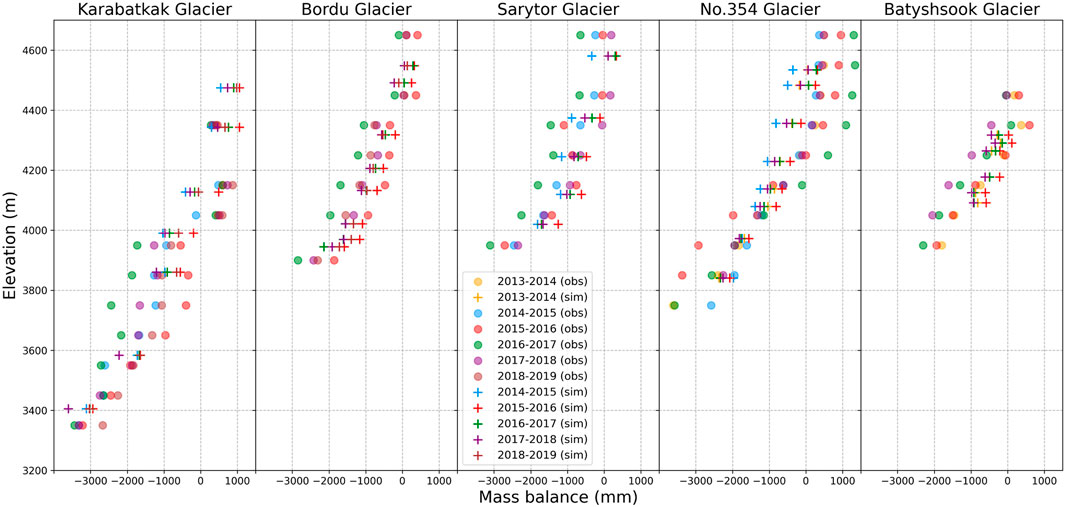
Figure 6. Observed and simulated mass balance profiles of observed glaciers (Figure 1B). Different colours are set for glaciological years.
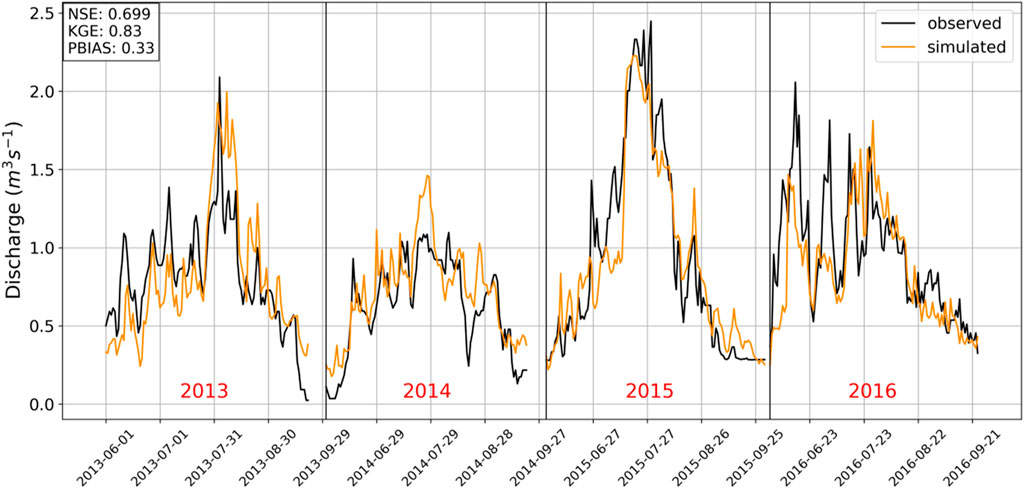
Figure 7. Modelled summer discharge of Kashkator River at headwaters (Figure 8) compared with runoff gauge.
Kara-Batkak glacier tongue is surrounded by mountain slopes (Figure 8) and experiences prolonged shading throughout the day. To monitor the melting of its lower part, twenty one stakes have been deployed by Tien-Shan High Mountain Scientific Center of the Academy of Sciences of Kyrgyzstan within the glacier’s ablation zone. A comparative analysis of the observed ablation (Figure 9) with modelling results from 2008 to 2015 revealed a notable difference in the melting rate caused by input data. Corrected meteorological forcing from ERA5 data, which incorporates topographic and cloud-based adjustments for shortwave downward radiation, produced more accurate results relative to observations, with RMSE of 0.23 m water equivalent (m w.e.) and MAE of 0.17 m w.e. Conversely, utilisation of uncorrected ERA5 data produced results with RMSE of 0.73 m w.e. and MAE of 0.69 m w.e. On average, without topographic correction, glacier mass-balance simulations overestimated melting rates by 30% within Kara-Batkak glacier tongue.
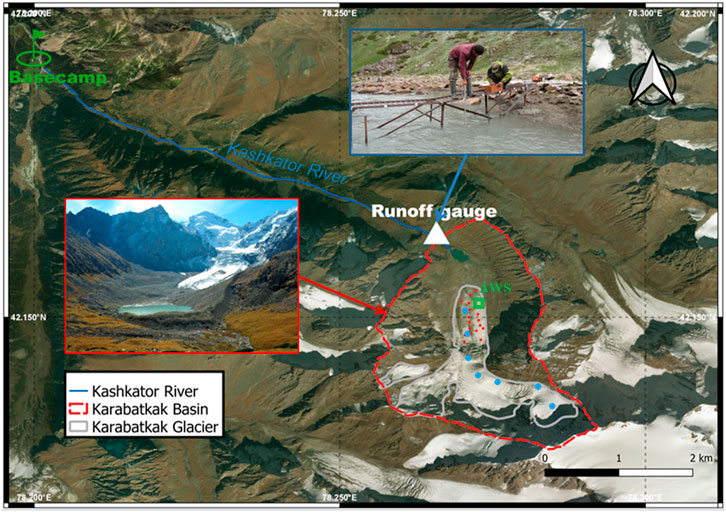
Figure 8. Kara-Batkak glacier and Kashkator river area. Location of ablation stakes on the lower part of the glacier (red dots), snow pits (blue dots) and AWS (green rectangle).
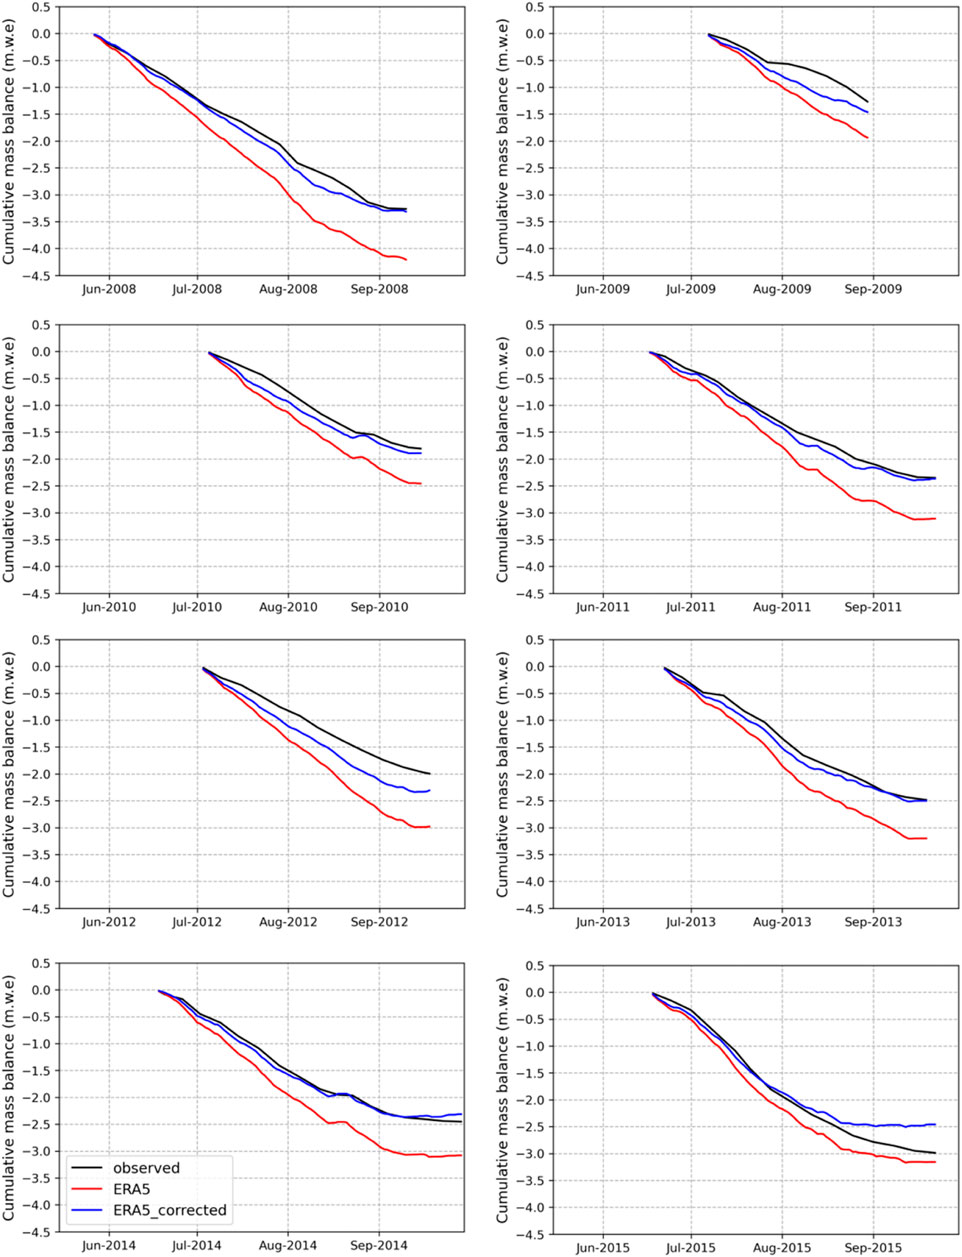
Figure 9. Comparison of observed and simulated mass balances with and without shortwave downward radiation correction on the lower part of Kara-Batkak glacier. Observed values are aggregated stake measurements on ablation zone (Figure 8).
4.4 Snow water equivalent on the glacier
The results obtained from the mass balance of the GLIMB model were compared on the Bordu glacier with the observed data (Figure 10). The snow water equivalent (SWE) was measured with SnowFox (cosmic ray neutron sensor produced by Hydroinnova) (Figure 1D), and the melting of the glacier surface with Sonic Ranger (Campbell SR50A), considering that the ice density is 900 kg m−³. Thus, in the 2019 modelling, the maximum seasonal snow accumulation was on June 25th with a value of 175 mm w.e., while the data measured with cosmic rays showed a maximum on June 14th with a value of 177 mm w.e. It should be noted that the model did not take into account snow transport by wind, which SnowFox recorded. Due to technical problems, Sonic Ranger could not record ice melting in August 2019, and we used the WGMS reported data from observations. Thus, at 4,100–4,200 m a.s.l. (the AWS is located at 4,137 m a.s.l.) of the Bordu Glacier, the seasonal mass balance for 2019 was −1,170 mm w.e. The maximum modelled seasonal melt of the same period was −1,053 mm w.e. Precipitation has a significant influence on the difference in ice melt results. If snowfall occurred during the observation period (a frequent event on the glacier in summer), then ice melting stops consequently until the snowpack melts (Fujita and Ageta, 2000).
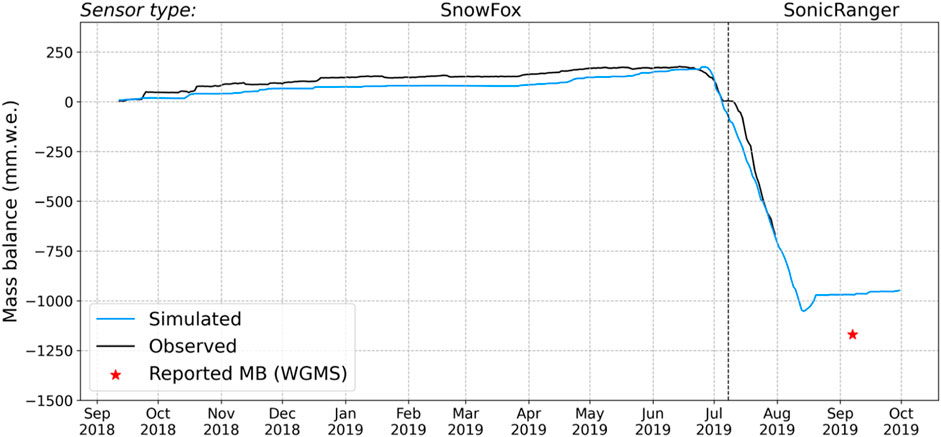
Figure 10. Observed and simulated daily mass balance at Bordu glacier (4,137 m a.s.l.). Red star indicates seasonal mass balance change at the end of the observation period (2018/09/12–2019/09/07) reported to World Glacier Monitoring Service (WGMS) (Zemp et al., 2021). Sensor type indicates a recording instrument for a certain period of observations.
4.5 Runoff components
Analysis of the components of river basin runoff was undertaken using modelling results, which were compared with average elevation values. Figure 11 displays the relationship between elevation (horizontal axis), percentage of each component (left vertical axis) and runoff of components in millimeters (right vertical axis). It can be seen that rain contribution is reduced with increasing altitude, and snow contribution is increased. From the beginning of the glacier zone, the contribution of ice melting to basin runoff increases. Evaporation, in contrast, decreases with elevation; for example, in the Chon-Kyzyl-Suu basin in the zone of 2,100–2,200 m a.s.l., evaporation was estimated to be 400 mm, and at 4,400 m a.s.l., the value was close to zero due to the combined effects of lower temperatures and reduced availability of water vapour in the atmosphere. The distribution of runoff components also varied between nearby basins, with glacial runoff primarily dependent on the percentage of glaciation, while rainfall runoff and snowmelt runoff were determined by the prevailing climatic conditions in the region and individual topographic characteristics of studied basins.
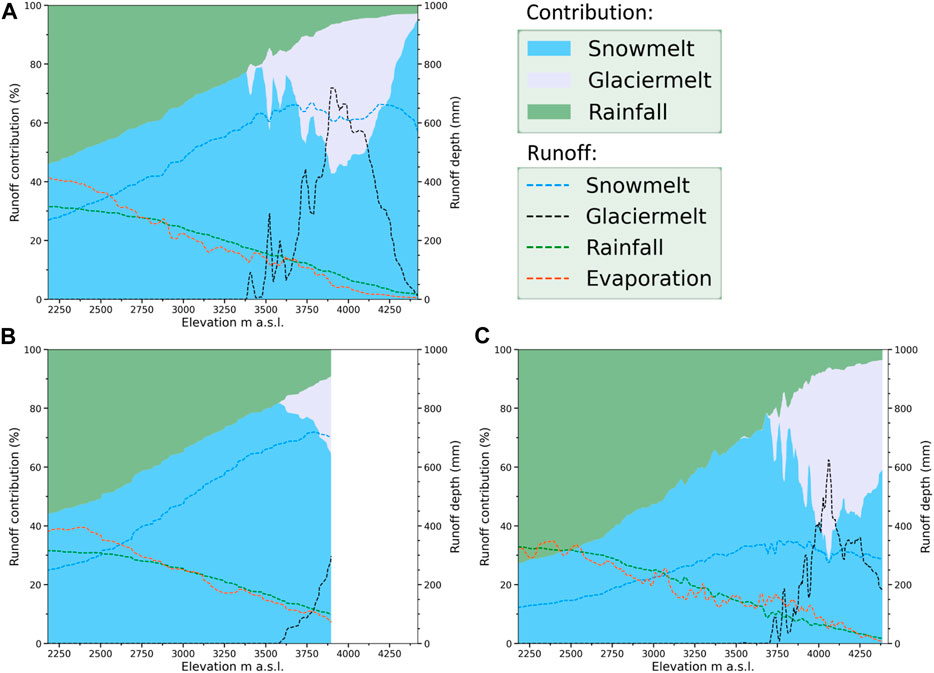
Figure 11. Runoff components along elevation for (A) Chon-Kyzyl-Suu, (B) Kichi-Kyzyl-Suu, and (C) Djuuku. The left axis represents the percentage of the total runoff. The right axis represents runoff depth. Evaporation is given in absolute values.
The contribution of glaciers to the runoff in different basins varies depending on the extent of glaciation and precipitation patterns. In the Chon-Kyzyl-Suu Basin, where glacial coverage is about 11.4% of the area, glaciers contribute approximately 50% of the water runoff during July and August, and 23% annually, with snowmelt and rainfall contributing 60% and 17%, respectively (Figure 12). The less glaciated Kichi-Kyzyl-Suu Basin (1.8% in area) is primarily sourced by snowmelt and rainfall throughout the year, with contributions of 64% and 22%, respectively, while glaciers contribute around 25% during July and August and 8% annually. In the Djuuku Basin (8.3% in area), glaciers contribute about 54% of the water runoff during July and August, and 27% annually, with snowmelt and rainfall contributing 50% and 23%, respectively. The contribution of glaciers to the seasonal runoff varies not only based on the degree of glaciation but also on the amount and distribution pattern of precipitation.
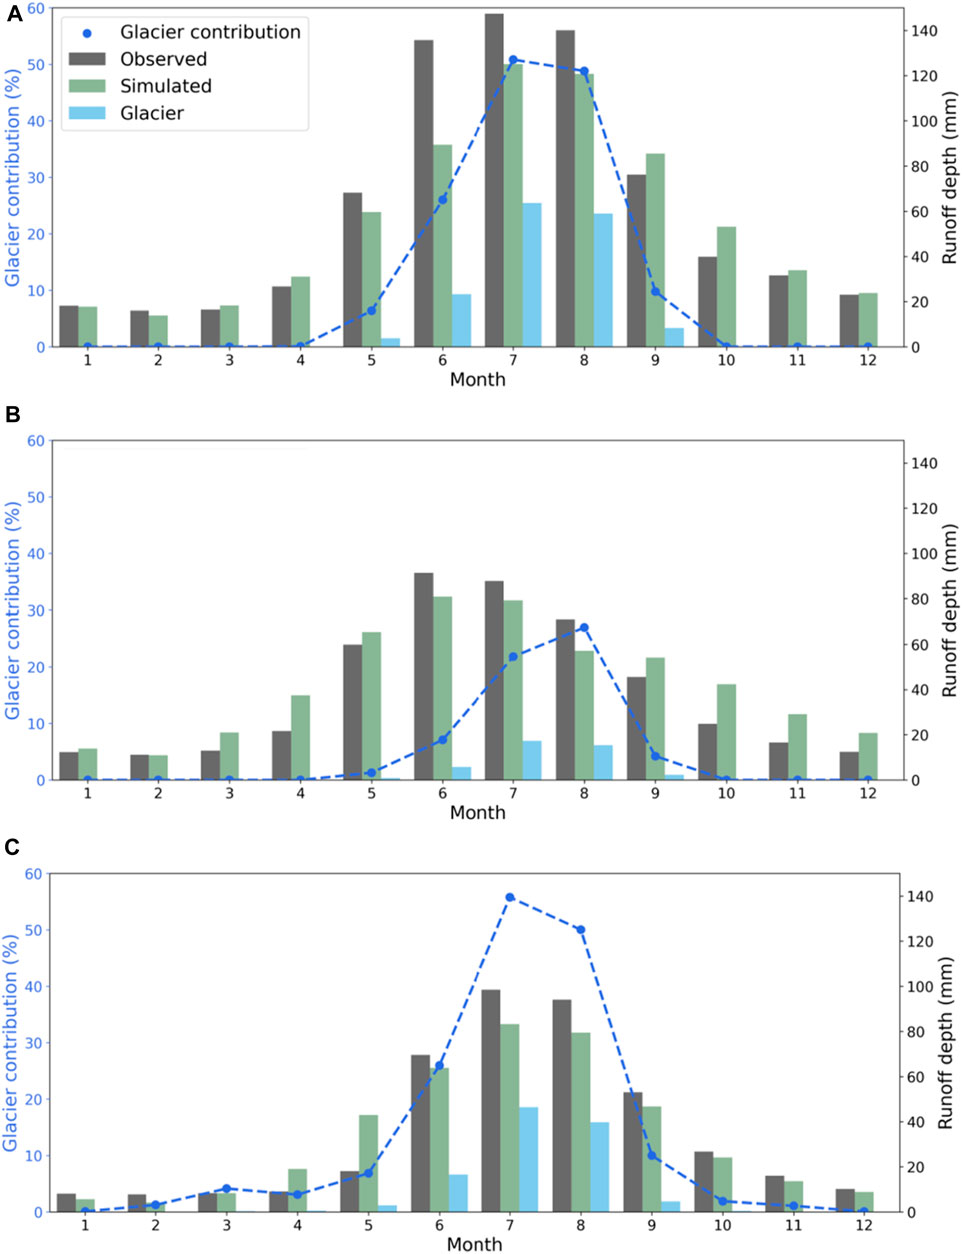
Figure 12. Monthly runoff depths and glacier contribution for (A) Chon-Kyzyl-Suu (B) Kichi-Kyzyl-Suu (C) Djuuku basins (2002–2008).
5 Discussion
In this study, we analysed water balance components in terms of annual composition and seasonal distribution. The distribution of runoff components in nearby basins exhibits variability, with glacial runoff primarily influenced by the percentage of glaciation, while rainfall runoff and snowmelt runoff are determined by various factors related to climatic conditions in the region and topography. The partitioning of precipitation into rain and snow is a key factor in determining the average snowmelt component. The results obtained for seasonal glacier melt emphasise the significant role of topography in modelling melting processes throughout the year. The results also highlight the sensitivity of incoming solar radiation to cloud cover and the effectiveness of a simple parameterisation approach based on reanalysis data that takes into account cloud transmissivity. This approach can be applied to other regions with similar characteristics to improve the accuracy of ice and snow melt modelling.
Complex physical models may offer certain advantages over degree-day models in the context of glacio-hydrological modelling. These advantages include the potential to capture spatial variability by considering factors such as topography and shading, as well as the ability to incorporate energy balance components and process interactions. Integrating mass balance modelling of glaciers into hydrological models is crucial for accurately simulating streamflow and assessing water resources in glacierised catchments (Schaefli et al., 2005; Konz and Seibert, 2010). However, differences in temporal and spatial resolution among models can introduce additional variations in model outputs, even for the same type of model. Most of the fully distributed glaciological models run at grid resolutions between 10 m and 250 m (Pellicciotti et al., 2014), and higher resolutions generally provide more accurate representations of the system but require more computational resources and longer runtimes. The use of a 1 km resolution in our study was found to be optimal for regional simulations due to constraints and data availability. This resolution struck a balance between capturing detailed spatial variations and ensuring sufficient data for accurate modelling. While this lower resolution may introduce some errors and limitations in capturing spatial variability and finer-scale processes, it is important to find an appropriate balance considering research goals.
Mass balance gradients play a crucial role in estimating glaciological modelling performance, providing insights into the processes driving ice accumulation and ablation, such as snowfall, melting, and sublimation along the elevation. Modelled mass balance gradients (Figure 6) highlight that the model resolution may introduce uncertainties in calculating the mass balance of small-scale glaciers. This is because the model may not fully cover the elevation bins necessary to capture the variations in mass balance accurately. High-resolution glaciological simulations, which consider the representation of mass balance gradients, can provide more precise results for such cases. Additionally, the lack of high-resolution input data, particularly the gradients of precipitation and temperature strongly related to elevation, contributes to the uncertainties in the modelled mass balance gradients.
According to the results of mass balance modelling, we can estimate that the overall mass balance gradient for the Sary-Tor Glacier is 0.3 m w.e. yr-1 per 100 m, for Kara-Batkak 0.37 m w.e. yr-1 per 100 m, for Bordu 0.34 m w.e. yr-1 per 100 m, for Batysh-Sook 0.4 m w.e. yr-1 per 100 m and 0.31 m w.e. yr-1 per 100 m for the Glacier No. 354 compared with previous research in the study area, for the Davydov Glacier (adjacent to the Sary-Tor Glacier), this value was 0.3 m w.e. yr-1 per 100 m (Aizen and Zakharov, 1989) (Table 3). For Sary-Tor 0.4 m w.e. yr-1 per 100 m (Ushnurtsev, 1991), and for Batysh-Sook, the gradient was 0.45 m w.e. yr-1 per 100 m (Kenzhebaev et al., 2017). During the reconstruction of the glaciers’ mass balance in the study region, the gradient was between 0.5 m w.e. and 0.6 m w.e. yr-1 per 100 m (van Tricht et al., 2021), in the ablation zone of glacier No.354 it was estimated as 0.68 m w.e. yr-1 per 100 m (Kronenberg et al., 2016) and for south-faced Grigoriev glacier it was 0.6 m w.e. yr-1 per 100 m (Fujita et al., 2011). Due to the limitations of temperature downscaling at a resolution of 1 km and the consistent representation of precipitation as in the dataset, the modelled gradients may not adequately capture the spatial variability of the glacier or cover specific elevation bands of the glacier (Figure 6). Regional climate conditions and precipitation patterns influence the accumulation component of a glacier. This is evident in the case of Bordu and Glacier No.354, two adjacent glaciers that exhibit a significant difference in observed snow accumulation during the 2015–2017 seasons. At an elevation of 4,650 m, the snow accumulation for Bordu was 410 mm, −100 mm, and 100 mm for consecutive years, while for Glacier No. 354, it was 954 mm, 1,300 mm, and 484 mm for the corresponding years. However, it is important to note that the variability in observed snow accumulation can be attributed to differences in the methods used for data collection. These variations in observation methods can contribute to the observed variability in snow accumulation between the two glaciers.
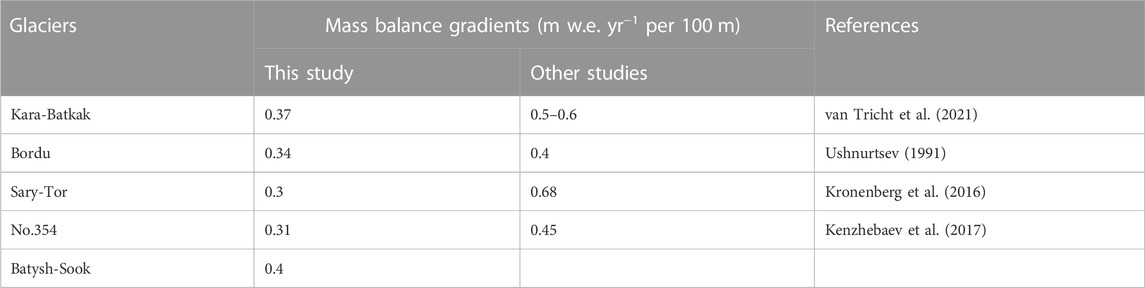
Table 3. Comparison of mass balance gradients of modelled glaciers.
The study findings showed the varying magnitudes of glacier contribution in the three examined basins. In addition to the extent of the glaciated area, the precipitation pattern and amount significantly influence glacier contribution. Previous research on twenty-four catchments in the Tien-Shan Mountains utilising the glacier-enhanced Soil and Water Assessment Tool (SWAT) model demonstrated a strong correlation between the glaciated area of the catchment and ice melt contribution, averaging at 10.5% (Zhang et al., 2016). Within a small catchment encompassing the Kara-Batkak glacier, modelling results estimated a glacier melt contribution of 47% during the glacier melting season. Previous long-term studies on runoff sources in the region conducted by Dikikh and Mikhailova (1976) reported an average glacier contribution of 50% to total runoff. These findings align with the analysis of recent hydrometeorological data conducted by Satylkanov (2018). Catchments with lower degrees of glaciation exhibit considerably lower ice melt runoff contributions, consequently affecting the overall runoff (Figure 11B). Higher elevations with greater glacier coverage yield higher runoff volumes and may be affected by significant changes in runoff variability as glaciers melt. However, it is essential to note that accurately simulating glacier runoff and estimating its contribution to overall water flow involves considering various factors and potential sources of uncertainty. One crucial factor is the inclusion of shortwave radiation correction in the modelling process. For instance, within the Kara-Batkak glacier tongue, average melting rates were overestimated by 30% when radiation correction was not applied. This highlights the significance of accounting for topographic effects to reduce uncertainties and improve the accuracy of glacier contribution estimations.
Additionally, the uncertainties associated with subsurface flow in high mountain areas, including the Tien-Shan, highlight the need for further research and exploration to improve our understanding of these processes. The observed overestimation of fall season flows in the Kichi-Kyzyl-Suu catchment (Figure 5) could be attributed to differences in subsurface flow patterns compared to other basins. Somers and McKenzie (2020) described the main features that distinguish groundwater processes in mountainous areas from lower relief areas. High surface topography causes deeper groundwater circulation, which affects the dominant local flow paths and flow rates (Forster and Smith, 1988). The unexplored nature of these processes, especially in the Tien-Shan, limits the ability to accurately describe the water cycle in mountain systems. Hydrogeological parameters of the subsurface are complicated, especially considering glacial deposition processes which can significantly distort the results of modelling on a regional scale.
6 Conclusion
This study utilised a land surface model with an integrated glaciological component to analyse the various runoff components in glaciated basins. Solar radiation downscaling techniques were employed to incorporate local topographic features into the dataset, while cloud transmissivity was parameterised using AWS and reanalysis data. The results of discharge, mass balance of reference glaciers, and snow water equivalent were compared with observed data to evaluate the model’s performance.
The findings highlight the primary factors influencing the contribution of glaciers to the study basins, namely, the percentage of glaciation within the basin and the prevailing regional climate. It was observed that the maximum glacier contribution occurred during July and August, reaching up to 54% in some basins. On an annual scale, the average glacier contribution across the basins was found to be 19%, with snowmelt and rainfall ratios of 58% and 23%, respectively. These results underscore the importance of considering both the extent of glaciation within the basin and the climatic conditions in accurately determining the overall contribution of glaciers to the hydrological system.
The model results demonstrated a good agreement with observed data, as indicated by the Nash-Sutcliffe Efficiency (NSE) values ranging from 0.64 to 0.81 and Kling-Gupta Efficiency (KGE) values ranging from 0.72 to 0.84 for discharge. The modelling of snow water equivalent also showed good agreement with observation data on Bordu glacier, while the modelled mass balance of reference glaciers exhibited a gradient of 0.3 m w.e. to 0.4 m yr-1 per 100 m.
Furthermore, comparing observed ablation on Kara-Batkak glacier with modelling results revealed the significant impact of input data on the melting rate. Glacier mass-balance simulations overestimated melting rates by 30% within Kara-Batkak glacier tongue without topographic correction. However, the use of corrected shortwave downward radiation data from ERA5, which incorporates topographic and cloud-based adjustments, yielded more accurate results for seasonal mass balance relative to observations. Incorporating accurate topographic data in glacier melt modelling was essential for understanding hydrological processes and predicting the amount and timing of meltwater runoff from glaciers. Accurate modelling of glacier meltwater runoff is crucial for comprehending the implications of climate change on water resources, natural hazards, and ecosystem dynamics in mountainous regions.
Lack of observation data affects the error in correcting the reanalysis data. Inaccessibility of high altitude areas and lack of resources for monitoring affect progress in developing appropriate models. The availability of precipitation data is critical because regional climatic variability can have a particular impact on precipitation patterns. For the forcing data, future studies should focus on the distribution pattern of precipitation in high mountainous areas and snow-rain separation factors.
This study’s primary focus is to determine the runoff components of the high-altitude river basin for a relatively short period. The glaciation area was left unchanged to reduce the uncertainty of the results regarding the dynamic component of glacier evolution. Nevertheless, it is necessary to consider glaciers’ geometry change for more extended simulations and predictions of the future state. Physical-based hydrology models depend on accurate and precise data inputs, particularly in regions with complex topography and climatic variations. However, with careful validation of models using in-situ observational data, these models can provide valuable insights into the dynamics of water resources and glacier degradation.
This study analysed the components of river basin runoff from the modelling results and compared them with average altitude values. The findings demonstrate the potential of land surface models in predicting runoff components in glaciated basins, offering valuable insights into the hydrological processes of high-mountain basins that can contribute to water resources management and climate change risk assessment. However, the lack of observation data poses a challenge in accurately correcting reanalysis data, and the availability of precipitation data is crucial for model validation. Therefore, expanding the analysis to cover additional regions and enhancing the observational network will undoubtedly improve the reliability and performance of the model.
Data availability statement
The raw data supporting the conclusion of this article will be made available by the authors, without undue reservation.
Author contributions
SS: Conceptualization, Data curation, Formal Analysis, Investigation, Methodology, Software, Validation, Visualization, Writing–original draft. KT: Conceptualization, Funding acquisition, Investigation, Methodology, Project administration, Resources, Supervision, Writing–review and editing. RS: Funding acquisition, Investigation, Resources, Data curation. TK: Conceptualization, Investigation, Data curation, Methodology, Supervision, Writing–review and editing. YT: Methodology, Supervision, Writing–review and editing. KF: Formal Analysis, Software, Supervision, Investigation, Writing–review and editing.
Funding
The author(s) declare financial support was received for the research, authorship, and/or publication of this article. This work was supported by JSPS Grant-in-Aid for Scientific Research (16H06291 and 21H05002).
Conflict of interest
The authors declare that the research was conducted in the absence of any commercial or financial relationships that could be construed as a potential conflict of interest.
Publisher’s note
All claims expressed in this article are solely those of the authors and do not necessarily represent those of their affiliated organizations, or those of the publisher, the editors and the reviewers. Any product that may be evaluated in this article, or claim that may be made by its manufacturer, is not guaranteed or endorsed by the publisher.
Supplementary material
The Supplementary Material for this article can be found online at: https://www.frontiersin.org/articles/10.3389/feart.2023.1306476/full#supplementary-material
SUPPLEMENTARY FIGURE S1 | Comparison of observed daily temperature and downscaled reanalysis data on Karabatkak glacier (JRA55—Japanese Reanalysis).
SUPPLEMENTARY FIGURE S2 | Comparison of observed daily temperature and downscaled reanalysis data on Bordu glacier.
SUPPLEMENTARY FIGURE S3 | Graph represents 1 km grid cells of the model with corresponding averaged elevation values compared to a 30 m DEM (colored). Batysh-Sook glacier extent is represented by red line boundaries (RGI 6.0).
References
Aizen, V., and Aizen, E. M. (1997). Hydrological cycles on the north and south peripheries of mountain–glacial basins of central asia. Hydrol. Process. 11 (5), 451–469. doi:10.1002/(sici)1099-1085(199704)11:5<451::aid-hyp448>3.0.co;2-m
Aizen, V., and Zakharov, V. (1989). Mass balance and ice flow velocity of Davydov Glacier basing on research in 1984–1985. Data Glaciol. Stud. 67, 197–202.
Aizen, V. B., Aizen, E. M., and Melack, J. M. (1996). Precipitation, melt and runoff in the northern Tien Shan. J. Hydrology 186, 229–251. doi:10.1016/S0022-1694(96)03022-3
Alifujiang, Y., Abuduwaili, J., Maihemuti, B., Emin, B., and Groll, M. (2020). Innovative trend analysis of precipitation in the Lake Issyk-Kul basin, Kyrgyzstan. Atmosphere 11 (4), 332. doi:10.3390/atmos11040332
Bernauer, T., and Siegfried, T. (2012). Climate change and international water conflict in Central Asia. J. Peace Res. 49, 227–239. doi:10.1177/0022343311425843
Chen, H., Chen, Y., Li, W., and Li, Z. (2019). Quantifying the contributions of snow/glacier meltwater to river runoff in the Tianshan Mountains, Central Asia. Glob. Planet. Change 174, 47–57. doi:10.1016/j.gloplacha.2019.01.002
Chen, Y., Li, W., Deng, H., Fang, G., and Li, Z. (2016). Changes in central asia’s water tower: past, present and future. Sci. Rep. 6, 35458. doi:10.1038/srep35458
Cox, P., Betts, R., Bunton, C., Essery, R., Rowntree, P., and Smith, J. (1999). The impact of new land surface physics on the GCM simulation of climate and climate sensitivity. Clim. Dyn. 15, 183–203. doi:10.1007/s003820050276
Deardorff, J. W. (1977). A parameterization of ground-surface moisture content for use in atmospheric prediction models. J. Appl. Meteorology 16, 1182–1185. doi:10.1175/1520-0450(1977)016<1182:apogsm>2.0.co;2
Dikikh, A., and Mikhailova, V. (1976). Regime of glaciers and water balance on the northern slope of the Terskei-Alatoo Moscow. Science 5, 131.
Dyurgerov, M. (2010). Reanalysis of glacier changes: from the IGY to the IPY, 1960–2008. Data Glaciol. Stud. 108, 1–116.
Eidhammer, T., Booth, A., Decker, S., Li, L., Barlage, M., Gochis, D., et al. (2021). Mass balance and hydrological modeling of the Hardangerjøkulen ice cap in south-central Norway. Hydrology Earth Syst. Sci. 25 (8), 4275–4297. doi:10.5194/hess-25-4275-2021
Farinotti, D., Usselmann, S., Huss, M., Bauder, A., and Funk, M. (2012). Runoff evolution in the Swiss Alps: projections for selected high-alpine catchments based on ENSEMBLES scenarios. Hydrol. Process. 26, 1909–1924. doi:10.1002/hyp.8276
Finger, D. C., Pellicciotti, F., Konz, M., Rimkus, S., and Burlando, P. (2011). The value of glacier mass balance, satellite snow cover images, and hourly discharge for improving the performance of a physically based distributed hydrological model. Water Resour. Res. 47 (7). doi:10.1029/2010wr009824
Forster, C., and Smith, L. (1988). Groundwater flow systems in mountainous terrain: 1. Numerical modeling technique. Water Resour. Res. 24, 999–1010. doi:10.1029/WR024i007p00999
Fujita, K., and Ageta, Y. (2000). Effect of summer accumulation on glacier mass balance on the Tibetan Plateau revealed by mass-balance model. J. Glaciol. 46, 244–252. doi:10.3189/172756500781832945
Fujita, K., and Sakai, A. (2014). Modelling runoff from a Himalayan debris-covered glacier. Hydrol. Earth Syst. Sci. 18, 2679–2694. doi:10.5194/hess-18-2679-2014
Fujita, K., Takeuchi, N., Nikitin, S. A., Surazakov, A. B., Okamoto, S., Aizen, V. B., et al. (2011). Favorable climatic regime for maintaining the present-day geometry of the Gregoriev Glacier, inner Tien Shan. Cryosphere 5, 539–549. doi:10.5194/tc-5-539-2011
Garen, D. C., and Marks, D. (2005). Spatially distributed energy balance snowmelt modelling in a mountainous river basin: estimation of meteorological inputs and verification of model results. J. Hydrology 315, 126–153. doi:10.1016/j.jhydrol.2005.03.026
Greuell, W., Knap, W. H., and Smeets, P. C. (1997). Elevational changes in meteorological variables along a midlatitude glacier during summer. J. Geophys. Res. Atmos. 102, 25941–25954. doi:10.1029/97jd02083
Gupta, H. V., Kling, H., Yilmaz, K. K., and Martinez, G. F. (2009). Decomposition of the mean squared error and NSE performance criteria: implications for improving hydrological modelling. J. hydrology 377, 80–91. doi:10.1016/j.jhydrol.2009.08.003
He, Z., Duethmann, D., and Tian, F. (2021). A meta-analysis based review of quantifying the contributions of runoff components to streamflow in glacierized basins. J. Hydrology 603, 126890. doi:10.1016/j.jhydrol.2021.126890
Hersbach, H., Bell, B., Berrisford, P., Hirahara, S., Horányi, A., Muñoz-Sabater, J., et al. (2020). The ERA5 global reanalysis. Q. J. R. Meteorological Soc. 146, 1999–2049. doi:10.1002/qj.3803
Hock, R. (2003). Temperature index melt modelling in mountain areas. J. hydrology 282, 104–115. doi:10.1016/s0022-1694(03)00257-9
Hock, R., and Huss, M. (2021). “Glaciers and climate change,” in Climate change (Amsterdam, Netherlands: Elsevier), 157–176.
Hoelzle, M., Azisov, E., Barandun, M., Huss, M., Farinotti, D., Gafurov, A., et al. (2017). Re-establishing glacier monitoring in Kyrgyzstan and Uzbekistan, Central Asia. Geoscientific Instrum. Methods Data Syst. 6, 397–418. doi:10.5194/gi-6-397-2017
Hoelzle, M., Mittaz, C., Etzelmüller, B., and Haeberli, W. (2001). Surface energy fluxes and distribution models of permafrost in European mountain areas: an overview of current developments. Permafr. Periglac. Process. 12, 53–68. doi:10.1002/ppp.385
Huss, M., and Hock, R. (2018). Global-scale hydrological response to future glacier mass loss. Nat. Clim. Change 8, 135–140. doi:10.1038/s41558-017-0049-x
Immerzeel, W. W., van Beek, L. P. H., and Bierkens, M. F. P. (2013). Rising river flows throughout the twenty-first century in two Himalayan glacierized watersheds. Nat. Geosci. 6, 742–745. doi:10.1038/ngeo1896
Immerzeel, W. W., van Beek, L. P. H., and Bierkens, M. F. P. (2010). Climate change will affect the asian water towers. Science 328, 1382–1385. doi:10.1126/science.1183188
Jobst, A. M., Kingston, D. G., Cullen, N. J., and Sirguey, P. (2017). Combining thin-plate spline interpolation with a lapse rate model to produce daily air temperature estimates in a data-sparse alpine catchment. Int. J. Climatol. 37, 214–229. doi:10.1002/joc.4699
Kenzhebaev, R., Barandun, M., Kronenberg, M., Chen, Y., Usubaliev, R., and Hoelzle, M. (2017). Mass balance observations and reconstruction for Batysh Sook glacier, tien Shan, from 2004 to 2016. Cold Regions Sci. Technol. 135, 76–89. doi:10.1016/j.coldregions.2016.12.007
Kondo, J., and Xu, J. (1997). Seasonal variations in the heat and water balances for nonvegetated surfaces. J. Appl. Meteorology 36, 1676–1695. doi:10.1175/1520-0450(1997)036<1676:svitha>2.0.co;2
Konz, M., and Seibert, J. (2010). On the value of glacier mass balances for hydrological model calibration. J. Hydrology 385 (1-4), 238–246. doi:10.1016/j.jhydrol.2010.02.025
Kronenberg, M., van Pelt, W., Machguth, H., Fiddes, J., Hoelzle, M., and Pertziger, F. (2022). Long-term firn and mass balance modelling for Abramov glacier, Pamir Alay (preprint). Glaciers/Energy Balance Obs/Modelling. doi:10.5194/tc-2021-380
Kronenberg, M., Barandun, M., Hoelzle, M., Huss, M., and Farinotti, D. (2016). Mass-balance reconstruction for Glacierglacier No. 354, tien Shan, from 2003 to 2014. Ann. Glaciol. 57, 92–102. doi:10.3189/2016AoG71A032
Leavesley, G. H. (1994). Modeling the effects of climate change on water resources—a review. Assess. Impacts Clim. Change Nat. Resour. Syst., 159–177. doi:10.1007/978-94-011-0207-0_8
Lehning, M., Völksch, I., Gustafsson, D., Nguyen, T. A., Stähli, M., and Zappa, M. (2006). ALPINE3D: a detailed model of mountain surface processes and its application to snow hydrology. Hydrological Process. Int. J. 20, 2111–2128. doi:10.1002/hyp.6204
Luo, Y., Wang, X., Piao, S., Sun, L., Ciais, P., Zhang, Y., et al. (2018). Contrasting streamflow regimes induced by melting glaciers across the Tien Shan – pamir – North Karakoram. Sci. Rep. 8, 16470. doi:10.1038/s41598-018-34829-2
Marshall, S. J., Sharp, M. J., Burgess, D. O., and Anslow, F. S. (2007). Near-surface-temperature lapse rates on the Prince of Wales Icefield, Ellesmere Island, Canada: implications for regional downscaling of temperature. Int. J. Climatol. 27, 385–398. doi:10.1002/joc.1396
Martinec, J., and Rango, A. (1986). Parameter values for snowmelt runoff modelling. J. Hydrology 84, 197–219. doi:10.1016/0022-1694(86)90123-x
Minder, J. R., Mote, P. W., and Lundquist, J. D. (2010). Surface temperature lapse rates over complex terrain: lessons from the Cascade Mountains. J. Geophys. Res. Atmos. 115. doi:10.1029/2009JD013493
Moriasi, D. N., Gitau, M. W., Pai, N., and Daggupati, P. (2015). Hydrologic and water quality models: performance measures and evaluation criteria. Trans. ASABE 58, 1763–1785.
Nash, J. E., and Sutcliffe, J. V. (1970). River flow forecasting through conceptual models part I—A discussion of principles. Journal of Hydrology 10 (3), 282–290. doi:10.1016/0022-1694(70)90255-6
Naz, B. S., Frans, C. D., Clarke, G. K. C., Burns, P. J., and Lettenmaier, D. P. (2014). Modeling the effect of glacier recession on streamflow response using a coupled glacio-hydrological model. Hydrology Earth Syst. Sci. 18 (2), 787–802. doi:10.5194/hess-18-787-2014
Niu, G.-Y., and Yang, Z.-L. (2007). An observation-based formulation of snow cover fraction and its evaluation over large North American river basins. J. Geophys. Res. Atmos. 112. doi:10.1029/2007JD008674
Nuimura, T., Sakai, A., Taniguchi, K., Nagai, H., Lamsal, D., Tsutaki, S., et al. (2015). The GAMDAM glacier inventory: a quality-controlled inventory of Asian glaciers. Cryosphere 9, 849–864. doi:10.5194/tc-9-849-2015
Olson, M., and Rupper, S. (2019). Impacts of topographic shading on direct solar radiation for valley glaciers in complex topography. Cryosphere 13, 29–40. doi:10.5194/tc-13-29-2019
Pellicciotti, F., Carenzo, M., Bordoy, R., and Stoffel, M. (2014). Changes in glaciers in the Swiss Alps and impact on basin hydrology: current state of the art and future research. Sci. Total Environ. 493, 1152–1170. doi:10.1016/j.scitotenv.2014.04.022
Pellicciotti, F., Raschle, T., Huerlimann, T., Carenzo, M., and Burlando, P. (2011). Transmission of solar radiation through clouds on melting glaciers: a comparison of parameterizations and their impact on melt modelling. J. Glaciol. 57, 367–381. doi:10.3189/002214311796406013
Pepin, N., Bradley, R. S., Diaz, H. F., Baraer, M., Caceres, E. B., Forsythe, N., et al. (2015). Elevation-dependent warming in mountain regions of the world. Nat. Clim. Change 5, 424–430. doi:10.1038/nclimate2563
Petrakov, D., Tutubalina, O., Shpuntova, A., Kovalenko, N., Usubaliev, R., Azisov, E., et al. (2019). Assessment of glacier albedo in the Ak-Shyirak mountains (inner Tien Shan) from ground-based and Landsat data. Earth’s Cryosphere XXIII, 13–24. doi:10.21782/KZ1560-7496-2019-3(13-24
Ragettli, S., Pellicciotti, F., Immerzeel, W. W., Miles, E. S., Petersen, L., Heynen, M., et al. (2015). Unraveling the hydrology of a Himalayan catchment through integration of high resolution in situ data and remote sensing with an advanced simulation model. Adv. Water Resour. 78, 94–111. doi:10.1016/j.advwatres.2015.01.013
Rasmy, M., Sayama, T., and Koike, T. (2019). Development of water and energy budget-based rainfall-runoff-inundation model (WEB-RRI) and its verification in the kalu and mundeni river basins, Sri Lanka. J. Hydrology 579, 124163. doi:10.1016/j.jhydrol.2019.124163
Rasul, G., and Molden, D. (2019). The global social and economic consequences of mountain cryospheric change. Front. Environ. Sci. 7, 91. doi:10.3389/fenvs.2019.00091
RGI Consortium Arendt, A., Bliss, A., Bolch, T., Cogley, J. G., Gardner, A. S., et al. (2017). “Zheltyhina N randolph Glacier Inventory - a dataset of global glacier outlines: version 6.0,” in Global land ice measurements from space (Boulder Colorado, USA: GLIMS). doi:10.7265/N5-RGI-60
Rybak, O. O., Satylkanov, R., Rybak, E. A., Gubanov, A. S., Korneva, I. A., and Tanaka, K. (2021). Parameterization of shortwave solar radiation in glaciological applications. Russ. Meteorol. Hydrol. 46, 495–506. doi:10.3103/S106837392108001X
Sakai, A. (2019). Brief communication: updated GAMDAM glacier inventory over high-mountain Asia. Cryosphere 13, 2043–2049. doi:10.5194/tc-13-2043-2019
Satylkanov, R. (2018). Ablation of ice and snow of Kara-Batkak Glacier and its impact on river flow. JCC 4, 1–14. doi:10.3233/JCC-180009
Satylkanov, R. (2021). “Modern climate changes in the Issyk-Kul basin, their impact on water resources and the development of measures for their adaptation,” (Kyrgyzstan: Academy of Sciences of Kyrgyz Republic). Ph.D. Dissertation.
Sayama, T., Ozawa, G., Kawakami, T., Nabesaka, S., and Fukami, K. (2012). Rainfall–runoff–inundation analysis of the 2010 Pakistan flood in the Kabul River basin. Hydrological Sci. J. 57, 298–312. doi:10.1080/02626667.2011.644245
Schaefli, B., Hingray, B., Niggli, M., and Musy, A. (2005). A conceptual glacio-hydrological model for high mountainous catchments. Hydrology Earth Syst. Sci. 9 (1/2), 95–109. doi:10.5194/hess-9-95-2005
Sellers, P., Mintz, Y., Sud, Y. e. al, and Dalcher, A. (1986). A simple biosphere model (SiB) for use within general circulation models. J. Atmos. Sci. 43, 505–531. doi:10.1175/1520-0469(1986)043<0505:asbmfu>2.0.co;2
Sellers, P., Randall, D., Collatz, G., Berry, J., Field, C., Dazlich, D., et al. (1996). A revised land surface parameterization (SiB2) for atmospheric GCMS. Part I: model formulation. J. Clim. 9, 676–705. doi:10.1175/1520-0442(1996)009<0676:arlspf>2.0.co;2
Shen, Y.-J., Shen, Y., Goetz, J., and Brenning, A. (2016). Spatial-temporal variation of near-surface temperature lapse rates over the Tianshan Mountains, central Asia. J. Geophys. Res. Atmos. 121 (14), 006–014. doi:10.1002/2016JD025711
Somers, L. D., and McKenzie, J. M. (2020). A review of groundwater in high mountain environments. WIREs Water 7. doi:10.1002/wat2.1475
Sorg, A., Bolch, T., Stoffel, M., Solomina, O., and Beniston, M. (2012). Climate change impacts on glaciers and runoff in Tien Shan (Central Asia). Nat. Clim. Change 2, 725–731. doi:10.1038/nclimate1592
Tadono, T., Ishida, H., Oda, F., Naito, S., Minakawa, K., and Iwamoto, H. (2014). Precise global DEM generation by ALOS PRISM. ISPRS Ann. Photogrammetry, Remote Sens. Spatial Inf. Sci. 2, 71–76. doi:10.5194/isprsannals-ii-4-71-2014
Tanaka, K. (2004). “Development of the new land surface scheme SiBUC commonly applicable to basin water management and numerical weather prediction model,” (Kyoto: Graduate School of Engineering, Kyoto University). Doctoral Dissertation.
Unger-Shayesteh, K., Vorogushyn, S., Farinotti, D., Gafurov, A., Duethmann, D., Mandychev, A., et al. (2013). What do we know about past changes in the water cycle of Central Asian headwaters? A review. Glob. Planet. Change 110, 4–25. doi:10.1016/j.gloplacha.2013.02.004
Ushnurtsev, S. (1991). Mass balance fluctuations of the Sary-Tor glacier in inner Tien Shan and its reconstruction for the period 1930–1988. Data Glaciol. Stud. 71, 70–79.
Van Tricht, L., and Huybrechts, P. (2023). Modelling the historical and future evolution of six ice masses in the Tien Shan, Central Asia, using a 3D ice-flow model. Cryosphere 17, 4463–4485. doi:10.5194/tc-17-4463-2023
Van Tricht, L., Paice, C. M., Rybak, O., Satylkanov, R., Popovnin, V., Solomina, O., et al. (2021). Reconstruction of the historical (1750–2020) mass balance of Bordu, kara-batkak and sary-tor glaciers in the inner tien Shan, Kyrgyzstan. Front. Earth Sci. 9, 734802. doi:10.3389/feart.2021.734802
Verseghy, D. L. (1991). CLASS—a Canadian land surface scheme for GCMs. I. Soil model. Int. J. Climatol. 11, 111–133. doi:10.1002/joc.3370110202
Zemp, M., Nussbaumer, S. U., Gärtner-Roer, I., Bannwart, J., Paul, F., and Hoelzle, M. (2021). Global Glacier change bulletin nr. 4.
Zhang, Y., Luo, Y., Sun, L., Liu, S., Chen, X., and Wang, X. (2016). Using glacier area ratio to quantify effects of melt water on runoff. J. Hydrology 538, 269–277. doi:10.1016/j.jhydrol.2016.04.026
Zhao, L., Wu, Q., Marchenko, S. S., and Sharkhuu, N. (2010). Thermal state of permafrost and active layer in Central Asia during the international polar year. Permafr. Periglac. Process. 21, 198–207. doi:10.1002/ppp.688
Keywords: hydrological modelling, runoff components, glacier melt, radiation downscaling, Tien-Shan, Kyrgyzstan
Citation: Sadyrov S, Tanaka K, Satylkanov R, Khujanazarov T, Touge Y and Fujita K (2024) Modelling runoff components and hydrological processes in glaciated catchments of the inner Tien-Shan, Kyrgyzstan. Front. Earth Sci. 11:1306476. doi: 10.3389/feart.2023.1306476
Received: 03 October 2023; Accepted: 30 November 2023;
Published: 04 April 2024.
Edited by:
Morten Andreas Dahl Larsen, Danish Meteorological Institute (DMI), DenmarkReviewed by:
James McPhee, University of Chile, ChileLander Van Tricht, Vrije University Brussels, Belgium
Copyright © 2024 Sadyrov, Tanaka, Satylkanov, Khujanazarov, Touge and Fujita. This is an open-access article distributed under the terms of the Creative Commons Attribution License (CC BY). The use, distribution or reproduction in other forums is permitted, provided the original author(s) and the copyright owner(s) are credited and that the original publication in this journal is cited, in accordance with accepted academic practice. No use, distribution or reproduction is permitted which does not comply with these terms.
*Correspondence: Sanjar Sadyrov, sadyrovsan@gmail.com