Damage degradation law of mechanical properties of sandstone under different water-rich states
 Xiaolang He1,2
  Xin Hu
- 1College of Geology and Environment, Xi’an University of Science and Technology, Xi’an, Shaanxi, China
- 2China Coal Energy Research Institute Co, Ltd., Xi’an, China
- 3School of Mechanics and Engineering, Liaoning Technical University, Fuxin, Liaoning, China
Safety is the primary guarantee for achieving coal mine production. The degree of water in the overlying rock of the coal seam has a significant impact on the mechanical strength of the rock, which can lead to subsidence, roof collapse, and rock burst in the mining area. Therefore, it is important to study the law of water-rich damage and deterioration of coal seam overlying rock, as well as the characteristics of bursting liability to prevent and control mining disasters. This paper aims to investigate the change in compressive strength, elastic modulus, and bursting liability of coal measure strata under different water content and their relationship with lithology, particle size, pore characteristics, and mineral characteristics. We carried out uniaxial compression tests on drilled and prepared samples of coal measure strata in the east of Ordos City. We also monitored the acoustic emission characteristics of the rock failure process under different water content. The results demonstrate that, in the dry state, the compressive strength of siltstone >fine sandstone >medium sandstone >coarse sandstone. As the water content increases, the rock transitions from brittle to plastic, and the compressive strength, elastic modulus, and bursting liability gradually decrease. The stress-strain curve changes from a single peak to bimodal and multimodal, and the active degree of acoustic emission events decreases, especially the low-value ringing count. Calcareous cementation, clay minerals, and chlorite exhibit strong softening properties when subjected to water, while the grain skeleton (comprising quartz, feldspar, mica) and siliceous cementation displays weak softening properties in such conditions. The most significant is the mechanical strength deterioration of siltstone containing a clay matrix. The research findings can provide reference and theoretical support for safe mining practices in coal mines.
1 Introduction
The impact of water on the strength and deformation of rock materials is of utmost importance, as it can trigger a range of geological hazards, including collapse, subsidence, and water inrush (Iverson, 2000; Ma et al., 2019; Wu et al., 2019). This poses a significant threat to the stability of human engineering construction and safe mining (Zhou and Li, 2012; Wang et al., 2022). The water content serves as a crucial factor in controlling the properties of geotechnical engineering (Naji, 2018; Hemid et al., 2021). The mechanical properties of rock are subject to change under different water content. Therefore, to ensure safe mining, it is imperative to investigate the relationship between water content and the strength of coal seam overlying strata.
The mechanical strength of the overlying rock of a coal seam has a significant impact on the settlement and development of fracture zones after mining (Bastola, 2015), especially when the rock contain water, making it easier for them to separate and slip along sedimentary bedding and joints (Wu and Lin, 2021). As a result, numerous studies have been conducted on the shear strength of rock with varying water content. Due to the presence of capillary tension, the friction angle and cohesion of sandstone typically increase with increasing water content. However, when the water content continues to rise until saturation, the softening effect of water predominates, and the cementing key between particles transforms into a hydrogel key, reducing the connection force between particles and decreasing shear strength (Zhang et al., 2020). When the content of clay minerals is high, the deterioration of shear strength is more severev (Gui and Wu, 2014; Tang et al., 2020; Uyeturk and Huvaj, 2021).
The stress release after coal mining will not only cause shear failure of overlying rock, but also induce horizontal stress in surrounding strata (Hemid et al., 2021). When water is present in the roof overlying rock, the rock strata sag under the influence of tensile stress, leading to roof collapse. Therefore, Yasidu et al. (2017) conducted a study on the changes in tensile strength of coal-bearing rocks, feldspar sandstone, and fine-grained sandstone under varying water content. The findings revealed that the indirect tensile strength of rocks decreased with increasing humidity, and the strength of sandstone containing illite was highly susceptible to water, which aligns with the experimental outcomes of Li et al. (2019).
Previous research has focused on the compressive strength of coal pillars to achieve maximum coal recovery, with limited attention paid to the compressive strength of coal seam overburden (Verma, 2014). Deng et al. (2020) found based on nuclear magnetic resonance technology that the compressive strength decreases with an increase in the volume ratio of large pores and increases with an increase in the fractal dimension of pore size. The study by Qi et al. (2022) showed that compressive strength is exponentially negatively correlated with total porosity, and stress concentration and crack initiation preferentially occur in brittle quartz particles. The presence of water can lead to a sharp decrease in sandstone strength (Noël et al., 2021; Hu et al., 2022). Zang et al. (1996) used acoustic emission to monitor the failure process of wet rock cores and found that acoustic emission activity began at 84% of the fracture strength of wet rock cores (55 MPa) and 91% of the fracture strength of dry rock cores (87 MPa). The ratio of positional acoustic emission to recorded acoustic emission for dry rock core is 0.37, and the ratio of positional acoustic emission for fully wet rock core is 0.13. The negative slope of cumulative AE-amplitude frequency distribution drops by 50% before failure in dry rock cores. There has been relatively little comparison and correlation analysis of mechanical properties under different water contents in previous studies (Ding et al., 2023).
However, the unidirectional compressive strength of coal seam, roof, and floor rocks is often low in many mines, leading to stress concentration in the roof and floor near the coal pillar after mining and ultimately resulting in rockburst after exceeding the compressive limit (He et al., 2010; Maleki, 2017). Moreover, rockburst in theroof rock poses a greater security threat (Yin et al., 2002). The compressive strength and bursting liability of rock are important factors that contribute to rockburst and pressure bumping in coal mines. Lu et al. (2021) pointed out that water has a significant impact on the occurrence of rockburst. As such, this paper conducts uniaxial compression tests under different water content to calculate the compressive strength, elastic modulus, and bursting liability of coal measure strata samples. The study investigates the relationship between them and water content, lithology, particle size, pore characteristics, mineral characteristics, explores the water-rich damage deterioration law and bursting liability characteristics of overlying rock of coal seam, and examines the acoustic emission (AE) characteristics during the failure process. The findings of this study can provide theoretical and practical reference for the safe mining of coal mines.
2 Sample preparation and experimental procedure
The sampling site is located in the east of Ordos City in the Inner Mongolia Autonomous region of China (Figure 1). Coal measure strata with an elevation of 662.6–1,186.4 m were drilled to extract cores, which were then processed into cylindrical samples measuring Φ25 × 50 mm (Figure 2).
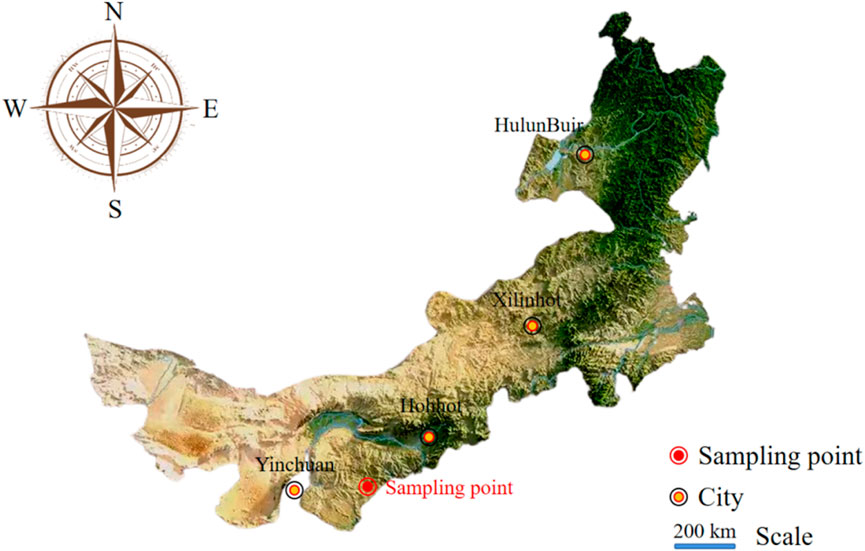
FIGURE 1. Location of sampling points.
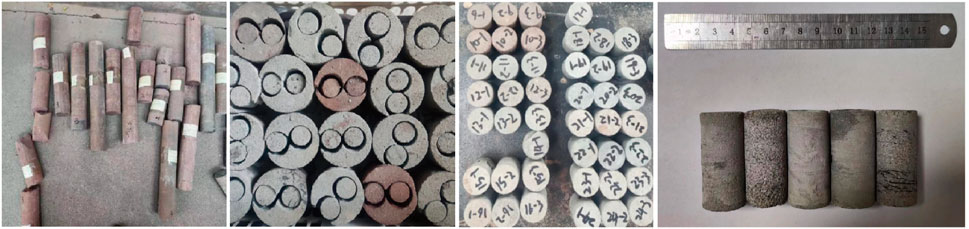
FIGURE 2. Sample preparation process.
Four types of rocks were selected for sampling: coarse sandstone, medium sandstone, fine sandstone, and siltstone, three parallel samples of each rock were taken. Each type of rock was divided into five groups with varying water content levels (Table 1). The samples were then dried using a DHG-9145A electric blast drying oven at 105°C for 24 h. Once the samples had reached a completely dry state, their quality was tested using a ME240/02 electronic balance. The five groups of samples were placed in a vacuum barrel and subjected to a vacuum for 2 h before being saturated with water for 24 h to test their saturation mass. The samples from the saturated group were retained and sealed with plastic wrap, while the samples from the dry group were dried once again. The samples from the remaining three groups were centrifuged for 5 min at 500, 1,000, and 2000 r using a TDZ5-WS centrifuge, and their quality was tested after centrifugation. Finally, all five groups of samples with varying water content levels were tested using a uniaxial compressive strength testing machine.
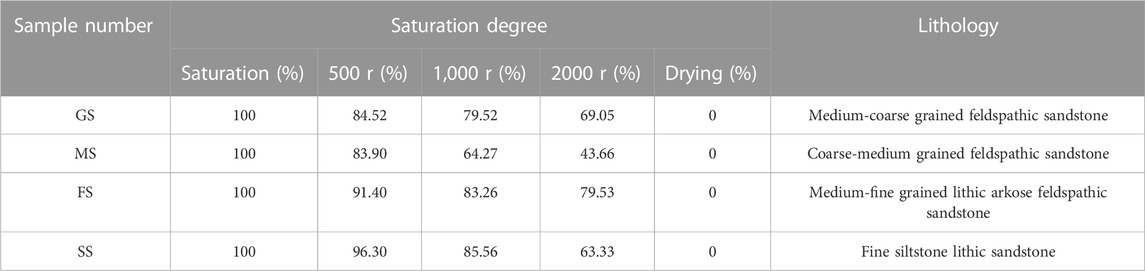
TABLE 1. Sample saturation and moisture content.
The saturation and moisture contents for the five groups of samples were calculated according to the quality difference, as shown in Table 1. GS is coarse sandstone, MS is medium sandstone, FS is fine sandstone, and SS is siltstone.
3 Experimental results
Sandstones of different particle sizes exhibit varying levels of saturated water content, as illustrated in Figure 3. Siltstone (SS), for instance, has the lowest saturated water content, measuring 5.59%. When subjected to centrifugation at a rotational speed of 2000 r for 5 min, the moisture content of siltstone only decreased by 1.43%. The water content curve of fine sandstone (FS), medium sandstone (MS), and coarse sandstone (GS) exhibited similar patterns, decreasing by 34.57%, 44.24%, and 32.28%, respectively, relative to their saturated water content levels.

FIGURE 3. Moisture content of the samples.
According to Hu et al. (2022), variations in water content are closely associated with pore structures. The pore structures of four lithologic sandstones were tested using low field nuclear magnetic resonance (NMR) technology to investigate this relationship, and transverse relaxation time T2 data were collected. Figure 4 displays the results of this test. The T2 concentration of siltstone was found to be between 0.1–1.3 m, and the signal amplitude was the highest, reaching 27.78 a. u. The T2 ranges of medium sandstones and fine sandstones were similar, and the signal amplitudes were both low. While, the maximum T2 value of coarse sandstone was notably expansive, with a peak value between 100–1,100 m, suggesting the presence of larger pores.
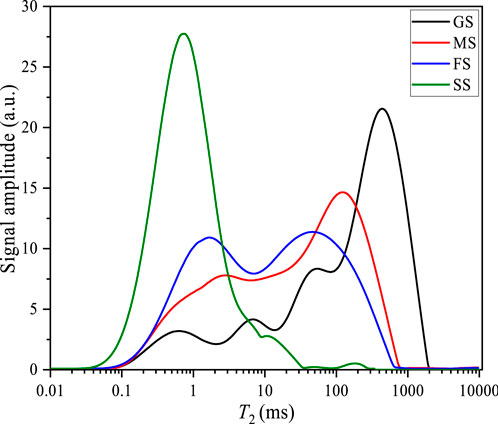
FIGURE 4. T2 spectral profiles recorded for the rock samples.
Water content affects the mechanical properties of rock. Uniaxial compression tests are carried out on sandstone samples varying in water content (Fan, 2019), the results are shown in Figure 5.
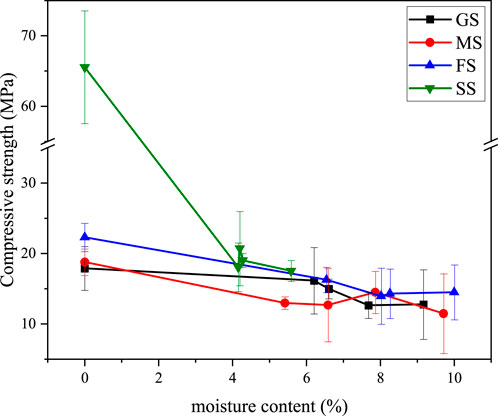
FIGURE 5. Changes in compressive strength with moisture content.
As the water content of rock samples increased, their compressive strength generally decreased. Among the samples, coarse sandstone experienced the smallest reduction in compressive strength, at only 28.65%, when exposed to the maximum water content. Therefore, the impact of water content on the mechanical properties of coarse sandstone is comparatively minor. Medium sandstone and fine sandstone experienced greater decreases in compressive strength, at 38.97% and 35.08%, respectively. However, the compressive strength of siltstone decreased the most, with a reduction of 73.30% relative to the drying group.
Water content also impacts the morphology of the stress–strain curve for rock samples, as shown in Figure 6. The stress-strain curve for samples in the drying group typically presents a single peak with a higher peak value. However, as the water content increases, the curve transforms from a high single peak to a low double peak or a low multiple peak. In particular, the peak value of saturated samples decreases significantly while the strain increases considerably. During the process of increasing load pressure, the rock interior rapidly transitions from an unstable state of high energy stress concentration to a state of low energy equilibrium. Excess energy released from the local source generates transient elastic waves, which are acoustic emission signals (Davidsen et al., 2007) that can be monitored using the RS-2A acoustic emission instrument. Therefore, acoustic emission signals from the entire rock fracturing process were collected using acoustic emission technology. Results for coarse sandstone and fine sandstone are presented in Figure 7 as examples.
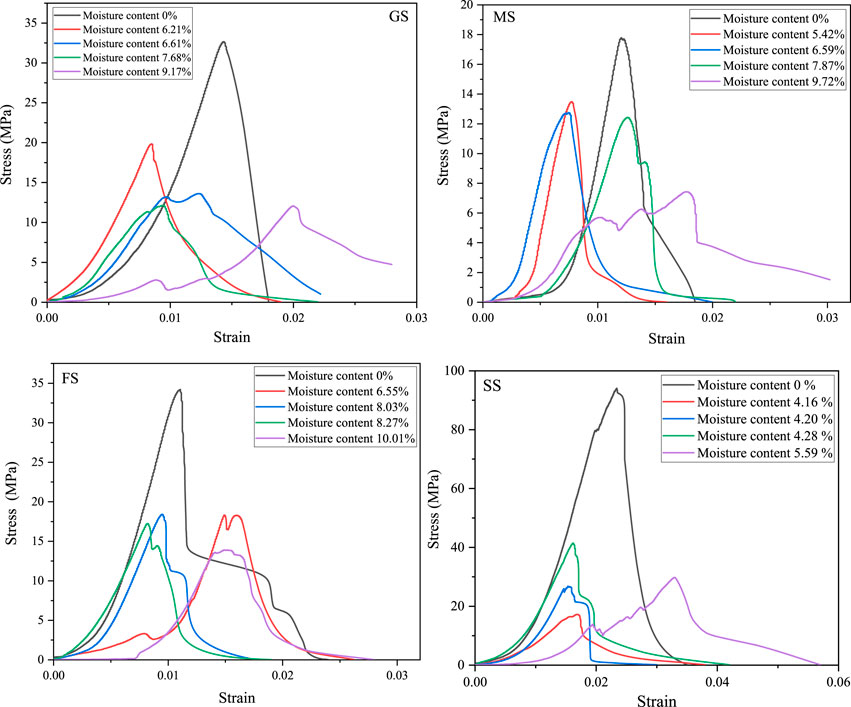
FIGURE 6. Comparison of stress-strain curves of samples with different water contents.
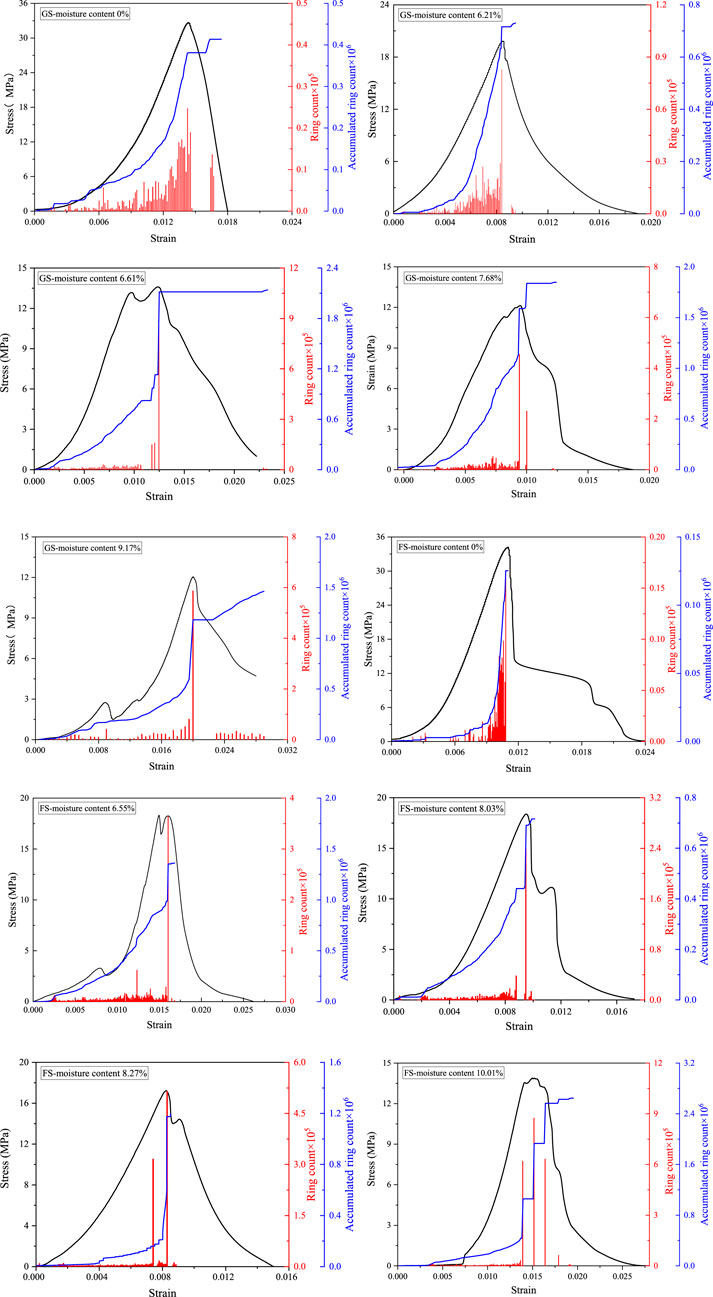
FIGURE 7. Acoustic emission characteristics.
The ringing count displayed an increasing trend and reached its maximum value at the peak stress. Additionally, both the ringing count and cumulative ringing count steadily increased under dry conditions. However, when the sample contained water, there were significant differences in the acoustic emission signals. Before the peak stress, the ringing count was generally small. A large ringing count would then be generated when the final destruction occurred. The cumulative ringing count increased slowly before reaching the maximum peak stress and forms a jump increase upon final destruction.
4 Analysis and discussion
To obtain pore structure information, such as pore size and content of rock samples, the T2-signal amplitude was converted into pore size r-pore volume ratio according to the relationship between T2-pore size r (Eq. (1)) (Figure 8). The pores inside the rock mass were classified into the categories of small pores (r<0.1 µm), mesoporous pores (0.1≤r≤1.0 µm), and large pores (r>1.0 µm) (Hu et al., 2022). The curve for pore size to the pore volume ratio of sandstones with different grain sizes varied significantly. The peak value of pore size of siltstones is higher between 0.001–0.01 μm, a large number of micropores was present (maximum: 92.75%). Additionally, the pore volume ratio of siltstones was zero at many places, indicating poor pore sorting and connectivity. The curve distribution of fine sandstone and middle sandstone was gentle, and the content of the three kinds of pores was more uniform. The pore volume ratio curve of coarse sandstone shifted significantly to the right, and the maximum pore size exceeded 30 µm. The peak of the curve was concentrated in the range of 2–30 μm, and the content of macropores was higher, accounting for 70.79%.
In the above equation, T2 is the total transverse relaxation time (ms), T2B is the volume relaxation time (ms), T2S is the surface relaxation time (ms), and T2D is the diffusion relaxation time (ms). When only one fluid is present in the pore, surface relaxation occurs much faster than volume relaxation, making T2B negligible. Additionally, if the magnetic field is uniform and the echo interval TE is sufficiently short, T2D can be disregarded (Liaw et al., 1996). Here ρ is the transverse surface relaxation strength coefficient (µm/ms), S is the pore surface area (µm2), and V is the pore volume (µm3) (Jia et al., 2020).
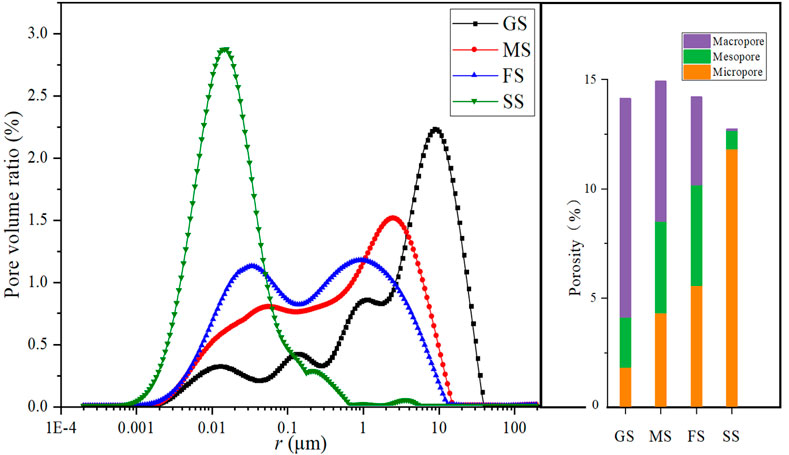
FIGURE 8. Pore structure of rock samples.
According to the low-field NMR test results shown in Figure 8, fine, medium, and coarse sandstone have a larger porosity, providing more space to store free water (Kim et al., 2008). Consequently, these sandstones exhibit higher water content after saturation, indicating a positive correlation between porosity and saturated water content. During centrifugation, free water in pores is mostly removed, leading to a rapid decrease in water content in the saturated −500r section (Figure 3) at low rotational speeds (500r). As centrifugal rotational speed increases, less residual free water can be separated, resulting in a slower decrease in water content in the 1,000 r-2000 r segment. After drying the rock samples at 105°C for 24 h, all free and adsorbed water in the pores evaporates, leading to a significant reduction in water content. Based on these observations, it is clear that the 5min-2000 r centrifugation did not separate a substantial amount of water and, at most, reduced the water content by 44.24% compared to saturation.
The porosity of medium sandstone is the largest, with uniform pore content across different pore sizes and good connectivity. Large and middle pores account for the majority, making removing internal free water during centrifugation easy and resulting in a significant drop in water content. In siltstone, micropores account for the majority (92.75%), and pore connectivity is poor. This makes it difficult to separate free water during centrifugation, resulting in the smallest change range of the water content. After centrifuged at 2000 r for 5 min, it only decreases by 25.58% (Hu et al., 2022).
The mechanical properties of rock samples are affected by their water content. As shown in Figure 5, there is a significant difference in compressive strength between dry siltstone samples and those containing water. The water content increased by 4.16%, while the compressive strength decreased by 72.49%. With a further increase in water content, the change in compressive strength decreases significantly until saturation, when the water content reaches 5.59%, with the decrease in compressive strength only increasing by 0.81%. This phenomenon is related to its mineral composition As shown in Table 2, many clay minerals and chlorite are present in the fillings between siltstone particles. These minerals have strong hydrophilicity and a significant softening effect in water (Yang and Wang, 2020), leading to a significant softening effect when exposed to water. Even after centrifugation removes part of the free water, the clay absorbs a lot of water (Tang et al., 2020), resulting in the low mechanical strength of siltstone and one of the reasons for the small decrease in water content during centrifugation. Upon absorbing water, clay minerals expand their lattice (Yao et al., 2022), compressing the pore space and clogging micropores, making it harder for water to escape.
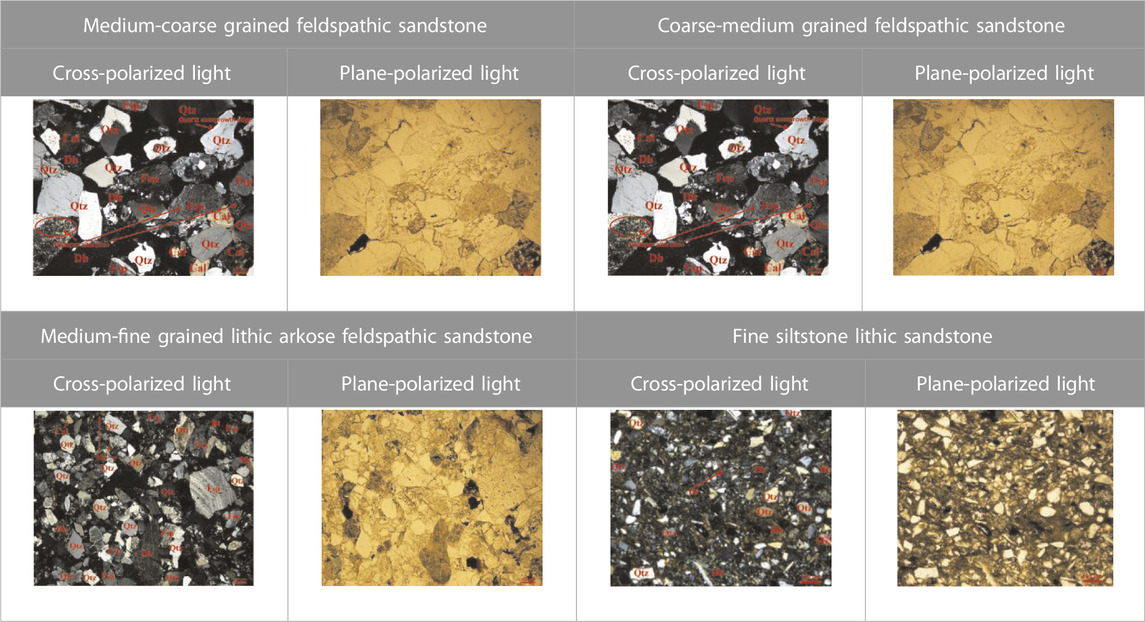
TABLE 2. Mineral composition of rock sample (Qtz: quartz; Fsp: feldspar; Bt: Biotite; Ms: Muscovite; Cal: calcite; Db: cuttings).
Water affects the mechanical properties of rocks by softening minerals, it has less effect on granular skeleton minerals such as quartz, feldspar and mica, while the effect on the fillings of clay and calcareous cementation is strong (Yasidu et al., 2017). The fillings in the coarse, medium, and fine sandstone studied in this paper are primarily siliceous, with a small amount of calcareous cementation (as shown in Table 2; Table 3). Notably, coarse sandstone contains a large amount of siliceous cementation, and the secondary enlargement of quartz occurs, with less cuttings and no chlorite. As a result, this type of rock sample has the weakest water-softening effect, the smallest reduction in compressive strength, and the most stable properties. Therefore, the mechanical strength of water-containing sandstone is primarily influenced by its mineral composition and content (Hu et al., 2023).
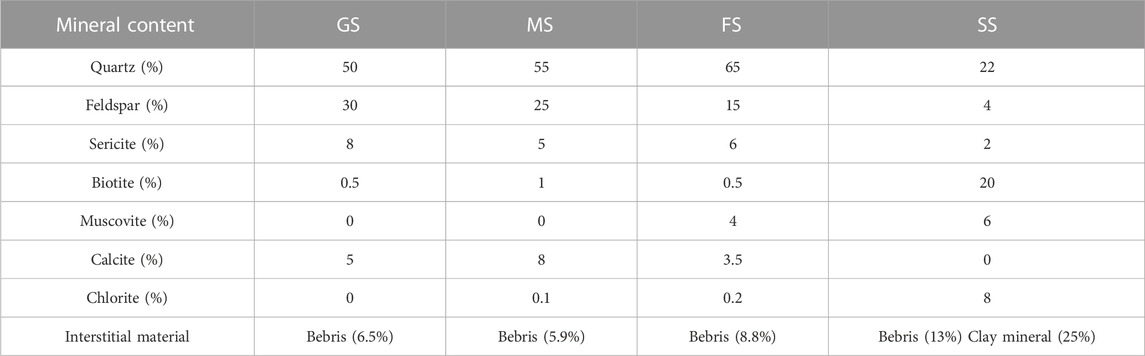
TABLE 3. Mineral percentage in rock samples.
Grain size is closely related to the mechanical properties of rock samples under dry conditions. Figure 4 shows that siltstone has the highest compressive strength under dry conditions, followed by fine sandstone, medium sandstone, and coarse sandstone, in that order. Siltstone particles are small and contain a large number of miscellaneous bases that fill the intergranular spaces. This results in a dense structure, a low degree of porosity, and a high number of micropores, which accounts for its maximum compressive strength when dry. As particle size increases, the porosity of the rock samples tends to increase. Coarse sandstone, observed under orthogonal polarizing and single polarizing mirrors, shows intergranular voids filled with a large amount of siliceous cementation and a small amount of calcrete cementation (as shown in Table 2), resulting in a slight decrease in its porosity. The mechanical strength of coarse sandstone is improved by both siliceous cementation and calcareous cementation, and its compressive strength is not greatly reduced compared to that of medium-fine sandstone.
Due to the softening effect of water, the mechanical behavior of rock samples changes from brittle to plastic, leading to changes in the stress-strain curve (Lu et al., 2021). When the rock sample is dry, it exhibits brittle failure, and the stress begins to decrease rapidly after reaching its peak. This results in a single high peak on the stress–strain curve (Figure 6). As the water content increases, the rock failure transitions to plastic failure. When the peak stress is reached, the rock undergoes micro-failure with small strain, followed by quick compaction and re-yielding as the stress continues to increase. This results in a transformation of the peak shape from single peak to double peak and multi-peak, especially when the rock sample reaches saturation. The maximum strain values of the rock samples increase significantly after multiple yielding. When the water content is low, the strain at the stress peak does not change significantly. However, when the rock sample is saturated, the plasticity of the rock is at its strongest, and the first failure occurs when the real maximum tolerable stress is reached. After the initial peak stress is exceeded, the rock undergoes compaction (as shown in Figure 9C), which increases its mechanical strength and generates a higher peak stress. This results in a significant increase in the strain corresponding to the new maximum peak stress.
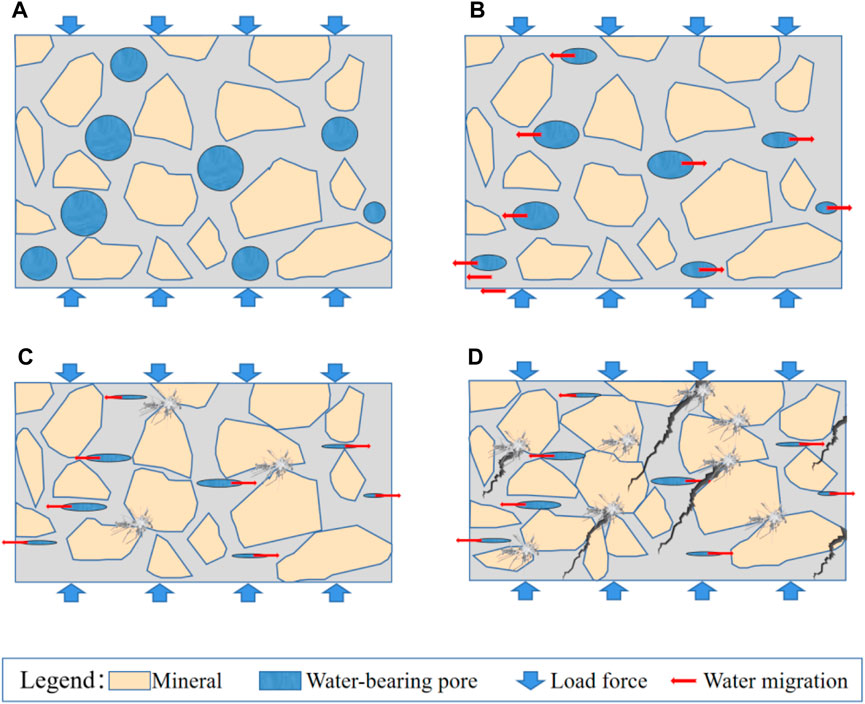
FIGURE 9. Schematic representation of the rock fracturing process.
After softening, the strain value increases under the same stress, decreasing the elastic modulus. Moreover, as the water content of sandstone increases, the elastic modulus decreases as well (Figure 10). In a dry state, sandstone breaks immediately after exceeding the maximum peak stress, and the deformation energy consumed after the peak is generally small, resulting in a larger impact energy index. After softening, the decrease in the elastic modulus of water-bearing sandstone leads to a decrease in the deformation energy accumulated before the peak. As the maximum strain value increases, the deformation energy dissipated after the peak value also increases, resulting in a decrease in the impact energy index, which is negatively correlated with the water content. Figure 10 shows that as the water content increases, the impact energy index decreases from the highest value of 2.037 to 1.043, and the bursting liability transforms from weak bursting liability to no bursting liability.
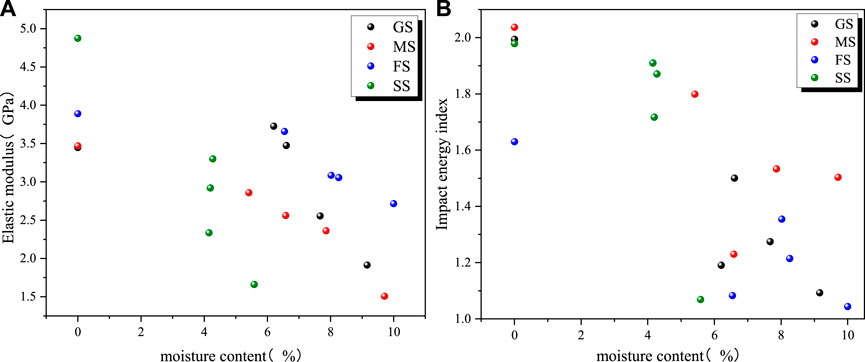
FIGURE 10. Changes in elastic modulus (A) and impact tendency (B) with water content.
Acoustic emission signals resulting from the generation and expansion of micro-cracks can reflect the number and intensity of micro-cracks during the rock fracturing process (Davidsen et al., 2007). As stress increases, compression and collapse of water-bearing pores inside the rock sample occur first, generating small AE signals (Figures 9A,B). As the rock sample continues to be compressed, the internal mineral particles start to crush and break each other, leading to an increase in the acoustic emission signal. When the rock is completely crushed, fractures within the sample coalesce to produce maximum signal values (Figures 9C,D). Acoustic emission ringing counts mainly focus on the early stage of the stress-strain curve (see Figure 7), but immediately decrease and disappear after the final rock failure. Like the ringing count, the cumulative ringing count mainly accumulates in the early stage and increases rapidly at peak stress. Therefore, micro-crack formation mainly occurs before the maximum peak stress, and each micro-failure produces a higher ringing count, with the ringing count reaching a peak at the maximum peak stress.
According to Zhao et al. (2021), as the water content increases, the relative energy within the rock transitioning from an unstable, high-energy stress concentration state to a low-energy state decreases, leading to a decrease in the active degree of acoustic emission events. The acoustic emission parameter values before the maximum peak stress of water-bearing sandstone exhibit a downward trend compared to the dry state, with this trend becoming more pronounced as the water content increases. A similar trend is observed in medium sandstone and siltstone. The softening effect of water on the rock in the early stage of failure reduces the relative energy of microfissure generation and expansion in the stage shown in Fig. 9abc, which inhibits the formation of low-value ringing counts. However, when the rock is fully crushed, the relative energy generated is high due to the complete connection of pores and cracks and the crushing of the grain framework, and the inhibitory effect of water on the ringing count generated in this process is not significant.
5 Conclusion
(1) The siltstone pore diameter is concentrated between 0.001 and 0.01μm, and there are more micropores, reaching 92.75%, and the connectivity is poor. The content of small pores, medium pores, and large pores in fine sandstone and medium sandstone is relatively uniform. The pore volume ratio curve of coarse sandstone shifted to the right obviously, and the pore size was concentrated between 2–30 μm, and the maximum pore size was more than 30 μm.
(2) In its dry state, siltstone has a higher compressive strength than fine sandstone, medium sandstone, and coarse sandstone, in that order. The compressive strength of sandstone decreases significantly with increasing water content, and as the moisture content increases, the magnitude of the decrease in compressive strength decreases. The maximum reduction of compressive strength at saturation is 73.3%.
(3) Mineral composition and content influence the mechanical properties of water-bearing sandstones. Calcareous cementation, clay minerals, and chlorite tend to soften when exposed to water, whereas the grain skeleton of quartz, feldspar, mica, and siliceous cementation are weak in softening. Among these, siltstones containing a clay matrix experience the most deterioration in mechanical strength.
(4) Under the action of water softening, rocks changes from being brittle to being plastic, resulting in a negative correlation between elastic modulus, impact tendency and water content. The stress-strain curve also changes from a single peak to a bimodal and multi-modal. The higher the water content is, the lower the relative energy inside the rock transitioning from unstable high energy stress concentration state to low energy state, and the lower the activity of acoustic emission events. This effect is particularly significant for low ringing count values.
Data availability statement
The original contributions presented in the study are included in the article/Supplementary Material, further inquiries can be directed to the corresponding author.
Author contributions
XH: Writing–review and editing. XH: Writing–original draft. ZP: Resources, Writing–original draft. DC: Data curation, Writing–original draft. DD: Visualization, Writing–original draft. GH: Validation, Writing–original draft. JX: Investigation, Writing–original draft. YZ: Supervision, Writing–review and editing.
Funding
The author(s) declare financial support was received for the research, authorship, and/or publication of this article. This work was supported by National Natural Science Foundation project (Grant No. 52174116).
Conflict of interest
Authors XH, ZP, DC, DD, GH, and JX were employed by China Coal Energy Research Institute Co, Ltd.
The remaining authors declare that the research was conducted in the absence of any commercial or financial relationships that could be construed as a potential conflict of interest.
Publisher’s note
All claims expressed in this article are solely those of the authors and do not necessarily represent those of their affiliated organizations, or those of the publisher, the editors and the reviewers. Any product that may be evaluated in this article, or claim that may be made by its manufacturer, is not guaranteed or endorsed by the publisher.
References
Bastola, S. (2015). Shear strength and stiffness properties of bedding planes and discontinuities in coal measure rocks. Illinois: Southern Illinois University at Carbondale.
Davidsen, J., Stanchits, S., and Dresen, G. (2007). Scaling and universality in rock fracture. Phys. Rev. Lett. 98 (12), 125502. doi:10.1103/PhysRevLett.98.125502
Deng, H., Tian, G., Yu, S., Jiang, Z., Zhong, Z., and Zhang, Y. (2020). Research on strength prediction model of sand-like material based on nuclear magnetic resonance and fractal theory. Appl. Sci. 10 (18), 6601. doi:10.3390/app10186601
Ding, Z. W., Zhang, C. F., Huang, X., Liu, Q. S., Liu, B., Gao, F., et al. (2023). Recognition method of coal–rock reflection spectrum using wavelet scattering transform and bidirectional long–short-term memory. Rock Mech. Rock Eng. doi:10.1007/s00603-023-03600-z
Fan, J. (2019). Evaluating the material strength from fracture angle under uniaxial loading. Front. Struct. Civ. Eng. 13, 288–293. doi:10.1007/s11709-018-0480-8
Gui, M., and Wu, Y. (2014). Failure of soil under water infiltration condition. Eng. Geol. 181, 124–141. doi:10.1016/j.enggeo.2014.07.005
He, M., Miao, J., and Feng, J. (2010). Rock burst process of limestone and its acoustic emission characteristics under true-triaxial unloading conditions. Int. J. Rock Mech. Min. Sci. 47 (2), 286–298. doi:10.1016/j.ijrmms.2009.09.003
Hemid, E. M., Kántor, T., Tamma, A. A., and Masoud, M. A. (2021). Effect of groundwater fluctuation, construction, and retaining system on slope stability of avas hill in Hungary. Open Geosci. 13 (1), 1139–1157. doi:10.1515/geo-2020-0294
Hu, X., Sun, Q., Wang, S., Wei, S., Ding, X., and Zhao, X. (2022). Study on deterioration characteristics of combustion metamorphic rocks under dry–wet cycling. Bull. Eng. Geol. Environ. 81 (11), 467–520. doi:10.1007/s10064-022-02966-8
Hu, X., Sun, Q., Geng, J., Wei, S., and Ding, X. (2023). Study on influencing factors of radon exhalation from coal measures in the northern margin of Ordos Basin[J]. Process Safety and Environmental Protection 178, 807–817. doi:10.1016/j.psep.2023.08.059
Iverson, R. M. (2000). Landslide triggering by rain infiltration. Water Resour. Res. 36 (7), 1897–1910. doi:10.1029/2000WR900090
Jia, H., Ding, S., Zi, F., Dong, Y., and Shen, Y. (2020). Evolution in sandstone pore structures with freeze-thaw cycling and interpretation of damage mechanisms in saturated porous rocks. Catena 195, 104915. doi:10.1016/j.catena.2020.104915
Kim, M. I., Chae, B. G., and Nishigaki, M. (2008). Evaluation of geotechnical properties of saturated soil using dielectric responses. Geosciences J. 12, 83–93. doi:10.1007/s12303-008-0010-0
Li, M., Lin, G., Zhou, W., Mao, X., and Mao, R. (2019). Experimental study on dynamic tensile failure of sandstone specimens with different water contents. Shock Vib. 2019, 1–15. doi:10.1155/2019/7012752
Liaw, H. K., Kulkarni, R., Chen, S., and Watson, A. T. (1996). Characterization of fluid distributions in porous media by NMR techniques. AIChE J. 42 (2), 538–546. doi:10.1002/aic.690420223
Lu, A., Chang, X., Hu, S., Xia, Y., and Li, M. (2021). Impact of moisture content on the brittle-ductile transition and microstructure of sandstone under dynamic loading conditions. Adv. Civ. Eng. 2021, 1–16. doi:10.1155/2021/6690171
Ma, D., Duan, H., Li, X., Li, Z., Zhou, Z., and Li, T. (2019). Effects of seepage-induced erosion on nonlinear hydraulic properties of broken red sandstones. Tunn. Undergr. Space Technol. 91, 102993. doi:10.1016/j.tust.2019.102993
Maleki, H. (2017). Coal pillar mechanics of violent failure in US Mines. Int. J. Min. Sci. Technol. 27 (3), 387–392. doi:10.1016/j.ijmst.2017.03.001
Naji, K. (2018). Resilient modulus-moisture content relationships for pavement engineering applications. Int. J. pavement Eng. 19 (7-8), 651–660. doi:10.1080/10298436.2016.1199877
Noël, C., Baud, P., and Violay, M. (2021). Effect of water on sandstone's fracture toughness and frictional parameters: brittle strength constraints. Int. J. Rock Mech. Min. Sci. 147, 104916. doi:10.1016/j.ijrmms.2021.104916
Qi, Y., Ju, Y., Yu, K., Meng, S., and Qiao, P. (2022). The effect of grain size, porosity and mineralogy on the compressive strength of tight sandstones: a case study from the eastern Ordos Basin, China. J. Petroleum Sci. Eng. 208, 109461. doi:10.1016/j.petrol.2021.109461
Tang, H., Duan, Z., Wang, D., and Dang, Q. (2020). Experimental investigation of creep behavior of loess under different moisture contents. Bull. Eng. Geol. Environ. 79, 411–422. doi:10.1007/s10064-019-01545-8
Uyeturk, C. E., and Huvaj, N. (2021). Constant water content direct shear testing of compacted residual soils. Bull. Eng. Geol. Environ. 80, 691–703. doi:10.1007/s10064-020-01893-w
Verma, A. K. (2014). A comparative study of various empirical methods to estimate the factor of safety of coal pillars. Am. J. Min. Metallurgy 2 (1), 17–22. doi:10.12691/ajmm-2-1-3
Wang, Y., Pu, Z., Ge, Q., and Liu, J. (2022). Study on the water-richness law and zoning assessment of mine water-bearing aquifers based on sedimentary characteristics. Sci. Rep. 12 (1), 14107. doi:10.1038/s41598-022-18403-5
Wu, C., and Lin, C. (2021). Spatiotemporal hotspots and decadal evolution of extreme rainfall-induced landslides: case studies in southern taiwan. Water 13 (15), 2090. doi:10.3390/w13152090
Wu, L., Bai, H., Yuan, C., Wu, G., Xu, C., and Du, Y. (2019). A water-rock coupled model for fault water inrush: a case study in Xiaochang coal mine, China. Adv. Civ. Eng. 2019, 1–12. doi:10.1155/2019/9343917
Yang, X., and Wang, Y. (2020). Study on the surface particle distribution characteristics of silt with different moisture content. Arabian J. Geosciences 13 (1), 1. doi:10.1007/s12517-019-5007-7
Yao, E., Xu, H., Zhang, K., Liu, S., Sheng, L., Li, B., et al. (2022). Experimental and Mechanistic study of mudstone volumetric swelling at the bottom of salt cavern gas storage. Arabian J. Chem. 15 (9), 104082. doi:10.1016/j.arabjc.2022.104082
Yasidu, U. M., Fujii, Y., Fukuda, D., Kodama, J. I., and Maneya, G. (2017). “Effect of humidity on tensile strength of rocks in selected underground coal mines in Malawi,” in 51st US Rock Mechanics/Geomechanics Symposium, San Francisco, California, June 25-28 2017.
Yin, Z., Jiang, F., and Yang, G. (2002). “The failure laws of overlying strata for thick coal seams with special geological conditions,” in International symposium on safety science and technology.
Zang, A., Wagner, C. F., and Dresen, G. (1996). Acoustic emission, microstructure, and damage model of dry and wet sandstone stressed to failure. J. Geophys. Res. Solid Earth 101 (B8), 17507–17521. doi:10.1029/96JB01189
Zhang, X., Zhang, H., Wang, Z., and Liu, H. (2020). Physical and mechanical properties of pisha sandstone with different corlors in Ordos Plateau. IOP Conf. Ser. Earth Environ. Sci. 525 (1), 012059. doi:10.1088/1755-1315/525/1/012059
Zhao, K., Yang, D., Zeng, P., Huang, Z., Wu, W., Li, B., et al. (2021). Effect of water content on the failure pattern and acoustic emission characteristics of red sandstone. Int. J. Rock Mech. Min. Sci. 142, 104709. doi:10.1016/j.ijrmms.2021.104709
Keywords: coal seam oversurden, water content, mechanical strength, minerals, bursting liability, acoustic emission
Citation: He X, Hu X, Pu Z, Chen D, Duan D, Han G, Xie J and Zhang Y (2024) Damage degradation law of mechanical properties of sandstone under different water-rich states. Front. Earth Sci. 11:1309523. doi: 10.3389/feart.2023.1309523
Received: 08 October 2023; Accepted: 19 December 2023;
Published: 08 January 2024.
Edited by:
Yong Wang, Southwest Petroleum University, ChinaReviewed by:
Jishi Geng, China University of Mining and Technology, ChinaQiangling Yao, China University of Mining and Technology, China
Copyright © 2024 He, Hu, Pu, Chen, Duan, Han, Xie and Zhang. This is an open-access article distributed under the terms of the Creative Commons Attribution License (CC BY). The use, distribution or reproduction in other forums is permitted, provided the original author(s) and the copyright owner(s) are credited and that the original publication in this journal is cited, in accordance with accepted academic practice. No use, distribution or reproduction is permitted which does not comply with these terms.
*Correspondence: Xin Hu, Huxin@cumt.edu.cn