Arching of force chains in excavated granular material
 Meimei Wang
 Jin-An Wang2
 - 1Deep Mining and Rock Burst Research Institute, China Coal Research Institute, Beijing, China
- 2School of Civil and Resource Engineering, University of Science and Technology Beijing, Beijing, China
- 3Country Garden Holdings Company Limited, Beijing, China
The physical arch and the arch effect are related to many geotechnical problems, such as the stability of mine openings, a tunnel’s shape, and disaster prevention. However, observing the arch in geo-material is challenging due to Earth’s invisible force network distribution. The arch shape is a critical parameter related to the arching effect, which is still an open question. Specifically, the force network evolution after local excavation in granular material is revealed using the photo-elastic technique, and the system pressure variation is calculated qualitatively in particle scale according to the G2 algorithm. Besides, the force chain arch is formed by strong force chains, which are important in redistributing the stress field. The principal direction of the spatial correlation colormap represents the direction of the strong force chains in the network. Based on this preferred angle between the strong force chain and the horizontal direction, a simplified force chain arch trajectory is iteratively rebuilt. Then, the total force chain distribution is studied considering both G2 and the total length of strong force chains, with the corresponding results demonstrating a relationship between the changes in these characteristics and the force chain arch formation.
1 Introduction
Arch plays an important role in the stability of geo-granular materials, which is directly related to civil and geotechnical engineering. For instance, in ancient times, a physical arch-shaped structure was used in bridge construction to transfer the vertical loads into the horizontal direction in ancient time while there was lack of modern bridge construction techniques. At the same time, in mining excavation or tunnel boring processes, a physical arch-shaped structure was used to reduce the overburden pressure (Aubertin et al., 2003; Xie, 2005; Lee et al., 2006), as well as to predict their stability. However, an invisible arch (force network arch) in geo-granular materials stabilizes geo-granular piles like embankments and natural slopes (Low et al., 1994; Chen and Martin, 2002). The arch effect has been noticed since the 19th century, with Janssen (Janssen, 1895; Sperl, 2006) explaining the pressure saturation with height at the bottom of a vertical cylinder. Besides, Terzaghi (Terzaghi, 1943) described the arching effect in the soil as a transfer of pressure from a yielding soil mass onto adjoining stationary parts. Based on Terzaghi’s theory, many research works focused on theoretically explaining and experimentally observing the shape of the force network arch. Handy (Handy, 1985) theoretically calculated the varying stress in the arch as the boundary friction and proposed a catenary arch to describe the trajectory of minor principal stresses. However, the catenary arch theory is still under debate. Harrop-Williams (Harrop-Williams, 1989) highlighted that the arch was close to circular compared to the catenary, while Quinlan (Quinlan, 1987) disputed the choice of catenary shape, arguing that cohesion should be considered. Iglesia (Iglesia et al., 2013) conducted a trapdoor test in a geotechnical centrifuge, presumed that the arch should be the failure surface, and transformed the arch’s cross-section from a curved shape to a rectangular one.
An important reason for the complexity of studying the force network arches in geo-granular materials is that the force network arch in geo-granular materials (e.g., sand, soil) is usually impossible to be defined mathematically. However, using DEM (Cui et al., 2020; Gao et al., 2024) or photo-elastic experimental techniques (Howell et al., 1999; Vanel et al., 1999; Geng et al., 2001; Theocaris and Gdoutos, 2013; Wang et al., 2020) allows visualization of the stress-based arch in granular materials and thus has been widely used in recent granular materials research (Majmudar and Behringer, 2005; Bi et al., 2011; Sun et al., 2013; Zheng et al., 2014; Tang and Behringer, 2016; Wang et al., 2018; Zheng et al., 2018; Zheng et al., 2018). The photo-elastic model made of transparent and birefringent plastic, is placed in the polarized light field. The stress distribution characteristics can be determined by measuring the different interference fringes produced on the model when the load is applied. Based on stress-optical theorem, the photo-elastic experiment of particle materials can measure the force state of each particle on the particle scale and the force chain structure on the microscale without disturbance.
This work obtains the force distribution in the granular system and investigates the force network evolution on a particle scale using the photo-elastic experimental technique. With constraints in both the left and right boundaries and servo compression on the top, the particles are locally excavated step by step from the bottom gates. This strategy reveals that the force chain arch evolves while the force chain network in the system is redistributed. Ultimately, this study provides a force chain arch that is mathematically based on the space-correlated iteration of the force chain network.
2 Experimental techniques
2.1 Experimental apparatus and protocol
A typical photo-elastic experiment apparatus includes a stable light source, which provides homogeneous light, a pair of circular polarizers to create the polarized light field, experimental samples made of photo-elastic particles, and a digital camera to collect the photo-elastic response and particle position information (Figure 1A). The loading system of the photo-elastic apparatus (Wu et al., 2019) used in this work (Figure 1B) comprises two servo cylinders mounted at the top and one side of the frame, respectively. The vertical loading was studied in detail, with the horizontal servo cylinder shut down as the boundary wall.
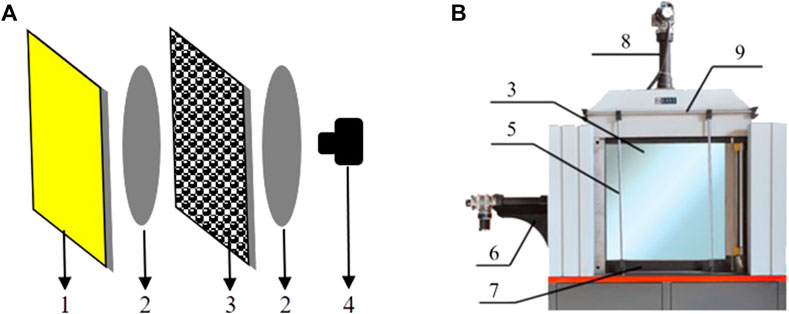
FIGURE 1. (A) Photo-elastic setup, where: 1-homogeneous light source, 2-circular polarizers, 3-container made of transplant glass (photo-elastic particles included), 4- high-resolution camera, (B) Experimental apparatus, where 5-holders for horizontal sliding, 6-cylinder to provide horizontal load, 7 individual trapdoors on the bottom, 8-cylinder to provide vertical load, 9-rails for moving the lens.
The particles, made from polycarbonate sheets, are placed in a container of two pieces of transparent glass. The gap between the two glasses is slightly bigger than the thickness of the disks. The bottom and right sides of the container (Figures 2A,B) have 11 independent trapdoors, allowing particles to flow from the bottom or right side, correspondingly (Wang et al., 2015).
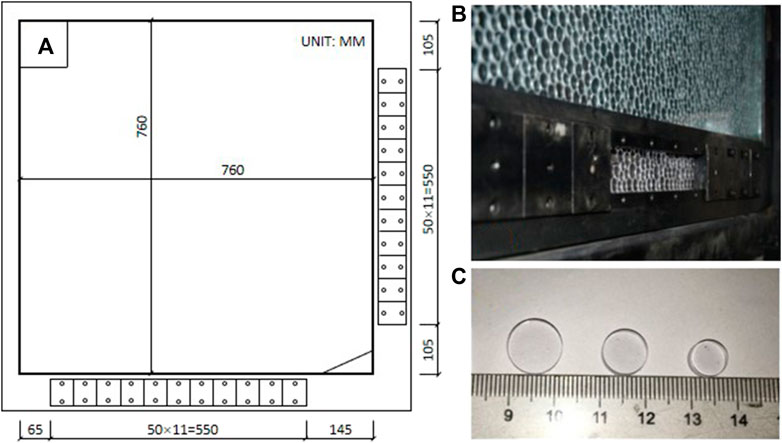
FIGURE 2. (A) Container measurements, (B) trapdoors allowing particles to flow out, and (C) measurements of the particles.
A 760 mm square-shaped view of the granular position and photo-elastic response were recorded during the experiments. Three different disk diameters (10mm, 8mm, and 6 mm) were used to fill the container and avoid the crystal packing state so that a chaotic granular system could be created to represent a more general situation. The ratio of three different particles (Figure 2C) is 1 (big): 5 (medium): 3(small), with approximately 5,000 particles in the container. All the particles used here have the same elastic modulus and Poisson ratio, which are 2.4 GPa and 0.36, respectively. The friction coefficient between the particles is 0.5.
In order to mimic the high-pressure environment, the granular sample is compressed from the top at a constant force (F = 200N). A steel bar is placed between the two glasses to transfer the constant loading from the servo cylinder to the granular samples. The 11 independent trapdoors at the bottom were opened one by one from the right to the left side to allow the particles to flow out. The opening trapdoor would be closed before the next trapdoor is opened. Since the trapdoor size is approximately 6 particles in diameter, a jammed state occurred above the opening (Tang and Behringer, 2016). The process from opening the trapdoor to the jammed state is called one experimental step, and the loading on the top of the granular system decreases when the bottom trapdoor is opened. The servo cylinder would add extra loading to ensure the loading from the top of the granular system is constant before each flow. Besides, a high-resolution camera (EOS 5D Mark II) is applied to acquire two image types, illuminated by normal and polarized light, ensuring each particle has enough pixels (approximately 66 pixels for the big particle) to extract the pressure and position details from the image (Wang et al., 2016; Behringer and Chakraborty, 2019).
2.2 Photo-elastic calibration of individual particle
One of the most important advantages of the photo-elastic technique is that the pressure of the particle bearing can be quantitatively calculated based on the intensity gradient squared (G2) (Vanel et al., 1999) using the image of the particle photo-elastic response.
where F is the applied force, and a and b are fitting parameters. Figure 3A illustrates the photo-elastic patterns when an individual particle is compressed diametrically (from 5N to 55N), with a diameter of 10 mm. Although the number of fringe numbers can be used to calculate each particle’s stress tensor (Vanel et al., 1999), only the G2 method calculates the particle/system pressure quantitatively. The G2 value has a linear relationship with the particle pressure in a certain force range up to 55N. Figure 3B depicts the calibration plot from the photo-elastic patterns of an individual particle, which presents a clear linear fitting with R2 = 99.72%. In this particular experiment, a = 0.5, which indicates the speed of the G2 increases with the applied force, and b = 4.3, which shows the background G2 information.
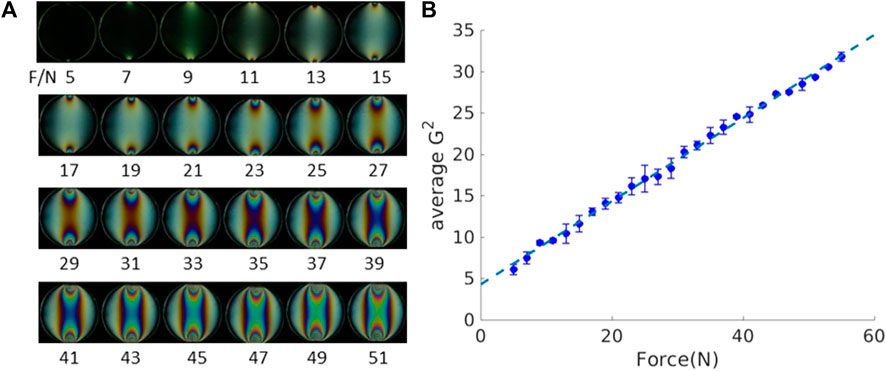
FIGURE 3. Photo-elastic response of single particle: (A) force patterns of particle tests, and (B) calibration of photo-elastic materials showing a linear relationship between average G2 and the loading force.
3 Characteristics of force chain network
In the following section, two kinds of images are post processed to analyze the force chain network. Only particle positions can be detected when illuminating the image with normal light (Figure 4A). The advantage of the photo-elastic technique is that the force chain network in the granular system can be revealed without any disturbance in the polarized image (Figure 4B). By combining the particle positions from the normal light image and the force chain network from the polarized image, the pressure of each particle can be quantitatively calculated using the G2 method. Moreover, the importance of particles in the force chain network is presented in the combined image (Figure 4C). The local zoom-in view of Figure 4C is depicted in Figure 4D, where each particle position is precisely detected on the polarized image. The different colors of the circles indicate the particles’ sizes, while the red indicates the big particle, green indicates medium size particle, and blue indicates the small particle.
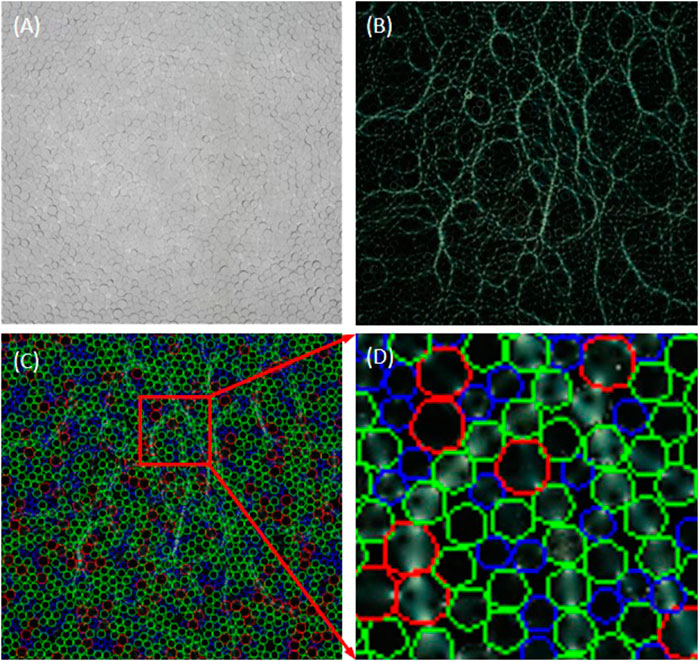
FIGURE 4. Three kinds of images from the experiments and postprocessing: (A) normal image, (B) polarized image, (C) polarized image with particle contours, whose position and centers are tracked from the normal image, (D) zoomed-in part of the overlapped image of force chains and particle position.
The particle pressure in the force chain network can be calculated individually on a granular scale. Figure 5 depicts the probability distribution function (PDF) of the particle pressure in the seventh step, normalized by the average particle pressure. Most particles have relatively low pressure, while only a few have twice the average particle pressure. The experimental results infer that the extremely high-pressure bearing particles were always located as the skeletons of the force chain network.
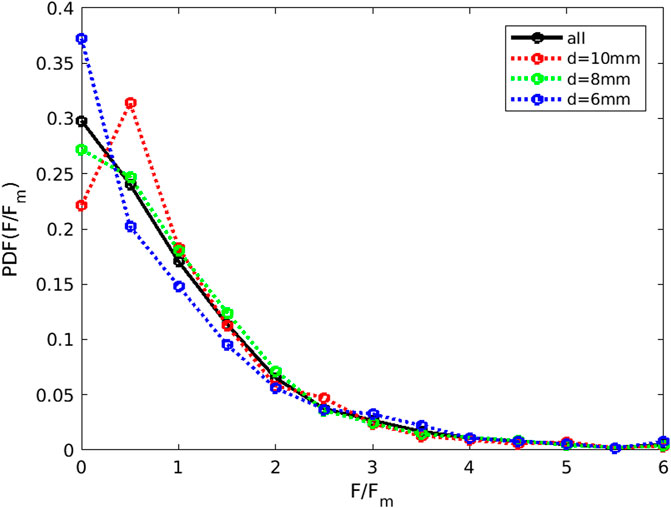
FIGURE 5. Distribution of particle stress for different diameters. Different colors refer to different diameters, including ‘ALL’, which indicates PDF for all particles.
Figure 6 illustrates the global force chain network patterns at the jammed states of each experimental step, where the opening locations are indicated with a red arrow. The force chain network looks very isotropic in its initial state. However, the force chain arch is generated due to the particles flowing out from the trapdoor. Normally, instead of a single force chain arch comprising one layer of particles, the force chain arch is more like a couple of layers of particle clusters. The force chain arches are typically just above the opening trapdoor, which would shift from the right side to the left as the trapdoors open one by one. Many theories have been proposed to predict the shape and position of the force chain arch (Handy, 1985; Quinlan, 1987; Harrop-Williams, 1989; Iglesia et al., 2013), with the following section applying a novel method to detect the force chain arch shape experimentally based on the spatial correlation of the force chain network.
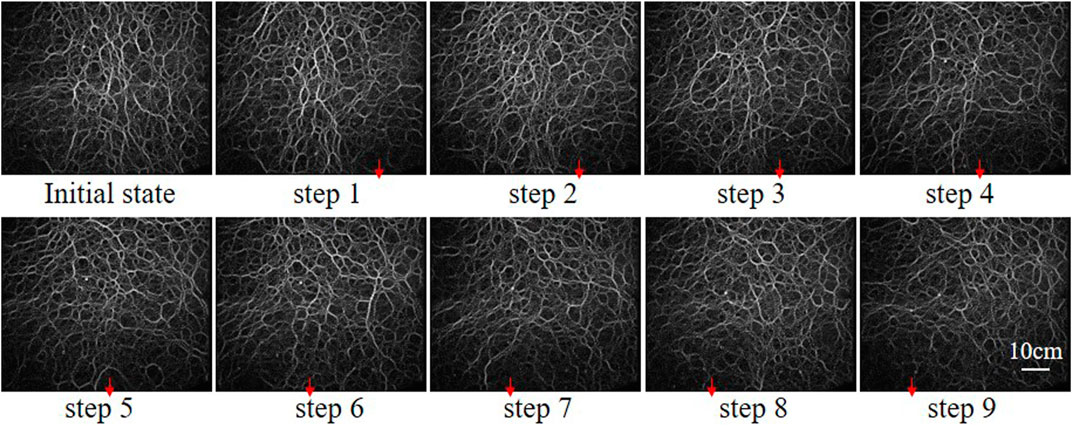
FIGURE 6. Force chain network evolution in different steps.
4 Force chain arch in the excavated granular material
4.1 Distribution of force chains based on statistics
A network of strong force chains is extracted from the system to get a macroscopic magnitude of force chains (e.g., Figure 7A). The accumulative number of particles that G2 exceeds the mean value, represents the total length of a strong force chain, and the average particle stress normalizes the strong force chain network. Figure 7B presents the length changes of the strong force chain L due to the force network reconstruction after each local excavation step.
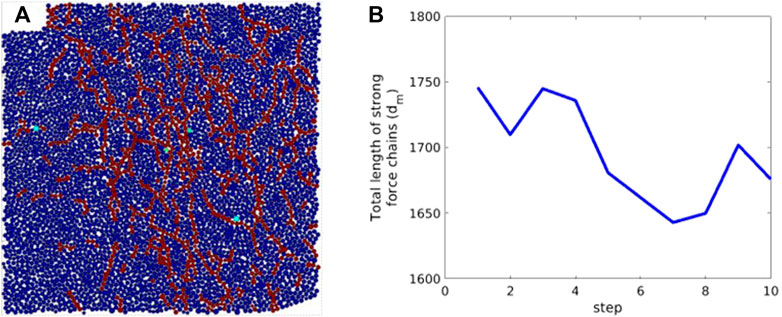
FIGURE 7. (A) Skeleton of the strong force chain network at step 7, (B) Total length of strong force chains L versus the excavation steps.
In general, the length of a strong force chain decreases with the local excavation steps, indicating fewer particles in this force chain network. Since the total loading on the top of the particles is constant, the force distributed is less homogenous than in the initial state. This is especially true when a clear force chain arch is built (e.g., from step 4 to step 7).
4.2 Arch reconstruction using spatial correlation
This paper applies the spatial correlation function to calculate the principal direction of the force chain network. The calculation area A is a square window size of 300 pixels *300 pixels from the force chain network figure, centered by the point on the arch trajectory. For any point (x,y) in A, the autocorrelation C(x,y) is calculated using Eq. 2, which is a two-dimensional summation.
where m and n indicate that the summation includes all the combinations of A(m,n) and
The spatial correlation coefficients of each selected force chain network are calculated using Eq. 2, with Figure 8A presenting the spatial correlation coefficients distribution of the local region around the force chain arch. A high value indicates the direction of the force chain arch. The spatial correlation coefficients along and perpendicular to the arch direction are presented in Figure 8B, highlighting that the spatial correlation coefficients perpendicular to the force arch decay much faster than those along the force arch. The inset of Figure 8B shows the zoom-in version of Figure 8B in a log-log plot. Hence, the whole force chain arch can be detected based on this iteration. By defining a start point (x0, y0), where y0=0 and x0 is the first point from the left boundary that a preferred angle can be seen in the spatial correlation colormap, the coordinates of any point (xi+1, yi+1) on the force chain arch is computed using Eq. 3.
where 0<i≤n, l is the width of the force chain arch, n is the number of iterations, and θi indicates the direction of the principal direction in the spatial correlation colormap (Figure 8A).
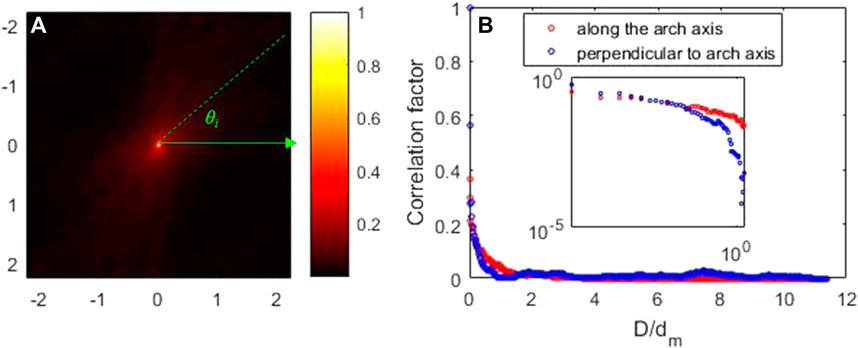
FIGURE 8. (A) Colormap of the autocorrelation coefficient at the seventh step. θi is the angle between the x-axis and the principal direction of the spatial correlation map. (B) Spatial correlations in the directions of the arch axis and perpendicular to it (the seventh step). The average diameter dm of the disks normalizes the distance (D).
The trajectory of the force chain arch is reconstructed, as shown in Figure 9A. The insets are the spatial correlation colormaps corresponding to different positions around the force chain arch. Meanwhile, three widely used force chain arch prediction theories (Handy, 1985; Quinlan, 1987; Harrop-Williams, 1989; Iglesia et al., 2013) are applied to calculate the force arch geometry. The force arch detected in this work generally agrees well with theoretical predictions, even though they do not have the same geometry. Indeed, the experimentally detected force arch has an asymmetric geometry, while all theories give symmetric predictions. This is because the excavation is applied one by one from right to left, and the granular materials are highly memory-dependent materials. They will probably not provide a symmetric force arch if not excavated symmetrically. However, this property cannot be revealed by the current theoretical predictions.
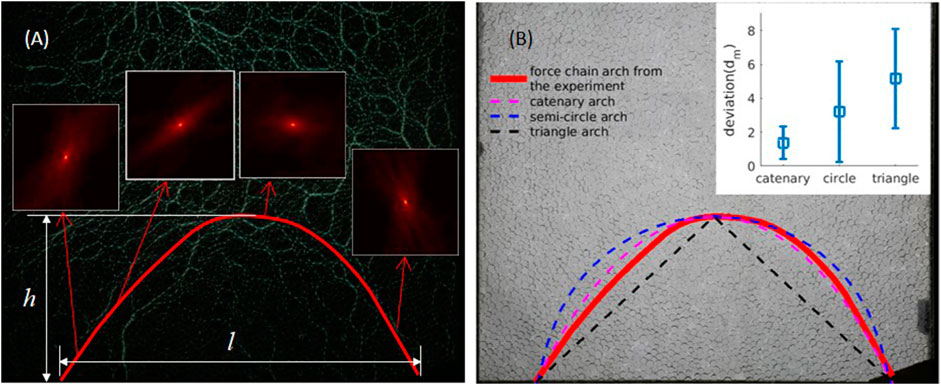
FIGURE 9. (A) Force chain arch calculated using the spatial correlation in the force chain network at the seventh state. The insets are colormaps of autocorrelation coefficients from different positions of the force chain arch at the seventh step. (B) Force chain arch trajectories of calculation using spatial correlation and theoretical assumptions. Catenary, semicircle, and triangle-shaped arches are represented by green, blue, and cyan curves, respectively.
5 Conclusion
The force chain network and arch are essential properties stabilizing granular materials and are directly related to many applications, such as mining and tunnel engineering. This work conducts local excavation experiments in photo-elastic granular materials, presenting the force chain network without disturbance. The following conclusions can be drawn from the analysis of the experimental results.
(1) The particles are excavated locally in a granular system with constant pressure. The force chain arch appears after certain flowing steps, under which the force chains tend to be fewer and weaker compared to those on the other side of the force chain arch.
(2) The force chain arch caused by local particle excavation comprises strong force chains. The skeleton of the force chain network indicates that fewer particles are involved in the stronger force chain network as more local excavation steps were conducted, meaning these particles bear more force from the top.
(3) The force chain arch is calculated from the spatial correlation of the force chain network structure, revealing that the principal direction is in good agreement with the direction of the arch.
Data availability statement
The raw data supporting the conclusion of this article will be made available by the authors, without undue reservation.
Author contributions
MW: Conceptualization, Data curation, Formal Analysis, Investigation, Methodology, Project administration, Software, Writing–original draft, Writing–review and editing. J–AW: Conceptualization, Supervision, Writing–review and editing. FL: Supervision, Writing–review and editing. CL: Formal Analysis, Methodology, Software, Writing–review and editing. LY: Methodology, Writing–review and editing.
Funding
The author(s) declare financial support was received for the research, authorship, and/or publication of this article. This work was funded by the National Natural Science Foundation of China (Grant No. U1361208), National Key Research and Development Program of China (Grant No. 2017YFC503104), the Foundation of China Coal Technology and Engineering Group (CCTEG, Grant Number 2022-2-MS002, 2022-MS001). MW is financially supported by the China Scholarship Council (File No. 201606460029).
Acknowledgments
The authors appreciate the help of Professor Hu Zheng in preparation of the manuscript. The authors would like to express their gratitude to EditSprings (https://www.editsprings.cn) for the expert linguistic services provided.
Conflict of interest
Author CL was employed by Country Garden Holdings Company Limited.
The remaining authors declare that the research was conducted in the absence of any commercial or financial relationships that could be construed as a potential conflict of interest.
Publisher’s note
All claims expressed in this article are solely those of the authors and do not necessarily represent those of their affiliated organizations, or those of the publisher, the editors and the reviewers. Any product that may be evaluated in this article, or claim that may be made by its manufacturer, is not guaranteed or endorsed by the publisher.
References
Aubertin, M., Li, Li, Arnoldi, S., and Simon, R. (2003). Interaction between backfill and rock mass in narrow stopes. Soil Rock Am. 1. 1157–1164.
Behringer, R. P., and Chakraborty, B. (2019). The physics of jamming for granular materials: a review. Rep. Prog. Phys. 82 (1), 012601. doi:10.1088/1361-6633/aadc3c
Bi, D., Zhang, J., Chakraborty, B., and Behringer, R. P. (2011). Jamming by shear. Nature 480, 355–358. doi:10.1038/nature10667
Chen, C., and Martin, G. (2002). Soil-structure interaction for landslide stabilizing piles. Comput. Geotechnics 29 (5), 363–386. doi:10.1016/s0266-352x(01)00035-0
Cui, C., Wang, W., Jin, F., and Huang, D. (2020). Discrete-element modeling of cemented granular material using mixed-mode cohesive zone model. J. Mater. Civ. Eng. 32 (4). doi:10.1061/(asce)mt.1943-5533.0003069
Gao, Z., Tang, Y., Chen, Y., and Wang, X. (2024). Mechanism of the post-suffusion mechanical response of gap-graded soils from the perspective of force-chain evolution. Comput. Geotechnics 165, 105946. doi:10.1016/j.compgeo.2023.105946
Geng, J., Howell, D., Longhi, E., Behringer, R. P., Reydellet, G., Vanel, L., et al. (2001). Footprints in sand: the response of a granular material to local perturbations. Phys. Rev. Lett. 87 (3), 035506. doi:10.1103/physrevlett.87.035506
Handy, R. L. (1985). The arch in soil arching. J. Geotechnical Engineering-ASCE 111 (3), 302–318. doi:10.1061/(asce)0733-9410(1985)111:3(302)
Harrop-Williams, K. (1989). Arch in soil arching. J. Geotechnical Engineering-ASCE 115 (3), 415–419. doi:10.1061/(asce)0733-9410(1989)115:3(415)
Howell, D., Behringer, R. P., and Veje, C. (1999). Stress fluctuations in a 2D granular Couette experiment: a continuous transition. Phys. Rev. Lett. 82 (26), 5241–5244. doi:10.1103/physrevlett.82.5241
Iglesia, G., Einstein, H., and Whitman, R. (2013). Investigation of soil arching with centrifuge tests. J. Geotechnical Geoenvironmental Eng. 140 (2), 04013005. doi:10.1061/(asce)gt.1943-5606.0000998
Janssen, H. (1895). Versuche uber getreidedruck in silozellen. Z. Ver. Dtsch. Ing. 39 (35), 1045–1049.
Lee, C., Wu, B., Chen, H., and Chiang, K. (2006). Tunnel stability and arching effects during tunneling in soft clayey soil. Tunn. Undergr. Space Technol. 21, 119–132. doi:10.1016/j.tust.2005.06.003
Low, B., Tang, S., and Choa, V. (1994). Arching in piled embankments. J. Geotechnical Engineering-ASCE 120 (11), 1917–1938. doi:10.1061/(asce)0733-9410(1994)120:11(1917)
Majmudar, T. S., and Behringer, R. P. (2005). Contact force measurements and stress-induced anisotropy in granular materials. Nature 435 (7045), 1079–1082. doi:10.1038/nature03805
Quinlan, J. F. (1987). Discussion of “ the Arch in soil arching ” by richard L. Handy (march, 1985, vol. 111, No. 3). J. Geotechnical Engineering-ASCE 113 (3), 272–274. doi:10.1061/(asce)0733-9410(1987)113:3(272)
Sperl, M. (2006). Experiments on corn pressure in silo cells - translation and comment of Janssen’s paper from 1895. Granul. Matter 8 (2), 59–65. doi:10.1007/s10035-005-0224-z
Sun, Q., Jin, F., and Zhang, G. (2013). Mesoscopic properties of dense granular materials: an overview. Front. Struct. Civ. Eng. 7 (1), 1–12. doi:10.1007/s11709-013-0184-z
Tang, J. Y., and Behringer, R. P. (2016). Orientation, flow, and clogging in a two-dimensional hopper: ellipses vs. disks. EPL 114 (3), 34002. doi:10.1209/0295-5075/114/34002
Theocaris, P. S., and Gdoutos, E. E. (2013). Matrix theory of photoelasticity. Berlin, Heidelberg: Springer.
Vanel, L., Howell, D., Clark, D., Behringer, R. P., and Clément, E. (1999). Memories in sand: experimental tests of construction history on stress distributions under sandpiles. Phys. Rev. E 60 (5), R5040–R5043. doi:10.1103/physreve.60.r5040
Wang, D., Ren, J., Dijksman, J. A., Zheng, H., and Behringer, R. P. (2018). Microscopic origins of shear jamming for 2D frictional grains. Phys. Rev. Lett. 120 (20), 208004. doi:10.1103/physrevlett.120.208004
Wang, J., Yang, L., Li, F., and Wang, C. (2020). Force chains in top coal caving mining. Int. J. Rock Mech. Min. Sci. 127 (C), 104218. doi:10.1016/j.ijrmms.2020.104218
Wang, J. A., Pang, W. D., Liang, C., and Han, X. (2015). “Photoelastic experiment apparatus of aggregates with bilateral flowing,” in China patent.
Wang, M., Wang, J., Pang, W., and Liang, C. (2016). “Photoelastic experiments on force chain evolution in granular materials under bilateral flowing conditions,” in Proceedings of the 7th international conference on discrete element methods. DEM 2016. Editors X. Li, Y. Feng, and G. Mustoe (Berlin, Heidelberg: Springer).
Wu, Q., Cui, C., Bertrand, T., Shattuck, M. D., and O’Hern, C. S. (2019). Active acoustic switches using two-dimensional granular crystals. Phys. Rev. E. 99 (6-1), 062901. doi:10.1103/physreve.99.062901
Xie, G. (2005). Mechanical characteristics of fully mechanized top-coal caving face and surrounding rock stress shell. J. China Coal Soc. 30 (3), 309–313. doi:10.3321/j.issn:0253-9993.2005.03.009
Zheng, H., Dijksman, J. A., and Behringer, R. P. (2014). Shear jamming in granular experiments without basal friction. EPL 107 (3), 34005. doi:10.1209/0295-5075/107/34005
Zheng, H., Wang, D., Barés, J., and Behringer, R. P. (2018). Sinking in a bed of grains activated by shearing. Phys. Rev. E 98 (1-1), 010901. doi:10.1103/physreve.98.010901
Keywords: force chain network, spatial correlation, arch trajectory, photo-elastic, granular material
Citation: Wang M, Wang J-A, Li F, Liang C and Yang L (2024) Arching of force chains in excavated granular material. Front. Earth Sci. 11:1322038. doi: 10.3389/feart.2023.1322038
Received: 15 October 2023; Accepted: 27 December 2023;
Published: 11 January 2024.
Edited by:
Faming Huang, Nanchang University, ChinaReviewed by:
Daniel Barreto, Edinburgh Napier University, United KingdomTeng Man, Westlake University, China
Copyright © 2024 Wang, Wang, Li, Liang and Yang. This is an open-access article distributed under the terms of the Creative Commons Attribution License (CC BY). The use, distribution or reproduction in other forums is permitted, provided the original author(s) and the copyright owner(s) are credited and that the original publication in this journal is cited, in accordance with accepted academic practice. No use, distribution or reproduction is permitted which does not comply with these terms.
*Correspondence: Meimei Wang, mmwang0302@hotmail.com