Ambient noise tomography of El Hierro island (Canary Islands)
 Iván Cabrera-Pérez1*
  Jean Soubestre2,3
  Luca D’Auria4
  Monika Przeor4 Rubén García1 José Barrancos4 Germán D. Padilla4
  Nemesio M. Pérez1,4
  Janire Prudencio5,6
- 1Instituto Volcanológico de Canarias (INVOLCAN), Tenerife, Canary Islands, Spain
- 2University Grenoble Alpes, University Savoie Mont Blanc, CNRS, IRD, University Gustave Eiffel, Grenoble, France
- 3Icelandic Meteorological Office, Reykjavik, Iceland
- 4Instituto Tecnológico y de Energías Renovables (ITER), Tenerife, Canary Islands, Spain
- 5Department of Theoretical Physics and Cosmos, Science Faculty, University of Granada, Granada, Spain
- 6Andalusian Institute of Geophysiscs, Campus de Cartuja, University of Granada, Granada, Spain
El Hierro island is one of the most active islands in the Canary Islands from a volcanological point of view. This is the reason why the imaging of the internal crustal structure is of huge importance. The geophysical exploration methods employed on El Hierro Island, such as gravimetry and seismic tomography, allowed obtaining the high-resolution characterization of the crust’s deep part. However, these methods did not yield significant information about the surface and the shallower part of the crust. To gain a deeper insight into the shallow geological structure of El Hierro island, we employed Ambient Noise Tomography to construct a 3D S-wave velocity model. Our investigation revealed the presence of seven significant seismic velocity anomalies, partly identified by previous studies. We identified two high-velocity anomalies located in the eastern and western parts of the island at a depth between 0 and 3 km below sea level (b.s.l.). We interpreted these anomalies as dense intrusive complexes of dikes, possibly linked to the Tanganasoga volcano and the formation of the Tiñor edifice. Additionally, we observed two high-velocity anomalies in the northern and southern parts of the island at a depth between 3 and 4 km b.s.l., which we related to the accumulation of solidified igneous rocks. On the other hand, a low-velocity anomaly was observed in the Golfo valley, between 0 and 0.5 km b.s.l., and we interpreted it as megalandslide deposits. This anomaly was evidenced for the first time in the present study. Finally, two low-velocity anomalies were observed in the southern part of the island at different depths, between 0–0.5 km b.s.l. and 0–2 km b.s.l. These were interpreted as fractures generated by Quaternary volcanism along the SSE Rift. Also, one of them was evidenced for the first time in this study, corresponding to the zone of the fractures produced during the Quaternary volcanism. This study has allowed us to gain a more detailed understanding of the shallow geological structure of the island. Even if most of the anomalies had been evidenced previously, we could observe the existence of two low-velocity zones in the shallow crust that have not been observed before.
1 Introduction
The first instance of Ambient Noise Tomography (ANT) applied to a volcano was conducted by Brenguier et al. (2008). In this study, they successfully imaged a high-velocity intrusive body beneath the Piton de la Fournaise volcano on La Réunion Island, France. Subsequent ANT investigations have been carried out on numerous other volcanoes to identify anomalies in shear wave velocity. Typically, high-velocity anomalies observed in ANT are commonly interpreted as cooled igneous intrusions (Brenguier et al., 2008; Mordret et al., 2015; Wang et al., 2017), consolidated dike complexes (Mordret et al., 2015; Cabrera-Pérez et al., 2022), or solidified magma chambers (Mordret et al., 2015). On the other hand, low-velocity anomalies detected in ANT are associated with various volcanic features, including hydrothermal systems, e.g., (Spica et al., 2015; Wang et al., 2017; Cabrera-Pérez et al., 2022; Cabrera-Pérez et al., 2023a), caldera-related structures, e.g., (Masterlark et al., 2010; Koulakov et al., 2014; Benediktsdóttir et al., 2017), porous and highly fractured materials, e.g., (Cabrera-Pérez et al., 2023b), shallow crustal magma reservoirs, e.g., (Masterlark et al., 2010; Stankiewicz et al., 2010; Spica et al., 2015; Fallahi et al., 2017; Obermann et al., 2019), or fractures, e.g., (Cabrera-Pérez et al., 2023a). The Ambient Noise Tomography was applied to El Hierro island (Canary Islands) in order to shed light on the internal structure of the shallow crust, up to 5 km b.s.l.
The Canary Islands, situated around 100 km from the African coast, exhibit characteristics typical of an active oceanic island chain. Their formation is associated with a hot spot or plume, leading to the intrusion of unusually hot mantle material into the African plate. The islands are predominantly composed of mafic rocks and encompass elevated submarine volcanic structures, above-water shield volcanoes, and remnants of substantial lateral collapses (Troll and Carracedo, 2016). El Hierro island (27°43.6′N, 18°1.0′W) is located in the western part of the Canary Islands (Figure 1) and is the youngest island of the archipelago and has a “Y” shape with a maximum height of 1,501 m a.s.l. (above sea level), (Figure 1). El Hierro island can be categorized into three distinct and differentiated geological domains: i) Tiñor edifice (1.12–0.88 Myr), ii) El Golfo-Las Playas edifice (545–176 kyr), and iii) Rift volcanism (158 kyr to the present) (Figure 1). The island’s formation began in the lower and middle Pleistocene with the construction of the Tiñor volcanic edifice. Subsequently, the El Golfo and Las Playas volcanic edifices were formed during the middle Pleistocene. Finally, the dorsal volcanism started during the middle and upper Pleistocene in the three principal rifts of the island (NE, WNW and SSE rift), where all the recent eruptions have been located (Figure 1). During this period (21–133 kyr), a megalandslide occurred as a consequence of the rapid growth of the El Golfo volcano and generated a great depression in the northern part of the island (Golfo Valley). The Holocene volcanism on El Hierro island is limited to just a few eruptions: Tanganasoga volcano and the Montaña Chamuscada volcano (Figure 1), 4,000 and 2,500 years before present, respectively (Guillou et al., 1996). No historical subaerial eruptions were observed.
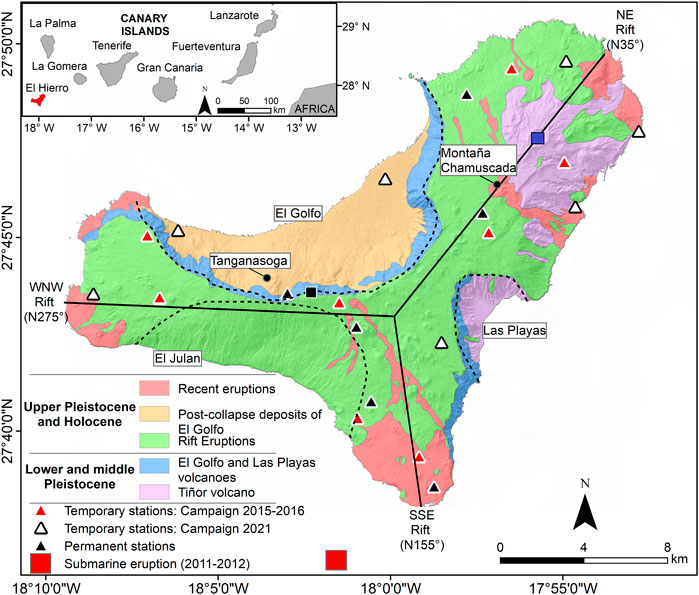
FIGURE 1. Geological map of El Hierro island. The black dashed and solid lines represent the collapse rims and the direction of the principal rifts, respectively. The red square on the top-right globe shows the position of the Canary Islands archipelago and the island of El Hierro appears in red in the top-left inset. The black and blue square represents the location of the maximum height of the island and the Tiño volcano, respectively.
The last eruption in El Hierro was the Tagoro volcano submarine eruption which took place 4 km away from the island’s southern extremity (Figure 1). The pre-eruptive episode lasted 83 days, starting on 17 July 2011, with more than 11,000 earthquakes (Ibáñez et al., 2012). The seismicity migrated from the north (El Golfo) to the southern part of the island following the movement of magma at depth (Ibáñez et al., 2012). Furthermore, the Instituto Geográfico Nacional (IGN) registered an uplift of ∼2–4 cm motion toward the northeast (González et al., 2013), and the Instituto Volcanológico de Canarias (INVOLCAN) observed an increase in endogenous gas emissions (Melián et al., 2014; Pérez et al., 2014) during this pre-eruptive period. The eruptive process began on 12 October 2011, and lasted about 5 months until 5 March 2012. During the eruptive process, floating pyroclasts emerged on the sea surface near the place of eruption. These volcanic bombs and slags were named Restingolites (Pérez et al., 2012). In addition to the volcanic materials emitted, the huge emissions of volcanic gases produced a change in the color of the seawater (Somoza et al., 2017). The Tagoro volcano formed alternating between constructive and destructive episodes produced by effusive and explosive stages, respectively. During the final effusive stage of the eruption, a principal cone formed underwater, reaching a maximum height of 89–120 m above the sea floor (Somoza et al., 2017).
Many of the studies of El Hierro island focused on the Tagoro eruption process, analyzing the seismicity, e.g., (Ibáñez et al., 2012; López et al., 2012), deformation patterns, e.g., (González et al., 2013; Cerdeña et al., 2018), and geochemical anomalies, e.g., (Pérez et al., 2012; Padilla et al., 2013; Padrón et al., 2013; Melián et al., 2014; Rodriguez-Losada et al., 2015). Only a few studies applied geophysical methods to study the geological structure of El Hierro. The first one was carried out by Montesinos et al. (2006), who obtained a 3-D density model through the inversion of gravity data. Subsequently, Gorbatikov et al. (2013) studied the deep structure of the island using a microseismic-sounding method. Finally, García-Yeguas et al. (2014) and Martí et al. (2017) applied local seismic tomography (LET) to reveal the deeper geological structures of the island. However, all of these methods have poor resolution at shallow depths. In this study, we carried out the first Ambient Noise Tomography (ANT) of El Hierro Island to gain a more detailed understanding of the surface structure and geology of the island.
2 Methods
2.1 Data collection and pre-processing
In this study, we used a dataset obtained from permanent broadband stations completed by temporary stations installed in two campaigns. We used eight temporary stations (Güralp© 3ESPC Series) installed on the island by the Helmholtz Center for Ocean Research Kiel Germany (GEOMAR) and the Instituto de Productos Naturales y Agrobiología (CSIC) (Dietrich and Vicente, 2019) that were recording between 1 January 2015 and 30 December 2016 (Figure 1, campaign 2015–2016). Moreover, seven temporary seismic stations (Nanometrics© Trillium Compact 120s) were installed by the INVOLCAN and recorded between March and June 2021 (Figure 1, campaign 2021). Additionally, during the 4 months of the 2021 campaign, six permanent stations managed by INVOLCAN for volcanic monitoring (Figure 1), remained in active operation. Those data were used in this study. Data were collected at a sampling rate of 100 Hz.
We carried out data pre-processing, conducted cross-correlations between all station pairs, and extracted the dispersion curves, as outlined by (Shapiro et al., 2005). First, we downsampled the data from 100 to 25 Hz to reduce the computational time. Then, we used a network-based method (Seydoux et al., 2016; Soubestre et al., 2018) to remove time windows containing earthquakes automatically. Subsequently, we applied a bandpass filter within the 0.1–5.0 Hz frequency range, covering the frequency range of the microseism ambient noise (Gutenberg, 1958). We implemented a standard ambient noise pre-processing procedure. This pre-processing included temporal one-bit normalization and spectral whitening to mitigate non-stationarity in the remaining data, as discussed by Bensen et al. (2007). Following these steps, we computed cross-correlations for all station pairs on 5-min-long windows, stacking over 1 year for the 2015–2016 campaign and 4 months for the 2021 campaign. This analysis was conducted specifically on the vertical-vertical components of 112 station pairs. The resulting cross-correlations are illustrated in Figure 2A, clearly displaying coherent dispersive Rayleigh waveforms.
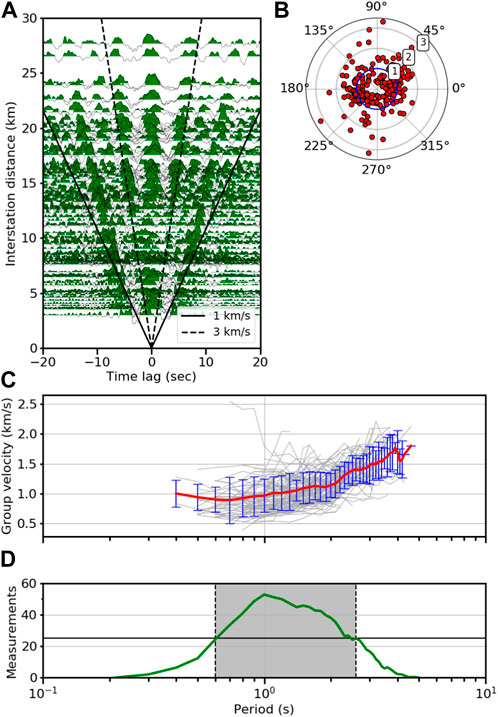
FIGURE 2. Processing of ambient noise data. (A) Vertical empirical Green’s functions sorted according to the distance between stations. The black solid and dashed lines represent the velocities of 1.0 and 3.0 km/s, respectively. (B) Amplitude ratios of causal and acausal parts of vertical cross-correlations as a function of azimuthal distribution of station pairs. The white circle represents the unitary value of the amplitude ratio. (C) Rayleigh wave dispersion curves (grey lines), together with their mean (red line) and standard deviation at each period (blue vertical bars). (D) Number of measured dispersion curves as a function of the period (green line). The grey area represents the range of periods with at least 25 measurements were used in the inversion (0.6–2.7s).
Moreover, we computed the amplitude ratio between the causal and acausal segments of the cross-correlations, examining its dependence on the azimuthal arrangement of station pairs (Figure 2B). This analysis was conducted to confirm that the distribution of noise sources closely approximated isotropy, a critical prerequisite for performing ANT (Lobkis and Weaver, 2001; Derode et al., 2003). Figure 2B shows an acceptable azimuthal distribution of station pairs with a slightly dominant northeast-southwest orientation. Nonetheless, there is no discernible predominant noise source, as all station pairs’ amplitude ratio remains consistently near 1 (Figure 2B).
Subsequently, we employed the Frequency-Time Analysis (FTAN) method, as outlined by Levshin et al. (1992), to determine the Rayleigh wave group velocity dispersion curves. A total of 105 dispersion curves were extracted (Figure 2C). Among these, the red curve represents the average dispersion curve, with its associated standard deviation indicated by the blue line at each period (Figure 2C). In Figure 2D, the number of measurements is illustrated in relation to the period. To ensure the reliability of our analysis, we considered periods within a reasonably covered range, requiring a minimum of 25 measurements. As a result, our tomographic inversion was limited to periods spanning from 0.6 s to 2.7 s.
2.2 2-D group velocity maps
We applied a non-linear multiscale inversion methodology, which considers the topography, as Cabrera-Pérez et al. (2021) detailed, to generate 2-D group velocity maps at various periods. Initially, our model assumed a uniform velocity structure. We refined the model parameters in successive iterations of the non-linear inversion process by introducing control nodes distributed across a regular grid. We improved the model at each stage by increasing the scale, which entailed augmenting the number of parameters employed for model characterization. The result obtained at each scale served as the initial model for the subsequent inversion scale. This inversion approach has demonstrated its efficacy in numerous investigations of volcanic regions (Cabrera-Pérez et al., 2022; Cabrera-Pérez et al., 2023a; Cabrera-Pérez et al., 2023b).
Initially, we conducted synthetic checkerboard tests to evaluate the spatial resolution of the tomographic images. Three distinct sizes of checkerboards were employed, measuring 0.05° × 0.05°, 0.1° × 0.1°, and 0.3° × 0.3°. These dimensions approximately correspond to areas of 5.5 km × 5.5 km, 11.1 km × 11.1 km, and 33.3 km × 33.3 km, respectively. In these tests, the checkerboards featured a maximum velocity of 2.1 km/s and a minimum of 1.9 km/s, as depicted in Figure 3. The checkerboard experiments conducted at resolutions of 0.1° × 0.1° and 0.3° × 0.3°, as shown in Figures 3D, F, respectively, yielded accurate results. In contrast, the checkerboard test at a resolution of 0.05° × 0.05° failed to correctly retrieve the outer areas due to lower ray path density in those regions (Figure 3B and refer to Supplementary Figure S1). However, it is worth noting that the checkerboard was accurately retrieved in the central part of the island (Figure 3B), where the ray path density was higher (see Supplementary Figure S1).
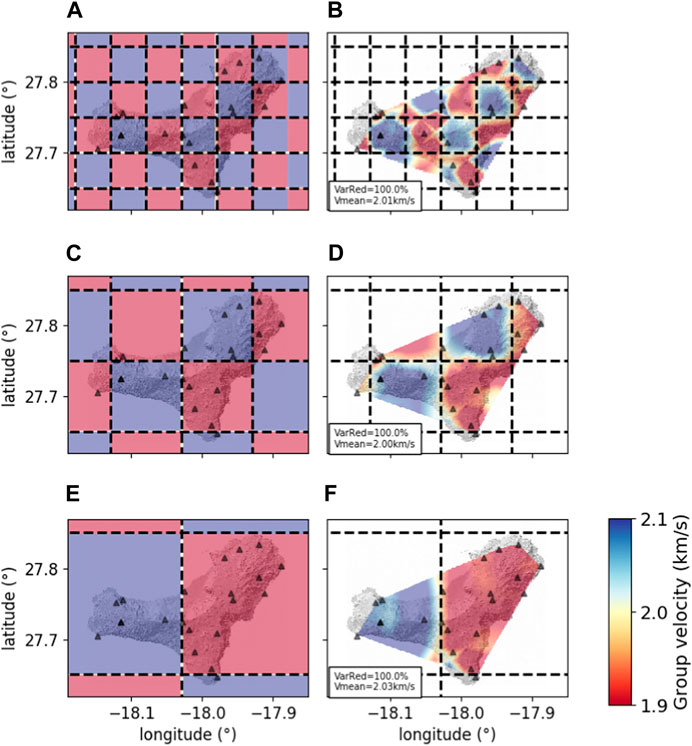
FIGURE 3. Checkerboard tests with (A) 0.05° × 0.05°, (C) 0.1° × 0.1° and (E) 0.3° × 0.3° resolution. The recovered group velocity maps appear in panels (B,D,F), respectively.
In Supplementary Figure S2, you can observe the results of our 2-D mapping of Rayleigh wave group velocities derived from a checkerboard test conducted at different scales, 4, 5, and 6. The maps produced at scales 4 and 5 show significant similarity and effectively represent the geometric structure and the velocity distribution. In contrast, the map generated at scale 6 displays noticeable artifacts, and has difficulty determining the velocity pattern accurately. Consequently, we have decided to confine our inversion process for actual data to a scale of 5.
Figure 4 displays four 2-D group velocity maps of Rayleigh waves, each corresponding to periods ranging from T = 0.6 s to T = 2.7 s. In each panel of Figure 4, you can find information about the variance reduction (VarRed) and the mean velocity. It is worth noting that, for all the investigated periods, the variance reduction exceeds 50%. However, the mean velocity exhibits an upward trend as the period increases, ranging from 0.87 to 1.35 km/s. This pattern aligns with the overall trend in the average dispersion curve presented in Figure 2C.
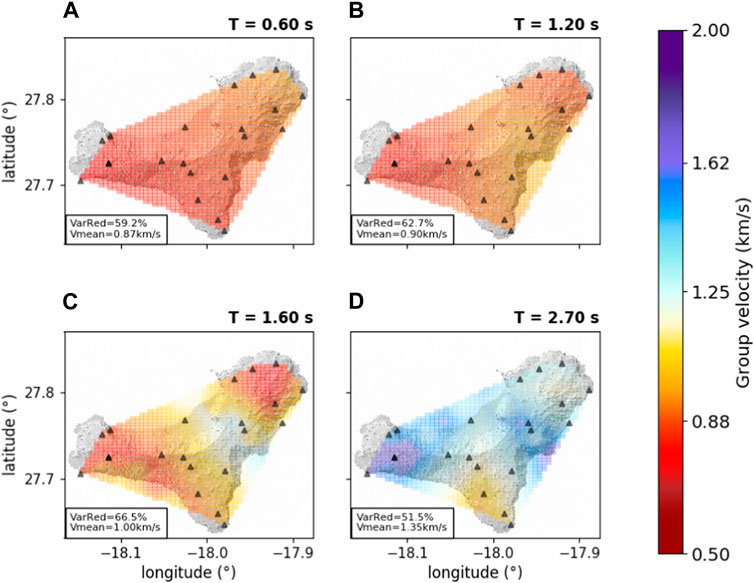
FIGURE 4. Retrieved 2-D group velocity maps for different periods (indicated at the top-right of each panel) of T = 0.6 s (A), T = 1.2 s (B), T = 1.6 s (C) and T = 2.7 s (D). Black triangles represent the seismic stations. Variance reduction (VarRed) and mean velocity are indicated at the bottom-left corner of each map.
Regarding the spatial anomalies observed in the 2-D group velocity maps (Figure 4), we discern noteworthy variations in velocity, particularly at longer periods. At the shorter periods, corresponding to shallower depths, the maps for T = 0.6 s and T = 1.20 s do not exhibit substantial anomalies (Figures 4A, B). Instead, a prevalent low-velocity region dominates most of the island, with mean velocities of 0.87 and 0.90 km/s, respectively. At longer periods, the T=2.7 map reveals an increase in velocity in the western and eastern parts of the island (refer to Figure 4D).
2.3 1-D depth inversion
The final stage of the inversion process entails deriving 1-D S-wave profiles in depth from the group velocity maps. To perform this task, we extracted a dispersion curve associated with each of the 449 control points on the 2-D group velocity maps and carried out the inversion using a transdimensional approach, as outlined by Bodin et al. (2012). The transdimensional approach allows us to derive a “posterior” probability distribution for seismic velocities, and this distribution remains largely uninfluenced by particular parameterization choices, such as the number of layers. Notably, parametrization becomes one of the parameters within the inverse problem (Sambridge et al., 2006). In this study, we explored models featuring uniform horizontal layers ranging from one to five.
The forward model used for computing dispersion curves was based on a modified Thomson–Haskell matrix method (Ke et al., 2011), which not only enhances numerical stability but also expedites the calculation of dispersion curves. An example of the transdimensional inversion outcome is presented in Supplementary Figure S3. It illustrates a probability distribution for S-wave velocity at various depths.
To gauge the depth resolution of our S-wave velocity model, we computed the group velocity sensitivity kernel using the disba software developed by Luu (2021). Supplementary Figure S4 depicts this sensitivity kernel, highlighting that it provides adequate resolution down to 4 km depth, with the highest resolution observed at 2 km depth. Finally, the 3-D S-wave velocity model is constructed by interpolating the 1-D S-wave velocity profiles within a 3-D mesh.
3 Results
This section presents the findings from the ambient noise tomography. Figure 5 shows the maps of S-wave velocity acquired at various depths. Figures 5C, E highlight the primary anomalies in the S-wave velocity model, categorizing them as either high (H) or low (L) velocity anomalies. As depicted in Figure 5, the island exhibits significant variations in velocity, with fluctuations of up to 25% in certain regions (refer to Supplementary Figure S5). In the surface areas, the average S-wave velocity stands at 2.10 km/s (Figure 5A), whereas it escalates to 3.0 km/s in the deeper regions (Figure 5E).
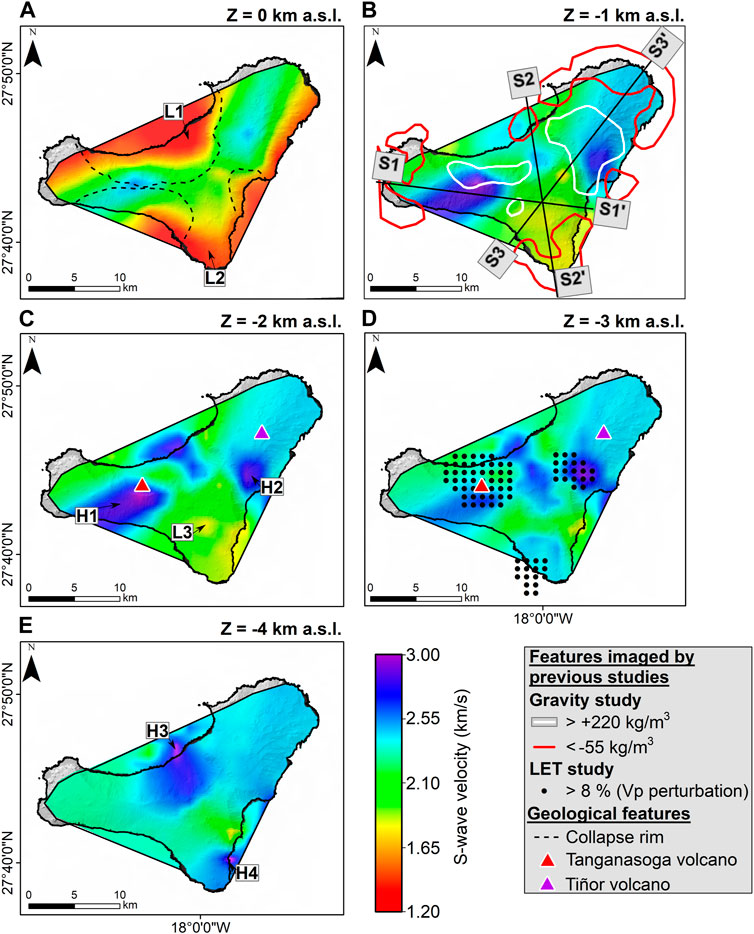
FIGURE 5. Maps of the S-wave velocities (A–E). (A) The black dashed line and red triangle represent the collapse rim delimitation and Tanganasoga volcano location, respectively. (B) White and red lines represent the high- and low-density anomalies obtained by Montesinos et al. (2006), respectively. (D) Black points represent high-velocity anomalies obtained from LET by Martí et al. (2017).
Figure 6 depicts three vertical slices of the 3-D S-wave velocity model, with their positions referenced in Figure 5B. The island features two elevated-velocity regions (H1 and H2) on its western and eastern flanks (Figure 5C) spanning from 0 to 3 km below sea level (b.s.l.) as shown in Figures 6A, C. These regions exhibit an S-wave velocity fluctuation of 25%. Furthermore, two additional high-velocity regions (H3 and H4) were found on the island’s northern and southern sectors, found between 3 and 4 km b.s.l. (Figure 6B). Conversely, a low-velocity zone (L1) is situated in the Golfo Valley at the island’s center (Figure 5A), ranging from 0 to 0.5 km b.s.l. in depth (Figure 6B). Two more areas with low-velocity (L2 and L3) lie in the island’s southern region, spanning depths of 0–0.5 km b.s.l. and 0–2 km b.s.l., respectively (Figure 6B).
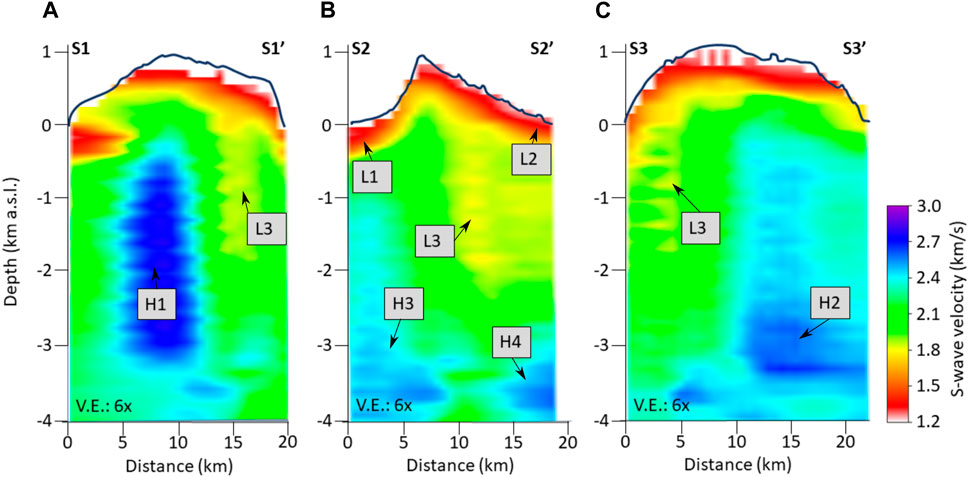
FIGURE 6. Vertical cross-sections of the S-wave velocity model according to profiles S1-S1’ (A), S2-S2’ (B) and S3-S3’ (C) defined in Figure 5B.
4 Discussion
El Hierro island’s 3-D S-wave velocity model unveils the complex geological structure, characterized by the presence of seven prominent velocity anomalies with high-velocity variation reaching to ±25% (see Supplementary Figure S5): four high-velocity and three low-velocity anomalies. We discuss the volcanological relevance of such anomalies hereafter, comparing our results with geophysical models from previous studies.
The anomalies H1
Our study observes another group of significant high-velocity anomalies, denoted as H3
On the other hand, we imaged three low-velocity zones. The L1 anomaly
The second low-velocity anomaly L2
5 Conclusion
Our ANT of El Hierro island provides a high-resolution S-wave velocity model for the first 5 km below the island’s surface. Our dataset incorporated 21 seismic stations equipped with broadband sensors. We employed a non-linear multiscale inversion technique to generate the 2D group velocity maps, and a transdimensional approach was applied for the depth inversion process.
Our 3-D S-wave velocity model reveals the presence of seven velocity anomalies. We detected two high-velocity anomalies in the island’s eastern and western regions, ranging in depth from 0 to 3 km below sea level (b.s.l.). Our interpretation suggests that these anomalies represent dense intrusive complexes of dikes, potentially associated with the Tanganasoga volcano and the formation of the Tiñor edifice. Furthermore, we noted two high-velocity anomalies in the northern and southern sections of the island at a depth between 3 and 4 km b.s.l., which we attributed to the accumulation of solidified igneous rocks.
On the other hand, a low-velocity anomaly was observed in the Golfo valley, within the depth range of 0–0.5 km b.s.l., and we construed it as megalandslide deposits. Lastly, two low-velocity anomalies were identified in the southern part of the island at varying depths, spanning from 0–0.5 km b.s.l. to 0–2 km b.s.l. These were interpreted as fractures generated by Quaternary volcanism along the SSE Rift.
The anomalies observed in various previous geophysical studies were also evidenced in the present work, demonstrating the effectiveness of ambient noise tomography in imaging crustal features. Moreover, the increased sensitivity of ANT in the shallower crust enabled the identification of two previously unseen low-velocity anomalies.
Data availability statement
The original contributions presented in the study are included in the article/Supplementary Material; further inquiries can be directed to the corresponding author.
Author contributions
IC-P: Conceptualization, Data curation, Formal Analysis, Investigation, Visualization, Writing–original draft, Writing–review and editing. JS: Data curation, Investigation, Software, Supervision, Writing–review and editing. LD’A: Conceptualization, Investigation, Methodology, Software, Supervision, Writing–review and editing. MP: Data curation, Writing–review and editing. RG: Data curation, Writing–review and editing. JB: Data curation, Resources, Writing–review and editing. GP: Data curation, Resources, Writing–review and editing. NP: Resources, Writing–review and editing. JP: Methodology, Resources, Writing–review and editing.
Funding
The author(s) declare that no financial support was received for the research, authorship, and/or publication of this article.
Acknowledgments
The INVOLCAN team was supported by the project VOLRISKMAC II (MAC2/3.5b/328) and co-financed by the Cabildo Insular de Tenerife (TFassistance).
Conflict of interest
The authors declare that the research was conducted in the absence of any commercial or financial relationships that could be construed as a potential conflict of interest.
Publisher’s note
All claims expressed in this article are solely those of the authors and do not necessarily represent those of their affiliated organizations, or those of the publisher, the editors and the reviewers. Any product that may be evaluated in this article, or claim that may be made by its manufacturer, is not guaranteed or endorsed by the publisher.
Supplementary material
The Supplementary Material for this article can be found online at: https://www.frontiersin.org/articles/10.3389/feart.2023.1326634/full#supplementary-material
References
Abis, C., Dajma, F., Di Capua, A., Martì Molist, J., Meletlidis, S., Norini, G., et al. (2023). Geology of el hierro southern rift, canary islands, Spain. J. Maps 1. doi:10.1080/17445647.2023.2214173
Benediktsdóttir, Á., Gudmundsson, Ó., Brandsdóttir, B., and Tryggvason, A. (2017). Ambient noise tomography of Eyjafjallajökull volcano, Iceland. J. Volcanol. Geotherm. Res. 347, 250–263. doi:10.1016/j.jvolgeores.2017.09.017
Bensen, G., Ritzwoller, M., Barmin, M., Levshin, A. L., Lin, F., Moschetti, M., et al. (2007). Processing seismic ambient noise data to obtain reliable broad-band surface wave dispersion measurements. Geophys. J. Int. 169, 1239–1260. doi:10.1111/j.1365-246x.2007.03374.x
Bodin, T., Sambridge, M., Tkalčić, H., Arroucau, P., Gallagher, K., and Rawlinson, N. (2012). Transdimensional inversion of receiver functions and surface wave dispersion. J. Geophys. Res. Solid Earth 117. doi:10.1029/2011JB008560
Brenguier, F., Shapiro, N. M., Campillo, M., Ferrazzini, V., Duputel, Z., Coutant, O., et al. (2008). Towards forecasting volcanic eruptions using seismic noise. Nat. Geosci. 1, 126–130. doi:10.1038/ngeo104
Cabrera-Pérez, I., Centeno, R., Soubestre, J., D’Auria, L., Rivera, M., and Machacca, R. (2022). Ambient noise tomography of Misti volcano, Peru. J. Volcanol. Geotherm. Res. 107538, 107538. doi:10.1016/j.jvolgeores.2022.107538
Cabrera-Pérez, I., D’Auria, L., Soubestre, J., Barrancos, J., Padilla, G. D., and Pérez, N. M. (2021). A nonlinear multiscale inversion approach for ambient noise tomography. Geophys. J. Int. 225, 1158–1173. doi:10.1093/gji/ggaa574
Cabrera-Pérez, I., Soubestre, J., D’Auria, L., Barrancos, J., Martín-Lorenzo, A., van Dorth, D. M., et al. (2023a). Geothermal and structural features of La Palma island (Canary Islands) imaged by ambient noise tomography. Sci. Rep. 13, 12892. doi:10.1038/s41598-023-39910-z
Cabrera-Pérez, I., Soubestre, J., D’Auria, L., van Dorth, D. M., Ledo, J., Piña-Varas, P., et al. (2023b). Ambient noise tomography of Gran Canaria island (Canary Islands) for geothermal exploration. Geothermics 108, 102609. doi:10.1016/j.geothermics.2022.102609
Cerdeña, I. D., García-Cañada, L., Benito-Saz, M., Del Fresno, C., Lamolda, H., de Pablo, J. P., et al. (2018). On the relation between ground surface deformation and seismicity during the 2012–2014 successive magmatic intrusions at el hierro island. Tectonophysics 744, 422–437. doi:10.1016/j.tecto.2018.07.019
Derode, A., Larose, E., Tanter, M., De Rosny, J., Tourin, A., Campillo, M., et al. (2003). Recovering the Green’s function from field-field correlations in an open scattering medium (l). J. Acoust. Soc. Am. 113, 2973–2976. doi:10.1121/1.1570436
Dietrich, L., and Vicente, S. (2019). Monitoring the unrest of El Hierro island with seismic observations. doi:10.14470/7Y7560573304
Fallahi, M. J., Obermann, A., Lupi, M., Karyono, K., and Mazzini, A. (2017). The plumbing system feeding the Lusi eruption revealed by ambient noise tomography. J. Geophys. Res. Solid Earth 122, 8200–8213. doi:10.1002/2017JB014592
García-Yeguas, A., Ibánez, J. M., Koulakov, I., Jakovlev, A., Romero-Ruiz, M. C., and Prudencio, J. (2014). Seismic tomography model reveals mantle magma sources of recent volcanic activity at El Hierro Island (Canary Islands, Spain). Geophys. J. Int. 199, 1739–1750. doi:10.1093/gji/ggu339
González, P. J., Samsonov, S. V., Pepe, S., Tiampo, K. F., Tizzani, P., Casu, F., et al. (2013). Magma storage and migration associated with the 2011–2012 El Hierro eruption: implications for crustal magmatic systems at oceanic island volcanoes. J. Geophys. Res. Solid Earth 118, 4361–4377. doi:10.1002/jgrb.50289
Gorbatikov, A., Montesinos, F., Arnoso, J., Stepanova, M. Y., Benavent, M., and Tsukanov, A. (2013). New features in the subsurface structure model of El Hierro Island (Canaries) from low-frequency microseismic sounding: an insight into the 2011 seismo-volcanic crisis. Surv. Geophys. 34, 463–489. doi:10.1007/s10712-013-9240-4
Guillou, H., Carracedo, J. C., Torrado, F. P., and Badiola, E. R. (1996). K-ar ages and magnetic stratigraphy of a hotspot-induced, fast grown oceanic island: el hierro, canary islands. J. Volcanol. Geotherm. Res. 73, 141–155. doi:10.1016/0377-0273(96)00021-2
Gutenberg, B. (1958). “Microseisms,” in Advances in geophysics (Amsterdam, Netherlands: Elsevier), 53–92.
Ibáñez, J., De Angelis, S., Díaz-Moreno, A., Hernández, P., Alguacil, G., Posadas, A., et al. (2012). Insights into the 2011–2012 submarine eruption off the coast of El Hierro (Canary Islands, Spain) from statistical analyses of earthquake activity. Geophys. J. Int. 191, 659–670. doi:10.1111/j.1365-246X.2012.05629.x
Ke, G., Dong, H., Kristensen, Å., and Thompson, M. (2011). Modified Thomson–Haskell matrix methods for surface-wave dispersion-curve calculation and their accelerated root-searching schemes. Bull. Seismol. Soc. Am. 101, 1692–1703. doi:10.1785/0120100187
Koulakov, I., Jaxybulatov, K., Shapiro, N. M., Abkadyrov, I., Deev, E., Jakovlev, A., et al. (2014). Asymmetric caldera-related structures in the area of the Avacha group of volcanoes in Kamchatka as revealed by ambient noise tomography and deep seismic sounding. J. Volcanol. Geotherm. Res. 285, 36–46. doi:10.1016/j.jvolgeores.2014.08.012
Levshin, A., Ratnikova, L., and Berger, J. (1992). Peculiarities of surface-wave propagation across central Eurasia. Bull. Seismol. Soc. Am. 82, 2464–2493. doi:10.1785/BSSA0820062464
Lobkis, O. I., and Weaver, R. L. (2001). On the emergence of the Green’s function in the correlations of a diffuse field. J. Acoust. Soc. Am. 110, 3011–3017. doi:10.1121/1.1417528
López, C., Blanco, M., Abella, R., Brenes, B., Cabrera Rodríguez, V., Casas, B., et al. (2012). Monitoring the volcanic unrest of El Hierro (Canary Islands) before the onset of the 2011–2012 submarine eruption. Geophys. Res. Lett. 39. doi:10.1029/2012GL051846
Luu, K. (2021). disba: numba-accelerated computation of surface wave dispersion. Zenodo. doi:10.5281/zenodo.3987395
Martí, J., Villaseñor, A., Geyer, A., López, C., and Tryggvason, A. (2017). Stress barriers controlling lateral migration of magma revealed by seismic tomography. Sci. Rep. 7, 40757–40810. doi:10.1038/srep40757
Masterlark, T., Haney, M., Dickinson, H., Fournier, T., and Searcy, C. (2010). Rheologic and structural controls on the deformation of Okmok volcano, Alaska: FEMs, Insar, and ambient noise tomography. J. Geophys. Res. Solid Earth 115. doi:10.1029/2009JB006324
Melián, G., Hernández, P. A., Padrón, E., Pérez, N. M., Barrancos, J., Padilla, G., et al. (2014). Spatial and temporal variations of diffuse co2 degassing at el hierro volcanic system: relation to the 2011–2012 submarine eruption. J. Geophys. Res. Solid Earth 119, 6976–6991. doi:10.1002/2014JB011013
Montesinos, F., Arnoso, J., Benavent, M., and Vieira, R. (2006). The crustal structure of El Hierro (Canary Islands) from 3-d gravity inversion. J. Volcanol. Geotherm. Res. 150, 283–299. doi:10.1016/j.jvolgeores.2005.07.018
Mordret, A., Rivet, D., Landès, M., and Shapiro, N. M. (2015). Three-dimensional shear velocity anisotropic model of Piton de la Fournaise Volcano (La Réunion Island) from ambient seismic noise. J. Geophys. Res. Solid Earth 120, 406–427. doi:10.1002/2014JB011654
Obermann, A., Molinari, I., Métaxian, J.-P., Grigoli, F., Strauch, W., and Wiemer, S. (2019). Structure of Masaya and Momotombo volcano, Nicaragua, investigated with a temporary seismic network. J. Volcanol. Geotherm. Res. 379, 1–11. doi:10.1016/j.jvolgeores.2019.04.013
Padilla, G. D., Hernández, P. A., Padrón, E., Barrancos, J., Pérez, N. M., Melián, G., et al. (2013). Soil gas radon emissions and volcanic activity at El Hierro (Canary Islands): the 2011-2012 submarine eruption. Geochem. Geophys. Geosystems 14, 432–447. doi:10.1029/2012GC004375
Padrón, E., Pérez, N. M., Hernández, P. A., Sumino, H., Melián, G. V., Barrancos, J., et al. (2013). Diffusive helium emissions as a precursory sign of volcanic unrest. Geology 41, 539–542. doi:10.1130/G34027.1
Pérez, N. M., Padilla, G. D., Padrón, E., Hernández, P. A., Melián, G. V., Barrancos, J., et al. (2012). Precursory diffuse co2 and h2s emission signatures of the 2011–2012 El Hierro submarine eruption, Canary Islands. Geophys. Res. Lett. 39. doi:10.1029/2012GL052410
Pérez, N. M., Somoza, L., Hernández, P. A., de Vallejo, L. G., León, R., Sagiya, T., et al. (2014). Evidence from acoustic imaging for submarine volcanic activity in 2012 off the west coast of el hierro (canary islands, Spain). Bull. Volcanol. 76, 882–915. doi:10.1007/s00445-014-0882-y
Rodriguez-Losada, J. A., Eff-Darwich, A., Hernandez, L. E., Viñas, R., Pérez, N., Hernandez, P., et al. (2015). Petrological and geochemical highlights in the floating fragments of the October 2011 submarine eruption offshore El Hierro (Canary Islands): relevance of submarine hydrothermal processes. J. Afr. Earth Sci. 102, 41–49. doi:10.1016/j.jafrearsci.2014.11.005
Sambridge, M., Gallagher, K., Jackson, A., and Rickwood, P. (2006). Trans-dimensional inverse problems, model comparison and the evidence. Geophys. J. Int. 167, 528–542. doi:10.1111/j.1365-246x.2006.03155.x
Seydoux, L., Shapiro, N. M., De Rosny, J., Brenguier, F., and Landès, M. (2016). Detecting seismic activity with a covariance matrix analysis of data recorded on seismic arrays. Geophys. J. Int. 204, 1430–1442. doi:10.1093/gji/ggv531
Shapiro, N. M., Campillo, M., Stehly, L., and Ritzwoller, M. H. (2005). High-resolution surface-wave tomography from ambient seismic noise. Science 307, 1615–1618. doi:10.1126/science.1108339
Somoza, L., González, F. J., Barker, S., Madureira, P., Medialdea, T., De Ignacio, C., et al. (2017). Evolution of submarine eruptive activity during the 2011–2012 El Hierro event as documented by hydroacoustic images and remotely operated vehicle observations. Geochem. Geophys. Geosystems 18, 3109–3137. doi:10.1002/2016GC006733
Soubestre, J., Shapiro, N. M., Seydoux, L., de Rosny, J., Droznin, D. V., Droznina, S. Y., et al. (2018). Network-based detection and classification of seismovolcanic tremors: example from the klyuchevskoy volcanic group in kamchatka. J. Geophys. Res. Solid Earth 123, 564–582. doi:10.1002/2017JB014726
Spica, Z., Legrand, D., Iglesias, A., Walter, T. R., Heimann, S., Dahm, T., et al. (2015). Hydrothermal and magmatic reservoirs at Lazufre volcanic area, revealed by a high-resolution seismic noise tomography. Earth Planet. Sci. Lett. 421, 27–38. doi:10.1016/j.epsl.2015.03.042
Stankiewicz, J., Ryberg, T., Haberland, C., and Natawidjaja, D. (2010). Lake Toba volcano magma chamber imaged by ambient seismic noise tomography. Geophys. Res. Lett. 37. doi:10.1029/2010GL044211
Troll, V. R., and Carracedo, J. C. (2016). The geology of the canary islands. Amsterdam, Netherlands: Elsevier.
Keywords: ambient noise tomography, El Hierro island, intrusive bodies, fractures zones, megalandslide
Citation: Cabrera-Pérez I, Soubestre J, D’Auria L, Przeor M, García R, Barrancos J, Padilla GD, Pérez NM and Prudencio J (2024) Ambient noise tomography of El Hierro island (Canary Islands). Front. Earth Sci. 11:1326634. doi: 10.3389/feart.2023.1326634
Received: 23 October 2023; Accepted: 21 December 2023;
Published: 09 January 2024.
Edited by:
Yosuke Aoki, The University of Tokyo, JapanReviewed by:
Simona Petrosino, Istituto Nazionale di Geofisica e Vulcanologia, Sezione di Napoli - Osservatorio Vesuviano, ItalyFrancesca Di Luccio, National Institute of Geophysics and Volcanology (INGV), Italy
Copyright © 2024 Cabrera-Pérez, Soubestre, D’Auria, Przeor, García, Barrancos, Padilla, Pérez and Prudencio. This is an open-access article distributed under the terms of the Creative Commons Attribution License (CC BY). The use, distribution or reproduction in other forums is permitted, provided the original author(s) and the copyright owner(s) are credited and that the original publication in this journal is cited, in accordance with accepted academic practice. No use, distribution or reproduction is permitted which does not comply with these terms.
*Correspondence: Iván Cabrera-Pérez, ivan.cabrera.perez1@gmail.com