Flood mapping of the lower Mejerda Valley (Tunisia) using Sentinel-1 SAR: geological and geomorphological controls on flood hazard
 Lamia Khemiri1,2
  Rim Katlane3*
  Mannoubi Khelil1,4
  Seifeddine Gaidi1,5
  Mohamed Ghanmi1 Fouad Zargouni1
- 1Faculty of Sciences of Tunis, Tunis El Manar University, Tunis, Tunisia
- 2CRTEAN, Regional Center for Remote Sensing of North Africa States, Tunis, Tunisia
- 3Laboratory Geomatics of Geosystems, University of Manouba, Manouba, Tunisia
- 4Laboratoire de Géoressources, LGR, Centre de Recherches et des Technologies des Eaux (CERTE), Soliman, Tunisia
- 5Departamento de Geodinámica, Universidad de Granada, Granada, Spain
Understanding the influence of the hydrological regime changes, encompassing both the duration and spatial extent of floods, is explored, through this paper, in the context of the complex interactions of the geological, geomorphological and climate change conditions. Integrating these parameters and their combined influence becomes paramount for effective flood risk management and disaster prevention, as highlighted in the broader context of the study’s conclusions. Over the past decade, despite prevailing drought conditions in North African countries, the Mejerda Valley in Tunisia has experienced several major flood events. The valley geomorphological history is presented, within the landscape evolution. This study explores the use of Sentinel-1 radar data for detecting and managing floods in the region, with a particular emphasis on the vulnerability of the Lower Mejerda Valley. Sentinel-1 radar data, owing to their continuous monitoring capabilities independent of weather conditions, prove highly effective in tracking the temporal evolution of floods and accurately mapping the extent of affected areas. The methodology utilized in this study has proven to be highly effective in accurately identifying areas susceptible to flooding, both spatially and temporally. In generating classified flood images, water objects are highlighted by applying a specific formula. The study delves into significant flood events in the Mejerda Valley, including occurrences in 2015, 2017, 2019, and 2020, examining their profound impacts on various regions. For instance, the floods of 2015 recorded precipitation levels reaching up to 141 mm, contributing to the overall understanding of flood evolution in the region. In conclusion, the Mejerda Delta’s relief is primarily due to tectonism, influencing both Mio-Pliocene and Quaternary processes, shaping the current delta configuration. The Valley’s topography results from extensive geomorphological evolution, with the eastward shoreline advance leading to the formation of sebkhas and lagoons, indicators of high flood risk, supported by detailed flood event analysis. Moreover, The climate change and anthropic activity are non-negligible parameters influencing flood occurrence and intensity.
1 Introduction
Floods, sudden natural disasters, profoundly impact diverse ecological elements, natural resources, agriculture, human activities, and economies. The repercussions extend to ecosystems, biodiversity, water quality, and result in substantial economic losses, including property destruction, crop failures, infrastructure damage, and human casualties (Llasat et al., 2014; Caretta et al., 2022). In the Mediterranean region, Tunisia consistently faces catastrophic floods triggered by intense rainfall, leading to significant material damage and loss of human lives (Llasat et al., 2014). Moreover, in the context of disaster risk mitigation, the importance of geomorphological mapping emerges as a pivotal tool, as highlighted by AQ Román’s 2022 study. This study accentuates the practical application of geomorphometry, emphasizing its efficacy in identifying areas susceptible to floods (Quesada-Román, 2022) [].
These extreme weather events are likely to be exacerbated by ongoing climate change. Extreme precipitation in Tunisia has increased over the past decades, thereby increasing the risk of flooding. Despite the severe consequences in terms of loss of human lives and economic devastation, there is a noticeable increase in vulnerability to such events, primarily attributed to urban expansion and land use changes (Zahar et al., 2008; Fehri, 2014). In the Northeast of Tunisia, we are interested in the lower valley of the Mejerda, drained by the largest river in the Maghreb, namely, Mejerda. It is a vulnerable region to floods due to its low elevation relative to sea level. According to the data from the Digital Terrain Model (MNT), the majority of the studied area is situated at less than 10 m above sea level (Fehri, 2014; Pleuger et al., 2019). Floods pose a major threat to populations and ecosystems in this valley. Over the past decades, several significant floods have caused considerable damage to agricultural lands and infrastructure. In 1969, a major flood affected approximately 10,000 people, also in January 2003, March 2012, March 2015, and so on. Data from the General Directorate of Water Resources (DGRE) indicated that the Mejerda’s water levels exceeded 240 m3/s threshold in February, March 2015 (Table 1). The cities along the riverbanks and the agricultural lands in this area require more protection against such risks. Studies have demonstrated that the Mejerda has undergone significant changes throughout historical times (Ben Mosbah et al., 2010; Jebari et al., 2012; Delile et al., 2015; Gharbi et al., 2016; Benmoussa et al., 2018; Kotti et al., 2018). Its course has changed multiple times over the past millennia, leading to alterations in the region’s topography and an increase in flood risks (Pimienta, 1959; Jauzein, 1971; Paskoff, 1994; Ben Mosbah et al., 2010; Kotti et al., 2018; Mouri, 2018). To mitigate flood risks, simulating the extent of floods is crucial in order to assess the most vulnerable areas and implement prevention and risk management measures. Studies have shown that hydraulic modeling can provide accurate results regarding the spread of floods and help identify high risk zones (Delile et al., 2015; Benmoussa et al., 2018; Mouri, 2018). Simulating flood extent can also assist in evaluating the impact of climate changes on future floods in the region. A comparative study was conducted to assess the effectiveness of two flood simulation models in Tunisia, revealing the potential of ERA5 data in data scarce regions for flood modeling (Cantoni et al., 2022). The study utilized a hydrological and hydraulic model to accurately predict flood flow rates and inundation levels (Cantoni et al., 2022). Generating flood maps from hydrological models requires an updated Digital Elevation Model (DEM) as well as a database to model the effects of obstacles on the flow of floodwaters in floodplains. Other studies have been conducted to map the Mejerda delta plain using Geographic Information Systems (Kotti and Hermassi, 2022), as well as optical remote sensing (Samaali et al., 2010; Samaali et al., 2019). However, the latter method is constrained by cloud cover, which hinders the use of these images.
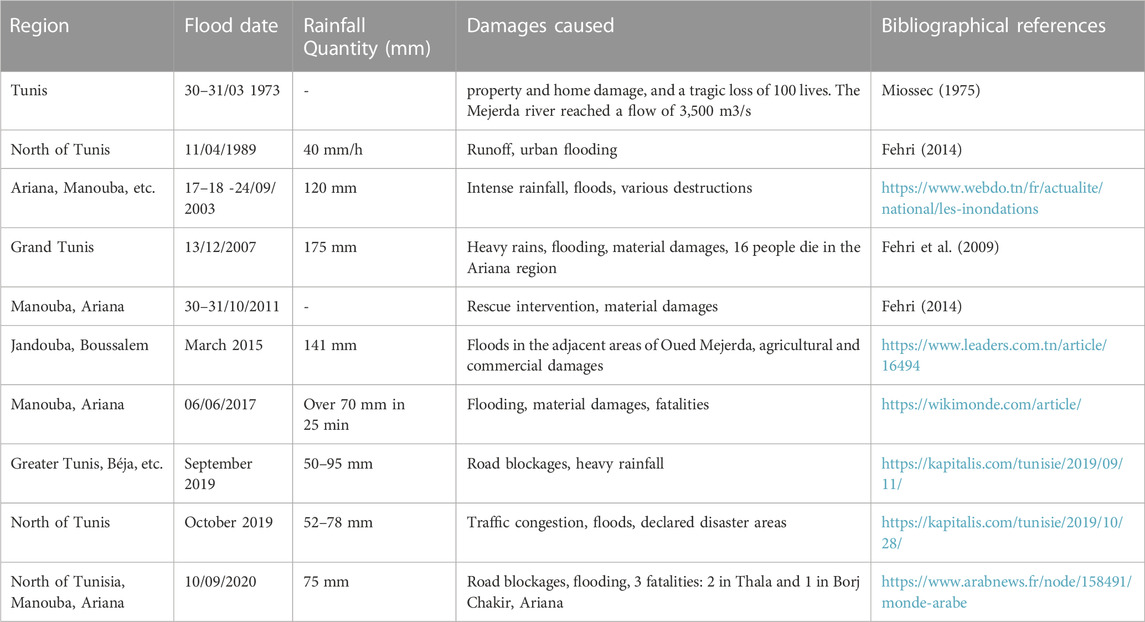
TABLE 1. Summary of Historic Floods and Flash Floods of lower Mejerda valley.
Synthetic Aperture Radar (SAR) stands as a robust and extensively employed instrument for flood detection, exhibiting its prowess across diverse locales (Townsend and Foster, 2002). A multitude of studies carried out worldwide has underscored the efficacy of Sentinel-1 SAR imagery in delineating flood extents (Ezzine et al., 2020). Noteworthy methodologies have been harnessed in research endeavors spanning regions like Bangladesh (Uddin et al., 2019), Pakistan (Zhang et al., 2020), and Saudi Arabia (Elhag and Abdurahman, 2020), casting light on flood mapping employing SAR data. These instances accentuate the pivotal role of SAR tools, particularly the Sentinel-1 SAR images, in the precision and expediency of flood monitoring. SAR imagery remains unfazed by weather conditions and temporal constraints, radiating electromagnetic waves consistently. This attribute bestows a dependable means for appraising and charting floods. Through the fusion of SAR data with sophisticated processing and analytical techniques, the rapid identification of flood extents comes to fruition. This, in turn, furnishes indispensable insights for crisis management and strategic flood mitigation planning (Tan et al., 2023). Furthermore, the mapping of floods via Sentinel-1 SAR imagery has been adeptly executed utilizing the Otsu method, furnishing invaluable discernment into flood proportions and gravity (Tan et al., 2023). Progress in SAR based technology has made momentous strides in fortifying disaster management and mitigation endeavors, prominently evident in the near real time mapping of inundated zones. The Sentinel-1 satellite constellation, encompassing Sentinel-1A and Sentinel-1B, assures comprehensive global coverage with revisits every 6 days, thus facilitating the sustained accumulation and archival of calamity related data (Raspini et al., 2017).
Through this study, we present a methodological approach tailored for a geographically significant area of interest the lower Mejerda valley characterized by undefined and ever changing boundaries. Our methodology aims to offer effective solutions for mapping flood risk in the Lower Mejerda Valley, harnessing the capabilities of Synthetic Aperture Radar (SAR) technologies.
The paper is structured into four distinct sections. After this introductory segment, the second section, titled “Materials and Methods,” expounds on the study area, datasets employed, and the adopted workflow. The subsequent section delves into the development, testing, and validation of the obtained results. Finally, the concluding section engages in a comprehensive discussion of the previously presented data, accompanied by enumerating noteworthy observations and insights.
1.1 The Mejerda River and basin characteristics
Northern Tunisia is characterized by natural regions, including the Kroumirie, Mogods Mountains, the Mejerda Valley, the Haut Tell, and the Cap Bon Peninsula (Figure 1). In the northwestern part of this region, the terrain is structured into topographic units perpendicular to the flow of the hydrographic network, leading to various local climatic contrasts. In the northeastern area, the relief is less pronounced, and the runoff is often directed towards the sea. This region corresponds to the country’s humid Mediterranean domain and is mainly structured around the Mejerda River and its tributaries (Gharbi et al., 2016). The Mejerda River, historically known as “Bagrada” or “Baraada” (Paskoff, 1978), originates in Algeria and remains the only perennial river in a country dominated by typically seasonal wadis. It can be classified as a river (Mouri, 2018) spans 600 km, with 484 km located in Tunisia. Other rivers, such as Miliane, are of lesser importance. In the actual Gulf of Tunis, or the ancient Gulf of Utica, Mejerda characterized a Messinian fluvial canyon (Figure 1) filled with Zanclean clays, attested by 2D seismic data interpretation by El Euch-El Koundi et al. (El Euch-El Koundi et al., 2009).
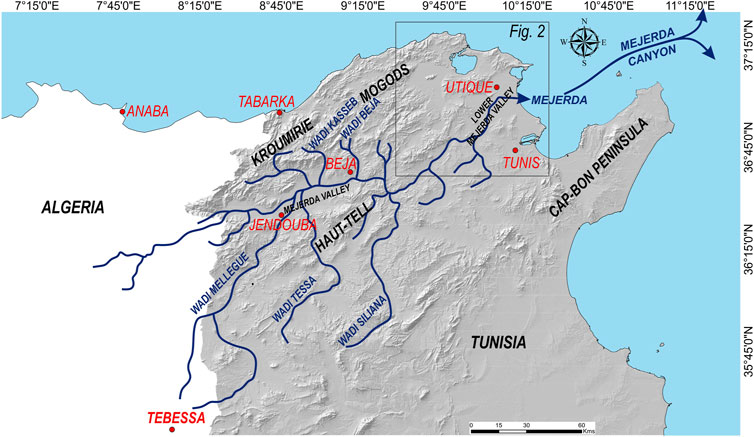
FIGURE 1. Hillshade map showing the Mejerda River, tributaries, its Messinian canyon (Raspini et al., 2017) and Mountain ranges.
The Mejerda (Figure 1) characterizes the most extensive and hierarchically structured hydrological basin in Tunisia. It covers an area of 23,700 km2, with 32% of it located in eastern Algeria (Pimienta, 1959; Guilcher, 1960). The Mejerda originates in the high mountains (1,300 m in altitude) near Souk Ahras in Algeria, formed by Upper Cretaceous and Eocene limestone, and then flows into the Gulf of Tunis. The tributaries on the right bank (Wadi Mellègue, Wadi Siliana (Niox, 1890), etc.; Figure 1) cut through the northern slopes of the Dorsal Range and the Tellian plains (David, 1956). The tributaries on the left bank drain the southern slopes of the Kroumirie and the plains of Béja (Wadi Bou Heurtema, Wadi Béja, etc.). The Mejerda basin supplies the majority of surface water and provides water to nearly 38% of the Tunisian population. Seven major dams have been built in this basin and are considered the largest in the country. Other dams are also planned (Mammou and Louati, 2007), either to increase storage capacity or to replace silted up dams.
Many historical documents indicate that Mejerda served as a navigable waterway during the Numidic and Punic eras (refer to reviews in (Kotti et al., 2018). The Phoenicians engaged in maritime commerce along this river, which allowed them to interact with the Numidic communities and access distant regions situated on the plateau of Constantine. During the Punic civilization, Mejerda supplied the city of Utica and later Carthage (Figure 2), along with their respective harbors. The river’s navigability seems highly probable due to its morphology and substantial width, ranging from 35 to 170 m (Lancel, 1999; Abidi, 2007; Pleuger et al., 2019). This indicates that Carthaginian trade vessels (maximum width 5 m) and war ships (maximum width 7.4 m) could feasibly navigate the waterway (Lancel, 1999). Throughout history, Mejerda consistently remained a (Pleuger et al., 2019) crucial lifeline for the Punic maritime empire. The remnants of the illustrious city of Utica, which was a port during the Punic and Roman eras, are now located more than 12 km inland. It is estimated that an area of at least 300 km2 has been gained from the sea since antiquity and is now primarily used for modern agriculture. However, this gain itself represents only the latest anthropogenic stage of a natural process that has been occurring over a much longer period, starting well before historical times, since the early Holocene (Gharbi et al., 2016). The process of alluvial filling can be traced back to around 6,000 years before the present, at the end of the post glacial transgression. At that time, a marine gulf extended to the current locations of Tebourba and Jedeïda, where the Mejerda River flowed into the sea through a sort of estuary. The maximum extension of land covered by water during exceptional floods, such as those of 1931 or 1973, gives rise to the current plain of the Lower Mejerda (Figure 2).
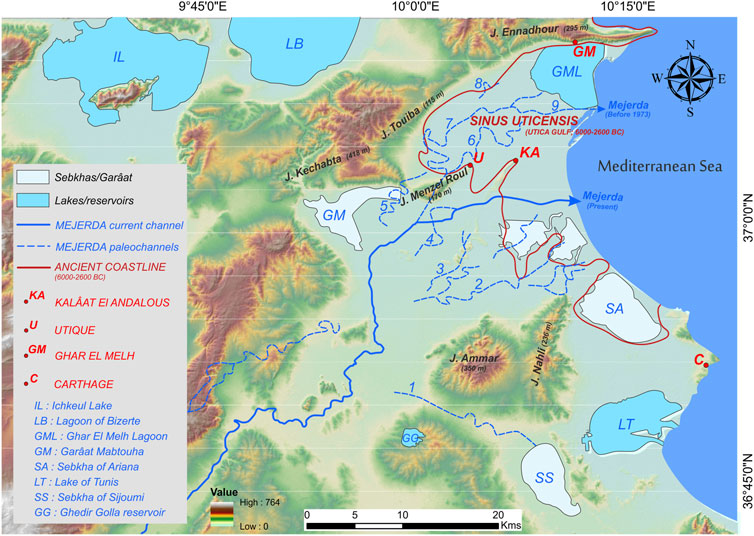
FIGURE 2. Hillshade map of the Lower Mejerda Valley highlighting Mejerda paleochannels (from 1 to 9, old to recent), based on reconstructions of Ben Mosbah et al. (2010), Delile et al. (2015), Jauzein, (1971), Jebari et al. (2012), Paskoff, (1994), Paskoff and Trousset, (1992), Pimienta, (1959), Pleuger et al. (2019), and Sinus Uticensis as presented by Chelbi et al. (1995), Oueslati et al. (2006) and Pleuger et al. (2019).
The hydrological subbasin “Lower Mejerda” extends from the Sidi Salem Dam upstream of the city of Testour to the Gulf of Tunis, between Cap Farina and Cap Gammart (Oueslati et al., 2006). A series of ancient, successive, and abandoned river channels in the recent evolution of the deltaic plain attests to the significant alluvial deposits. In its downstream part, the Mejerda River has an average annual flow of about 30 m3/s (Oueslati et al., 2006). However, its flow, much like the Mediterranean rainfall, exhibits very marked seasonal variations. During low flow periods, the discharge can reduce to less than 1 m3/s, while during decennial floods, it can reach 1,000–1,200 m3/s (Collet, 1953; Claude et al., 1976). In certain meteorological events, the river can reach true river like conditions. For example, the exceptional rains of March 1973 resulted in a flow of 3,500 m3/s (Claude et al., 1976). The solid discharge of the Mejerda River is estimated at 17 million tons per year (Miossec, 1975), with concentrations of 10 g/L in average waters and 30 g/L during floods. Values of around 100 g/L are reached during very heavy rains, such as those in March 1973. Mostly, the transported sediment consists of fine particles, with an average particle size below 0.2 mm (Miossec, 1975).
2 Materials and Methods
2.1 Image data
The dataset utilized in this research consists of spaceborne Synthetic Aperture Radar (SAR) image, specifically the Sentinel-1 GRDH imagery (Table 2). These datasets were acquired for the purpose of pre flood area observation, as well as the observation and mapping of flooded areas.
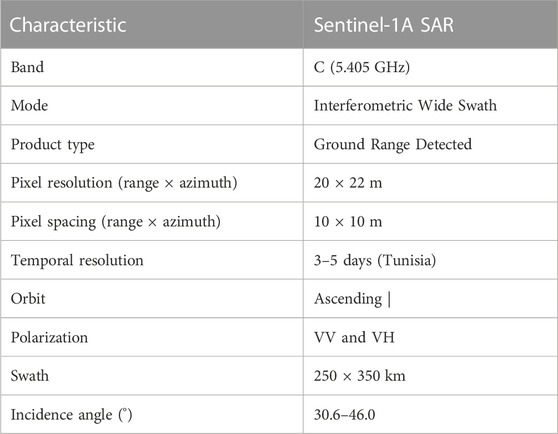
TABLE 2. Main characteristics of S-1A (https://sentinel.esa.int/web/sentinel/missions/sentinel).
Table 3 provides detailed information about the SAR imagery dataset used in this study. The images were obtained from the Sentinel-1 C-SAR satellite and were acquired at different dates. Specifically, five distinct inundation events that impacted the study area were investigated, with acquisitions made on 21 February 2015, 5 March 2015, 4 June 2017, 10 June 2017, 9 September 2019, 10 September 2019, 22 October 2019, 28 October 2019, 4 September 2020, and 10 September 2020. These dates provide extensive temporal coverage to analyze the changes and impacts of the different events on the study region.

TABLE 3. Details of the SAR imagery dataset.
2.2 SAR data analysis
The methodology adopted for processing Sentinel-1 SAR GRD (Ground Range Detected) images followed a series of steps. The preprocessing, processing, and analysis were performed using SNAP 9.0. The images underwent radiometric calibration to extract the backscattering coefficients. To address geometric distortions, a Range Doppler terrain correction was applied, and SRTM data was used for geocoding and correcting topographic deformations (geometric correction accuracy <1 pixel). The resulting images were projected onto an output image with 10m pixel spacing, expressed in WGS84 lat long geographic coordinates for the Tunisian study area. Following the terrain correction, a speckle filter (Lee refined) was applied using a 7x7 window, as described by Lee et al. (1994), to reduce noise and enhance image quality. Additional noise removal was performed using histogram equalization techniques. Subsequently, change detection was carried out through band math operations, binarization, and flood specific thresholding. These operations facilitated the identification and differentiation of flood affected areas from the surrounding regions. Finally, the flood mapping was conducted by integrating the results obtained from the previous steps. This methodology was applied to a dataset consisting of 10 pre and post flood Sentinel-1 images, capturing significant flood events in the study area. Figure 3 provides a visual representation of the various processing steps involved in characterizing floods, analyzing landscape changes, and generating flood zone maps.

FIGURE 3. Flow chart of our synthetic aperture radar (SAR) image flood mapping method of lower Majerda valley.
2.3 Thresholding and identification of water pixels
In the process of creating a new classified image, a specific formula was applied to represent water objects. A value of 255 was assigned to water objects by lowering the backscattering threshold to 2.22E-2, although this may vary depending on the image quality. For higher values, a value of 0 was assigned. This operation was performed using the following expression in the Expression field: 255*(Sigma0_VV<2.22E-2).
The expression (Sigma0_VV<2.22E-2) generates a logical “true” value (1) when the values are less than 2.22E-2, and a logical “false” value (0) for higher values. By multiplying the result by 255, a new image was created where water objects are represented by a value of 255, while other values are set to 0 (Kussul et al., 2011).
3 Results
3.1. Flood occurrences and surface water map
3.1.1 27 February 2015 event
The 2015 event primarily occurred in the middle valley of the Mejerda River, specifically in the cities of Jendouba and Boussalem, with precipitation amounts reaching 141 mm. During this period, the disaster response committee recorded numerous interventions aimed at assisting the affected individuals. Between February 25th and 27th, a total of 65 operations were conducted for water evacuation, 12 interventions were carried out for road clearance, and 42 others were performed to provide aid to the affected citizens. One consequence of the rising waters of the Mejerda River was observed on March 3rd in the delta plain, where a section of the regional road N° 53 was severed, stretching from the Raoued intersection to Kalaât Al Andalus. These measures were taken to ensure the safety of residents and minimize the risks associated with flooding. https://www.leaders.com.tn/article/16494. Figure 4 depicts the extent and location of the flooded areas recorded in the SAR images from 5 March 2015. The waters flowing from the middle valley reached the lower valley after approximately 1 week. The red arrows clearly indicate the location of the affected areas.
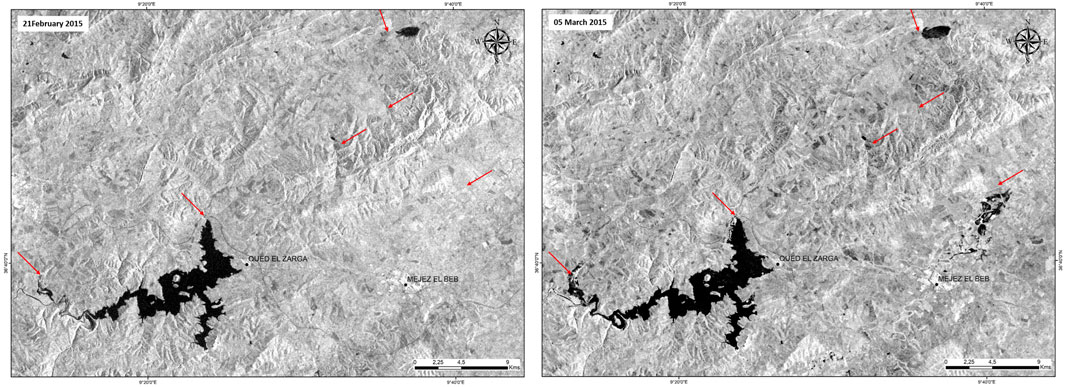
FIGURE 4. Extent and location of flooded areas: Comparison of images from 21 February 2015 and 05 March 2015.
3.1.2 06 June 2017 event
On 6 June 2017, Northern Tunisia was struck by a remarkable storm, experiencing over 70 mm of rainfall in just 25 min, accompanied by strong winds, intense precipitation, and hail. Severe weather conditions affected the country, resulting in two fatalities and significant material damage in the Tunis metropolitan area. The event was primarily localized in the southern part of the Mejerda delta plain, belonging to Greater Tunis, particularly the northeastern region of the Manouba governorate. Two individuals lost their lives due to the severe weather, and extensive damage occurred as a result of flooding, including damaged roads and flooded houses. The governorate of Ariana was also heavily impacted, with numerous houses being flooded and roads severely damaged. The consequences of this storm had a significant impact on the region. https://wikimonde.com/article/
Figure 5 presents a visual comparison of the extent of flooded areas between pre flood and post flood images, after undergoing radiometric and geometric calibration processes. Additionally, a speckle filter was applied to enhance the visual quality of the SAR data used. In the pre flood image from 4 June 2017, the affected areas are depicted with lighter tones, indicating low soil moisture. However, in the post flood image from 10 June 2017, new flooded areas are clearly distinguishable with significantly darker colors. These intense colors reflect heavily water saturated terrains, including the presence of stagnant water. This condition is a direct result of heavy precipitation primarily occurring in the vicinity of Sabkhet Ariana and surrounding areas. It is important to note that this rainfall event was localized in nature. In the pre flood image from 4 June 2017, the affected areas are depicted with lighter tones, indicating low soil moisture. However, in the post flood image from 10 June 2017, new flooded areas are clearly distinguishable with significantly darker colors. These intense colors reflect heavily water saturated terrains, including the presence of stagnant water. This condition is a direct result of heavy precipitation primarily occurring in the vicinity of Sabkhet Ariana and surrounding areas. It is important to note that this rainfall event was localized in nature.
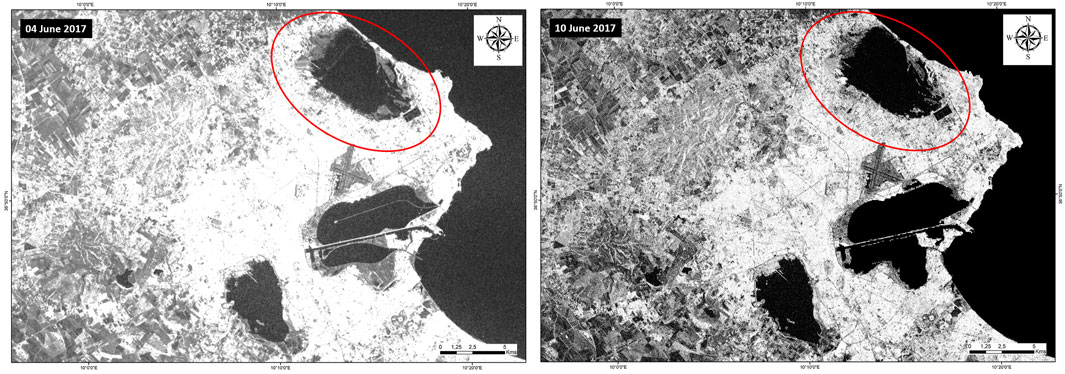
FIGURE 5. Extent and location of flooded areas: Comparison of images from 4 June 2017 and 10 June 2017 after the event of 6 June 2017.
3.1.3 10 September 2019 event
Following a few minutes of heavy rainfall on Tuesday, 10 September 2019, with precipitation amounts generally ranging between 30 and 50 mm, several neighborhoods and roads were flooded. The most significant damage occurred in the Ariana governorate, with numerous houses being flooded and roads being cut off. La Soukra, Ariana Ville, Les Menzah, and other cities were affected by these torrential downpours. Even the capital city of Tunis was impacted, resulting in individuals being stranded by the rising waters. https://kapitalis.com/tunisie/2019/09/11/
Figure 6 provides a visual interpretation of the changes that occurred before and after the precipitation, with an image capture dated September 9th and another on September 10th. The two images reveal striking contrasts in the studied landscape, located at the mouth of the Mejerdah River, in the southern terrain of the Ghar el Melh lagoon and Kalaât Al Andalus.
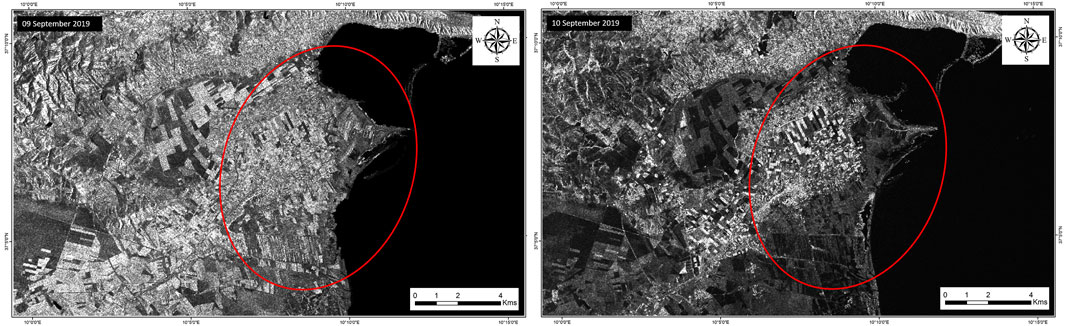
FIGURE 6. SAR visual contrasts: before and after precipitation in the Mejerda River, September 9–10, 2019.
The September 9th image shows a dry and arid landscape, where the terrain appears clear and devoid of any moisture, indicating the prevailing arid conditions in the locality prior to the rains. In contrast, the September 10th image presents a completely different perspective. The terrain is now saturated with abundant moisture, with the notable presence of extensive dark areas and stagnant waters. These changes reflect the impact of the rains and floods on the locality.
One significant aspect of this event is its nonlocalized nature, signifying a profound impact across the entire delta plain. This observation underscores the substantial magnitude of precipitation, capable of triggering extensive flooding in the region. Figure 7 intricately illustrates the rainfall impact using a multitemporal color composition, with varying shades of green highlighting affected areas. Intense green zones indicate areas submerged by floodwaters, emphasizing the force and significance of flows in the downstream Mejerda basin. This mapping serves as a potent tool for a clear visualization of the most affected areas, facilitating the identification of the prevailing direction of water flow. Figure 7 presents a multitemporal representation in RGB color, spanning from September 9th to 10 September 2019. Notably, the event occurred in the afternoon of September 10th, with the image captured on the same day at 9 PM. This timeframe is crucial for comprehending the event’s impact, aligning with the most critical days in terms of precipitation intensity and flood formation. The vibrant green coloring of the flooded areas not only emphasizes the magnitude of the impact but also provides valuable insights for assessing the extent of flood damage.
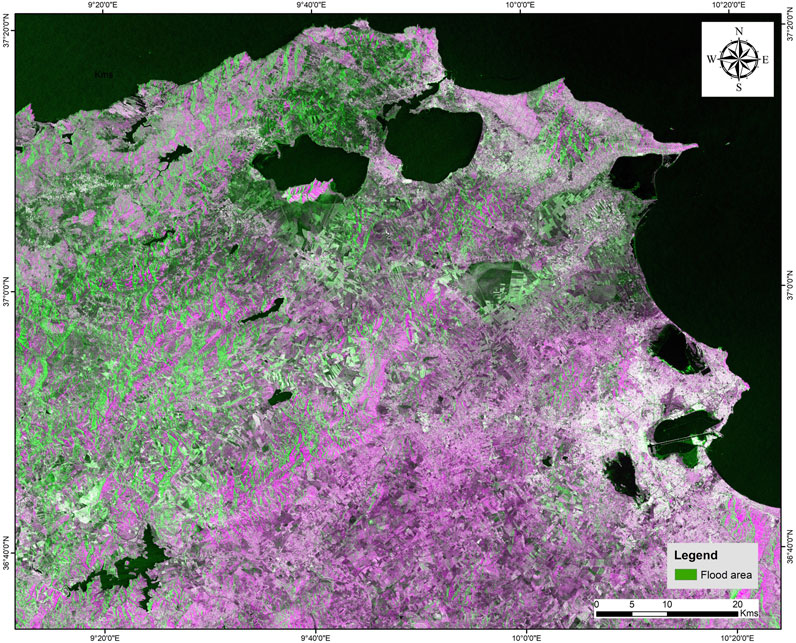
FIGURE 7. Multitemporal RGB mapping of flooding extent in the Mejerda delta region during September 9–10, 2019.
3.1.4 28 October 2019
Between October 27th and 28th, 2019, torrential rains ranging from 52 to 78 mm led to extensive flooding and severe traffic congestion. This event caused road closures and disruptions in neighborhoods across the Ariana governorate, lasting for several hours. The substantial amount of water was especially noteworthy due to its rapid accumulation within a brief timeframe. The red arrows in Figure 8 clearly indicate the position and extent of the flooded areas. These areas are primarily situated in the lowest terrains of the Manouba and Kalaât Al Andalus regions, with some sections also identified within the Ariana governorate.
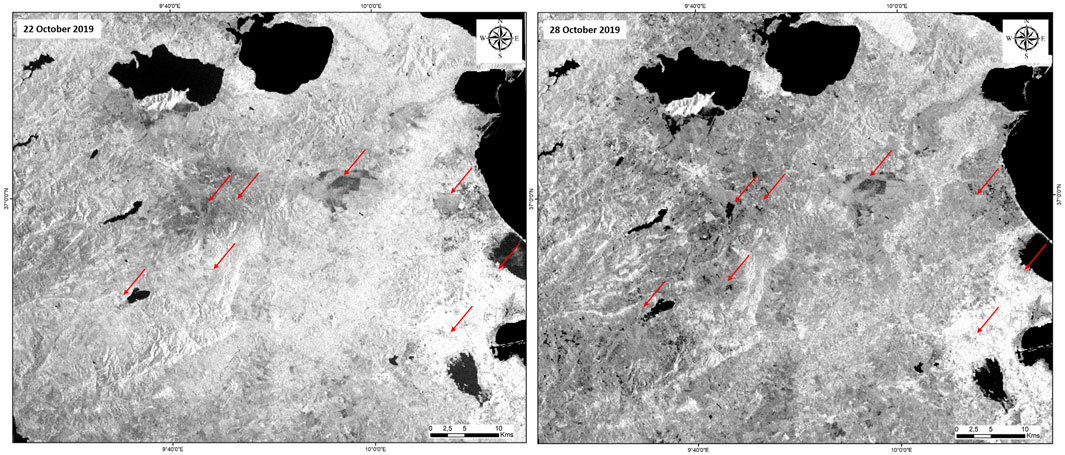
FIGURE 8. Extent and location of flooded areas: Comparison of images from 22 October 2019 and 28 October 2019.
3.1.5 10 September 2020 event
10 September 2020, heavy rains fell over the Greater Tunis area (Tunis, Ariana, Manouba, Sijoumi), resulting in the paralysis of road traffic. The flooding also led to the suspension of certain metro lines and caused damage to several infrastructures. https://www.arabnews.fr/node/158491.
The analysis of the images presented in Figure 9 allows for mapping and distinguishing the flooded areas before and after the floods. Appropriate processing techniques have been applied to enhance the quality and visual interpretation of these images. The results reveal that the areas affected by this flood event are primarily concentrated in the vicinity of Sabkhet Essijoumi. These areas exhibit clear signs of flooding, with a darker coloration indicating high soil saturation and potentially the presence of stagnant water.
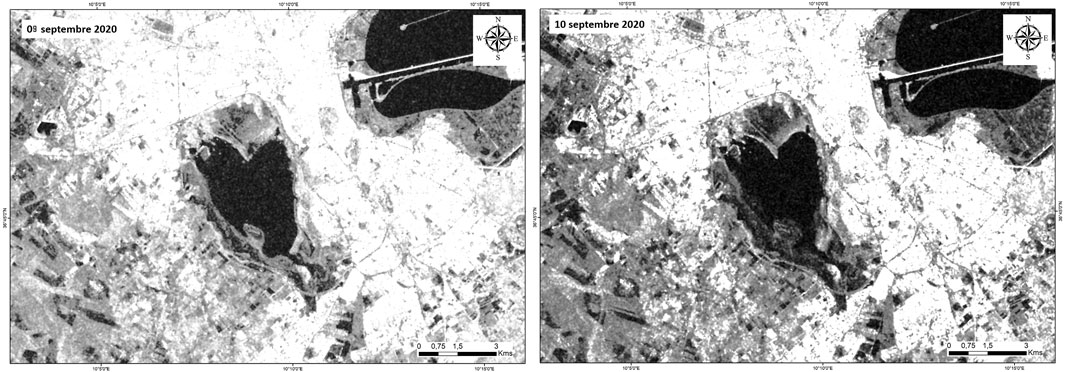
FIGURE 9. Extent and location of flooded areas: Comparison of images from 09 September 2020 and 10 September 2020 after the event of 10 September 2020.
3.2 Flood occurrences and surface water map
In recent years, despite the overall drought experienced in North African countries, the Mejerda River valley in Tunisia has witnessed several major flood events. Among the cases studied, we can mention the 2015 flood, which particularly affected the cities of Jendouba and Boussalem, with precipitation reaching up to 141 mm. In 2017, another flood event, although localized, caused flooding in the region. This was followed by floods in September 2019 that affected multiple neighborhoods, including the capital, Tunis. In October 2019, torrential rains led to traffic congestion and significant floods, while the flood in September 2020 paralyzed road traffic and damaged infrastructure (Figure 10). The use of Sentinel-1 radar data has played a crucial role in detecting and managing these flooded areas. Sentinel-1 radar data offer a constant monitoring capability independent of weather conditions, making them particularly effective for tracking the evolution of floods over time and accurately mapping the extent of the affected areas. When combined with topographic and geological analyses, this radar data provides a comprehensive understanding of the region’s vulnerability to floods.
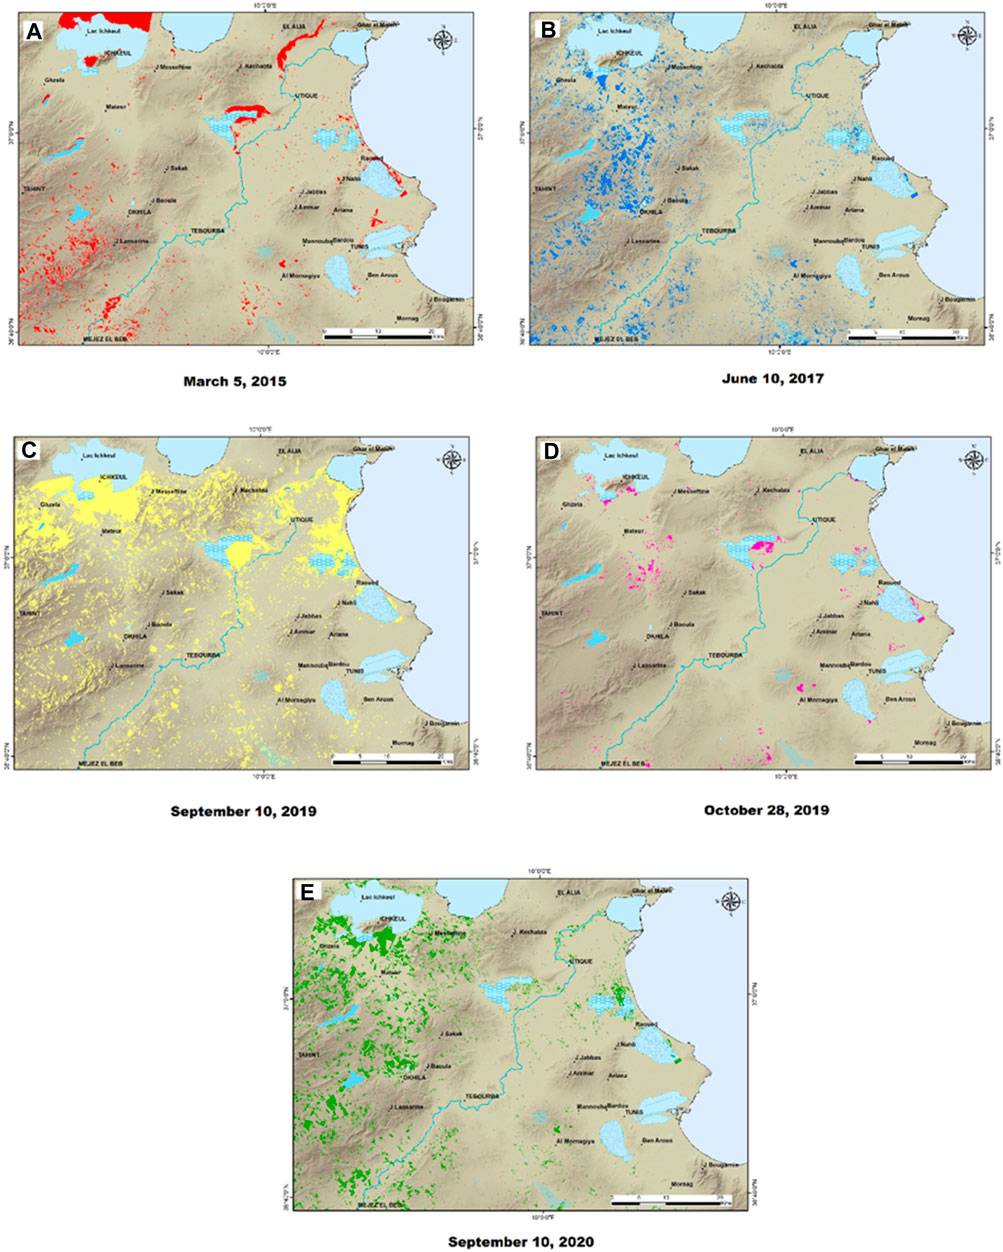
FIGURE 10. Localization of Flooded Areas Identified from Sentinel-1 Data: Superimposition on Digital Elevation Model for Various Events. (A) 5 March 2015, (B) 10 June 2017, (C) 10 September 2019, (D) 28 October 2019, (E) 10 September 2020.
The regulation of rivers (i.e., Dams constructions) have far reaching implications (Lee et al., 1994). The hydroperiod regime encompasses both the duration and spatial extent of flooding, and when modified by human intervention, it can lead to significant consequences. While changes in river flow due to factors like dam construction or climate change can be analyzed using long term hydrologic and climatic records, assessing the spatial effects of these hydrologic changes poses challenges. Here, we provide an illustration of flood water inundation of lower the Mejerda Valley lowland plain, which depressions are especially vulnerable to flooding, often annually. Along the topographic profile (Figure 11), the Sebkhat Ariana, Garaât Mabtouha and Mejerda river are few meters higher than the actual sea level. The most important floods that damaged this zone since 2015 are studied and mapped (Figure 11). We note that the damaged areas are linked to actual topographic anomalies, e.g., Sebkhas, Garaâts and lakes (Figure 11).
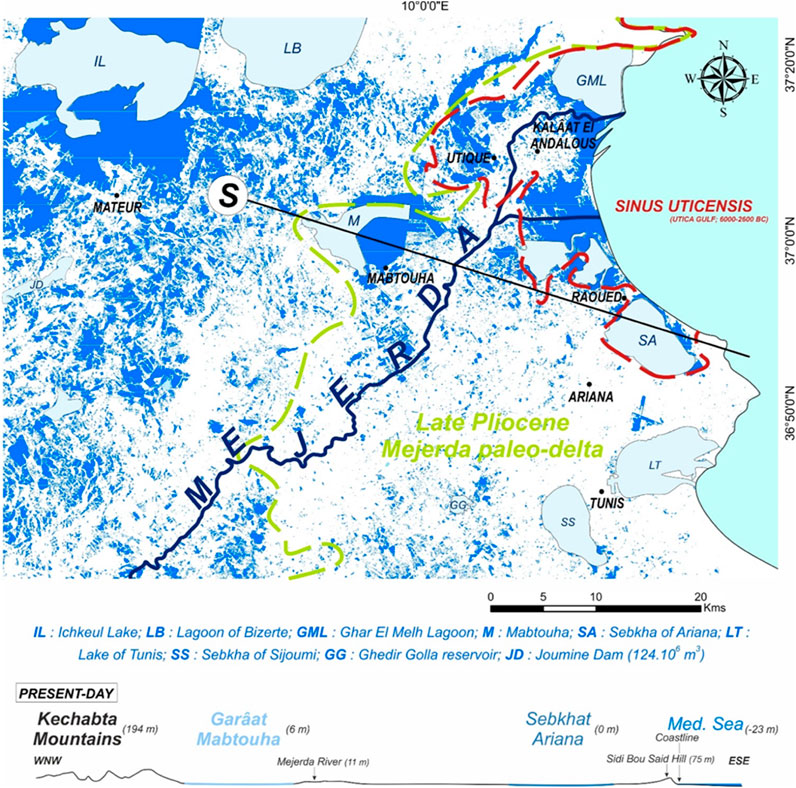
FIGURE 11. Multitemporal floods mapping in the Lower Mejerda Valley and surrounding areas. Localizations for 5 March 2015; 10 June 2017; 10 September 2019; 28 October 2019; and 10 September 2020. Notice that the topographic profile (S on the map) presents the topography of the valley, together with some landscape features, such as Sebkhat Ariana and Kechabta Mountains.
4 Discussions
4.1 The lower Mejerda Valley: geological background
Mesozoic to Quaternary series outcrops in the study area (Figure 12). The study area Except the evaporitic Triassic deposits, corresponding to Lagoonal to marine subsiding epicontinental facies (Khelil et al., 2021), the Meso Cenozoic series are mostly clays and carbonates, with Oligocene sands to the top (Figure 13A). These formations are deposited in a marine environment. The Neogene and Quaternary sedimentation is characterized by continental/lagoonal fluvial deltaic environment, except the Pliocene open marine sediments (Figure 13B). The fluvial deltaic Kechabta formation is

FIGURE 12. Simplified geological map of the study area, from Sidi Salem Dam to Mejerda mouth eastward.
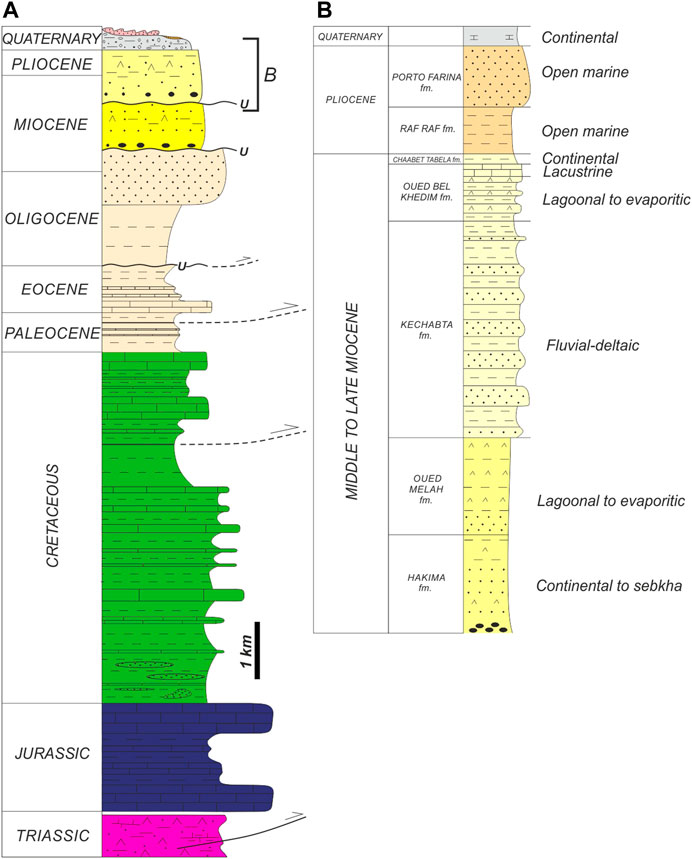
FIGURE 13. (A) Stratigraphy summary (Khelil et al., 2021) of the outcropping series from Triassic to recent and (B) detailed lithostratigraphic Column (Harrab et al., 2013) of Miocene to actual deposits and their depositional environment.
Very thick, reaching 1,200 m (El Euch-El Koundi et al., 2022), indicating important subsidence [Figure 14 (Bejaoui et al., 2017; Gaidi et al., 2020; Khelil et al., 2021)] during the Late Miocene, simultaneously to the docking of the Kabylies against Africa (Frizon De Lamotte et al., 2000; Frizon De Lamotte et al., 2009; Khomsi et al., 2016; Booth-Rea et al., 2018; Khomsi et al., 2019; Camafort Blanco et al., 2020; Khelil et al., 2021; El Euch-El Koundi et al., 2022). Recent work by El Euch-El Koundi et al. (2022) on the Chaabet Tabela formation confirmed the importance of the tectonic activity, with the climate, controlling the alluvial fan deposits. Thus, tectonic activity [Figure 14; See e.g. Camafort Blanco et al. (2020); Gaidi et al. (2020); Khelil et al. (2021)] uplifted the Mogods and the Haut Tell mountain ranges (Figure 1) and caused important erosion, degradation, and incision. Then, the Pliocene to recent times are characterized by a transgression and an open marine sedimentation.
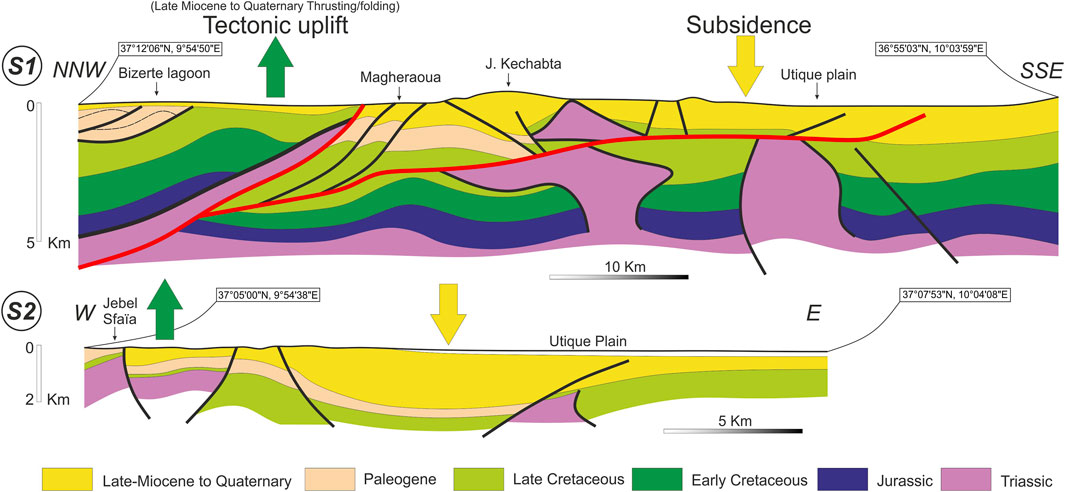
FIGURE 14. Geological cross sections crossing the Utique plain: (S1) redrawn from Khelil et al. (2021) and (S2) redrawn from Bejaoui et al. (2017). Note the tectonic uplift to the North (Thrusting and folding) and west (Normal and listric faulting) of the Utique plain, which is characterized by an important subsidence during Late Miocene to Quaternary. Positions are given in Figure 12.
4.2 Lower Mejerda Valley geomorphological history and observed floods
Our goal is to distinguish the relative influences of the paleo topography and the delta evolution on flood distribution. By employing a multidisciplinary approach, we aim to understand the geological history of the Lower Mejerda Valley, spanning from the Late Messinian period to the present day. This approach allows us to connect the region’s geomorphological evolution with contemporary flood risks and areas susceptible to damage.
The topography analysis through the presented profile of Figure 11 indicates that Mejerda River (+11 m), the Sabkhet Ariana (0 m) and Garâat Mabtouha (+6 m) characterize a lowland plain. It corresponds to the ancient deltas of the Mejerda: (1) Late Pliocene delta characterized by an open marine deposit environment. The delta emerged except for a few islands, like Sidi Bou Said Island (Figure 15). This paleodelta sediments prograde to the East and then the shoreline evolve to form by 6000 BC the second paleo delta, namely, (2) Sinus Uticensis (e.g., Chelbi et al. (1995); Jauzein, (1971); Paskoff, (1994); Paskoff and Trousset, (1992); Pleuger et al. (2019). The Gulf of Utica is well studied and lithostratigraphic logs [W1 and W2 of Figure 15; Pleuger et al. (2019)] from the region exhibit a recent evolution from a marine to lagoonal to fluvial/alluvial environments. Along this basin filling history, the coastal lagoonal system is (Chelbi et al., 1995) moving eastward (see profiles of Figure 15), together with the shoreline (Figure 15) and the progradation of the sediments. As discussed earlier within the Lower Mejerda Valley, the mapped damage areas (Figure 11) are linked to the present day Sebkhas (e.g., Sabkhat Ariana), lagoons (e.g., Ghar Melh Lagoon) or paleo sabkhas/paleo lagoons (e.g., Garâat Mabtouha and Garâats to the North of Raoued). Thus, the Mejerda delta and its associated lagoonal system evolution seem to deeply control the flood risk, especially regarding the Gulf of Utica.
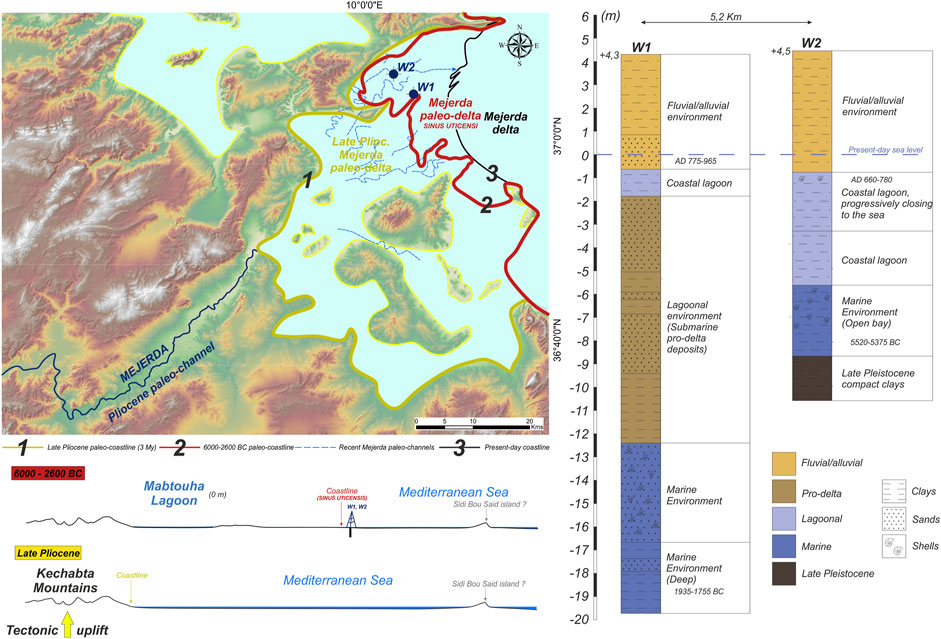
FIGURE 15. Relief map presenting Late Pliocene (Modified after Ben Mosbah et al. (2010)) and 2,600 to 6000 BC (Sinus Uticensis; Modified after Ben Mosbah et al. (2010); Chelbi et al. (1995); Jauzein, (1971); Paskoff, (1994); Paskoff and Trousset, (1992); Pleuger et al. (2019) paleo deltas of the Mejerda River, with two relative profiles (S of Figure 11) reconstruction and two lithostratigraphic logs W1 and W2 near Utique city from Pleuger et al. (2019).
4.3 Climate change and soil moisture conditions
The relationship between climate change and flooding raises numerous unresolved questions. Natural factors like climate and river basin morphology, as well as human-made factors such as river channelization and urbanization, affect the frequency of floods, while social and economic factors shape their consequences (Bronstert, 2003). Meteorological conditions play a crucial role in the context of climate change, but the impact of climate change on flooding is multifaceted. Beyond meteorology, the vegetation and soil conditions in a catchment area, which determine water retention and evaporation processes, can be influenced by climate change, creating a feedback loop that affects flood development.
The Mediterranean region is characterized by significant precipitation variability, often accentuated by orography, featuring strong seasonality, substantial inter-annual fluctuations, and diverse rain and land surface properties. Consequently, catchments in this area are prone to experiencing hydro-meteorological extremes, including storms, floods, and flash floods [(Bronstert, 2003) and references therein].
The Mediterranean region is recognized as a climate change hotspot compared to other parts of the world (Giorgi, 2006). Changes in major climatic parameters, notably temperatures and precipitation, surpass current global mean values and are anticipated to exceed projected mean changes in the coming decades. The impacts of these changes are substantial, affecting the occurrence, magnitude, and frequency of extreme events, as well as various environmental aspects of the Mediterranean. While heatwaves in the Mediterranean Basin have already become more frequent and prolonged since the 1950s, future projections indicate a significant increase, particularly in the eastern and southern Mediterranean countries. Numerous studies have indicated a potential increase in hydro-meteorological extremes e.g., (Kharin and Zwiers, 2005; Benestad and Haugen, 2007; Raff et al., 2009; Gilroy and McCuen, 2012; Vezzoli and Mercogliano, 2013; Camici et al., 2014; Piras et al., 2014), driven by rising temperatures and higher atmospheric moisture content e.g., (Westra et al., 2013; Piras et al., 2014; Polade et al., 2017; Tramblay and Somot, 2018; Ribes et al., 2019). The Clausius–Clapeyron thermodynamics principle suggests that changes in extreme rainfall are linked to increased atmospheric water content with rising temperatures (Drobinski et al., 2016; Pfahl et al., 2017). However, this relationship exhibits spatial variability influenced by temperature and humidity (Wasko et al., 2016). Despite an overall decrease in precipitation in many parts of the Mediterranean, the occurrence of extreme precipitation may rise, which is particularly notable in small catchments near the coast and densely populated areas, where short and intense rainfall events have been recorded.
Antecedent soil moisture conditions, a key factor in flood generation, depend on soil characteristics and initial moisture content (Brocca et al., 2008; Tramblay et al., 2010; Raynaud et al., 2015; Woldemeskel and Sharma, 2016; Wasko and Sharma, 2017; Uber et al., 2018; Wasko and Nathan, 2019). The nonlinear relationship between flow rate and initial soil saturation, often with a threshold value, influences the rapid flow response to rainfall (Norbiato et al., 2008; Viglione et al., 2009; Penna et al., 2011). Then, an escalation in rainfall intensity does not necessarily correspond to an increase in flood risk (Norbiato et al., 2008; Viglione et al., 2009; Penna et al., 2011; Ivancic and Shaw, 2015; Woldemeskel and Sharma, 2016; Wasko and Sharma, 2017; Uber et al., 2018; Wasko and Nathan, 2019). Runoff coefficients, varying in time and space due to complex interactions between precipitation and infiltration processes, can modulate flood magnitude (Woldemeskel and Sharma, 2016; Wasko and Sharma, 2017; Bennett et al., 2018). Therefore, the use of hydrological or surface models capable of representing these complex processes is essential (Zhang et al., 2011). In Mediterranean basins, there are indications of a tendency towards increased flood magnitude and decreased frequency (Giuntoli et al., 2012; Mediero et al., 2014; Mangini et al., 2018; Blöschl et al., 2019; Tramblay et al., 2019).
5 Conclusion
This work highlights the crucial importance of flood management in the Lower Mejerda Valley in Tunisia, a region vulnerable to recurrent floods. These floods have a devastating impact on various aspects of life in the region, affecting both the human population and the local ecosystems, agriculture, and the local economy. Despite the numerous hydraulic structures installed along the river, the increase in extreme precipitation due to climate change has heightened flood risks, exacerbating the existing vulnerability caused by the urban expansion of the capital and changes in land use. To address this complex challenge, we adopted an integrated approach that combines the analysis of SAR data with elements of topography, geology, and even the geomorphologic and paleogeographic history of the region. This approach has demonstrated its effectiveness in precisely identifying flood prone areas, both spatially and temporally, as well as in mapping the lands affected by floods. All available information examined, and the analyzed data converge to two essential conclusions:
Firstly, the relief of the Mejerda Delta is primarily the result of tectonism. This delta serves as a striking example of the influence of tectonic movements not only on the Mio Pliocene depositional units but also on the Quaternary relief and the current delta processes. It is important to emphasize that this tectonism led to the uplift of the mountains to the north and west of the valley while creating a subsiding basin. This complex interaction between tectonic forces and modern deltaic phenomena plays a decisive role in the current configuration of the Mejerda Delta.
Secondly, the topography that characterizes the lower Mejerda Valley results from a long geomorphological evolution. The eastward advance of the shoreline, together with the development of the lagoon system, has led to the formation of both paleo and current sabkhas and lagoons. These landscape features, while of major geological interest, also constitute significant indicators of a high flood risk. This assertion is supported by a meticulous analysis of past flood events as well as their detailed mapping.
However, for even more effective flood risk management and increased disaster prevention, further research is imperative. It is essential to continue exploring the complex interactions between tectonic processes, deltaic phenomena, and flood regimes. Additionally, the integration of updated data, including SAR radar data, with hydraulic models and geospatial analyses can provide a better understanding of flood evolution in this vulnerable region.
Data availability statement
The original contributions presented in the study are included in the article/supplementary material, further inquiries can be directed to the corresponding author.
Author contributions
LK: Conceptualization, Investigation, Methodology, Project administration, Software, Supervision, Validation, Writing–original draft, Writing–review and editing. RK: Conceptualization, Formal Analysis, Investigation, Methodology, Resources, Writing–original draft, Project administration, Validation, Software, Supervision, Visualization, Writing–review and editing. MK: Conceptualization, Data curation, Formal Analysis, Investigation, Project administration, Validation, Writing–original draft. SG: Conceptualization, Software, Supervision, Visualization, Writing–review and editing. MG: Supervision, Visualization, Writing–review and editing. FZ: Project administration, Supervision, Visualization, Writing–review and editing.
Funding
The author(s) declare that financial support was received for the research, authorship, and/or publication of this article. This work was supported by the Regional Center for Remote Sensing of North Africa States (CRTEAN), which generously covered the publication fees associated with this research.
Acknowledgments
The authors warmly thank Guest Associate Editor Dr Zhihua Zhang, Chief Editor Dr. Valerio Acocella and five anonymous reviewers for their insightful and highly appreciated comments and suggestions which ameliorated the first draft of the paper. We also acknowledge the Sentinel-1 Scientific Data Hub for providing high quality and easily accessible data.
Conflict of interest
The authors declare that the research was conducted in the absence of any commercial or financial relationships that could be construed as a potential conflict of interest.
Publisher’s note
All claims expressed in this article are solely those of the authors and do not necessarily represent those of their affiliated organizations, or those of the publisher, the editors and the reviewers. Any product that may be evaluated in this article, or claim that may be made by its manufacturer, is not guaranteed or endorsed by the publisher.
References
Abidi, M. (2007). Étude et modélisation de la dynamique fluviale de l’oued Mellègue en période de crue, Thesis (MSc). Tunisia: Institut National Agronomique de Tunisie, 96.
Bejaoui, H., Aïfa, T., Melki, F., and Zargouni, F. (2017). Structural evolution of Cenozoic basins in northeastern Tunisia, in response to sinistral strike-slip movement on the El Alia-Teboursouk Fault. J. Afr. Earth Sci. 134, 174–197. doi:10.1016/j.jafrearsci.2017.06.021
Benestad, R. E., and Haugen, J. E. (2007). On complex extremes: flood hazards and combined high spring-time precipitation and temperature in Norway. Clim. Chang. 85, 381–406. doi:10.1007/s10584-007-9263-2
Ben Mosbah, C. Z., Ben Ismaïl Lattrache, K., Gueddari, M., and Reyss, J. L. (2010). Evolution biosédimentaire du dépôt quaternaire de la lagune de l'Ariana, Tunisie (une zone humide du Maghreb Nord). Quaternaire 21 (2), 181–194. doi:10.4000/quaternaire.5548
Benmoussa, T., Amrouni, O., Dezileau, L., Mahé, G., and Abdeljaouad, S. (2018). The sedimentological changes caused by human impact at the artificial channel of MedjerdaRiver (Coastal zone of Medjerda, Tunisia). Proc. Int. Assoc. Hydrological Sci. 377, 77–81. doi:10.5194/piahs.377-77-2018
Bennett, B., Leonard, M., Deng, Y., and Westra, S. (2018). An empirical investigation into the effect of antecedent precipitation on flood volume. J. Hydrol. 567, 435–445. doi:10.1016/j.jhydrol.2018.10.025
Blöschl, G., Hall, J., Viglione, A., Perdigão, R. A. P., Parajka, J., Merz, B., et al. (2019). Changing climate both increases and decreases European river floods. Nature 573 (7772), 108–111. doi:10.1038/s41586-019-1495-6
Booth-Rea, G., Gaidi, S., Melki, F., Marzougui, W., Azañón, J. M., Zargouni, F., et al. (2018). Late Miocene extensional collapse of northern Tunisia. Tectonics 37 (6), 1626–1647. doi:10.1029/2017TC004846
Brocca, L., Melone, F., and Moramarco, T. (2008). On the estimation of antecedent wetness conditions in rainfall–runoff modelling. Hydrol. Process 22, 629–642. doi:10.1002/hyp.6629
Bronstert, A. (2003). Floods and climate change: interactions and impacts. Risk Anal. 23, 545–557. doi:10.1111/1539-6924.00335
Camafort Blanco, M., Pérez, J. V., Booth-Rea, G., Melki, F., Gràcia, E., Azañón, J. M., et al. (2020). Active tectonics and drainage evolution in the Tunisian Atlas driven by interaction between crustal shortening and mantle dynamics. Geomorphology 351, 106954. doi:10.1016/j.geomorph.2019.106954
Camici, S., Brocca, L., Melone, F., and Moramarco, T. (2014). Impact of climate change on flood frequency using different climate models and downscaling approaches. J. Hydrol. Eng. 19 (8), 04014002. doi:10.1061/(asce)he.1943-5584.0000959
Cantoni, E., Tramblay, Y., Grimaldi, S., Salamon, P., Dakhlaoui, H., Dezetter, A., et al. (2022). Hydrological performance of the ERA5 reanalysis for flood modeling in Tunisia with the LISFLOOD and GR4J models. J. Hydrology Regional Stud. 42, 101169. doi:10.1016/j.ejrh.2022.101169
Caretta, M. A., Mukherji, A., Arfanuzzaman, M., Betts, R. A., Gelfan, A., Hirabayashi, Y., et al. (2022). “Water,” in Climate change 2022: impacts, adaptation and vulnerability. Contribution of working group II to the sixth assessment report of the intergovernmental panel on climate change. Editors H-O Pörtner, DC Roberts, M Tignor, ES Poloczanska, K Mintenbeck, A Alegríaet al. (Cambridge, UK and New York, NY, USA: Cambridge University Press), 551–712. doi:10.1017/9781009325844.006
Chelbi, F., Paskoff, R., and Trousset, P. (1995). La baie d'Utique et son évolution depuis l'Antiquité: une réévaluation géoarchéologique. Antiq. Afr. 31 (1), 7–51. doi:10.3406/antaf.1995.1234
Claude, J., Francillon, G., and Loyer, J. Y. (1976). Les alluvions déposées par l’Oued Medjerda lors de la crue exceptionnelle de mars 1973. Cah. ORSTOM, Hydrol. 14, 37–109.
Collet, C. L. (1953). Les moyens mis en œuvre en Tunisie pour l'étude des crues de la Medjerdah. Houille Blanche 39 (3), 395–408. doi:10.1051/lhb/1953036
David, L. (1956). “Etude géologique de la haute Medjerda,” in Bulletin Service de la carte géologique de l’Algérie.
Delile, H., Abichou, A., Gadhoum, A., Goiran, J. P., Pleuger, E., Monchambert, J. Y., et al. (2015). The geoarchaeology of Utica, Tunisia: the paleogeography of the Mejerda Delta and hypotheses concerning the location of the ancient harbor. Geoarchaeology 30 (4), 291–306. doi:10.1002/gea.21514
Drobinski, P., Alonzo, B., Bastin, S., Silva, N. D., and Muller, C. (2016). Scaling of precipitation extremes with temper-ature in the French Mediterranean region: what explainsthe hook shape? J. Geophys. Res.-Atmos. 121, 3100–3119. doi:10.1002/2015JD023497
El Euch-El Koundi, N., Ferry, S., Suc, J. P., Clauzon, G., Melinte-Dobrinescu, M. C., Gorini, C., et al. (2009). Messinian deposits and erosion in northern Tunisia: inferences on strait of sicily during the messinian salinity crisis. Terra nova. 21 (1), 41–48. doi:10.1111/j.1365-3121.2008.00852.x
El Euch-El Koundi, N., Gugliotta, M., and Mitten, A. J. (2022). Alluvial fans in the latest phase of the Messinian Salinity Crisis: an example from the Chaabet et Tabbela Formation, Northern Tunisia, Central Mediterranean. Sediment. Geol. 442, 106276. doi:10.1016/j.sedgeo.2022.106276
Elhag, M., and Abdurahman, S. (2020). Advanced remote sensing techniques in flash flood delineation in Tabuk City, Saudi Arabia. Nat. Hazards 103 (3), 3401–3413. doi:10.1007/s11069-020-04135-0
Ezzine, A., Saidi, S., Hermassi, T., Kammessi, I., Darragi, F., and Rajhi, H. (2020). Flood mapping using hydraulic modeling and Sentinel-1 image: case study of Medjerda Basin, northern Tunisia. Egypt. J. Remote Sens. Space Sci. 23 (3), 303–310. doi:10.1016/j.ejrs.2020.03.001
Fehri, N. (2014). L’aggravation du risque d’inondation en Tunisie: éléments de réflexion. Physio-Géo 8, 149–175. doi:10.4000/physio-geo.3953
Fehri, N., Samaali, H., and Abaza, K. (2009). Les inondations catastrophiques du 13 octobre 2007 dans le secteur de Sabbelet Ben Ammar entre aléa climatique et responsabilité anthropique (Grand Tunis–Tunisie). Rev. Tunis. De. Géogr. 40, 31–55.
Frizon De Lamotte, D., Bezar, B., Bracène, R., and Mercier, E. (2000). The two main steps of the atlas building and geodynamics of the Western Mediterranean. Tectonics 19 (4), 740–761. doi:10.1029/2000TC900003
Frizon De Lamotte, D., Leturmy, P., Missenard, Y., Khomsi, S., Ruiz, G., Saddiqi, O., et al. (2009). Mesozoic and Cenozoic vertical movements in the Atlas system (Algeria, Morocco, Tunisia): an overview. Tectonophysics 475 (1), 9–28. doi:10.1016/j.tecto.2008.10.024
Gaidi, S., Booth-Rea, G., Melki, F., Marzougui, W., Ruano, P., Pérez-Peña, J. V., et al. (2020). Active fault segmentation in Northern Tunisia. J. Struct. Geol. 139, 104146. doi:10.1016/j.jsg.2020.104146
Gharbi, M., Soualmia, A., Dartus, D., and Masbernat, L. (2016). Comparison of 1D and 2D hydraulic models for floods simulation on the Medjerda Riverin Tunisia. J. Mater. Environ. Sci. 7 (8), 3017–3026.
Gilroy, K. L., and McCuen, R. H. (2012). A nonstationary flood frequency analysis method to adjust for future climate change and urbanization. J. Hydrol. 414–415, 40–48. doi:10.1016/j.jhydrol.2011.10.009
Giorgi, F. (2006). Climate change hot-spots. Geophys. Res. Lett. 33, L08707. doi:10.1029/2006GL025734
Giuntoli, I., Renard, B., and Lang, M. (2012). “Floods in France,” in Changes in flood risk in Europe. Editor Z. W. Kundzewicz (Wallingford, UK: IAHS Special Publ), 10, 212–224. IAHS and CRC/Balkema.
Guilcher, A. (1960). Le delta de la Medjerda d’après J. Pimienta. Ann. Géogr. 69 (371), 77–80. doi:10.3406/geo.1960.14535
Harrab, S., Mannai-Tayech, B., Rabhi, M., and Zargouni, F. (2013). Study of a Neogene basin dynamics: the “Bizerte basin”, northeastern Tunisia: relevance to the global Messinian Salinity Crisis. Northeast. Tunis. Relevance Glob. Messinian Salin. Crisis. Comptes Rendus Geoscience 345 (5-6), 251–261. doi:10.1016/j.crte.2013.01.007
Ivancic, T. J., and Shaw, S. B. (2015). Examining why trends in very heavy precipitation should not be mistaken for trends in very high river discharge. Clim. Change 133, 681–693. doi:10.1007/s10584-015-1476-1
Jauzein, A. (1971). Evolution récente du delta de la Medjerda. Les agents de la morphogenèse. Paris: Travaux du laboratoire de Géologie de l’ENS, 126–151.
Jebari, S., Berndtsson, R., Lebdi, F., and Bahri, A. (2012). Historical aspects of soil erosion in the Mejerda catchment, Tunisia. Hydrological Sci. J. 57 (5), 901–912. doi:10.1080/02626667.2012.685741
Kharin, V. V., and Zwiers, F. W. (2005). Estimating extremes in transient climate change simulations. J. Clim. 18, 1156–1173. doi:10.1175/jcli3320.1
Khelil, M., Khomsi, S., Roure, F., Vergés, J., and Zargouni, F. (2021). Structural styles of the Tellian fold and thrust belt of Tunisia based on structural transects: insights on the subsurface oil and gas pre-salt plays. Arabian J. Geosciences 14 (19), 1985. doi:10.1007/s12517-021-08308-4
Khomsi, S., de Lamotte, D., Bédir, M., and Echihi, O. (2016). The late Eocene and late Miocene fronts of the atlas belt in eastern Maghreb: integration in the geodynamic evolution of the mediterranean domain. Arabian J. Geosciences 9 (15), 650. doi:10.1007/s12517-016-2609-1
Khomsi, S., Roure, F., Khelil, M., Mezni, R., and Echihi, O. (2019). A review of the crustal architecture and related presalt oil/gas objectives of the eastern Maghreb Atlas and Tell: need for deep seismic reflection profiling. Tectonophysics 766, 232–248. doi:10.1016/j.tecto.2019.06.009
Kotti, F., Dezileau, L., Mahé, G., Habaieb, H., Bentkaya, M., Dieulin, C., et al. (2018). Etude de l’impact des barrages sur la réduction des transports sédimentaires jusqu’à la mer par approche paléohydrologique dans la basse vallée de la Medjerda. Proc. Int. Assoc. Hydrological Sci. 377, 67–76. doi:10.5194/piahs-377-67-2018
Kotti, M. L., and Hermassi, T. (2022). Regional scale flood modeling using GIS and HEC-HMS/RAS: a case study for the upper valley of the Medjerda (Tunisia). J. new Sci. 89 (7), 5060–5067. doi:10.55416/sunb.jns01.2207.08907
Kussul, N., Shelestov, A., and Skakun, S. (2011). “Flood monitoring from SAR data,” in Use of satellite and in-situ data to improve sustainability. NATO science for peace and security series C: environmental security. Editors F. Kogan, A. Powell, and O. Fedorov (Dordrecht: Springer). doi:10.1007/978-90-481-9618-0_3
Lancel, S. (1999). Le proconsul Anullinus et la grande persécution en Afrique en 303-304 ap. J.-C.: nouveaux documents. Comptes rendus des séances de l’année, Académie des inscriptions belles lettres 143 (3), 1013–1022. doi:10.3406/crai.1999.16058
Lee, J. S., Jurkevich, L., Dewaele, P., Wambacq, P., and Oosterlinck, A. (1994). Speckle filtering of synthetic aperture radar images: a review. Remote Sens. Rev. 8 (4), 313–340. doi:10.1080/02757259409532206
Llasat, M. C., Marcos, R., Llasat Botija, M., Gilabert, J., Turco, M., and Quintana Seguí, P. (2014). Flash flood evolution in North western mediterranean. Atmos. Res. 149, 230–243. doi:10.1016/j.atmosres.2014.05.024
Mammou, A., and Louati, M. (2007). Temporal silting evolution in tunisian reservoirs. Rev. Sci. l’Eau 20 (2), 201–211. doi:10.7202/015813ar
Mangini, W., Viglione, A., Hall, J., Hundecha, Y., Ceola, S., Montanari, A., et al. (2018). Detection of trends in magnitude and frequency of flood peaks across Europe. Hydrol. Sci. J. 63, 493–512. doi:10.1080/02626667.2018.1444766
Mediero, L., Santillán, D., Garrote, L., and Granados, A. (2014). Detection and attribution of trends in magnitude, frequency and timing of floods in Spain. J. Hydrology 517, 1072–1088. doi:10.1016/j.jhydrol.2014.06.040
Miossec, A. (1975). Les pluies exceptionnelles de mars 1973 en Tunisie. Bull. l'Association Géogr. Français 52 (427), 279–288. doi:10.3406/bagf.1975.4858
Mouri, H. (2018). L’État a l’épreuve de l’incertitude de l’eau: medjerda, une population riveraine face au risque d’inondation. Rev. Ibla-Tunis- 2/2018 n°222, 75–101.
Norbiato, D., Borga, M., Esposti, S. D., Gaume, E., and Anquetin, S. (2008). Flash flood warning based on rainfall thresholds and soil moisture conditions: an assessment for gauged and ungauged basins. J. Hydrol. 362, 274–290. doi:10.1016/j.jhydrol.2008.08.023
Oueslati, A., Charfi, F., and Baccar, F. (2006). “La basse vallée d’oued Medjerda et la lagune de Ghar El Melh, Wadi Project, Water Demand Integration,” in Fifth international meeting, INCO-CT-2005-015226 (Tunis: Presentation of the Tunisian site), 6–9.
Paskoff, R. (1978). L’évolution de l’embouchure de la Medjerda (Tunisie). Photo Interprétation 1–23.
Paskoff, R. (1994). Le delta de la Medjerda (Tunisie) depuis l’Antiquité. Études rural. 133 (1), 15–29. doi:10.3406/rural.1994.3451
Paskoff, R., and Trousset, P. (1992). L’ancienne baie d’Utique: du temoignage des textes a celui des images satellitaires. Mappemonde 92 (1), 30–34. doi:10.3406/mappe.1992.1004
Penna, D., Tromp-van Meerveld, H. J., Gobbi, A., Borga, M., and Dalla Fontana, G. (2011). The influence of soil moisture on threshold runoff generation processes in an alpine headwater catchment. Hydrol. Earth Syst. Sci. 15, 689–702. doi:10.5194/hess-15-689-2011
Pfahl, S., O'Gorman, P. A., and Fischer, E. M. (2017). Under-standing the regional pattern of projected future changesin extreme precipitation. Nat. Clim. Change 7, 423–427. doi:10.1038/nclimate3287
Pimienta, J. (1959). Le cycle Pliocène actuel dans les bassins paraliques de Tunis. Paris: Société géologique de France.
Piras, M., Mascaro, G., Deidda, R., and Vivoni, E. R. (2014). Quantification of hydrologic impacts of climate change in a Mediterranean basin in Sardinia, Italy, through highresolution simulations. Hydrol. Earth Syst. Sci. 18, 5201–5217. doi:10.5194/hess-18-5201-2014
Pleuger, E., Goiran, J., Mazzini, I., Delile, H., Abichou, A., Gadhoum, A., et al. (2019). Palaeogeographical and palaeoenvironmental reconstruction of the Medjerda delta (Tunisia) during the Holocene. Quat. Sci. Rev. 220, 263–278. doi:10.1016/j.quascirev.2019.07.017
Polade, S. D., Gershunov, A., Cayan, D. R., Dettinger, M. D., and Pierce, D. W. (2017). Precipitation in a warming world: assessing projected hydro-climate changes in California and other Mediterranean climate regions. Sci. Rep. 7, 10783. doi:10.1038/s41598-017-11285-y
Quesada-Román, A. (2022). Disaster risk assessment of informal settlements in the global south. Sustainability 14 (16), 10261. doi:10.3390/su141610261
Raff, D. A., Pruitt, T., and Brekke, L. D. (2009). A framework for assessing flood frequency based on climate projection information. Hydrol. Earth Syst. Sci. 13, 2119–2136. doi:10.5194/hess-13-2119-2009
Raspini, F., Bardi, F., Bianchini, S., Ciampalini, A., Del Ventisette, C., Farina, P., et al. (2017). The contribution of satellite SAR derived displacement measurements in landslide risk management practices. Nat. Hazards 86 (1), 327–351. doi:10.1007/s11069-016-2691-4
Raynaud, D., Thielen, J., Salamon, P., Burek, P., Anquetin, S., and Alfieri, L. (2015). A dynamic runoff co-efficient to improve flash flood early warning in Europe: evaluation on the 2013 central European floods in Germany: dynamic runoff co-efficient for flash flood early warning in Europe. Meteorol. Appl. 22, 410–418. doi:10.1002/met.1469
Ribes, A., Soulivanh, T., Vautard, R., Dubuisson, B., Somot, S., Colin, J., et al. (2019). Observed increase in extreme daily rainfall in the French Mediterranean. Dynam 52, 1095–1114. doi:10.1007/s00382-018-4179-2
Samaali, H., Jaziri, B., and Mjejra, M. (2019). L’apport des indices SPI et NDVI pour l’evaluation des conditions du risque de secheresse aux alentours du Barrage Sejnane (Tunisie Septentrionale). Analale Universitatii Bucuresti. Seria Geografie. Available at: https://www.researchgate.net/publication/335821897.
Samaali, H., Naceur, O. M., and Rabia, M. C. (2010). Evolution de l'occupation-utilisation du sol en contexte agricole intensif: essai de simulation de la couverture hivernale des sols dans le perimetre irrigue de kalaat landalous (nord-est tunisie). XIIème Journées Sci. Du. Réseau Télédétection 2010. Mounastir, Tunisie. halshs-00612954v3.
Tan, S., Kwan, A., Rodríguez-Barraquer, I., Singer, B., Park, H., Lewnard, J., et al. (2023). Infectiousness of SARS-CoV-2 breakthrough infections and reinfections during the Omicron wave. Nat. Med. 29 (2), 358–365. doi:10.1038/s41591-022-02138-x
Townsend, P. A., and Foster, J. R. (2002). A synthetic aperture radar based model to assess historical changes in lowland floodplain hydroperiod. Water Resour. Res. 38 (7), 20. doi:10.1029/2001wr001046
Tramblay, Y., Bouvier, C., Martin, C., Didon-Lescot, J. F., Todorovik, D., and Domergue, J. M. (2010). Assessment of initial soil moisture conditions for event-based rainfall-runoff modelling. J. Hydrol. 387, 176–187. doi:10.1016/j.jhydrol.2010.04.006
Tramblay, Y., Mimeau, L., Neppel, L., Vinet, F., and Sauquet, E. (2019). Detection and attribution of flood trends in Mediterranean basins. Earth Syst. Sci. 23, 4419–4431. doi:10.5194/hess-23-4419-2019
Tramblay, Y., and Somot, S. (2018). Future evolution of extreme precipitation in the Mediterranean. Clim. Change 151, 289–302. doi:10.1007/s10584-018-2300-5
Uber, M., Vandervaere, J.-P., Zin, I., Braud, I., Heistermann, M., Legoût, C., et al. (2018). How does initial soil moisture influence the hydrological response? A case study from southern France. Hydrol. Earth Syst. Sci. 22, 6127–6146. doi:10.5194/hess-22-6127-2018
Uddin, S., Khan, A., Hossain, M., and Moni, M. (2019). Comparing different supervised machine learning algorithms for disease prediction. BMC Med. Inf. Decis. Mak. 19 (1), 281. doi:10.1186/s12911-019-1004-8
Vezzoli, R., and Mercogliano, P. (2013). Impacts of land cover and climate changes on peak floods probability distribution function. CMCC Res. Pap., 1–18. doi:10.2139/ssrn.2490906
Viglione, A., Merz, R., and Blöschl, G. (2009). On the role of the runoff coefficient in the mapping of rainfall to flood return periods. Hydrol. Earth Syst. Sci. 13, 577–593. doi:10.5194/hess-13-577-2009
Wasko, C., and Nathan, R. (2019). Influence of changes in rainfall and soil moisture on trends in flooding. J. Hydrol. 575, 432–441. doi:10.1016/j.jhydrol.2019.05.054
Wasko, C., Parinussa, R. M., and Sharma, A. (2016). A quasi-global assessment of changes in remotely sensed rainfall extremes with temperature. Geophys. Res. Lett. 43, 12659–12668. doi:10.1002/2016gl071354
Wasko, C., and Sharma, A. (2017). Global assessment of flood and storm extremes with increased temperatures. Sci. Rep. 7, 7945. doi:10.1038/s41598-017-08481-1
Westra, S., Alexander, L. V., and Zwiers, F. W. (2013). Global increasing trends in annual maximum daily precipitation. J. Clim. 26, 3904–3918. doi:10.1175/jcli-d-12-00502.1
Woldemeskel, F., and Sharma, A. (2016). Should flood regimes change in a warming climate? The role of antecedent moisture conditions. Geophys. Res. Lett. 43, 7556–7563. doi:10.1002/2016GL069448
Zahar, Y., Ghorbel, A., and Albergel, J. (2008). Impacts of large dams on downstream flow conditions of rivers: aggradation and reduction of the Medjerda channel capacity downstream of the Sidi Salem dam (Tunisia). J. Hydrology 351 (3–4), 318–330. doi:10.1016/j.jhydrol.2007.12.019
Zhang, M., Chen, F., Liang, D., Tian, B., and Yang, A. (2020). Use of sentinel-1 grd sar images to delineate flood extent in Pakistan. Sustain. Switz. 12 (14), 5784–5819. doi:10.3390/su12145784
Keywords: floods maps, SAR, Sentinel1, Mejerda Valley, Tunisia
Citation: Khemiri L, Katlane R, Khelil M, Gaidi S, Ghanmi M and Zargouni F (2024) Flood mapping of the lower Mejerda Valley (Tunisia) using Sentinel-1 SAR: geological and geomorphological controls on flood hazard. Front. Earth Sci. 11:1332589. doi: 10.3389/feart.2023.1332589
Received: 03 November 2023; Accepted: 18 December 2023;
Published: 08 January 2024.
Edited by:
Zhihua Zhang, Shandong University, ChinaReviewed by:
Adolfo Quesada-Román, University of Costa Rica, Costa RicaAtef Belhaj Ali, Barthauer Software GmbH, Germany
Taoufik Hermassi, National Research Institute for Rural Engineering, Water and Forestry (INRGREF), Tunisia
Noureddine Elmejdoub, Gabes University, Tunisia
Copyright © 2024 Khemiri, Katlane, Khelil, Gaidi, Ghanmi and Zargouni. This is an open-access article distributed under the terms of the Creative Commons Attribution License (CC BY). The use, distribution or reproduction in other forums is permitted, provided the original author(s) and the copyright owner(s) are credited and that the original publication in this journal is cited, in accordance with accepted academic practice. No use, distribution or reproduction is permitted which does not comply with these terms.
*Correspondence: Rim Katlane, rim.katlane@flah.uma.tn