Reservoir landslide monitoring and mechanism analysis based on UAV photogrammetry and sub-pixel offset tracking: a case study of Wulipo landslide
 Zhi-Hai Li1
  Nan Jiang2*
  An-Chi Shi1 Liu-Yuan Zhao1 Zhao Xian2 Xiang-Long Luo3
  Hai-Bo Li2
  Jia-Wen Zhou3
- 1Power China Huadong Engineering Corporation Limited, Hangzhou, China
- 2College of Water Resource and Hydropower, Sichuan University, Chengdu, China
- 3State Key Laboratory of Hydraulics and Mountain River Engineering, Sichuan University, Chengdu, China
Introduction: Reservoir landslides undergo large deformations during the early stages of impoundment and maintain long-term persistent deformations during the operational period of the reservoir. The management of reservoir landslides mostly focuses on the early identification, risk assessment during the large deformations, and long-sequence monitoring during long-term persistent deformations, which requires sufficient continuity and integrity of the landslide monitoring data.
Methods: Taking the Wulipo (WLP) landslide in Baihetan Reservoir as example, this paper proposes a reservoir landslide monitoring method that integrates field survey, unmanned aerial vehicle (UAV) photogrammetry and global navigation satellite system (GNSS) monitoring, which can effectively eliminate the practical monitoring gaps between multiple monitoring methods and improve the continuity and completeness of monitoring data.
Results and discussion: First, this study determined the initiation time of the landslide through the field investigation and collected five period of UAV data to analyze the overall displacement vector of the WLP landslide using sub-pixel offset tracking (SPOT). On the basis of the above data, we compensated for the missing data in GNSS system due to the practical monitoring vacancies by combining the field survey and the landslide-water level relationship. Based on these monitoring data, this paper points out that the WLP landslide is a buoyancy-driven landslide, and whether or not accelerated deformation will occur is related to the maximum reservoir water level. Finally, this study analyzed and discussed the applicability of UAV photogrammetry for reservoir landslide monitoring in the absence of ground control points (GCPs), and concluded that this method can be quickly and flexibly applied to the stage of large deformation of reservoir landslides.
1 Introduction
The construction of hydropower stations is now one of the most efficient approaches to obtain water resources and clean energy (Tang et al., 2019; Cao et al., 2021). However, secondary geological hazards caused by the construction of hydropower station, such as reservoir landslides, can pose serious impacts on civil and transportation facilities (Manenti et al., 2018; Wang et al., 2019; Reyes-Carmona et al., 2020; Jiang et al., 2021a; Alonso et al., 2021). For example, in Southwest China, around 2619 landslides have been activated by the fluctuation of reservoir water level in Three Gorges Reservoir since June 2003 (Cao et al., 2021). Among the landslide disasters mentioned above, the typical one is the Qianjiangping landslide which led to 30 m impulse wave, caused 24 casualties, destroyed 346 houses and capsized many ships (Tang et al., 2019). There are also numerous early studies in Europe reporting landslide hazards caused by reservoir impoundment. For example, a disastrous reservoir landslide occurred on 9th October 1963 and caused the loss of 1910 lives in the Vajont dam site (Mantovani and Vita-Finzi, 2003). The Groapa Vântului landslide, located in the Buzău Carpathians, on the right-hand slope of the Siriu Reservoir, occurred in April 2006, which blocked the Reservoir for several weeks and caused a major change in the sedimentation regime downstream (Micu and Bălteanu, 2013). According to the statistical data, since 1980s, the overall losses reach to 1046 billion dollars worldwide for hydrological events, especially the reservoir landslides (Bovenga et al., 2017; Koca and Koca, 2019; Thiery et al., 2020; Alonso et al., 2021; Niacsu et al., 2021).
For reservoir landslides caused by reservoir impoundment, one of the most important ways to prevent and mitigate them is to obtain their initiation and movement processes through certain monitoring means, and elaborate their deformation, damage mechanisms and potential destabilization possibilities, so as to provide basis for the management and administration of landslide hazards (Tang et al., 2019; Cao et al., 2021; Wang et al., 2023a; Wang et al., 2023b; Wei et al., 2023). Up to date, a large number of researchers have studied the initiation and movement process of reservoir landslides (Gutiérrez et al., 2015; Kaczmarek et al., 2015; Gu et al., 2017; Wang et al., 2021; Chen et al., 2022; Wu et al., 2022), and the results show that the deformation characteristics of reservoir landslides can be mainly divided into four stages: the stabilization period before impoundment, the large deformation and destabilization at the time of the first impoundment, the cyclic deformation caused by the rise and fall of the water level during the operation of the reservoir, and the overall destabilization and destruction of the landslides.
A large number of reservoir landslides remain stable after Stage I, while some remain stable in Stage III or eventually enter Stage IV for long periods of time (Seguí et al., 2020), the most typical case of which includes the Vajont landslide in Italy (Dykes and Bromhead, 2018; Dykes and Bromhead, 2022). Currently, landslides in Stage II and Stage III are a major concern for reservoir disaster management, because these continuously deforming landslides can directly or indirectly affect residential settlements or transportation facilities, causing sustained or cyclical impacts to homes, roads, or bridges. In addition, preventing landslides from entering Stage IV is another concern, because if a landslide is large enough, the surge caused by its destabilization can cause damage to the riparian zone or the dam. Therefore, it is necessary to monitor the deformation process of landslides in these two stages, and to determine the possibility of overall destabilization and the potential risk through the monitoring data. Especially for the reservoir landslides in Stage II, it is important to clarify whether they will enter Stage III in order to appropriately design and program the subsequent monitoring and risk management measures.
At present, commonly used methods for landslide monitoring in reservoir areas include contact monitoring such as Global Navigation Satellite System (GNSS) and inclinometers (Chen et al., 2017; Liang et al., 2021), and remote sensing techniques such as satellite imagery (Chen et al., 2015), interferometric synthetic aperture radar (InSAR) (Zhao et al., 2018; Zhou et al., 2020; Ghorbanzadeh et al., 2022), unmanned aerial vehicle (UAV) photogrammetry (Xu et al., 2018; Li et al., 2019a; Xiao et al., 2023), and light detection and ranging (LiDAR) (Li et al., 2019b; Jiang et al., 2020a; Booth et al., 2020; Zhou et al., 2023). Each of these methods has its own advantages and disadvantages. For GNSS and inclinometers, although they can only monitor the slope displacement in the vicinity of the instrument, their automatic monitoring frequency can be up to several tens of seconds or even several minutes, so they have a better applicability for the landslides in Stage III, which is currently the most popular methods around the world (Notti et al., 2020; Šegina et al., 2020). However, for landslides in Stage II, their deformation and damage process have obvious temporal and spatial variation, and the local deformation and overall deformation of slopes usually have significant differences. In this case, remote sensing techniques such as UAV photogrammetry or LiDAR have remarkable advantages due to their ability to capture the overall or 3-D deformation of slopes (Jiang et al., 2022). However, there is an implicit premise in the practical application of the above remote sensing techniques, that is, the existence of landslides must be known in advance. In other words, the location, boundary and other information of landslides in the study area needs to be determined in advance, because these information are essential for the practical implement, such as the distribution and spacing of TLS scanning positions, as well as the routes and flight plans of UAVs. Another noteworthy issue is that due to financial and labor constraints, it is difficult to completely locate all potential reservoir landslides throughout the reservoir merely based on the mentioned remote sensing techniques. As a result, a large number of reservoir landslides were already in the late Stage II or entered Stage III when they were discovered or available for monitoring, leading to a large amount of missing data in Stage II (Xia et al., 2013; Jiang et al., 2021b), which is very unfavorable to the study of landslide mechanism and subsequent risk management.
Since reservoir landslides seem to be an inevitable consequence of reservoir impoundment, the complete landslide deformation data are essential for efficient management of reservoir landslides. This requires that practical monitoring vacancies should not be too long when multiple monitoring methods or equipment are used. To address this problem, this paper proposes a method that can effectively monitor the deformation characteristics of reservoir landslides from Stage I to Stage III, which integrates the methods of field investigation, UAV photogrammetry, GNSS and inclinometer. The proposed method can accurately identify the different deformation characteristics of reservoir landslides and clearly reflect the transformation process between different stages, which has good adaptability to landslides in the reservoir area. The advantage of this method is that, it can accurately determine whether a reservoir landslide will move from Stage II to Stage III and provide a basis for the layout of landslide monitoring in Stage III. Taking the Wulipo (WLP) landslide of Baihetan Reservoir as an example, this paper compensates the practical monitoring gap between the field investigation, UAV photogrammetry and GNSS monitoring, and accurately identifies the transformation process of the landslide from Stage I to Stage II and Stage III after reservoir impoundment. Based on the deformation characteristics, this paper reveals the destabilization mechanism and subsequent potential risks of the WLP landslide in combination with the changes in reservoir water level. The contribution of this paper is that we provide a feasible method for obtaining continuous and complete reservoir landslide monitoring data, and it helps to delineate the boundaries, analyze the movements, and assess the potential risks of reservoir landslides throughout their life cycle. We believe that the content of this paper will support the subsequent mitigation and management of the WLP landslides, and provide new ideas and solutions for the monitoring and risk prevention of reservoir landslides around the world.
2 Materials and methods
2.1 Study area
The study area is located about 1000 m upstream of Menggu Township, Qiaojia County, Zhaotong City, China (26˚36ʹ31ʺ N, 103˚01ʹ 50ʺ E) (Figure 1).
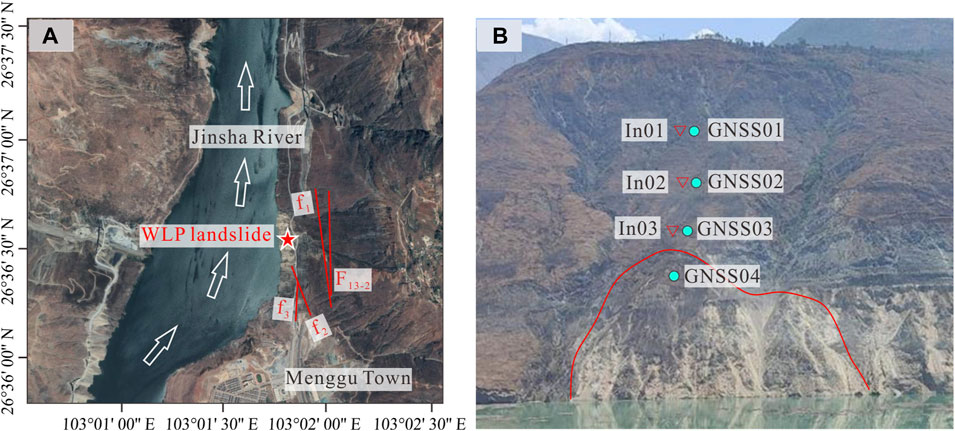
FIGURE 1. Overall of the study area: (A) Geographic location of the study area and (B) arrangement of GNSS system and inclinometers, of which only GNSS04 is arranged within the landslide area.
The valley in this area is relatively open and has an asymmetrical “U" shape. The WLP landslide is located in the middle of the right bank of the Jinsha River, with a distribution elevation of 670 m–920 m. The part of the area with the elevation ranging from 670 m to 850 m has a steeper topography, with a slope of about 39°–43°, while the upper part with the elevation ranging from 850 m to 920 m has a relatively gentler slope, with a slope of about 34°–38°. The stratigraphic lithology of the reservoir bank slope in the study area is complex, and the bedrock mainly consists of Cambrian Upper Series Erdao Shui Formation (∈3e), Ordovician Lower Series Hongshiyi Formation (O1h), Mesozoic Qiaojia Formation (O2q), Mesozoic Daiyi Formation (O2d), and Silurian Mesozoic Shimenkan Formation (S2s), and the Upper Series (S3); and the overlaying layer mainly consists of Cenozoic Series Quaternary avalanche deposits (Qcol+dl), and floodplain deposits (Qapl). According to the results of on-site drilling, the occurrence of rock layers in the study area are N10°∼20°W, NE∠35∼47°, with 4 major faults developed, and their strike is mainly in the N-W direction. Most of the exposed rocks are strongly weathered, with the lower limit of strong weathering at a depth of 25 m–27 m, and the thickness of strongly weathered rock body is 0 m–4 m.
2.2 General description of the landslide
The normal impoundment level of Baihetan reservoir is 825 m. Based on the results of the field investigation, the WLP landslide started to activate when the water level rose to 731.76 m on 2021/04/30 (Figure 2A). The landslide showed a predominantly slow downward staggered deformation pattern, with its trailing edge staggered downward by about 3 m–5 m after the reservoir reached its normal impoundment level (Figure 2B).
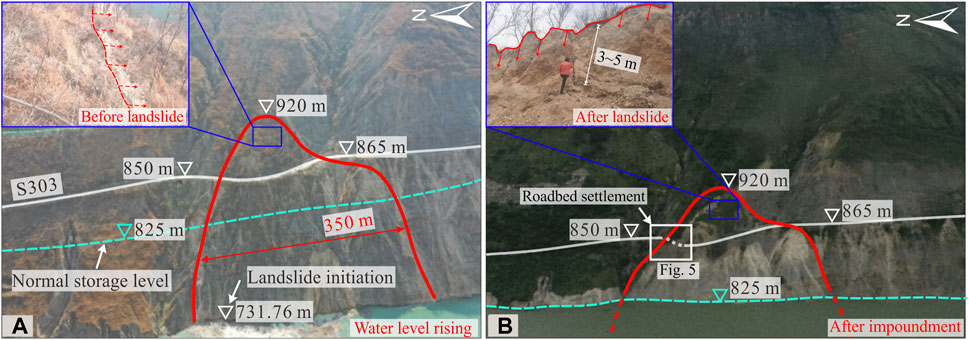
FIGURE 2. Landslide deformation characteristics and water level changes: (A) UAV aerial imagery at the time of landslide initiation (2021/04/30), corresponding to a water level of 731.67 m and (B) UAV aerial imagery of the reservoir when it is impounded to normal water level, corresponding to a water level of 825 m, at which point the landslide has experienced a displacement of more than 5 m
The surface deformation characteristics of the landslide body are distinguished by the provincial highway S303 in the middle of the slope. The upper portion is mainly in the form of a step settlement and has formed more than 10 staggered joints on the slope surface with a length of about 5 m–20 m and a downward staggered height of about 1 m–3 m, and there are localized areas of collapse and sliding on the slope surface. About 17 tension cracks appeared on the surface of the S303 highway, with crack lengths of about 4 m–10 m and widths of 10 cm–30 cm. The deformation characteristics of the portion below the S303 are dominated by avalanches and collapse, and most of the original overburden of this area has slipped into the reservoir (Figure 3).
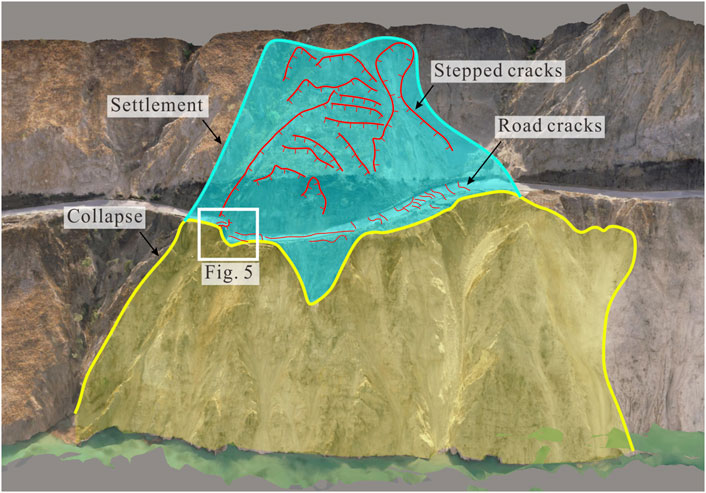
FIGURE 3. UAV 3D model when water is stored to 761 m, the upper part of the landslide body has a lot of cracks, and the lower cover layer has almost completely slipped into the reservoir area.
The location of the most intense deformation of the WLP landslide was located on the north side of the S303 highway, and this area was found to have a 1 cm–2 cm tension crack on 2021.04.30, which was the first to be identified during the on-site investigation (Figure 4A). This crack then developed to about 10 cm wide on the following day (Figure 4B) and showed significant settlement two days later (Figure 4C), culminating in the formation of a step with a height difference of about 5 m (Figure 4D) on 2021/05/12.
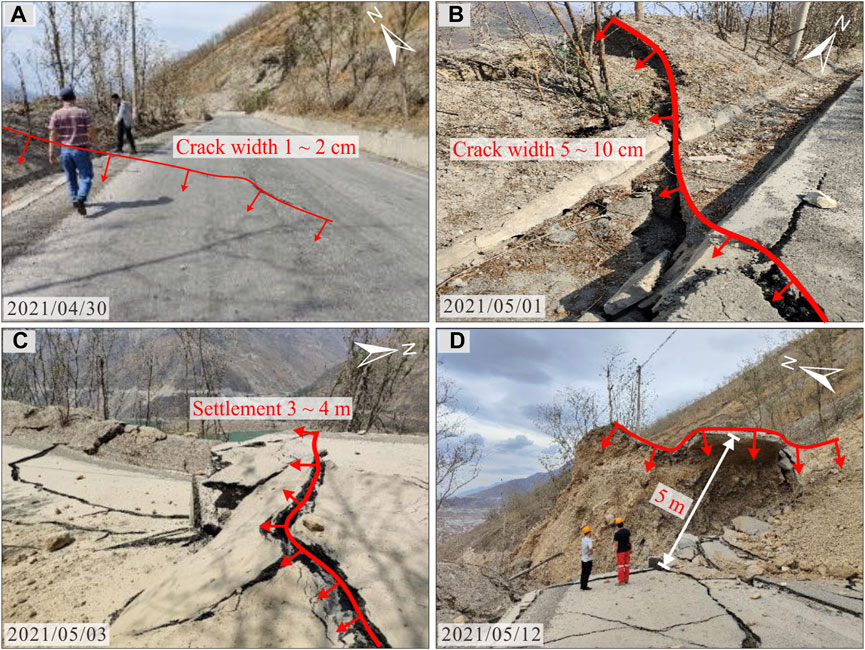
FIGURE 4. Area of most intense deformation of the WLP landslide: (A) the earliest crack found by on-site investigation in 2021/04/30, with a width of 1∼2 cm; (B) the crack developed to 5∼10 cm on 2021/05/01; (C) significant settlement in cracked area on 2021/05/03 and (D) the cracked area shows a downward deformation toward the outside of the slope.
2.3 Data acquisition
In this paper, on-site investigation, UAV photogrammetry, GNSS system and inclinometer were used to analyze and assess the deformation process and potential risk of WPL landslide. Since the first impoundment of Baihetan Reservoir will trigger a large number of landslides of different scales throughout the whole reservoir area, we have developed a series of landslide hazard management patterns based on the actual ability to expend funds and human resources. In the first stage, we mainly focus on on-site investigation to continuously record all potential landslides, and initially judge their stability and potential risks based on manual experience. Then we decide whether to use UAV photogrammetry or other monitoring method to conduct a larger or longer detailed investigation based on the scale and deformation rate of the landslides, and formulate a corresponding follow-up monitoring program, such as using contact monitoring methods such as GNSS and inclinometer for long-term observation. Considering the development of the monitoring program for landslides and the procurement of equipment, installation, data access, etc., the implementation of the various methods mentioned above will exist at certain time intervals. Figure 5 shows the main landslide events and the implementation time nodes of each monitoring method in this paper.
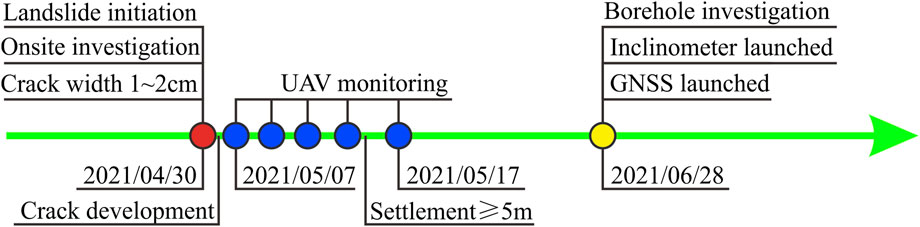
FIGURE 5. Time notes of landslide development and the implementation monitoring methods.
UAV photogrammetry was performed using a Feima D2000 quadcopter drone and a Snoy-DOP-3000 camera, with the routes planned as shown in Figure 6. We collected the UAV aerial images on each of 2021/05/07, 2021/05/09, 2021/05/11, 2021/05/13, and 2021/05/17, respectively. The UAV photogrammetry adopts a ground simulation flight mode, which is able to maintain a fixed flight heigh of about 200 m relative to the ground. The images have a heading overlap and lateral overlap of 80% and 70%, respectively, and a ground sampling distance (GSD) of about 3 cm/pix The UAV is equipped with an RTK system for real-time accurate georeferencing of the images, and we used a static RTK as ground base station to provide signals for the UAV-based RTK (Ekaso et al., 2020).
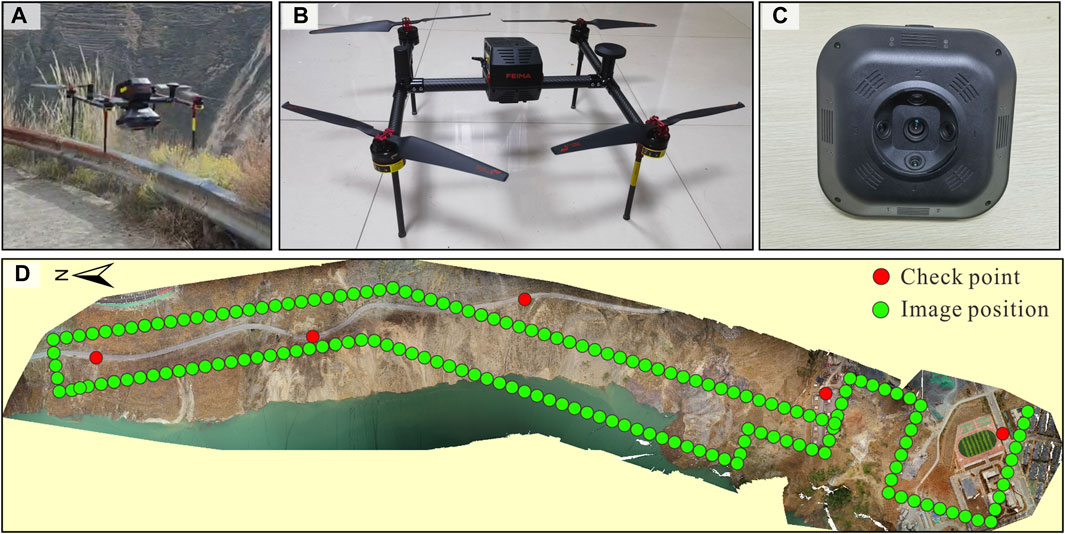
FIGURE 6. UAV equipment and flight routes setting: (A) photographs of UAV working on site; (B) Feima D2000 UAV; (C) Sony-DOP 3000 camera and (D) Flight route setting and checkpoint placement.
The UAV models and orthophotos were generated by Pix4D Software. As for data validation, we arranged five checkpoints along the S303 highway, obtained their coordinates by RTK, and compared them with the UAV model to verify the accuracy of the geographic coordinates of the UAV model and orthophotos. The results show that the mean absolute errors for all checkpoints in the five periods of UAV data is about ±5 cm (i.e., ±1 pixel), indicating that the accuracy of the UAV model is sufficient for the deformation analysis.
The activation of the GNSS and inclinometers is about 2 months later (on 2021/06/28) than the drone monitoring due to the time required for the procurement, installation and commissioning of the equipment. A total of four GNSS (GNSS01 to GNSS04) and three inclinometers (In01 to In03) were installed in this study. GNSS01 to GNSS03 and In01 to In03 were installed outside of the identified landslide boundaries and were mainly used for preventing the further development of landslides leading to an increase in size or depth. Considering the feasibility of equipment installation and the safety of equipment operation, we installed GNSS04 in the upper part of the landslide that did not experience extensive failure or sliding, and the surface of this area was very broken, which made it impossible to install the inclinometer (Figure 1B). The data acquisition interval for GNSS and inclinometers is 1 min. The horizontal and vertical systematic errors of GNSS are about ±2.5 mm and ±5 mm, respectively, and the systematic error of inclinometers is about ±4 mm/30 m along the depth direction. As of March 2022, GNSS04 has experienced a three-dimensional displacement of about 1,400 mm while all other GNSS and inclinometer monitoring data have varied by less than ±5 mm (Table 1), so that it can be assumed that the rest of the area, with the exception of the identified landslide area, has remained in a stable status.
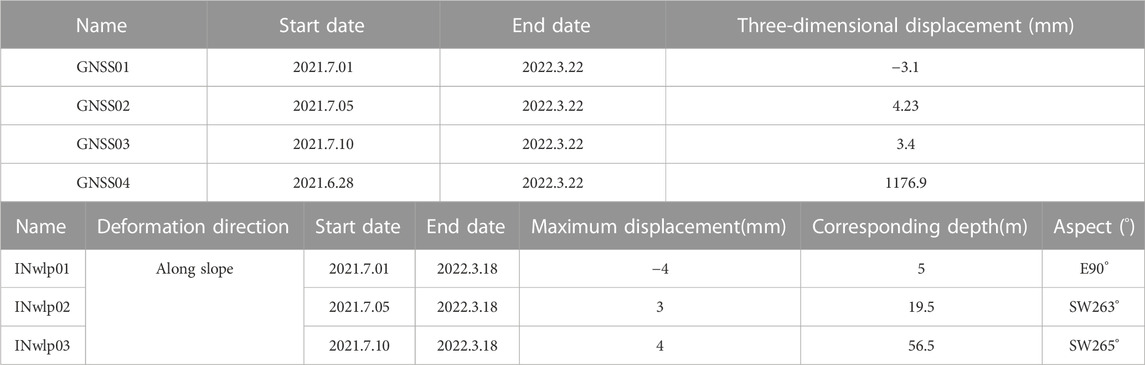
TABLE 1. Overview of GNSS and inclinometers monitoring results.
2.4 Landslide displacement vector calculation
The landslide displacement vector calculation is implemented based on the sub-pixel offset tracking (SPOT) algorithm. The SPOT is an advanced remote sensing image processing technique that is mainly used to detect small changes between images, and is able to detect sub-pixel displacements in remotely sensed imagery, which makes it particularly valuable in landslide monitoring as it provides a high-resolution, accurate assessment of landslide movement over time (Singleton et al., 2014; Sun, 2017). Surface displacement monitoring using the sub-pixel offset tracking (SPOT) method combined with UAV photogrammetry has been wildly used around the world and has become an important tool for landslide hazard monitoring (Raucoules and De Michele, 2012; Turner et al., 2015). The principle of SPOT is to detect small movements of the ground surface based on changes in image brightness or reflectance. By comparing consecutive images, SPOT can recognize these small changes and convert them into displacement vectors (Giles et al., 2009). The core of the method is to set a search window on the slave image (post-event image) and a search range larger than this search window on the master image (pre-event image), and then use normalized cross correlation (NCC) to match the slave image and the master image and calculate a correlation coefficient surface, with the peak position of the surface and the vector connecting the center of the search window of the master image to represent the displacement of the ground surface, and then finally through the interpolation to achieve the output of the displacement field of the entire images (Xiao et al., 2023).
In this study, we performed a time-series analysis of the G-band of five UAV orthophotos using COSI-CORR to calculate the horizontal displacement of the WLP landslide, with an image resolution of 5 cm/pix, a search window of 300 × 300 pixels, a step size of 10 pixels, a search range of 100 pixels, an effective identification range of displacement from 0 m to 5 m (Figure 7).
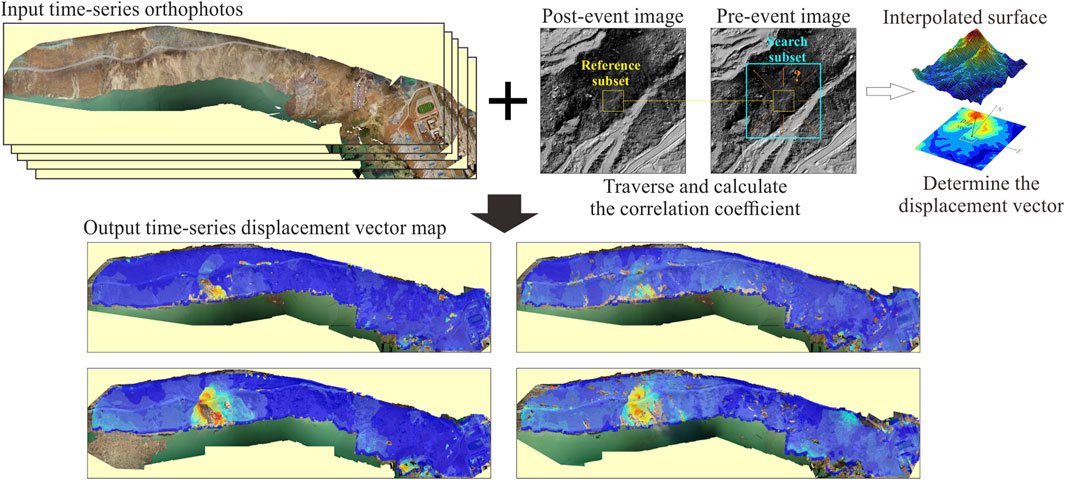
FIGURE 7. Workflow of the proposed method.
It is worth noting that there are some errors called “salt-and-pepper noise” in the SPOT results, which are non-correlation areas caused by large changes in surface features or incorrect search parameter settings between the master image and the slave image. The main reasons for this kind of error include the following three situations: (1) significant changes in the ground surface between the slave and master images, such as changes in ground cover, snow accumulation, vegetation growth, etc.; (2) the search range in the SPOT is smaller than the actual displacement and (3) there are obvious image quality changes in the images, such as changes in the direction of the sun light leading to corresponding changes in the direction of the shade of the trees or the shadows of the mountains. Figure 8 shows the typical errors caused by ground cover change (from soil to water), shading changes, and vegetation growth. For landslide deformation analyses, SPOT may result in non-correlated zones due to significant changes in the overburden, such as soil failures or accumulation, and although displacement vectors cannot be computed for these zones, it is still possible to identify the boundaries of these areas.
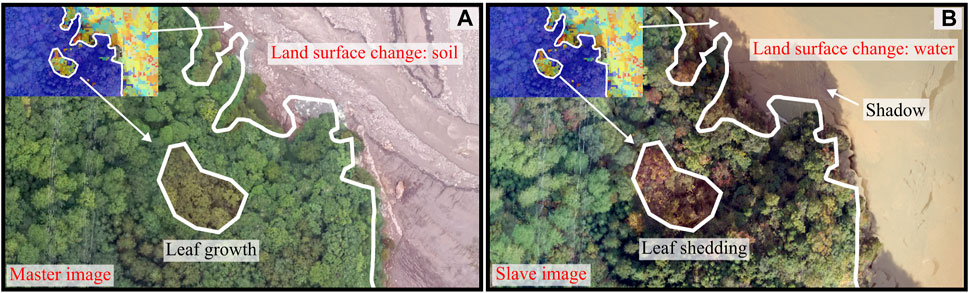
FIGURE 8. Mechanisms of salt-and-pepper noise: (A) the reservoir area is not filled with water and the leaves on the slopes are not yellowing and (B) the reservoir area is complete with water impoundment and has yellowed leaves on the slopes, with leaf shadows on the portion near the water.
3 Results
3.1 UAV monitoring based on SPOT
In this paper, the orthophoto images acquired by UAV on 2021/05/07, 2021/05/09, 2021/05/11, 2021/05/13, 2021/05/17 were analyzed on a time-by-time basis for SPOT analysis, and the horizontal displacement vectors between the time-series images are illustrated in Figure 9. The color of the figure fades from blue to red, and the color shade change represents the horizontal displacement of the ground surface obtained by SPOT, blue represents small displacement, red represents large displacement, and the direction of the white arrow indicates the displacement trend. The landslide boundary and the maximum deformation zone can be clearly seen from the figure, in which the maximum deformation zone is mainly near the middle and north side of the landslide, and the maximum horizontal displacement of a single analysis is about 0.8 m–2 m, and the cumulative displacement is about 5 m, which is consistent with the conclusions of the on-site investigation.
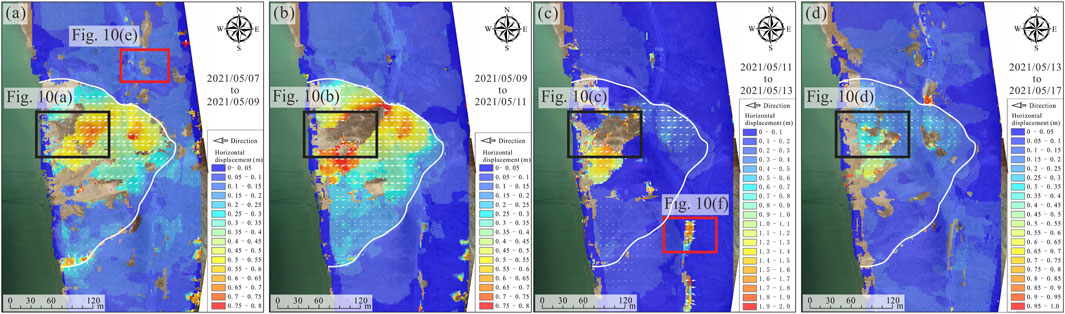
FIGURE 9. Results of SPOT-based UAV landslide deformation monitoring analysis: (A) from 2021/05/07 to 2021/05/09; (B) from 2021/05/09 to 2021/05/11; (C) from 2021/05/11 to 2021/05/13 and (D) from 2021/05/13 to 2021/05/17.
In order to eliminate errors, we excluded data with signal-to-noise ratios (SNR) lower than 0.6 during data processing (data larger than this value are considered reliable), so there are some blank areas in the figure, especially in the lower part of the large deformation area, which indicates that there is a large discrepancy between the master image and the slave image in these areas, leading to the SPOT’s master image and the slave image to form a non-correlation zone in the formation of non-correlated zones during the calculation process. For these non-correlated zones, we show the difference of orthophoto before and after deformation in Figure 10, and find that the main factors in which the non-correlated zones are generated include two main factors: changes in surface features (Figures 10A–D) and changes in shadows due to change in the sun light direction (Figures 10E, F). The former occurs mainly within landslide area and is mostly caused by sliding, avalanches, or soil accumulation of the ground cover, while the latter is mostly located in steep slopes and vegetation-covered areas outside the landslide area, where the shadows of trees or rocks in the images are extended along a certain direction due to different solar altitude angles and directions. In addition, another noteworthy issue is that most of the displacement vectors outside our manually delineated landslide zones are between 0 m–0.1 m. We verified these displacement vectors by manually comparing surface features (e.g., rocks, leaves, roads, etc.) and found that most of these displacement vectors were due to quality differences in the construction of orthophotos, and that in fact no displacements were occurring in these areas. Overall, SPOT-based landslide deformation analyses do offer researchers a preliminary landslide zoning or movement status, but further manual-based landslide analyses are still necessary.
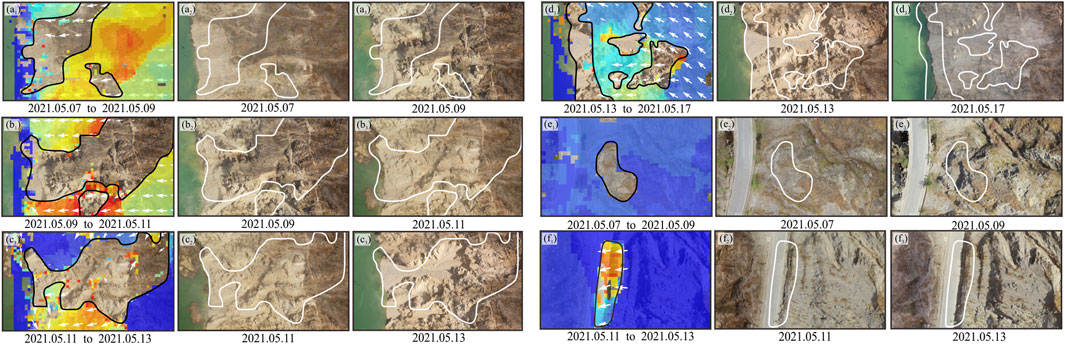
FIGURE 10. Detailed comparison of uncorrelated zones in SPOT: (A–D) significant changes in the ground cover, such as soil failure and accumulation; (E, F) changes in hill shadows due to variations in solar altitude angle and direction.
In terms of landslide displacement, the deformation process of the WLP starts with an overall large-scale rapid deformation with an average maximum displacement of more than 400 mm per day, then transitions to a localized small-scale rapid deformation with an average maximum displacement of more than 1,000 mm per day, and finally enters into an overall relatively slow deformation with an average maximum displacement of about 250 mm per day. Up to the last phase of UAV monitoring data, although the deformation of the WPL landslide has significantly reduced, its deformation rate is still relatively high, especially in the portion near the north side of the landslide. In addition, the question of whether the extent and scale of the landslide will further expand with increase in reservoir water level is not known. Therefore, we believe that the WLP still has a new possibility of overall destabilization and needs to be continuously monitored by automated means.
Overall, based on UAV and SPOT, it is indeed effective in identifying the boundary, deformation zone and sliding displacement vector of a landslide. For uncorrelated zones, although the method cannot accurately calculate the displacement vectors of the collapse, decomposition, or accumulation process of the ground cover, the location and boundary can still be identified based on the uncorrelated zones, and the damage pattern of these zones can be determined by comparing the orthophotos.
3.2 Monitoring data fusion and estimation
In this study, we used UAV photogrammetry to obtain the early three-dimensional overall deformation of the WLP landslide, and concluded that there is a risk of continued deformation and occurrence of overall instability of the landslide, so we developed a special contact monitoring program, including GNSS and inclinometer, and continued to monitor its subsequent deformation. Of all the devices, we found that only the area where GNSS04 is located continues to deform, and based on its monitoring data, we found that the deformation process of the WLP landslide correlates extremely well with changes in the reservoir water level (Figure 11). In this case, the landslide shows a significant accelerated deformation until the first water level peak (lower than normal impoundment level). Until the water level reaches its second peak (normal impoundment level), the landslide is always in a state of slow creep. At the second peak water level, the curve shows a clear step of accelerated deformation, but then shows slow creep.
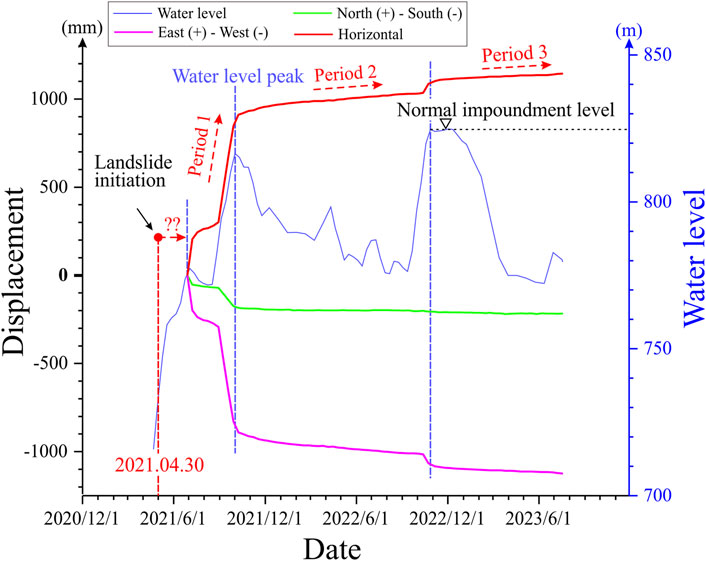
FIGURE 11. Cumulative deformation curves of GNSS04 along East-West, South-North and horizontal combined displacements.
Based on the event node diagram in Figure 5, it can be seen that there are two time intervals between the discovery of the initiation of WLP landslide, the implementation and suspension of UAV photogrammetry, and the implementation of the contact monitoring system. Among them, from the beginning of the discovery of the landslide to the implementation of the UAV photogrammetry, although there is only an interval of about one week, the landslide deformation in this week is very large and the deformation characteristics are very obvious, which is of the most important significance for analyzing the landslide deformation mechanism and assessing the risk of destabilization. However, there are no monitoring results that can effectively respond to the landslide deformation process at this stage. Similarly, there was an interval of about 40 days between the up to date of the UAV photogrammetry and the on-line of the contact monitoring equipment, and landslide deformation data for this period of time were missed.
To address the lack of data in these two periods, we attempted to supplement them using a combination of UAV data and GNSS data, and considering the true deformation characteristics of the landslide. First, we extracted the horizontal displacement of the area where GNSS04 is located as part of the early deformation data of the landslide from Figure 9 and replotted the deformation rate corresponding to this displacement with the measured horizontal deformation rate of GNSS04, as shown in Figure 12A. For the first missing data (2021/04/30 to 2021/05/07), since the deformation rate at the time of landslide initiation (2021/04/30) can be considered to be 0 and the water level continued to rise during this time, and it can be observed that the deformation rate in the UAV monitoring results only started to decrease since 2021/05/11, it can be assumed that the landslide deformation has been kept accelerating until this moment. Therefore, we directly connect the two time points of 2021/04/30 and 2021/05/07, and consider that this line can represent the landslide deformation rate during this time. Similarly, for the second missing data (2021/05/17 to 2021/06/28), the reservoir water level did not drop significantly during this period, and the corresponding rate of 2021/06/28 is basically close to 0. Therefore, it can be hypothesized that the landslides maintained a decelerating deformation trend during this period, and therefore we still use the line connecting 2021/05/17 and 2021/06/28 as the deformation rate curve for this period. According to the properties of the rate-time curve, the area enclosed by the curve and the x-axis is the landslide displacement (Figure 12B).
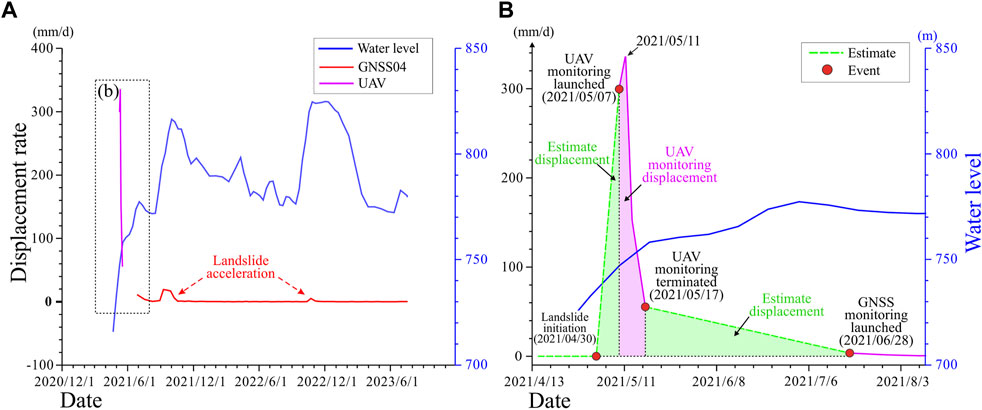
FIGURE 12. The phenomenon of missing data due to monitoring intervals and ways to compensate for it: (A) Raw deformation rate maps integrating UAV and GNSS and (B) supplementation of missing data based on water level changes and landslide deformation characteristics.
3.3 Correlation between landslide deformation and water level change
According to Zhou et al. (2020), the deformation mechanisms of reservoir landslides in Stage III can be mainly categorized into seepage-driven landslides and buoyancy-driven landslides.
The deformation of seepage-driven landslides is usually considered to be caused by hydrodynamic pressure effects (or seepage forces). In the process of reservoir water level decline, if the decline rate of the reservoir water level is significantly greater than the groundwater level within the slope, the drop between the two will increase, which will cause the hydrodynamic pressure in the landslide body to continue to increase, and ultimately lead to a large deformation of the slope in a short period of time. When the groundwater in the slope eventually drops to the same level as the reservoir water level, the difference in hydrodynamic pressure between the inside and outside of the slope will disappear, at which time the rate of landslide deformation will decrease rapidly. Therefore, the cumulative deformation curve of seepage-driven landslides is usually stepped, and the accelerated deformation usually occurs after the water level drops. Typical examples of such landslides include the Erdaohe landslide in Three Gorges Reservoir (Cao et al., 2021) and the Xinhua landslide in Dagangshan Reservoir (Chen et al., 2018).
In contrast, buoyancy-driven landslides are usually formed due to a change in the saturated state of the interior of the slope as a result of the rise in the reservoir water level, which in turn reduces the shear strength of the rocks and soils inside the slope, especially weak zones, faults, or mudstones prone to softening in the presence of water. The deformation process of buoyancy-driven landslides is mainly controlled by the maximum reservoir water level, and there is usually no obvious accelerated deformation phase during the normal operation of the reservoir, such as the Muyubao and Qianjiangping landslides in Three Gorges Reservoir area (Zhou et al., 2022).
Based on the area enclosed by the estimated deformation rate curve and the x-axis in Figure 12, the cumulative horizontal displacement curve for GNSS04 from 2021/04/30 to 2021/06/28 can be derived, as shown in Figure 13. As can be seen from the figure, the deformation process of the WLP landslide is very much correlated with the rise of the reservoir water, which mainly consists of accelerated deformation from 2021/04/30 to 2021.10.15 and 2022/10/13 to 2022/11/05, and slow deformation from 2021.10.15 to 2022/10/13 and from 2022/11/05 onwards. Based on the inflection points of the cumulative horizontal displacement curves, we marked the time and corresponding water level of the acceleration and deceleration of WLP landslides and found a characteristic that: the water level corresponding to the acceleration point is always not lower than that corresponding to the previous deceleration point, for example from 2021/08/28 to 2021/10/15 and from 2022/10/13 to 2022/11/05; while when the water level remains constant or decreases, the landslide always shows a slow creeping deformation, e.g. from 2021/07/08 to 2021/08/028 and from 2021/10/15 to 2022/10/13.

FIGURE 13. Analysis of landslide deformation mechanism based on cumulative displacement curve and water level curve.
Overall, the acceleration of the WLP landslides always occurred in response to an increase in the maximum submerged water level and did not exhibit significant accelerated deformation as the water level declined. Therefore, we assume that the WLP landslide is a buoyancy-driven landslide whose accelerated deformation process is directly related to the maximum reservoir water level and has little to do with the water level fluctuation. And the reason why its deformation curve appears to have a step similar to that of seepage-driven landslides from 2022/10/13 to 2022/11/05 is because the reservoir was not impounded to the normal water level until then.
According to the deformation characteristics of the buoyancy-driven landslides, as long as the maximum reservoir water level is not further increased, then the landslide will always keep a low deformation rate to creep. Since Baihetan Reservoir has reached its normal impoundment level (825 m) in 2022, without sudden basin-wide flooding and with normal reservoir operation and scheduling, then the possibility of sudden accelerated deformation of the WLP landslide is relatively low. In addition to this, however, the impact of sudden rainstorms on landslides should be considered, as there are currently a large number of cracks on the surface of the WLP landslide, which provide a channel for rainwater to infiltrate, and so the monitoring of this landslide should continue to be strengthened.
4 Discussion
By comparing the results of UAV photogrammetry and GNSS monitoring data, the displacement vector analysis based on UAV orthophotos can provide a more complete response to the overall deformation characteristics of the landslide than the single-point GNSS. However, it involves two deep issues that are very important at the practical application level.
The first one is that the manpower and time cost of UAV photogrammetry, including field operation, data processing, 3D modeling, and deformation analysis, is significantly higher than that of GNSS. This makes it difficult for UAV photogrammetry to focus on the entire life cycle of a reservoir landslide with a certain frequency, which is the reason why the UAV data in this paper were collected for only five periods, and the landslide monitoring was conducted with GNSS in the subsequent monitoring.
Another important issue concerns the accuracy of the monitoring data. The construction of UAV model is mainly based on the structure from motion (SfM) algorithm, which utilizes 2-D aerial images to construct spatially realistic 3-D point clouds and models. It mainly includes extraction and matching of feature points based on the Scale-invariant feature transform (SIFT) algorithm, outlier filtering based on the RANSAC algorithm, 3-D spatial reconstruction from 2D images based on the epipolar Geometry, and accuracy control based on bundle adjustment (Eltner and Schneider, 2015; Ma and Liu, 2018). In the SFM algorithm, when the computed 3-D spatial points are reprojected back to the corresponding 2-D image, the reprojected points will have deviation from the real pixel in the projection plane, and the bundle adjustment is to optimally estimate this deviation by minimizing the total sum of errors of hundreds or thousands of feature points on the same image (Jiang et al., 2020b). In this process, if the initial parameters (intrinsics and extrinsics) of the aerial image are sufficiently accurate, or if manually external georeferences, i.e., ground control points (GCPs), are added, then the bundle adjustment can be as effective as subpixel level (Sanz-Ablanedo et al., 2018). Many early studies have shown that the quantity and distribution of GCPs have a great impact on the accuracy of UAV modeling (Harwin et al., 2015; Mian et al., 2015; Martínez-Carricondo et al., 2018; Ferrer-González et al., 2020). However, in the case of reservoir landslides, the landslides can result in the disruption of roads within a certain area and may cause localized avalanches or rockfalls of varying sizes, resulting in the deployment of GPS in the field often being very dangerous.
In this study, the WLP landslide was still in the rapid deformation stage during the UAV monitoring, and localized landslides and rockfalls continued to occur in the landslide area, while the interruption of S303 caused inconvenient access to the on-site implement. In order to avoid the potential risk of landslide disaster in the field operation, we did not set up the GCP, but used a ground static base station (an RTK that can be switched to static mode) to obtain the high-precision initial parameters of the aerial images. This approach does avoid the risks of field operations to a large extent, but it comes at the cost of potentially reducing the accuracy of the UAV data.
From the results of the UAV deformation analysis shown in Figure 9, it appears that the correct UAV model can be obtained without GCPs. However, it is worth noting that we found obvious surface deformation errors due to UAV modeling errors in Figure 9C, which is zoomed out in detail as shown in Figure 14. The deformation direction of these two areas is opposite to the landslide direction, so we judge them as errors. They are mainly distributed in the south and north sides of the landslide area, and most of them are located outside the landslide area, in which the error in the north side is about 15 cm–20 cm and the error in the south side is about 17 cm–25 cm. Essentially all of the error on the north side is outside the landslide area, while about half of the error on the south side lies within the landslide area. Therefore, this error on the south side may have an impact on the landslide deformation analysis, but since the percentage of error is only about 8.5%–12.5%, it can be considered to have a small impact on the overall pattern and trend of landslide deformation. Overall, UAV photogrammetry sometimes faces a polar dichotomy between error and implementation feasibility. In complex terrain such as reservoir landslides, landslide monitoring with UAV photogrammetry must sometimes sacrifice some of its accuracy. Therefore, the use of UAV photogrammetry for reservoir landslide monitoring is more suitable in Stage II, because the main task of landslide monitoring in this stage is to figure out the boundary, scale, deformation trend and potential risk of landslides, rather than acquire high-precision surface displacement. Thus, the flexibility and fast implement of UAV are just suitable for the requirements of landslide monitoring in such situation.
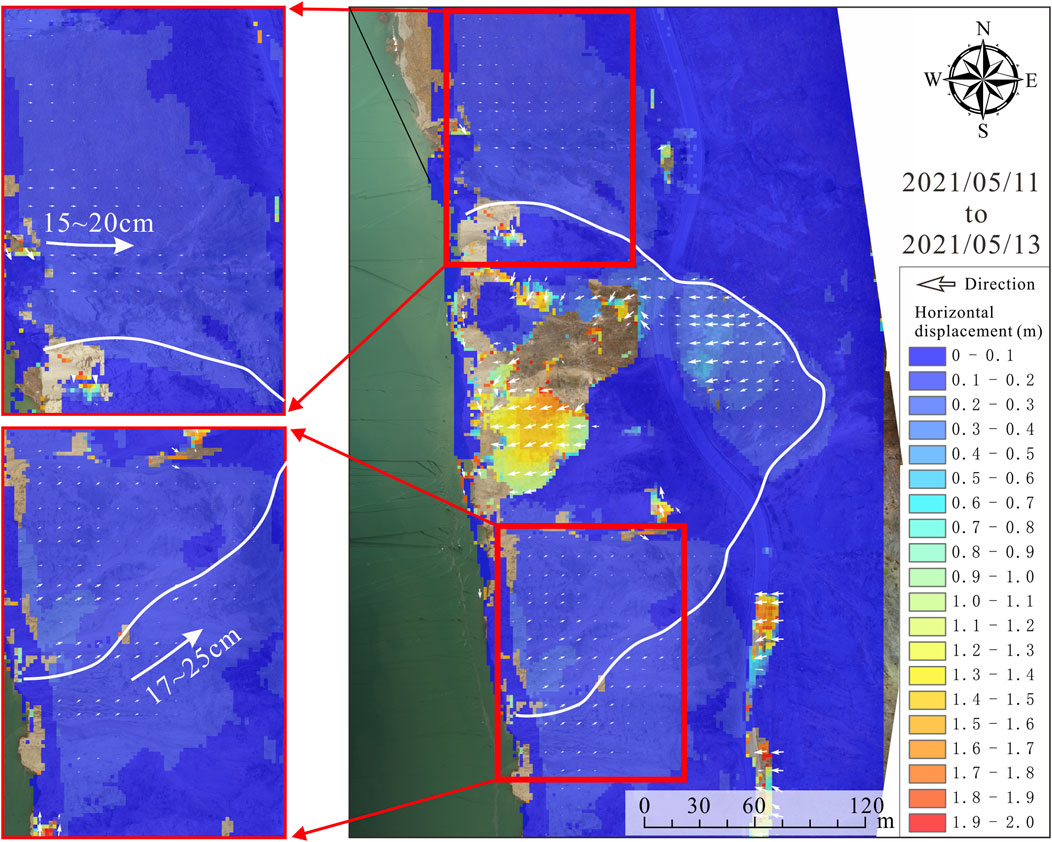
FIGURE 14. Errors in surface deformation analysis due to inaccurate UAV modeling.
In order to improve the monitoring accuracy of UAV photogrammetry, there have been many research explorations globally, which mainly focus on improving the accuracy of UAV aerial photography through higher precision remote sensing techniques. For example, Jiang et al. (2022) used TLS to provide GCPs for UAV photogrammetry to replace conventional RTK GCPs, which ensures accuracy while avoiding potential risks during field implementation. This approach does improve the accuracy of UAV photogrammetry, but at the same time brings problems such as higher equipment costs, increased manpower consumption and data processing time.
Overall, reservoir landslide monitoring is characterized by both short-time large deformation monitoring and long -time slow deformation. So, its on-site implementation is a balance issue between the cost and the efficiency. In this study, for the unit cost (i.e., total investment divided by the effective monitoring time) of the on-site survey, UAV photogrammetry, and GNSS monitoring system, the cost of UAV aerial photography is the highest, followed by GNSS monitoring, and lastly, the on-site survey. And UAV photogrammetry does offer a benefit that corresponds to its high cost, that is, assessing the potential risk of landslides during the period of maximum landslide deformation. Based on the findings of this paper, we believe that the methodology proposed in this paper can provide a good monitoring approach that is relatively low-cost and implementable.
5 Conclusion
This study proposes a method that can effectively monitor the deformation characteristics of reservoir landslides from Stage I to Stage III, which integrates the methods of field investigation, UAV photogrammetry, GNSS and inclinometer. The deformation process and characteristics of the initial stage of the WLP landslide were obtained based on the field investigation, then the overall horizontal displacement vector of the landslide was calculated by using UAV photogrammetry and the SPOT algorithm. After that, the deformation data of the landslide since initiation were reproduced by combining with the GNSS monitoring data and the deformation characteristics of the landslide. As a conclusion, this paper reveals the deformation processes, triggering mechanisms and subsequent potential risks of WLP landslides, and discusses the accuracy and monitoring applicability of UAV photogrammetry.
According to the results of the field investigation, the deformation of the WLP landslide started from 2021/04/30, corresponding to the reservoir water level of about 731.76 m. The deformation of the landslide is bounded by the S303 provincial highway, and the upper part of it is mainly characterized by subsidence and slippage, and the slopes are still maintained in their original shapes; however, the overburden layer in the lower part of the landslide has been almost completely disintegrated into the reservoir area.
The UAV monitoring results show that the main deformation zone of the Wulipo landslide is located on the north side of the landslide body, and the displacement rate reached its peak (about 1,000 mm/d) on 2021/05/11, and then declined to 250 mm/d in the following week.
Based on field investigations and landslide-water level relationships, this paper successfully compensates for the practical monitoring gap of WLP landslides, and finds that this landslide is a buoyancy-driven landslide whose accelerated deformation is related to the maximum reservoir water level. If the reservoir level does not continue to increase, the landslides may not show significant accelerated deformation, but possibly slow and continuous creep.
The UAV landslide monitoring based on ground base stations and airborne RTK can meet the monitoring needs of landslides in Stage II, but if very high-precision landslide deformation analyses are to be realized, the placement of sufficient GCPs is necessary.
Data availability statement
The original contributions presented in the study are included in the article/Supplementary Material, further inquiries can be directed to the corresponding author.
Author contributions
Z-HL: Writing–original draft, Data curation, Methodology. NJ: Formal Analysis, Methodology, Writing–original draft. A-CS: Funding acquisition, Project administration, Resources, Writing–review and editing. L-YZ: Data curation, Formal Analysis, Software, Validation, Writing–review and editing. ZX: Data curation, Formal Analysis, Investigation, Software, Writing–review and editing. X-LL: Data curation, Methodology, Resources, Software, Visualization, Writing–review and editing. H-BL: Conceptualization, Funding acquisition, Methodology, Resources, Validation, Writing–review and editing. J-WZ: Funding acquisition, Methodology, Resources, Supervision, Visualization, Writing–review and editing.
Funding
The author(s) declare financial support was received for the research, authorship, and/or publication of this article. This study has been supported by the support of the National Natural Science Foundation of China (U2240221 and 41977229), the Sichuan Youth Science and Technology Innovation Research Team Project (2020JDTD0006), the National Key R&D Program of China (2022YFC3080100) and the Key Science and Technology Plan Project of PowerChina Huadong Engineering Corporation Limited (KY2021–ZD–03).
Acknowledgments
The authors would like to thank the developers of COSI-Corr and reviewers for their time and constructive comments on our article.
Conflict of interest
Authors Z-HL, A-CS, and L-YZ were employed by Power China Huadong Engineering Corporation Limited.
The remaining authors declare that the research was conducted in the absence of any commercial or financial relationships that could be construed as a potential conflict of interest.
Publisher’s note
All claims expressed in this article are solely those of the authors and do not necessarily represent those of their affiliated organizations, or those of the publisher, the editors and the reviewers. Any product that may be evaluated in this article, or claim that may be made by its manufacturer, is not guaranteed or endorsed by the publisher.
References
Alonso, E. E., Sondon, M., and Alvarado, M. (2021). Landslides and hydraulic structures. Eng. Geol. 292, 106264. doi:10.1016/j.enggeo.2021.106264
Booth, A. M., McCarley, J. C., and Nelson, J. (2020). Multi-year, three-dimensional landslide surface deformation from repeat lidar and response to precipitation: mill Gulch earthflow, California. Landslides 17 (6), 1283–1296. doi:10.1007/s10346-020-01364-z
Bovenga, F., Pasquariello, G., Pellicani, R., Refice, A., and Spilotro, G. (2017). Landslide monitoring for risk mitigation by using corner reflector and satellite SAR interferometry: the large landslide of Carlantino (Italy). Catena 151, 49–62. doi:10.1016/j.catena.2016.12.006
Cao, Z., Tang, J., Zhao, X., Zhang, Y., Wang, B., Li, L., et al. (2021). Failure mechanism of colluvial landslide influenced by the water level change in the three gorges reservoir area. Geofluids 2021, 1–11. doi:10.1155/2021/6865129
Chen, M. L., Lv, P. F., Zhang, S. L., Chen, X. Z., and Zhou, J. W. (2018). Time evolution and spatial accumulation of progressive failure for Xinhua slope in the Dagangshan reservoir, Southwest China. Landslides 15 (3), 565–580. doi:10.1007/s10346-018-0946-8
Chen, P., Zhang, J., and Sun, X. C. (2017). Real-time kinematic positioning of LEO satellites using a single-frequency GPS receiver. Gps. Solut. 21 (3), 973–984. doi:10.1007/s10291-016-0586-1
Chen, T., Niu, R. Q., Du, B., and Wang, Y. (2015). Landslide spatial susceptibility mapping by using GIS and remote sensing techniques: a case study in Zigui County, the Three Georges reservoir, China. Environ. Earth. Sci. 73 (9), 5571–5583. doi:10.1007/s12665-014-3811-7
Chen, Y. S., Zhang, Y. M., Wang, L., Wang, S. M., Tian, D. F., and Zhang, L. (2022). Influencing factors, deformation mechanism and failure process prediction for reservoir rock landslides: tanjiahe landslide, three gorges reservoir area. Front. Earth Sci. 10, 974301. doi:10.3389/feart.2022.974301
Dykes, A. P., and Bromhead, E. N. (2018). New, simplified and improved interpretation of the Vaiont landslide mechanics. Landslides 15, 2001–2015. doi:10.1007/s10346-018-0998-9
Dykes, A. P., and Bromhead, E. N. (2022). Hazards from lakes and reservoirs: new interpretation of the Vaiont disaster. J. Mt. Sci. 19, 1717–1737. doi:10.1007/s11629-021-7098-3
Ekaso, D., Nex, F., and Kerle, N. (2020). Accuracy assessment of real-time kinematics (RTK) measurements on unmanned aerial vehicles (UAV) for direct geo-referencing. Geo-Spat. Inf. Sci. 23 (2), 165–181. doi:10.1080/10095020.2019.1710437
Eltner, A., and Schneider, D. (2015). Analysis of different methods for 3d reconstruction of natural surfaces from parallel-axes UAV images. Photogramm. Rec. 30 (151), 279–299. doi:10.1111/phor.12115
Ferrer-González, E., Agüera-Vega, F., Carvajal-Ramírez, F., and Martínez-Carricondo, P. J. R. S. (2020). UAV photogrammetry accuracy assessment for corridor mapping based on the number and distribution of ground control points. Remote Sens. (Basel). 12, 2447. doi:10.3390/rs12152447
Ghorbanzadeh, O., Xu, Y. H., Ghamisi, P., Kopp, M., and Kreil, D. (2022). Landslide4Sense: reference benchmark data and deep learning models for landslide detection. IEEE T. Geosci. Remote 60. doi:10.1109/Tgrs.2022.3215209
Giles, A. B., Massom, R. A., and Warner, R. C. (2009). A method for sub-pixel scale feature-tracking using Radarsat images applied to the Mertz Glacier Tongue, East Antarctica. Remote Sens. Environ. 113 (8), 1691–1699. doi:10.1016/j.rse.2009.03.015
Gu, D. M., Huang, D., Yang, W. D., Zhu, J. L., and Fu, G. Y. (2017). Understanding the triggering mechanism and possible kinematic evolution of a reactivated landslide in the Three Gorges Reservoir. Landslides 14 (6), 2073–2087. doi:10.1007/s10346-017-0845-4
Gutiérrez, F., Linares, R., Roqué, C., Zarroca, M., Carbonel, D., Rosell, J., et al. (2015). Large landslides associated with a diapiric fold in Canelles Reservoir (Spanish Pyrenees): detailed geological–geomorphological mapping, trenching and electrical resistivity imaging. Geomorphology 241, 224–242. doi:10.1016/j.geomorph.2015.04.016
Harwin, S., Lucieer, A., and Osborn, J. (2015). The Impact of the calibration method on the accuracy of point clouds derived using unmanned aerial vehicle multi-view stereopsis. Remote Sens-Basel 7 (9), 11933–11953. doi:10.3390/rs70911933
Jiang, N., Li, H., Hu, Y., Zhang, J., Dai, W., Li, C., et al. (2021b). A monitoring method integrating terrestrial laser scanning and unmanned aerial vehicles for different landslide deformation patterns. IEEE J. Sel. Top. Appl. Earth Obs. Remote Sens. 14, 10242–10255. doi:10.1109/jstars.2021.3117946
Jiang, N., Li, H. B., and Zhou, J. W. (2021a). Quantitative hazard analysis and mitigation measures of rockfall in a high-frequency rockfall region. B. Eng. Geol. Environ. 80 (4), 3439–3456. doi:10.1007/s10064-021-02137-1
Jiang, N., Li, H. B., Li, C. J., Xiao, H. X., and Zhou, J. W. (2022). A fusion method using terrestrial laser scanning and unmanned aerial vehicle photogrammetry for landslide deformation monitoring under complex terrain conditions. IEEE T. Geosci. Remote Sens. 60, 1–14. doi:10.1109/Tgrs.2022.3181258
Jiang, N., Li, H. B., Liu, M. S., Zhang, J. Y., and Zhou, J. W. (2020a). Quantitative hazard assessment of rockfall and optimization strategy for protection systems of the Huashiya cliff, southwest China. Geomat. Nat. Haz. Risk 11 (1), 1939–1965. doi:10.1080/19475705.2020.1819445
Jiang, S., Jiang, C., and Jiang, W. S. (2020b). Efficient structure from motion for large-scale UAV images: a review and a comparison of SfM tools. ISPRS J. Photogramm. Remote Sens. 167, 230–251. doi:10.1016/j.isprsjprs.2020.04.016
Kaczmarek, H., Tyszkowski, S., and Banach, M. (2015). Landslide development at the shores of a dam reservoir (Włocławek, Poland), based on 40 years of research. Environ. Earth Sci. 74, 4247–4259. doi:10.1007/s12665-015-4479-3
Koca, T. K., and Koca, M. Y. (2019). Volume estimation and evaluation of rotational landslides using multi-temporal aerial photographs in Calayan dam reservoir area, Turkey. Arab. J. Geosci. 12 (5). doi:10.1007/s12517-019-4290-7
Li, H.-b., Yang, X.-g., Sun, H.-l., Qi, S.-c., and Zhou, J.-w.J. L. (2019a). Monitoring of displacement evolution during the pre-failure stage of a rock block using ground-based radar interferometry. Landslides 16, 1721–1730. doi:10.1007/s10346-019-01228-1
Li, H. B., Yang, X. G., Sun, H. L., Qi, S. C., and Zhou, J. W. (2019b). Dynamical process of the Hongshiyan landslide induced by the 2014 Ludian earthquake and stability evaluation of the back scarp of the remnant slope. Bull. Eng. Geol. Environ. 78, 2081–2092. doi:10.1007/s10064-018-1233-6
Liang, X., Gui, L., Wang, W., Du, J., Ma, F., and Yin, K. L. (2021). Characterizing the development pattern of a colluvial landslide based on long-term monitoring in the Three Gorges Reservoir. Remote Sens-Basel 13 (2), 224. doi:10.3390/rs13020224
Ma, Z. L., and Liu, S. L. (2018). A review of 3D reconstruction techniques in civil engineering and their applications. Adv. Eng. Inform. 37, 163–174. doi:10.1016/j.aei.2018.05.005
Manenti, S., Amicarelli, A., and Todeschini, S. (2018). WCSPH with limiting viscosity for modeling landslide hazard at the slopes of artificial reservoir. Water 10, 515. doi:10.3390/w10040515
Mantovani, F., and Vita-Finzi, C. (2003). Neotectonics of the Vajont dam site. Geomorphology 54 (1–2), 33–37. doi:10.1016/S0169-555x(03)00053-9
Martínez-Carricondo, P., Agüera-Vega, F., Carvajal-Ramírez, F., Mesas-Carrascosa, F.-J., García-Ferrer, A., and Pérez-Porras, F. J. (2018). Assessment of UAV-photogrammetric mapping accuracy based on variation of ground control points. Int. J. Appl. Earth. Obs. 72, 1–10. doi:10.1016/j.jag.2018.05.015
Mian, O., Lutes, J., Lipa, G., Hutton, J., Gavelle, E., and Borghini, S. (2015). Direct georeferencing on small unmanned aerial platforms for improved reliability and accuracy of mapping without the need for ground control points. Int. Archives Photogrammetry Remote Sens. Spatial Inf. Sci. XL-3/W4, 397–402. doi:10.5194/isprsarchives-XL-1-W4-397-2015
Micu, M., and Bălteanu, D. (2013). A deep-seated landslide dam in the Siriu reservoir (curvature Carpathians, Romania). Landslides 10, 323–329. doi:10.1007/s10346-013-0382-8
Niacsu, L., Ionita, I., Samoila, C., Grigoras, G., and Blebea-Apostu, A. M. (2021). Land degradation and soil conservation measures in the Moldavian Plateau, Eastern Romania: a case study from the Racova Catchment. Water 13, 2877. doi:10.3390/w13202877
Notti, D., Cina, A., Manzino, A., Colombo, A., Bendea, I. H., Mollo, P., et al. (2020). Low-Cost GNSS solution for continuous monitoring of slope instabilities applied to madonna del sasso sanctuary (NW Italy). Sensors 20 (1), 289. doi:10.3390/s20010289
Raucoules, D., and Michele, M. D. (2012). “SAR high resolution image sub-pixel correlation for landslide monitoring,” in Application to Salazie (La Reunion Island) and La Valette (Alps) landslides (München, Germany: Paper presented at the IEEE Inter-national Geoscience and Remote Sensing Symposium: IGARSS’12: Remote Sensing for a DynamicEarth), 1672. Available at: http://hal-obspm.ccsd.cnrs.fr/OPENAIRE/hal-00697315
Reyes-Carmona, C., Barra, A., Galve, J. P., Monserrat, O., Pérez-Peña, J. V., Mateos, R. M., et al. (2020). Sentinel-1 DInSAR for monitoring active landslides in critical infrastructures: the case of the rules reservoir (Southern Spain). Remote Sens-Basel 12 (5), 809. doi:10.3390/rs12050809
Sanz-Ablanedo, E., Chandler, J. H., Rodríguez-Pérez, J. R., and Ordóñez, C. (2018). Accuracy of unmanned aerial vehicle (UAV) and SfM photogrammetry survey as a function of the number and location of ground control points used. Remote Sens-Basel 10 (10). doi:10.3390/rs10101606
Šegina, E., Peternel, T., Urbančič, T., Realini, E., Zupan, M., Jež, J., et al. (2020). Monitoring surface displacement of a deep-seated landslide by a low-cost and near real-time GNSS system. Remote. Sens. 12 (20), 3375. doi:10.3390/rs12203375
Seguí, C., Rattez, H., and Veveakis, M. (2020). On the stability of deep-seated landslides. The Cases of Vaiont (Italy) and shuping (Three Gorges Dam, China). J. Geophys. Res-Earth. 125 (7). doi:10.1029/2019JF005203
Singleton, A., Li, Z., Hoey, T., and Muller, J. P. (2014). Evaluating sub-pixel offset techniques as an alternative to D-InSAR for monitoring episodic landslide movements in vegetated terrain. Remote Sens. Environ. 147, 133–144. doi:10.1016/j.rse.2014.03.003
Sun, L. (2017). Monitoring landslides in the Three Gorges Region: understanding the relationship between the formation of landslides and three gorges project. Doctoral Thesis, University College London. https://discovery.ucl.ac.uk/id/eprint/1542946
Tang, H. M., Wasowski, J., and Juang, C. H. (2019). Geohazards in the three Gorges Reservoir Area, China lessons learned from decades of research. Eng. Geol. 261, 105267. doi:10.1016/j.enggeo.2019.105267
Thiery, Y., Terrier, M., Colas, B., Fressard, M., Maquaire, O., Grandjean, G., et al. (2020). Improvement of landslide hazard assessments for regulatory zoning in France: STATE–OF–THE-ART perspectives and considerations. Int. J. Disaster Risk Reduct. 47, 101562. doi:10.1016/j.ijdrr.2020.101562
Turner, D., Lucieer, A., and de Jong, S. M. (2015). Time series analysis of landslide dynamics using an unmanned aerial vehicle (UAV). Remote Sens-Basel 7 (2), 1736–1757. doi:10.3390/rs70201736
Wang, L., Cao, Z., Xue, Y., Zhang, W., Liu, J., Zhou, Y., et al. (2023a). Effect of weakening characteristics of mechanical properties of granite under the action of liquid nitrogen. Front. Ecol. Evol. 11, 1249617. doi:10.3389/fevo.2023.1249617
Wang, L., Xue, Y., Cao, Z., Kong, H., Han, J., and Zhang, Z. (2023b). Experimental study on mode I fracture characteristics of granite after low temperature cooling with liquid nitrogen. Water 15, 3442. doi:10.3390/w15193442
Wang, L. Q., Zhang, Z. H., Huang, B. L., Hu, M. J., and Zhang, C. Y. (2021). Triggering mechanism and possible evolution process of the ancient Qingshi landslide in the Three Gorges Reservoir. Geomat. Nat. Hazards Risk 12 (1), 3160–3174. doi:10.1080/19475705.2021.1998230
Wang, M., Li, H. B., Han, J. Q., Xiao, X. H., and Zhou, J. W. (2019). Large deformation evolution and failure mechanism analysis of the multi-freeface surrounding rock mass in the Baihetan underground powerhouse. Eng. Fail. Anal. 100, 214–226. doi:10.1016/j.engfailanal.2019.02.056
Wei, L., Dang, F., Ding, J., Wu, X., Li, J., and Cao, Z. (2023). An analysis of thixotropic micropore variation and its mechanism in loess. Front. Ecol. Evol. 11, 11. doi:10.3389/fevo.2023.1242462
Wu, M., Yi, X., Dun, J., Yang, J., Cai, W., and Zhang, G. (2022). Understanding the slow motion of the wangjiashan landslide in the baihetan reservoir area (China) from space-borne radar observations. Adv. Civ. Eng. 2022, 1–14. doi:10.1155/2022/1766038
Xia, M., Ren, G. M., and Ma, X. L. (2013). Deformation and mechanism of landslide influenced by the effects of reservoir water and rainfall, Three Gorges, China. Nat. Hazards 68 (2), 467–482. doi:10.1007/s11069-013-0634-x
Xiao, H. X., Jiang, N., Chen, X. Z., Hao, M. H., and Zhou, J. W. (2023). Slope deformation detection using subpixel offset tracking and an unsupervised learning technique based on unmanned aerial vehicle photogrammetry data. Geol. J. 58 (6), 2342–2352. doi:10.1002/gj.4677
Xu, Q., Zheng, G., Li, W., He, C., Dong, X., Guo, C., et al. (2018). Study on successive landslide damming events of Jinsha River in Baige Village on Octorber 11 and November 3, 2018 (in Chinese with English Abstract). J. Eng. Geol. 26 (6), 1534–1551. doi:10.13544/j.cnki.jeg.2018-406
Zhao, C. Y., Kang, Y., Zhang, Q., Lu, Z., and Li, B. (2018). Landslide identification and monitoring along the Jinsha River Catchment (Wudongde Reservoir Area), China, Using the InSAR method. Remote Sens-Basel 10 (7), 993. doi:10.3390/rs10070993
Zhou, C., Cao, Y., Yin, K. L., Intrieri, E., Catani, F., and Wu, L. X. (2022). Characteristic comparison of seepage-driven and buoyancy-driven landslides in Three Gorges Reservoir area, China. Eng. Geol. 301. doi:10.1016/j.enggeo.2022.106590
Zhou, C., Cao, Y., Yin, K. L., Wang, Y., Shi, X. G., Catani, F., et al. (2020). Landslide characterization applying sentinel-1 images and InSAR technique: the muyubao landslide in the three gorges reservoir area, China. Remote Sens-Basel 12 (20), 3385. doi:10.3390/rs12203385
Keywords: reservoir landslide, landslide monitoring, UAV photogrammetry, sub-pixel offset tracking, landslide mechanism
Citation: Li Z-H, Jiang N, Shi A-C, Zhao L-Y, Xian Z, Luo X-L, Li H-B and Zhou J-W (2024) Reservoir landslide monitoring and mechanism analysis based on UAV photogrammetry and sub-pixel offset tracking: a case study of Wulipo landslide. Front. Earth Sci. 11:1333815. doi: 10.3389/feart.2023.1333815
Received: 06 November 2023; Accepted: 18 December 2023;
Published: 23 January 2024.
Edited by:
Yi Xue, Xi’an University of Technology, ChinaCopyright © 2024 Li, Jiang, Shi, Zhao, Xian, Luo, Li and Zhou. This is an open-access article distributed under the terms of the Creative Commons Attribution License (CC BY). The use, distribution or reproduction in other forums is permitted, provided the original author(s) and the copyright owner(s) are credited and that the original publication in this journal is cited, in accordance with accepted academic practice. No use, distribution or reproduction is permitted which does not comply with these terms.
*Correspondence: Nan Jiang, 2018223060073@stu.scu.edu.cn