Influence of Eastern, Central and Mix El Niño on the variability of rainfall in southeastern South America
 Gabriela Goudard
 Leila Limberger
 Camila Bertoletti Carpenedo
- 1Climatology Laboratory (Laboclima), Department of Geography, Federal University of Paraná (UFPR), Curitiba, Brazil
- 2Environmental Dynamics Study Laboratory, Department of Geography, Western Paraná State University, Marechal Cândido Rondon, Brazil
- 3Center for Studies on Climate Change and Variability (NUVEM), Department of Soils and Agricultural Engineering, Federal University of Paraná (UFPR), Curitiba, Brazil
El Niño/Southern Oscillation (ENSO) plays a very important role in modulating rainfall variability in South America. Although the effects of conventional ENSO are well known, there are significant variations in rainfall patterns when sea surface temperature anomalies manifest over the different regions along the equatorial Pacific, namely, Niño 3 (East), Niño 3 and Niño 4 (Mix), and Niño 4 (Central) ENSO. This work aims to analyze the variability of precipitation in southeastern South America associated with different types of El Niño (EN). For this, composite analyzes of precipitation, winds at low and high levels, vertical velocity and geopotential height were carried out. The results indicate that the rainfall pattern associated with Eastern Pacific (EP) El Niño shows the classic features expected from EN described in previous literature, i.e., a stronger and well-defined positive precipitation anomaly over southeast South America, while Central Pacific (CP) El Niño shows weaker and even an opposite sign over the region. Mix (MX) El Niño events present a spatial pattern of precipitation anomalies similar to EP El Niño events, but with lower intensity in the study area. The heterogeneity of EN-related precipitation effects results from a change in large-scale atmospheric circulation patterns: the Walker cell in the tropics, the Rossby waves in the extratropics, and the circulation of low and high-level jet streams. EP El Niño events feature a configuration similar to the South American Low-Level Jet, the strengthening of the subtropical jet, better structured Rossby waves and the Pacific-South America pattern. These characteristics are observed in MX El Niños, but in a weaker way compared to EP El Niños. CP El Niño events, on the other hand, present a weakening and spatial displacement of the aforementioned conditions, which is reflected in negative precipitation anomalies in most seasons. Thus, more significant rainfall variations are noted between the EP El Niños and CP El Niños, with a predominance of positive and negative rainfall anomalies in the study area, respectively.
1 Introduction
The El Niño/Southern Oscillation (ENSO) is the dominant interannual mode of the climate system that influences the atmospheric circulation and rainfall anomalies over the tropics, subtropics, and extratropics (Aceituno, 1988; Philander, 1990; Yu and Kim, 2013; Cai et al., 2020). El Niño (EN) and La Niña (LN) events are associated with warmer and colder than average sea surface temperature (SST) conditions in the central-east equatorial Pacific, respectively. It is a coupled ocean-atmosphere phenomenon in the equatorial Pacific marked by changes in surface and subsurface temperatures, as well as variations in the zonal pressure gradient and trade winds. The description of this oscillation and its phases has been highlighted in several studies such as those by Philander (1990), Trenberth and Caron (2000), Wang et al. (2016), Grimm (2009, 2021), among others.
Marked by the predominance of subtropical climates and a regular distribution of precipitation, southeastern South America (SA—Figure 1) is one of the most sensitive regions to ENSO teleconnections (Grimm et al., 1998; Grimm, 2003, 2004; Grimm and Tedeschi, 2009). Previous studies point out that during ENSO’s warm phase (EN) precipitation increases, while during the cold phase (LN) precipitation decreases considerably in this region. However, recent studies have shown that ENSO impacts vary according to the position of SST anomalies in the equatorial Pacific (Hill et al., 2009, 2011; Rodrigues et al., 2011). These episodes modify the atmospheric circulation affecting precipitation, extreme events (Grimm and Tedeschi, 2009; Robledo et al., 2013; Tedeschi et al., 2015, 2016), surface temperature (Barros et al., 2002), atmospheric systems (Rodrigues et al., 2011; Rodrigues and McPhaden, 2014), river flows, with serious impacts on agriculture and hydroelectric power production (Tucci et al., 2003).
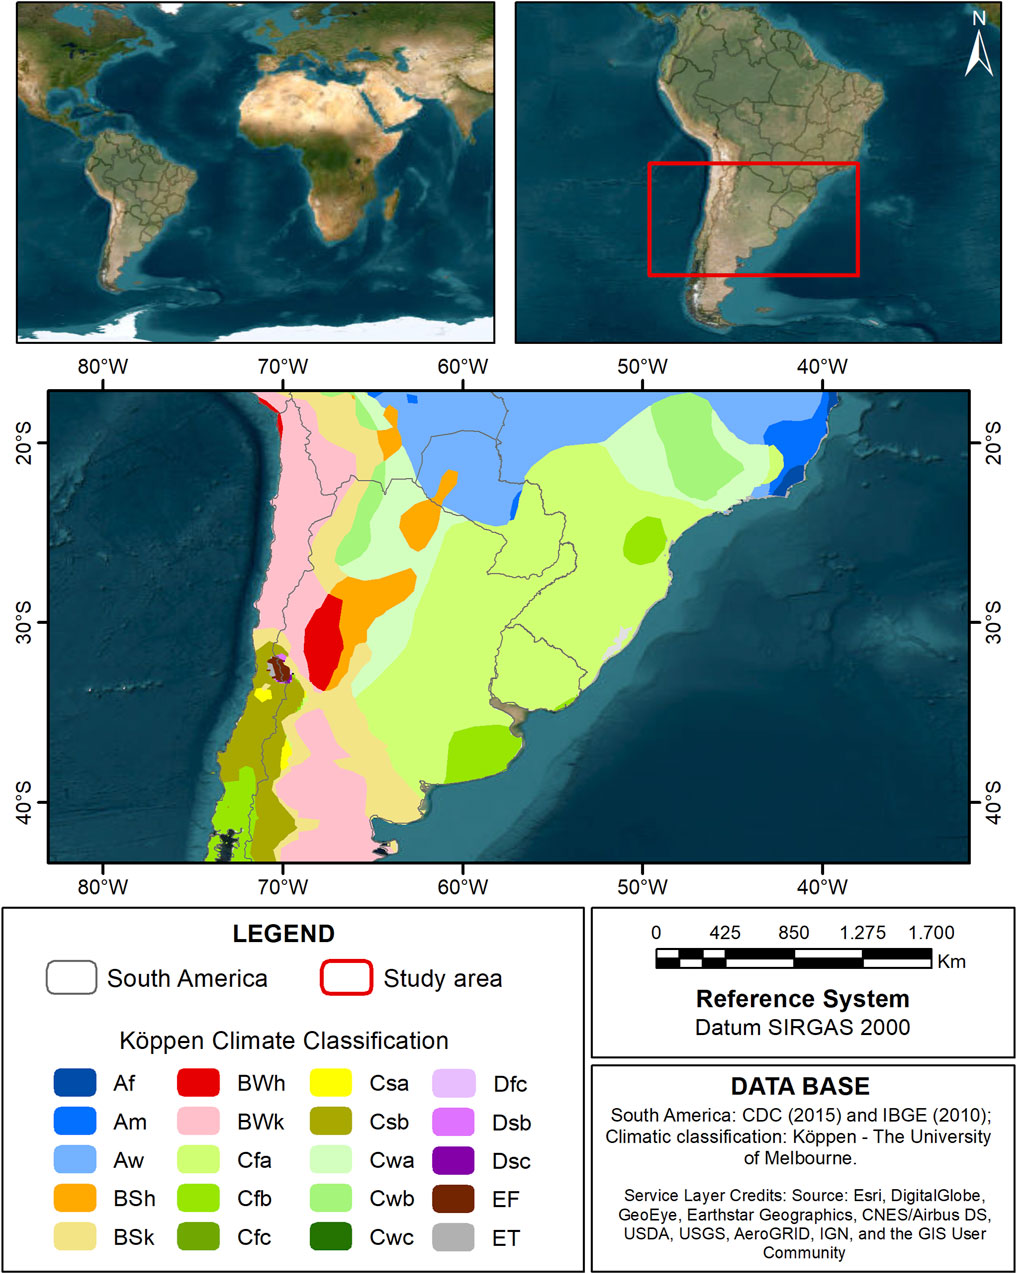
Figure 1. Location and climatic characterization of southeastern South America.
ENSO has been referred to EP ENSO or Canonical if the warming (cooling) manifests in the Eastern Pacific (Conventional), CP ENSO or Modoki if the key anomalies locate in the Central Pacific, and Mix (MX) ENSO if they extend through eastern and central Pacific (Ashok et al., 2007; Ashok and Yamagata, 2009; Kao and Yu, 2009; Tedeschi, et al., 2015, 2016; Andreoli et al., 2016; Kayano et al., 2016; Cai et al., 2020). Several studies have highlighted that the frequency of these events has changed in recent decades (Ashok et al., 2007; Lee and McPhaden, 2010; McPhaden et al., 2011; Yu and Kim, 2013; Cai et al., 2020), which makes the present study relevant.
In addition to the different typologies of ENSO and their effects on rainfall, studies by Lin and Qian (2019) demonstrate the need to consider the life cycle of ENSO, taking into account the transition phases. For the authors, four ENSO phases should be considered (warm phase, cold phase, cold to warm transition, and warm to cold transition) to replace the traditional three-phase paradigm (warm, cold, and neutral phases). These phases are in agreement with studies by Capotondi et al. (2015); Chen et al. (2016); Okumura (2019), among others, that highlight the asymmetries between the ENSO events, both concerning the temporality of recurrence, and the switch between EN and LN.
The impact of ENSO on SA depends on a variety of factors, including ENSO diversity and the phase of other modes of climate variability (e.g., Kayano et al., 2019; 2020; Fernandes and Grimm, 2023; Hu et al., 2023). Despite our significant progress in understanding ENSO using observations and simulations in recent decades, the impacts associated with ENSO diversity in SA are not fully understood.
Thus, this paper aims to analyze the rainfall variability in southeastern SA associated with different types of EN (EP, CP, and MX). This study presents the following: i) the mean atmospheric pattern and precipitation in southeastern SA; ii) the EN types classified using the 1950 to 2020 period; iii) a seasonal analysis of the southeastern SA rainfall patterns associated with EN types; and, iv) a discussion of the ocean-atmosphere interaction for different EN types based on winds, vertical velocity and geopotential height data. In this study, we chose to analyze only EN events, as they present greater variations in precipitation anomalies in the study area according to the different ENSO typologies.
The results will contribute to understanding variability and the mechanisms related to precipitation in SA, providing insights to improve regional climate forecasts and manage climate risks.
2 Materials and methods
2.1 Database
We used monthly precipitation data from the Global Precipitation Climatology Centre (GPCC), at the horizontal resolution of 0.25° × 0.25° (Schneider et al., 2022). We also employed the Extended Reconstructed Sea Surface Temperature version 5–ERSSTv5 (Huang et al., 2017), derived from the International Comprehensive Ocean-Atmosphere Dataset (ICOADS). ERSSTv5 is a global monthly SST dataset, with a spatial resolution of 2°. For the analysis of the atmospheric fields, monthly data of wind (850 hPa and 200 hPa), vertical velocity (omega–200 hPa) and geopotential height (200 hPa) from NCEP/NCAR reanalysis I (Kalnay et al., 1996) were used. The period analyzed is from 1950 to 2020.
2.2 Identification of ENSO events
In this study, the determination of EN episodes is based on the dates contained in the ONI index (Oceanic Niño Index). ENSO events are selected if they are equal to or greater than +0.5°C (equal to or less than at −0.5°C) for the warm phase (cold phase) persistent for 5 consecutive quarters. The events were defined based on the periods available on the CPC/NOAA website (https://origin.cpc.ncep.noaa.gov/products/analysis_ monitoring/ensostuff/ONI_v5.php). The intensity, used only to characterize the events, was based on GGWS—Golden Gate Weather Services (2021), considering as weak—SST anomalies from 0.5 to 0.9 (−0.5 to −0.9), moderate from 1.0 to 1.4 (−1.0 to −1.4), strong from 1.5 to 1.9 (−1.5 to −1.9), and very strong ≥2.0 (≤−2.0) for EN (LN) events. In this study, only the years of EN were analyzed.
There are several methods for determining the types of ENSO, as evidenced in studies by Yu and Kim (2013): the central-location method used by Kug et al. (2009); Yeh et al. (2009) and Tedeschi et al. (2015, 2016); the Modoki El Niño Index method used in Ashok et al. (2007); the Cold Tongue and Warm Pool method proposed by Ren and Jin (2011); and a pattern correlation method based on Empirical Orthogonal Function analysis used in Kao and Yu (2009) and Yu and Kim (2013), to cite a few.
The characterization of events in EP and CP is based on the studies of Tedeschi et al. (2015, 2016). EP ENSO occurs with SST anomalies in the adapted Niño 3 region (140°W–90°W, 5°N–5°S—with less 10° of longitude on the west side, to obtain separate regions—Figure 2B) and CP ENSO in the Niño 4 region (160°E–150°W, 5°N–5°S; Figures 2A, B). MX ENSO were also included in the analysis, following the definition used by Yu and Kim (2013) and Andreoli et al. (2016) (Figure 2C). In this study, MX events were considered those that, throughout their space-time evolution (June 0 to May +1, with emphasis on DJF), moved between Niño 3 and Niño 4 regions or presented spatial configurations between these two regions (Figure 2C).
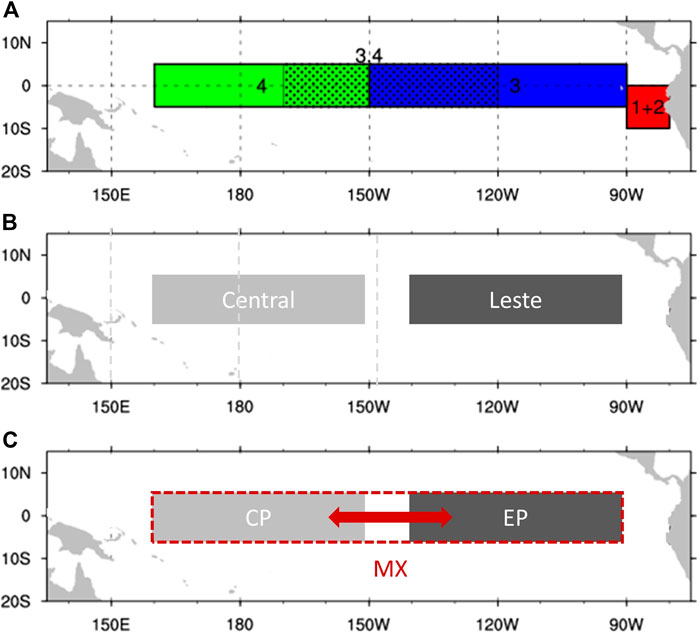
Figure 2. Location of ENSO. (A) Niño regions: Niño1+2 (0–10S, 90W–80W), Niño3 (5N–5S,150W–90W), Niño3.4 (5N–5S,170W–120W), and Niño4 (5N–5S, 160E–150W). (B) ENSO regions used in Tedeschi et al. (2015). (C) ENSO regions used in this study.
The ENSO cycle begins in the austral winter (year 0 of the event) and ends in the austral autumn/winter of the following year (+1) (Wolter and Timlin, 2011). In this context, the monthly spatial evolution of SST anomalies was analyzed during this period (June 0 to May +1, with emphasis on DJF) for the determination of EP, CP, and MX El Niños (Table 1).
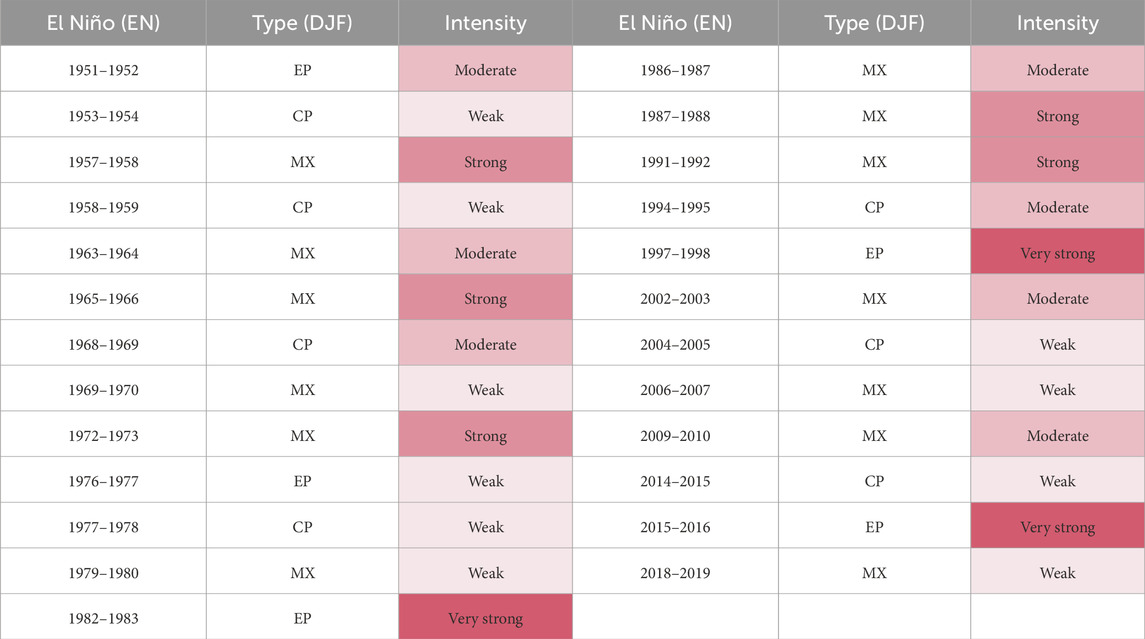
Table 1. El Niño events: types and intensity (1950–2020).
It is noteworthy that the differences in the classification of EN events between our study and those of Tedeschi et al. (2015, 2016) occur due to the different SST (version 5 in here) and rainfall (GPCC) datasets, as well as the period of data used (anomalies from 1950 to 2020 compared to the climatological normal from 1991 to 2020). Furthermore, this paper incorporated the Mix El Niño into the analyses.
2.3 Characterization of rainfall variability associated with ENSO
To characterize rainfall variability during EN years, we analysed the composition of seasonal rainfall anomalies from June (year 0) to May (year +1) for years classified for different types of EN events (EP, CP, and MX).
The atmospheric anomaly fields are analyzed using winds (850 hPa and 200 hPa), vertical velocity (200 hPa) and geopotential height (200 hPa) for different types of EN. In addition, they were discussed putting into context existing contributions from the literature, using the studies by Drumond and Ambrizzi (2006); Silva and Ambrizzi (2006, 2010); Silva et al. (2009, 2011); Tedeschi et al. (2015, 2016); Andreoli et al. (2016); Cai et al. (2020), among others. A two-tailed Student’s t-test was applied to the composites to determine the areas of statistical significance at the 90% confidence level.
3 Results
3.1 Precipitation in southeastern South America
SA has considerable climate diversification due to its territorial extension, the conjunction between atmospheric elements, and geographical particularities (Reboita et al., 2010). The main tropical modulators of precipitation in SA are the Intertropical Convergence Zone (ITCZ), the South Atlantic Convergence Zone (SACZ), and the South American Low-Level Jet (SALLJ; e.g., Reboita et al., 2010; Laureanti, 2020), as shown in Figure 3A (Cai et al., 2020).
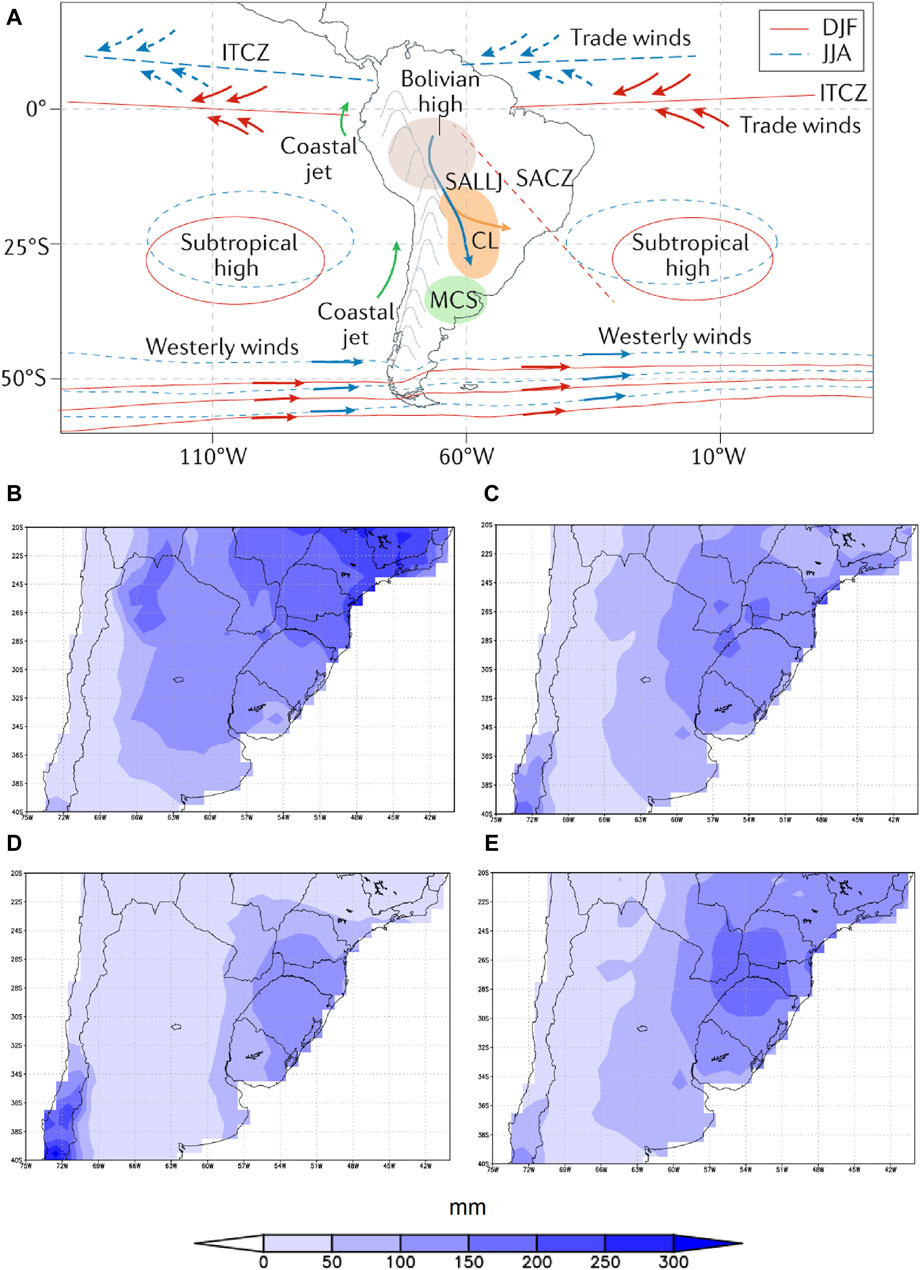
Figure 3. Atmospheric features and rainfall climatology. (A) Schematic of the main climatological features in South America. Source: Cai et al. (2020). The blue and red lines represent features in June- July- August (JJA) and December- January- February (DJF), respectively. ITCZ: Inter-tropical Convergence Zone. SALLJ: South American Low-Level Jet. SACZ: South Atlantic convergence zone. CL: Chaco Low. MCS: Mesoscale convective system (B) Seasonal rainfall climatology in December-January-February (DJF); (C) March-April-May (MAM); (D) June-July-August (JJA); and, (E) September-October-November (SON).
The Atlantic trade winds and the ITCZ modulate the SA climate in the tropics while the SALLJ plays an important role in transporting a large amount of moisture from the Amazon and the tropical Atlantic Ocean towards the subtropics, facilitating the development of mesoscale convective systems, as well as assisting in the configuration of the SACZ, especially in the summer (Figure 3A; Cai et al., 2020). The SALLJ can manifest in two regimes: strong southwards flow that transports moisture from the Amazon basin to the southern Brazil, Uruguay, and northern Argentina (more prevalent in JJA) and a weak eastwards flow that redirects moisture to the SACZ (which develops more often in DJF), increasing rainfall in southeast Brazil (Figures 3B, D, respectively; Marengo et al., 2004; Carvalho et al., 2004; Liebmann et al., 2004). As the season progresses, these processes weaken and the moisture fluxes from the Amazon decrease considerably.
The South Atlantic Subtropical Anticyclone (SASA), a semi-permanent pressure system, also contributes to the moisture fluxes in the SA, which may or may not intensify the SALLJ according to their positioning—further south-east in summer (increasing rainfall in southeastern SA; Figure 3B) and north-west in winter (decreasing rainfall in Southeastern SA; Figure 3D) in the Atlantic Ocean (Reboita et al., 2010; Cai et al., 2020).
In the rainy season (October to April) the role of the South American Monsoon System (SAMS) stands out; it helps to transport moisture across the continent using jet streams towards the extratropics (Zhou and Lau, 1998; Liebmann and Mechoso, 2011; Gan et al., 2021). In the dry season (May to September) the frontal systems are responsible for a considerable portion of the precipitation in the SA, especially in the central-southern part of the continent, so they directly influence rainfall in Southeastern SA (Figure 3D; Cavalcanti and Kousky, 2009).
These atmospheric features contribute to the regular distribution of precipitation in the southeast of SA throughout all seasons of the year, a typical characteristic of subtropical climates, which predominate in the southeast of the SA (Figure 1). Above all, these dynamics are observed in the eastern portion of the Andes (Figures 3B–E). The seasonal analysis of rainfall shows that austral summer (Figure 3B) and spring (Figure 3E) have the most expressive rainfall values. Spatially, the largest rainfall concentrates in the northern and eastern areas of the domain in austral summer (Figure 3B), in the east in spring (Figure 3E) and autumn (Figure 3C), and in the south in winter (Figure 3D).
ENSO events modify the atmospheric mechanisms of SA through local (ocean-atmosphere heat transfer), tropical (Walker climatological circulation), and extratropical (Rossby wave train pattern) forcings (Cai et al., 2020). In this context, the mechanisms associated with the different types of ENSO culminate in changes in the rainfall variability over the study area, which are explored in the next section.
3.2 Characterization of different types of ENSO and their effects on southeastern South America rainfall
In the period analyzed in this study (1950–2020), 25 EN events were identified with different types and intensities (Table 1). Of the 25 events identified (Table 1), 5 were classified as EP, 7 CP and 13 MX. MX events were predominant throughout the period of analysis since we choose to consider EP and CP only the episodes that did not show overlaps, to better characterize the different typologies of EN. The analysis of Table 1 shows some EN events have very strong intensity, 1982–1983, 1997–1998, and 2015–2016 stand out, marked by positive rainfall anomalies in the study area.
In the EP events (Figure 4A), the maximum SST anomalies occur in the equatorial region of the eastern Pacific (region Niño3), in MX events (Figure 4B), occur concomitantly between the Niño3 and Niño4 regions and for CP events (Figure 4C), the SST anomalies are located in the central Pacific (Niño4 region). Chen et al. (2015) suggest that the asymmetry, irregularity and extremes of EN result from westerly wind bursts, a type of state-dependent atmospheric perturbation in the equatorial Pacific. For the authors, these winds are favorable to the development of canonical events (EP) and strong.
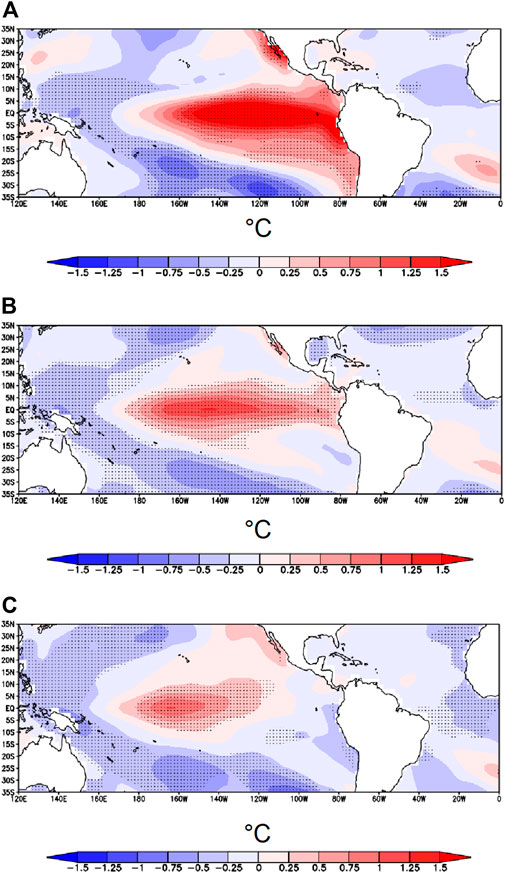
Figure 4. Composites of SST anomalies in DJF for East Pacific El Niño (A), Mix El Niño (B) and Central Pacific El Niño (C). Dotted areas are significant at the 90% level based on a two-tailed Student’s t-test.
During ENSO events in DJF, a horseshoe or boomerang-shaped pattern (e.g., Wang et al., 2000; Juneng and Tangang, 2005) is also noted between the equatorial Pacific SST anomalies inversely with those of the North and South Pacific. In EN events there are negative anomalies in the North and South Pacific and in LN events (not shown) the anomalies are positive in the Pacific extratropics.
Concerning atmospheric aspects, Hill et al. (2011) emphasize that in response to the displacement of the SST anomalies between EP and CP events, the large-scale circulation is also displaced throughout the atmosphere. According to Tedeschi (2013), it is noted that the upward movements in the Walker cell over the tropical Pacific are stronger and extend over a larger region during EP El Niño when compared to CP El Niño. These facts partly explain the precipitation anomalies in southeastern SA, stronger in EP El Niño.
In addition to changes in the atmospheric circulation over SA, variations in frequency and position of SST anomalies in the Pacific in different types of ENSO also have combined effects with other interannual, interdecadal, and multidecadal modes of variability and indexes, such as: Pacific Decadal Oscillation (PDO), Pacific Interdecadal Oscillation (IPO), Antarctic Oscillation (AAO), and Atlantic Multidecadal Oscillation (AMO)—Table 2. Specifically, about the PDO, analyses by Zhang et al. (1997), Kayano and Andreoli (2009), and Silva et al. (2011), among others, suggest that in the positive phase of the PDO (PDO+), higher frequencies and intensities of EN are noted, whereas in the negative phase (PDO-) there are more LN.
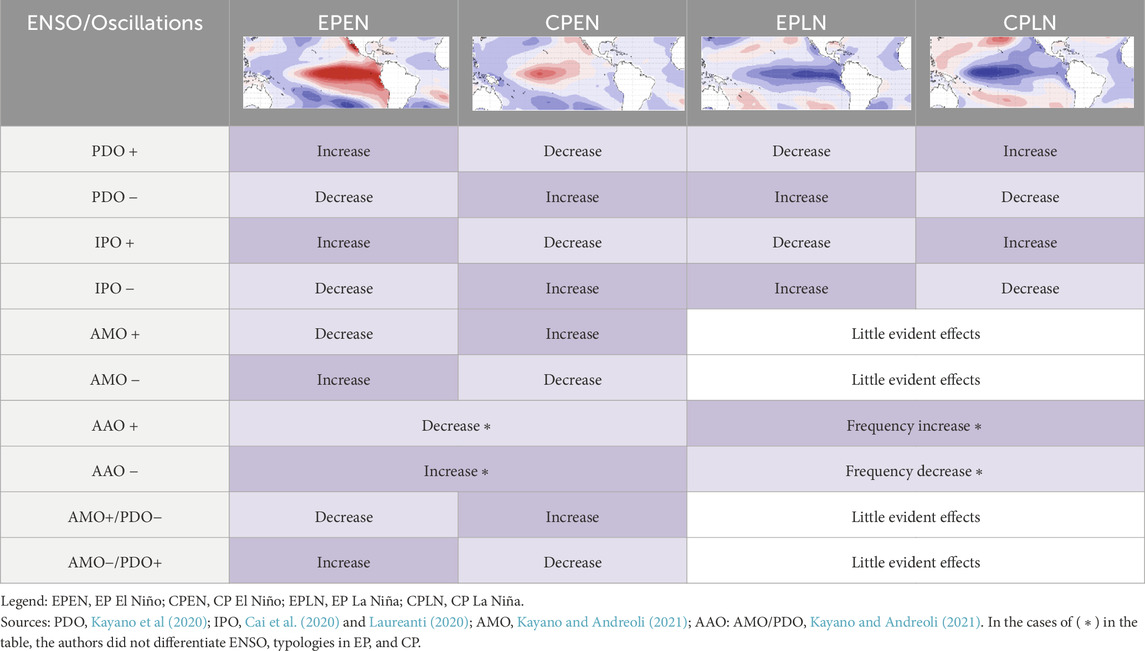
Table 2. Summary of the combined effects of oscillations on the frequency of different ENSO typologies based on previous findings by Carvalho et al. (2005); Kayano et al. (2020); Cai et al. (2020); Laureanti (2020); Kayano and Andreoli (2021).
Studies by Silva et al. (2011) indicate that in PDO+ the SST anomalies in the equatorial Pacific are stronger and located further east, whereas in PDO−, in addition to being less intense, the SST anomalies lie further west. This fact is in accordance with studies by Kayano and Andreoli (2021) that demonstrated that in PDO+ (PDO−) there is a predominance of EP El Niño (CP El Niño) and CP La Niña (EP La Niña). Kayano et al. (2009) also suggest that the PDO phase shift around 1976 may be linked to a higher frequency of CP events in subsequent years. This fact is consistent with the literature and with the ENSO classification presented in this study (Table 1).
In addition, the authors also identified inter-relationships with the AMO (Kayano and Andreoli, 2021), as shown in Table 2. Thus, it appears that in addition to the discussions and analyses regarding ENSO typologies, future studies investigating the combined effects between oscillations with different time scales are also necessary.
Regarding EN typologies and their association with rainfall variability, the analysis of seasonal rainfall anomaly composites for EP El Niño (see Table 1) allows us to infer that positive rainfall anomalies occur in all seasons of the year (Figures 5A, D, G, J), with emphasis on SON (0) and D (0) JF (+1) (Figures 5D, G).
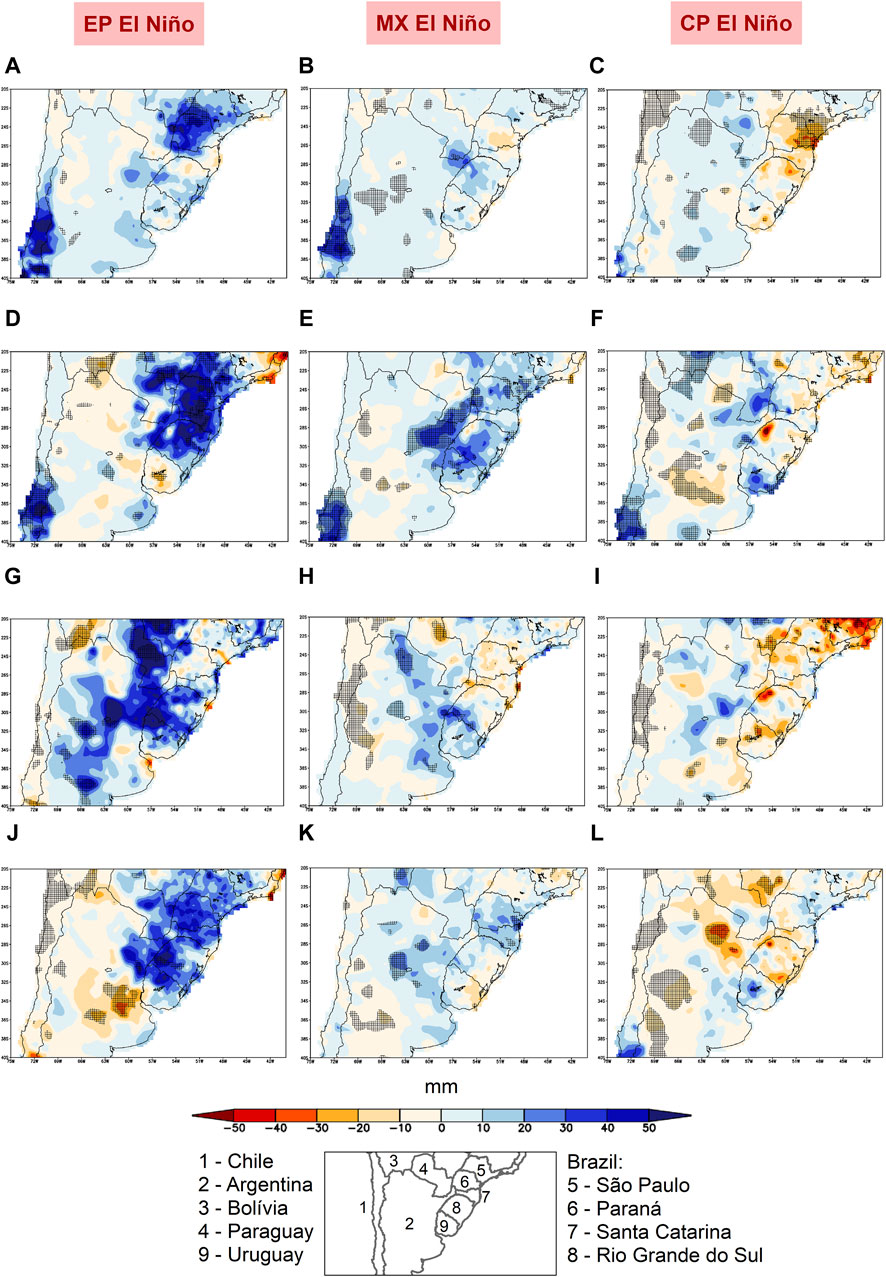
Figure 5. Composites of seasonal precipitation anomalies in southeastern South America during East Pacific El Niño (left column), Mix El Niño (middle column) and Central Pacific El Niño (right column). (A,B,C) JJA (0). (D,E,F) SON (0). (G,H,I) D(0)JF (+1). (J,K,L) MAM (+1). Hatched areas represent values with a significance level of 90%.
In JJA (0), positive rainfall anomalies stand out primarily in the state of Paraná (Brazil) and in a large portion of Chile (Figure 5A). In spring (SON0) and summer (D0JF+1), rainfall increases over southern states of Brazil, Paraguay, Uruguay, and spreads across Argentina (Figures 5D, G). In MAM (+1), positive anomalies are retracted mostly to southern and southeast Brazil while rainfall decreases over portions of Argentina and Chile (Figure 5J). These patterns reflect the most frequent conditions of EP El Niño events, with increased precipitation in southeastern SA, especially in spring (SON0) and summer (D0JF+1). Additionally, the heaviest precipitation in SON (0) in EP El Niño results from a stronger low-level jet (Figure 6D), carrying more moisture to the subtropics of SA. These processes were also found in studies by Tedeschi et al. (2015, 2016) and Cai et al. (2020). Studies by Andreoli et al. (2016) and Cai et al. (2020), demonstrate that the intensification of the Bolivian high system and the SALLJ contribute to the abnormally humid conditions in southeastern SA. The enhanced flow along the SACZ is also intensified in D0JF+1 (Figure 6G), contributing to increased rainfall, especially in southeastern Brazil, Paraguay and northern Argentina (Figure 5G).
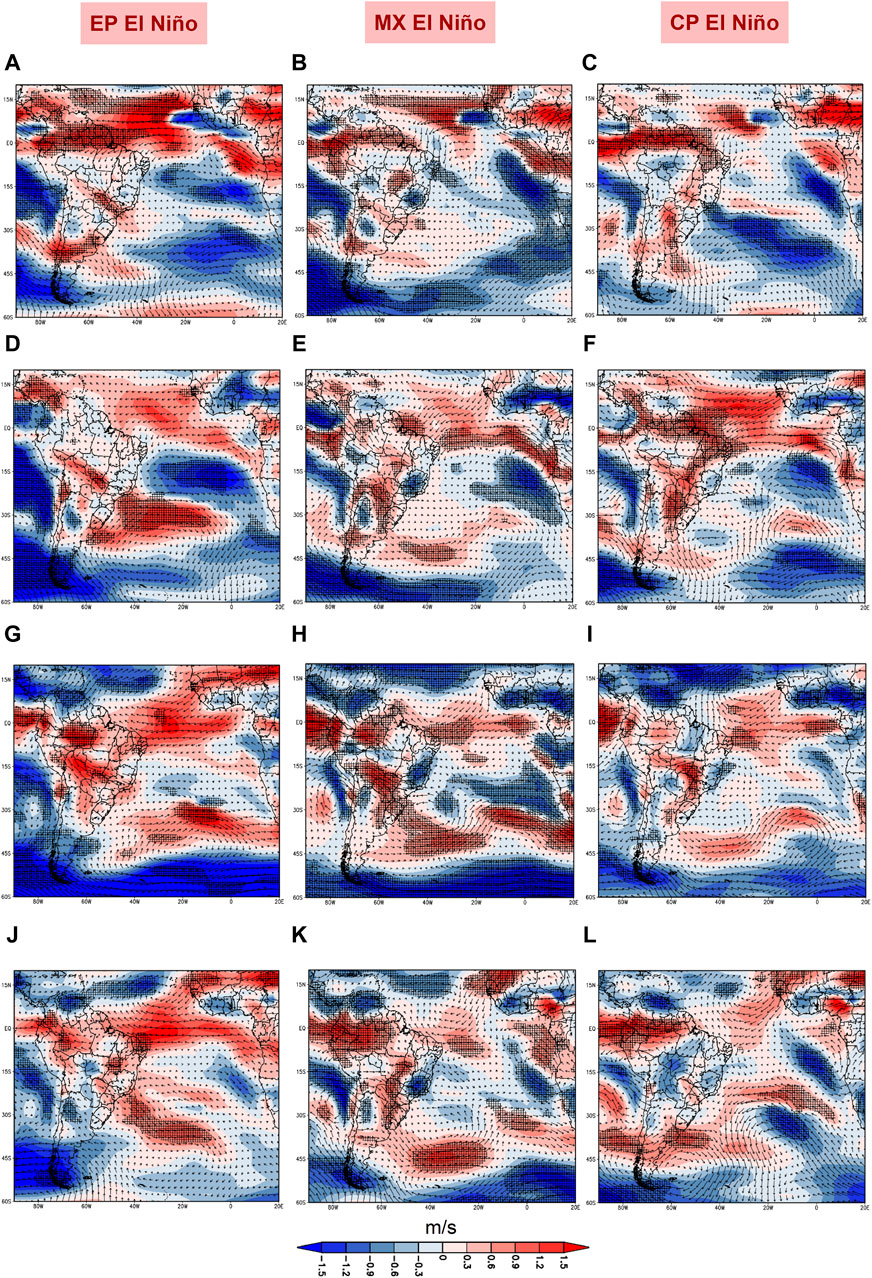
Figure 6. Composites of streamline anomalies and wind intensity (m/s) at 850 hPa over South America during East Pacific El Niño (left column), Mix El Niño (middle column) and Central Pacific El Niño (right column). (A,B,C) JJA (0). (D,E,F) SON (0). (G,H,I) D(0)JF (+1). (J,K,L) MAM (+1). Hatched areas represent values with a significance level of 90%.
Note that the typical pattern of EN events, with a decrease in precipitation in the north of the SA (not shown) and an increase in the southeast, is more pronounced for EP El Niño than for CP El Niño. This dynamic also stems from a stronger PSA (Pacific-South America—Mo and Higgins, 1998) pattern in EP El Niño, as also documented in Tedeschi et al. (2013), Kayano et al. (2016), Andreoli et al. (2016), and Cai et al. (2020).
The composition of seasonal precipitation anomalies for MX El Niño (see Table 1) show significant increases in rainfall compared to the climatological average in Central Chile during JJA (0) (Figure 5B) and SON (0), while in SON (0) and D (0) JF (+1), positive rainfall anomalies are concentrated in southern Brazil, Uruguay and the border with Argentina (Figures 5E, H), with small portions with statistical significance in D (0)JF (+1) and MAM (+1) (Figures 5H, K).
The composition of seasonal precipitation anomalies for CP El Niño (see Table 1) shows the predominance of negative precipitation anomalies, with particular emphasis in D (0) JF (+1) and MAM (+1)–Figures 5I, L, mostly without statistical significance. Punctual rainfall increases are verified only in SON (0) (Figure 5F), mostly without statistical significance. These results corroborate the analyzes by Goudard et al. (2022) when analyzing rainfall variability in southern Brazil associated with different types of ENSO. The authors found positive precipitation anomalies associated with CP El Niño only in the months of November and December (Goudard et al., 2022). According to Andreoli et al. (2016), above-normal rainfall in small areas of southeastern SA is associated with the PSA1 pattern during SON (0). Notably, the shift of SST anomalies to region Niño4 makes the effects on precipitation less evident in subtropical and extratropical regions of SA in CP El Niño compared to EP El Niño. Thus, for many seasons, there are negative precipitation anomalies for CP El Niño, which is not an expected rainfall pattern during traditional EN.
The 200 hPa vertical velocity anomalies (Figure 7) for the different types of EN corroborate the precipitation analyses described in Figure 5. Ascending anomalies (negative values) can be noted over Brazil in all seasons of the year in EP El Niño, with emphasis on SON (0) (Figure 7D) and D (0)JF (+1) (Figure 7G). In JJA (0) (Figure 7A) and MAM (+1) (Figure 7J) there are downward motion anomalies (positive values) in some parts of Argentina and Paraguay, however, only small portions show statistical significance. In MX El Niño, downward movements are noted in JJA (0) (Figure 7B) and MAM (+1) (Figure 7K) with statistical significance, not showing correspondences with precipitation pattern (Figure 5). In CP El Niño, downward movement anomalies (positive values) predominate in northern Argentina (Figure 7L).
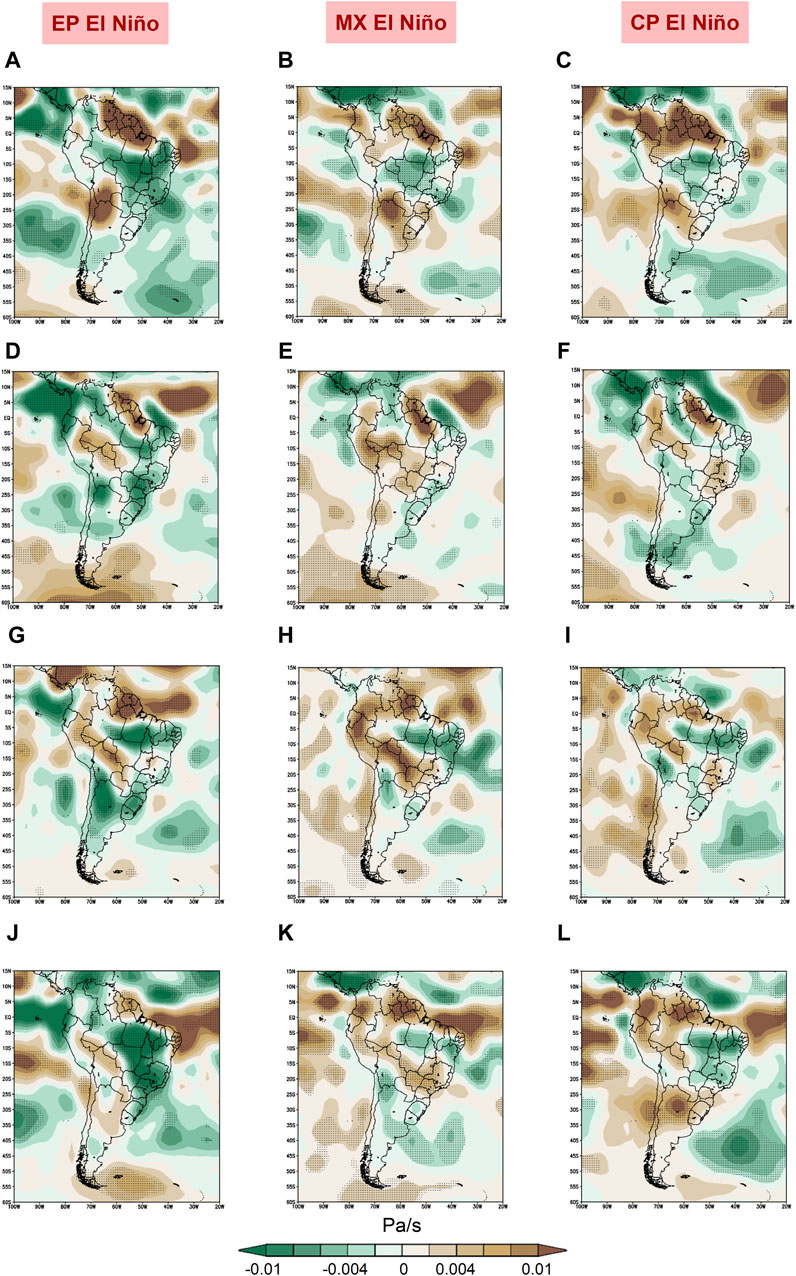
Figure 7. Composites of vertical velocity at 200 hPa over South America during East Pacific El Niño (left column), Mix El Niño (middle column) and Central Pacific El Niño (right column). (A,B,C) JJA (0). (D,E,F) SON (0). (G,H,I) D(0)JF (+1). (J,K,L) MAM (+1). Dotted areas show values with significant at the 90% level.
The atmospheric mechanisms linked to the typologies of EN are explored in the mapping of streamlines 850 hPa wind intensity (Figure 6) and in the 200 hPa zonal wind anomalies (Figure 8). For the rainiest periods of EPEN (SON0, especially), there is a configuration similar to SALLJ (Figure 6D) and the strengthening of the subtropical jet around 30°S over SA (Figure 8D). This configuration and the coupling of the subtropical jet and the SALLJ can intensify extratropical cyclones, cold fronts and mesoscale convective systems in the region, as pointed out by Silva Dias (1987) and Tedeschi et al. (2013). Furthermore, according to Martinez and Solman (2022), the strengthening of the subtropical jet is associated with extreme precipitation events in southeastern SA, which is consistent with the rainfall patterns found for EP El Niño, especially in spring and summer (Figures 5D, G).
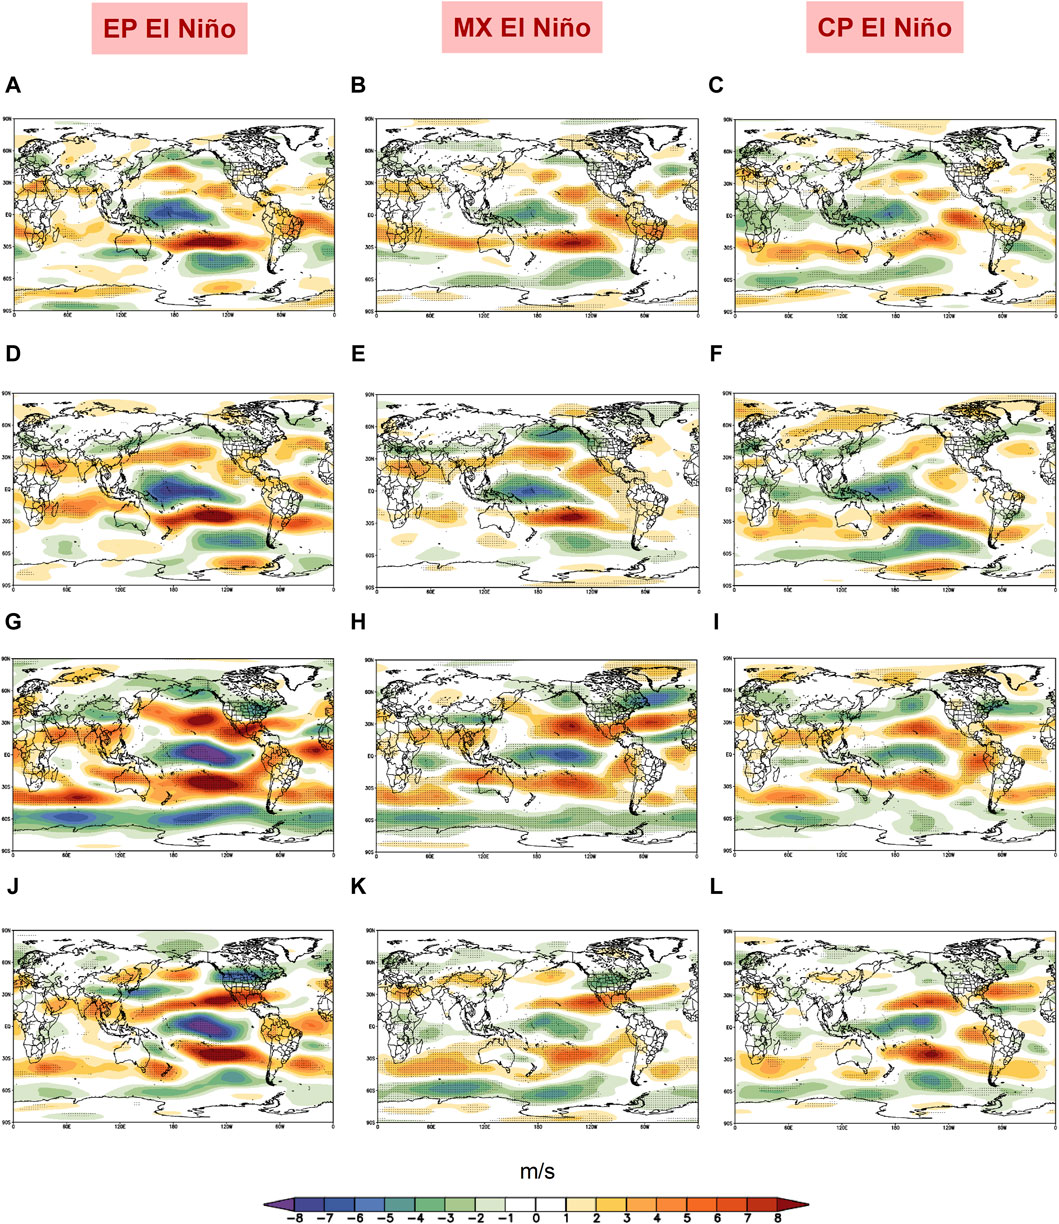
Figure 8. Composites of zonal wind anomaly at 200 hPa during East Pacific El Niño (left column), Mix El Niño (middle column) and Central Pacific El Niño (right column). (A,B,C) JJA (0). (D,E,F) SON (0). (G,H,I) D(0)JF (+1). (J,K,L) MAM (+1). Dotted areas show values with significant at the 90% level.
Silva and Ambrizzi (2006) emphasize that in strong EN, the SALLJ compounds follow a path slightly positioned south of the climatological circulation, with the maximum jet over northern Argentina, Paraguay and southern Brazil, as can be seen, above all, in SON (0) and D (0) JF (+1) (Figures 6D, G). During weak events, the SALLJ are displaced into the SACZ climatological zone (Silva and Ambrizzi, 2006). Thus, it is noted that during the EP El Niño, predominantly strong and extremely strong (Table 1), positive precipitation anomalies are more evident in southern Brazil (Figure 5–first column) in all seasons of the year. In MX El Niño events, similar but weaker patterns can be noted (Figures 6, 8–second column) compared to EP El Niño, which may explain the positive rainfall anomalies of lower intensity observed in this typology. On the other hand, in CP El Niño events, marked by the predominance of below-average precipitation (Figure 5–third column), there is a similar pattern to the weakening of the SALLJ (Figure 6–third column), promoting less transport of moisture from the Amazon and the tropical Atlantic, as well as the positioning of the subtropical jet at higher latitudes (around 40°S) (Figure 8–third column), which prevents precipitation.
In D (0) JF (+1) changes in precipitation (predominance of negative anomalies in the CP El Niño–Figure 5I) may be related to regional surface-atmosphere interactions caused by spring precipitation and soil moisture anomalies, according to Grimm (2003, 2004), when considering all types of ENSO. Studies of Hill et al. (2011) also demonstrate that in D (0) JF (+1) in CP El Niño events, the monsoon is suppressed with weakened moisture advection into the SACZ region, which contributes to the decrease in rainfall in southeastern SA.
In MAM (+1) negative anomalies predominate (Figure 5L), revealing marked differences compared to EP El Niño (Figure 5J). In EP El Niño, a cyclonic anomaly in the Southwest Atlantic and an anticyclonic anomaly in southern SA/adjacent South Atlantic (Figure 9J) result in a strengthening of the subtropical jet (Figure 8J) and, consequently, an increase in precipitation in southern Brazil (and part of the southeast) in autumn (Figure 5J). The increases in precipitation in this period are consistent with several floods that occurred during the autumn-winter of the decaying EN year (+1), as in 1983, 1987, 1992, and 1998 (Berri et al., 2002). In contrast, during the CP El Niño the subtropical jet is strengthened in the Southwest Atlantic (at approximately 40°S), which inhibits the northward propagation of synoptic systems (Tedeschi et al., 2013; Figure 8L).
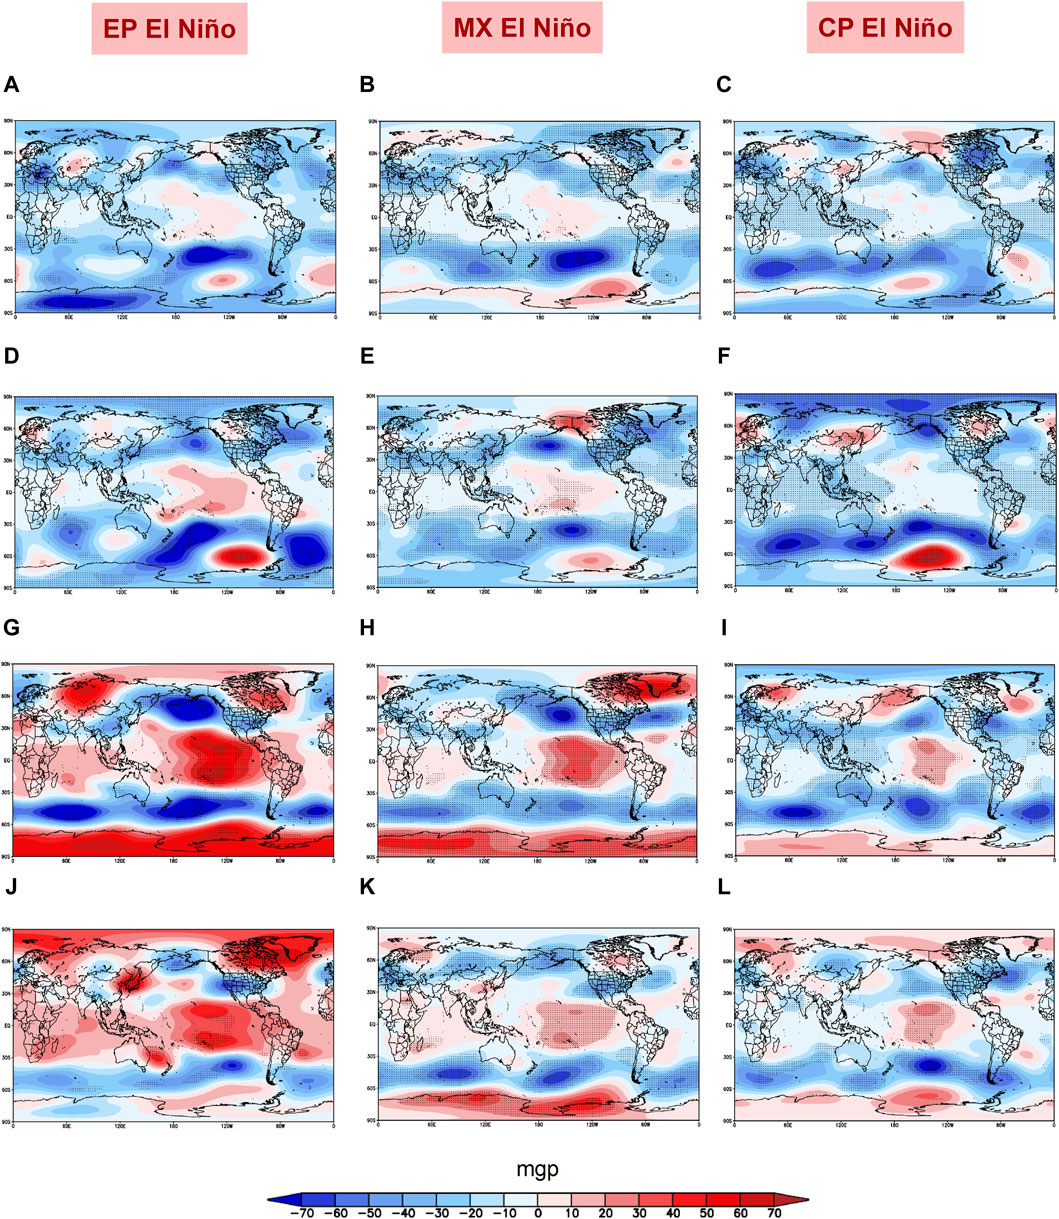
Figure 9. Composites of geopotential height anomaly at 200 hPa during East Pacific El Niño (left column), Mix El Niño (middle column) and Central Pacific El Niño (right column). (A,B,C) JJA (0). (D,E,F) SON (0). (G,H,I) D(0)JF (+1). (J,K,L) MAM (+1). Dotted areas show values with significant at the 90% level.
Therefore, in relation to atmospheric mechanisms, it appears that the SALLJ is stronger in EP El Niño (Figure 6–first column) compared to CP El Niño (Figure 6–third column). Specifically, in relation to the 200-hPa zonal wind anomaly (Figure 8), the better structured and more intense jet streams are noted in EP El Niño (Figure 8–first column). These conditions are only observed in spring for MX El Niño (Figure 8E) and CP El Niño (Figure 8F), which explains the positive precipitation anomalies in the periods mentioned for these EN typologies (Figures 5E, F).
Regarding large-scale atmospheric patterns, 200-hPa geopotential height anomaly (Figure 9), suggest better structured Rossby waves and the PSA pattern in EP El Niño (Figure 9–first column) events compared to MX El Niño (Figure 9–second column) and CP El Niño (Figure 9–third column). An equator-extratropic teleconnection pattern in the South Pacific is evident through the zonal wind at 200 hPa (Figure 8), which may act as a Rossby waveguide (Hoskins and Ambrizzi, 1993). This spatial pattern is associated with more intense anomalies in EP El Niño events (Figure 8–first column) than in MX El Niño and CP El Niño events (Figure 8–second and third columns). Thus, 200-hPa geopotential height anomalies are more intense in EP El Niño events, especially in the mature phase (D0JF+1) (Figure 9G). In the development phase of the EN events (JJA) there are a pair of high-level anticyclonic anomalies in the tropical Pacific, more intense and spatially comprehensive in EP El Niño events (Figure 9A). A Rossby wave train, with a pattern similar to the PSA mode (Mo and Paegle, 2001), begins to develop in JJA.
In the following quarter (SON) the PSA teleconnection is well configured in EP El Niño events (Figure 9D). Over southeastern SA, the anomalous ridge at 200 hPa favors divergence at high levels and, through mass conservation, upward vertical movements (Figure 7D), thus contributing to positive precipitation anomalies in southeastern SA (Figure 5D). On the other hand, in MX El Niño events, the Rossby wave train is meridionally symmetric between the equatorial Pacific and the Pacific sector of the Southern Ocean (Figure 9E). Over southeastern SA there is an anomalous trough with a weak barotropic structure, which favors positive precipitation anomalies in southeastern SA (Figure 5E). In CP El Niño events, a spatial pattern of zonally symmetric geopotential height anomalies is evident, with an anomalous trough between approximately 30°–60°S and an anomalous ridge in the Pacific sector of the Southern Ocean (Figure 9F). Over southeastern SA there are weak positive south and negative north anomalies of 200-hPa geopotential height.
In the mature stage of EN events (D0JF+1), 200-hPa geopotential height anomalies present a zonally symmetric spatial pattern in all EN typologies, with negative anomalies in the middle latitudes and positive anomalies in the low and high latitudes of the Southern Hemisphere (Figures 9G–I). This spatial pattern is most evident in EP El Niño events (Figure 9G). Over southeastern SA there is an anomalous ridge at high levels, which favors upward vertical movements (Figure 7G) and positive precipitation anomalies (Figure 5G). On the other hand, in MX El Niño and CP El Niño events the geopotential height anomalies are weak in southeastern SA (Figures 9H, I). Therefore, a spatial pattern of precipitation anomalies in this region is not evident (Figures 5H, I).
In the decay phase of EN events (MAM+1) there is a weakening of the zonally symmetric geopotential height anomalies in all EN typologies (Figures 9J–L). Even so, in EP El Niño events, the anomalous ridge persists at high levels over southeast SA (Figure 9J), which results in upward vertical movements (Figure 7J) and positive precipitation anomalies (Figure 5J). On the other hand, in MX El Niño and CP El Niño events the height anomalies are weak (Figures 9K, L).
Thus, circulation at low and high levels (850 hPa and 200 hPa), as well as large-scale patterns (geopotential height at 200 hPa) explain the variations in precipitation in southeastern SA in different EN typologies.
4 Discussion and conclusion
The present study allowed us to examine the rainfall variability in southeastern SA associated with different types of EN. In all seasons, rainfall anomalies are stronger for EP El Niño compared to CP El Niño. CP El Niño events are also weaker in terms of SST anomalies and only show increases in precipitation for the SON (0) period. In the EN there are changes in rainfall patterns, i.e., with positive anomalies (negative) of rain in EP El Niño (CP El Niño) in D (0) JF (+1), and with increases in precipitation in EP El Niño and decreases in CP El Niño in MAM (+1). These patterns are consistent with several studies by Hill et al. (2011), Brito (2011), Tedeschi (2013), Tedeschi et al. (2013), Andreoli et al. (2016), Tedeschi et al. (2015, 2016), and Cai et al. (2020).
In general, the difference in the location of maximum SST anomalies and their impacts on precipitation is attributed to a shift in large-scale atmospheric circulation patterns: the Walker cell in the tropics, the Rossby waves in the extratropics, and the circulation of low and high-level jet streams, as pointed out by several studies, such as Grimm (2003, 2004); Tedeschi et al. (2015, 2016) and Cai et al (2020), to cite a few. These processes, therefore, alter the moisture flux and rainfall anomalies in the study area. In this sense, it should be noted that the present study enables a regional analysis of the seasonal variability of precipitation in different EN typologies, based on literature that discusses the atmospheric teleconnections to SA. The previous studies emphasize the dipole pattern of EN in SA, without allowing for greater details of rainfall variability on regional scales, as proposed in the present study.
Thus, in addition to the inclusion of analyzes of MX events, this paper differs from previous studies by carrying out a regional approach centered on the southeast of the SA, allowing better details and spatialization of rainfall variability in the area of study, since the previous literature focuses the analyzes on the entire SA domain.
It is also noteworthy that although many studies have highlighted ENSO and its effects on climate aspects across the planet, several challenges still remain regarding its understanding, such as interactions with other interannual and interdecadal teleconnection patterns and the effects of global climate change. Among the natural climate variability modes that can interact with ENSO and require further combined analysis, we can mention Southern Annular Mode, the Indian Ocean Dipole, the Pacific Decadal Oscillation, the Interdecadal Pacific Oscillation, the Atlantic Multidecadal Variability, among others.
The results obtained here reinforce the need to analyze ENSO according to their typologies (EP, CP, and MX) and life cycle, and not only to consider the warm and cold phases of the phenomenon. These processes are fundamental to improving climate predictions at regional scales and providing better responses in terms of societal adaptation measures.
Data availability statement
The original contributions presented in the study are included in the article/Supplementary material, further inquiries can be directed to the corresponding author.
Author contributions
GG–Conceptualization, methodology, analysis and writing–original draft preparation. LL–Conceptualization, methodology, analysis and writing–revised version. CBC–Conceptualization, methodology, analysis and writing–revised version. All authors contributed to the article and approved the submitted version.
Acknowledgments
The first author acknowledges CAPES (Higher Education Personnel Improvement Coordination—Ministry of Education/Brazil) for the financial support of the research in the form of a doctoral scholarship. NOAA Extended SST V5 (ERSST) were provided by the NOAA, Boulder, Colorado, United States, from their website at https://psl.noaa.gov/data/gridded/data.noaa.ersst.v5.html and ONI index data at https://origin.cpc.ncep.noaa.gov/products/analysis_monitoring/ensostuff/ONI_v5.php. GPCC (GPCC Global Precipitation Climatology Centre) data were provided by Schneider et al. (2022) from the website at https://opendata.dwd.de/climate_environment/GPCC/html/fulldata-monthly_ v2022_doi_download.html. Wind, omega and geopotential height data were from NCEP/NCAR Reanalysis I (Kalnay et al., 1996), available at: https://psl.noaa.gov/data/gridded/data.ncep.reanalysis.html.
Conflict of interest
The authors declare that the research was conducted in the absence of any commercial or financial relationships that could be construed as a potential conflict of interest.
Publisher’s note
All claims expressed in this article are solely those of the authors and do not necessarily represent those of their affiliated organizations, or those of the publisher, the editors and the reviewers. Any product that may be evaluated in this article, or claim that may be made by its manufacturer, is not guaranteed or endorsed by the publisher.
References
Aceituno, P. (1988). On the functioning of the Southern Oscillation in the South American sector. Part I: surface climate. Mon. Weather Rev. 116, 505–524. doi:10.1175/1520-0493(1988)116<0505:otfots>2.0.co;2
Andreoli, R. V., Oliveira, S. S., Kayano, M. T., Viegas, J., Souza, R. A. F., and Candido, L. A. (2016). The influence of different El Niño types on the South American rainfall. Int. J. Climatol. Publ. online 37, 1374–1390. doi:10.1002/joc.4783
Ashok, K., Behera, S. K., Rao, S. A., Weng, H. Y., and Yamagata, T. (2007). El Niño Modoki and its possible teleconnection. J. Geophys. Res. 112, C11007. doi:10.1029/2006JC003798
Ashok, K., and Yamagata, T. (2009). The El Niño with a difference. Nature 461 (7263), 481–484. doi:10.1038/461481a
Barros, V. R., Grimm, A. M., and Doyle, M. E. (2002). Relationship between temperature and circulation in southeastern SouthSouth America and its influence from El Niño and La Niña events. J. Meteorological Soc. Jpn. 80, 21–32. doi:10.2151/jmsj.80.21
Berri, G. J., Ghietto, M. A., and García, N. O. (2002). The influence of ENSO in the flows of the Upper Paraná River of South America over the past 100 years. J. Hydrometeorol. 3 (1), 57–65. doi:10.1175/1525-7541(2002)003<0057:TIOEIT>2.0.CO;2
Brito, A. S. (2011). EL niño and el niño modoki impacts on south american rainfall. Dissertation. Sydney, Australia: The University of New South Wales.
Cai, W., McPhaden, M. J., Grimm, A. M., Rodrigues, R. R., Taschetto, A. S., Garreaud, R. D., et al. (2020). Climate impacts of the El niño–southern oscillation on South America. Nat. Rev. Earth Environ. 1 (4), 215–231. doi:10.1038/s43017-020-0040-3
Capotondi, A., Wittenberg, A. T., Newman, M., Di Lorenzo, E., Yu, J. Y., Braconnot, P., et al. (2015). Understanding ENSO diversity. Bull. Am. Meteorological Soc. 96 (6), 921–938. doi:10.1175/BAMS-D-13-00117.1
Carvalho, L. M., Jones, C., and Ambrizzi, T. (2005). Opposite phases of the Antarctic Oscillation and relationships with intraseasonal to interannual activity in the tropics during the austral summer. J. Clim. 18 (5), 702–718. doi:10.1175/JCLI-3284.1
Carvalho, L. M., Jones, C., and Liebmann, B. (2004). The South Atlantic convergence zone: intensity, form, persistence, and relationships with intraseasonal to interannual activity and extreme rainfall. J. Clim. 17 (1), 88–108. doi:10.1175/1520-0442(2004)017<0088:TSACZI>2.0.CO;2
Cavalcanti, I. F. A., and Kousky, V. E. (2009). “Frentes Frias sobre o Brasil,” in Tempo e Clima no Brasil. Editor I. F. A. Cavalcanti, (São Paulo, CA, USA: Oficina de Textos), 135–148.
Chen, D., Lian, T., Fu, C., Cane, M. A., Tang, Y., Murtugudde, R., et al. (2015). Strong influence of westerly wind bursts on El Niño diversity. Nat. Geosci. 8 (5), 339–345. doi:10.1038/ngeo2399
Chen, M., Li, T., Shen, X., and Wu, B. (2016). Relative roles of dynamic and thermodynamic processes in causing evolution asymmetry between El Niño and La Niña. J. Clim. 29 (6), 2201–2220. doi:10.1175/JCLI-D-15-0547.1
Drumond, A., Marengo, J., Ambrizzi, T., Nieto, R., Moreira, L., and Gimeno, L. (2014). The role of the Amazon Basin moisture in the atmospheric branch of the hydrological cycle: a Lagrangian analysis. Hydrology Earth Syst. Sci. 18 (7), 2577–2598. doi:10.5194/hess-18-2577-2014
Drumond, A. R. D. M., and Ambrizzi, T. (2006). Inter ENSO variability and its influence over the South American monsoon system. Adv. Geosciences 6, 167–171. doi:10.5194/adgeo-6-167-2006
Fernandes, L. G., and Grimm, A. M. (2023). ENSO modulation of global MJO and its impacts on South America. J. Clim. 36, 7715–7738. doi:10.1175/JCLI-D-22-0781.1
Gan, M. L., Rodrigues, L. R., and Rao, V. B. (2021). “Monção na américa do sul,” in Clima das regiões brasileiras e a variabilidade climática. Editors I. F. A. Cavalcanti, and N. J. Ferreira (São Paulo, CA, USA: Oficina de Textos), 133–144.
GGWS (2021). El Niño and La Niña years and intensities. https://ggweather.com/enso/oni.htm.
Goudard, G., Limberger, L., and Mendonça, F. A. (2022). Variabilité des précipitations au sud du Brésil et son association avec différents types d'El Niño - oscillation Australe (ENSO). Toulouse, Europe: 35ème colloque annuel de l’Association Internationale de Climatologie, 1–7.
Grimm, A. M. (2003). The El Niño impact on the summer monsoon in Brazil: regional processes versus remote influences. J. Clim. 16, 263–280. doi:10.1175/1520-0442(2003)016<0263:TENIOT>2.0.CO;2
Grimm, A. M. (2004). How do La Niña events disturb the summer monsoon system in Brazil? Clim. Dyn. 22 (2-3), 123–138. doi:10.1007/s00382-003-0368-7
Grimm, A. M. (2009). “Variabilidade interanual do clima do Brasil,” in Tempo e clima no Brasil. Editor I. F. A. Cavalcanti, (São Paulo, CA, USA: Oficina de Textos), 260–275.
Grimm, A. M. (2021). “Variabilidade climática interanual,” in Clima das regiões brasileiras e a variabilidade climática. Editors I. F. A. Cavalcanti, and N. J. Ferreira (São Paulo, CA, USA: Oficina de Textos), 96–113.
Grimm, A. M., Ferraz, S. E. T., and Gomes, J. (1998). Precipitation anomalies in southern Brazil associated with El Niño and La Niña events. J. Clim. 11 (10), 2863–2880. doi:10.1175/1520-0442(1998)011<2863:PAISBA>2.0.CO;2
Grimm, A. M., and Tedeschi, R. G. (2009). ENSO and extreme rainfall events in South America. J. Clim. 22, 1589–1609. doi:10.1175/2008JCLI2429.1
Hill, K. J., Taschetto, A. S., and England, M. H. (2009). South American rainfall impacts associated with inter-El Niño variations. Geophys. Res. Lett. 36 (19). doi:10.1029/2009GL040164
Hill, K. J., Taschetto, A. S., and England, M. H. (2011). Sensitivity of South American summer rainfall to tropical Pacific Ocean SST anomalies. Geophys. Res. Lett. 38, L01701. doi:10.1029/2010gl045571
Hoskins, B. J., and Ambrizzi, T. (1993). Rossby wave propagation on a realistic longitudinally varying flow. J. Atmos. Sci. 50 (12), 1661–1671. doi:10.1175/1520-0469(1993)050<1661:RWPOAR>2.0.CO;2
Hu, X., Eichner, J., Gong, D., Barreiro, M., and Kantz, H. (2023). Combined impact of ENSO and antarctic oscillation on austral spring precipitation in southeastern SouthSouth America (SESA). Clim. Dyn. 61, 399–412. doi:10.1007/s00382-022-06592-8
Huang, B., Thorne, P. W., Banzon, V. F., Boyer, T., Chepurin, G., Lawrimore, J. H., et al. (2017). Extended reconstructed Sea Surface temperature version 5 (ERSSTv5), upgrades, validations, and intercomparisons. J. Clim. 30, 8179–8205. doi:10.1175/JCLI-D-16-0836.1
Juneng, L., and Tangang, F. T. (2005). Evolution of ENSO-related rainfall anomalies in Southeast Asia region and its relationship with atmosphere-ocean variations in Indo-Pacific sector. Clim. Dyn. 25, 337–350. doi:10.1007/s00382-005-0031-6
Kalnay, E., Kanamitsu, M., Kistler, R., Collins, W., Deaven, D., Gandin, L., et al. (1996). The NCEP/NCAR 40-year reanalysis project. Bull. Am. meteorological Soc. 77 (3), 437–471. doi:10.1175/1520-0477(1996)077<0437:TNYRP>2.0.CO;2
Kao, H.-Y., and Yu, J.-Y. (2009). Contrasting eastern-Pacific and central-Pacific types of ENSO. J. Clim. 22, 615–632. doi:10.1175/2008JCLI2309.1
Kayano, M. T., and Andreoli, R. (2009). “Variabilidade decenal e multidecenal,” in Tempo e Clima no Brasil. Editor I. F. A. Cavancanti, (São Paulo, CA, USA: Oficina de Textos), 375–383.
Kayano, M. T., and Andreoli, R. V. (2021). “Variabilidade decenal e multidecenal,” in Clima das regiões brasileiras e a variabilidade climática. Editors I. F. A. Cavalcanti, and N. J. Ferreira (São Paulo, CA, USA: Oficina de Textos), 114–132.
Kayano, M. T., Andreoli, R. V., and de Souza, R. A. (2020). Pacific and Atlantic multidecadal variability relations to the El Niño events and their effects on the South American rainfall. Int. J. Climatol. 40 (4), 2183–2200. doi:10.1002/joc.6326
Kayano, M. T., Andreoli, R. V., and De Souza, R. A. F. (2019). El niño-southern oscillation related teleconnections over SouthSouth America under distinct atlantic multidecadal oscillation and pacific interdecadal oscillation backgrounds: La Niña. Int. J. Climatol. 39 (3), 1359–1372. doi:10.1002/joc.5886
Kayano, M. T., Andreoli, R. V., Souza, R. A. F., Garcia, S. R., and Calheiros, A. J. (2016). El Niño e La Niña dos últimos 30 anos: diferentes tipos. Rev. Climanalise. Edição Comemorativa 30, 7–12.
Kayano, M. T., de Oliveira, C. P., and Andreoli, R. V. (2009). Interannual relations between South American rainfall and tropical sea surface temperature anomalies before and after 1976. Int. J. Climatol. 29 (10), 1439–1448. doi:10.1002/joc.1824
Kug, J.-S., Jin, F.-F., and An, S.-I. (2009). Two types of El Niño events: cold tongue El Niño and warm pool El Niño. J. Clim. 22, 1499–1515. doi:10.1175/2008JCLI2624.1
Laureanti, N. C. (2020). “A influência de modos de variabilidade de TSM de diferentes escalas nas características de precipitação na América do Sul,” in 185f. Dissertação (mestrado em engenharia ambiental), setor de Tecnologia (Curitiba, BR, USA: Universidade Federal do Paraná).
Lee, T., and McPhaden, M. J. (2010). Increasing intensity of El Niño in the central-equatorial pacific. Geophys. Res. Lett. 37, L14603. doi:10.1029/2010GL044007
Liebmann, B., Kiladis, G. N., Vera, C. S., Saulo, A. C., and Carvalho, L. M. (2004). Subseasonal variations of rainfall in South America in the vicinity of the low-level jet east of the Andes and comparison to those in the South Atlantic convergence zone. J. Clim. 17 (19), 3829–3842. doi:10.1175/1520-0442(2004)017<3829:SVORIS>2.0.CO;2
Liebmann, B., and Mechoso, C. R. (2011). “The South American monsoon system,” in The global monsoon system: research and forecast (Berlin, Germany: Springer), 137–157. doi:10.1142/9789814343411_0009
Lin, J., and Qian, T. (2019). A new picture of the global impacts of El Nino-Southern oscillation. Sci. Rep. 9 (1), 17543–17547. doi:10.1038/s41598-019-54090-5
Marengo, J. A., Soares, W. R., Saulo, C., and Nicolini, M. (2004). Climatology of the low-level jet east of the Andes as derived from the NCEP–NCAR reanalyses: characteristics and temporal variability. J. Clim. 17, 2261–2280. doi:10.1175/1520-0442(2004)017<2261:COTLJE>2.0.CO;2
Martinez, D. M., and Solman, S. A. (2022). Synoptic patterns associated with extreme precipitation events over southeastern South America during spring and summer seasons. Int. J. Climatol. 42, 10387–10406. doi:10.1002/joc.7911
McPhaden, M. J., Lee, T., and McClurg, D. (2011). El Niño and its relationship to changing background conditions in the tropical Pacific Ocean. Geophys. Res. Lett. 38, L15709. doi:10.1029/2011GL048275
Mo, K. C., and Higgins, R. W. (1998). The Pacific–South American modes and tropical convection during the Southern Hemisphere winter. Mon. Weather Rev. 126 (6), 1581–1596. doi:10.1175/1520-0493(1998)126<1581:TPSAMA>2.0.CO;2
Mo, K. C., and Paegle, J. N. (2001). The Pacific–South American modes and their downstream effectsInternational Journal of Climatology: A Journal of the Royal Meteorological Society 21 (10), 1211–1229. doi:10.1002/joc.685
Okumura, Y. M. (2019). ENSO diversity from an atmospheric perspective. Curr. Clim. Change Rep. 5, 245–257. doi:10.1007/s40641-019-00138-7
Philander, S. G. (1990). El Niño, La Niña and southern oscillation. San Diego, CA, USA: Academic Press.
Reboita, M. S., Gan, M. A., da Rocha, S. P., and Ambrizzi, T. (2010). Regimes de precipitação na América do Sul: uma revisão bibliográfica. Rev. Bras. Meteorol. 25, 185–204. doi:10.1590/S0102-77862010000200004
Ren, H.-L., and Jin, F.-F. (2011). Niño indices for two types of ENSO. Geophys. Res. Lett. 38, L04704. doi:10.1029/2010GL046031
Robledo, F. A., Penalba, O. C., and Bettolli, M. L. (2013). Teleconnections between tropical-extratropical oceans and the daily intensity of extreme rainfall over Argentina. Int. J. Climatol. 33, 735–745. doi:10.1002/joc.3467
Rodrigues, R. R., Haarsma, R. J., Campos, E. J. D., and Ambrizzi, T. (2011). The impacts of inter-El Nino variability on the Tropical Atlantic and Northeast Brazil climate. J. Clim. 24, 3402–3422. doi:10.1175/2011JCLI3983.1
Rodrigues, R. R., and Mcphaden, M. J. (2014). Why did the 2011-12 La Niña cause a severe drought in the Brazilian Northeast? Geophys. Res. Lett. 41 (3), 1012–1018. doi:10.1002/2013GL058703
Schneider, U., Hänsel, S., Finger, P., Rustemeier, E., and Ziese, M. (2022). GPCC full data monthly product version 2022 at 0.25°: monthly land-surface precipitation from rain-gauges built on GTS-based and historical data. doi:10.5676/DWD_GPCC/FD_M_V2022_025
Silva, G. A. M., and Ambrizzi, T. (2006). Inter-El Niño variability and its impact on the South American low-level jet east of the Andes during austral summer− two case studies. Adv. Geosciences 6, 283–287. doi:10.5194/adgeo-6-283-2006
Silva, G. A. M., and Ambrizzi, T. (2010). Summertime moisture transport over Southeastern South America and extratropical cyclones behavior during inter-El Niño events. Theor. Appl. Climatol. 101, 303–310. doi:10.1007/s00704-009-0218-6
Silva, G. A. M., Ambrizzi, T., and Marengo, J. A. (2009). Observational evidences on the modulation of the South American low level jet east of the Andes according the ENSO variability. Ann. Geophys. 27 (2), 645–657. doi:10.5194/angeo-27-645-2009
Silva, G. A. M., Drumond, A., and Ambrizzi, T. (2011). The impact of El Niño on South American summer climate during different phases of the pacific decadal oscillation. Theor. Appl. Climatol. 106, 307–319. doi:10.1007/s00704-011-0427-7
Silva Dias, M. A. F. (1987). Sistemas de Mesoescala e Previsão de Tempo à Curto Prazo. Rev. Bras. Meteorol. 2, 133–150.
Tedeschi, R. G. (2013). As influências de tipos diferentes de ENOS na precipitação e nos seus eventos extremos sobre a América do Sul - observações, simulações e projeções. 256f. Tese Doutorado em Meteorol. – Inst. Nac. Pesqui. Espac. São José dos Campos.
Tedeschi, R. G., Cavalcanti, I. F. A., and Grimm, A. M. (2013). Influences of two types of ENSO on South American precipitation. Int. J. Climatol. 33, 1382–1400. doi:10.1002/joc.3519
Tedeschi, R. G., Grimm, A. M., and Cavalcanti, I. F. A. (2015). Influence of Central and East ENSO on extreme events of precipitation in South America during austral spring and summer. Int. J. Climatol. 35 (8), 2045–2064. doi:10.1002/joc.4106
Tedeschi, R. G., Grimm, A. M., and Cavalcanti, I. F. A. (2016). Influence of Central and East ENSO on precipitation and its extreme events in South America during austral autumn and winter. Int. J. Climatol. 36 (15), 4797–4814. doi:10.1002/joc.4670
Trenberth, K. E., and Caron, J. M. (2000). The Southern Oscillation revisited: sea level pressures, surface temperatures and precipitation. J. Clim. 13, 4358–4365. doi:10.1175/1520-0442(2000)013<4358:TSORSL>2.0.CO;2
Tucci, C. E., Dias, P., Clarke, R., Collischonn, W., and Sampaio, G. (2003). “Comparison of flow forecasts by runoff models: a case study from southern Brazil,” in Water Resources systems – water availability and global change. Editor S. W. Franks (Oxford, UK: International Association of Hydrological Sciences Publication), 280, 142–148.
Wang, B., Wu, R., and Fu, X. (2000). Pacific-East asian teleconnection: how does ENSO affect east asian climate? J. Clim. 13, 1517–1536. doi:10.1175/1520-0442(2000)013<1517:PEATHD>2.0.CO;2
Wang, C., Deser, C., Yu, J.-Y., Dinezio, P., and Clement, A. (2016). “El Niño – southern oscillation (ENSO): a review,” in Coral reefs of the eastern pacific. Editors P. Glymn, D. Manzello, and I. Enochs (Berlin, Germany: Springer Science Publisher), 85–106. doi:10.1007/978-94-017-7499-4_4
Wolter, K., and Timlin, M. S. (2011). El Niño/Southern Oscillation behaviour since 1871 as diagnosed in an extended multivariate ENSO index (MEI.ext). Int. J. Climatol. 31, 1074–1087. doi:10.1002/joc.2336
Yeh, S. W., Kug, J. S., Dewitte, B., Kwon, M.-H., Kirtman, B. P., and Jin, F.-F. (2009). El Niño in a changing climate. Nature 461, 511–514. doi:10.1038/nature08316
Yu, J. Y., and Kim, S. T. (2013). Identifying the types of major El Niño events since 1870. Int. J. Climatol. 33, 2105–2112. doi:10.1002/joc.3575
Zhang, Y., Wallace, J. M., and Battisti, D. S. (1997). ENSO-like interdecadal variability: 1900–93. J. Clim. 10 (5), 1004–1020. doi:10.1175/1520-0442(1997)010<1004:ELIV>2.0.CO;2
Keywords: atmospheric teleconnections, ENSO types, precipitation anomalies, GPCC, South America rainfall
Citation: Goudard G, Limberger L and Carpenedo CB (2024) Influence of Eastern, Central and Mix El Niño on the variability of rainfall in southeastern South America. Front. Earth Sci. 12:1134782. doi: 10.3389/feart.2024.1134782
Received: 30 December 2022; Accepted: 22 March 2024;
Published: 09 April 2024.
Edited by:
Maria Elisa Siqueira Silva, University of São Paulo, BrazilReviewed by:
Renata Goncalves Tedeschi, Vale Technological Institute (ITV), BrazilBushra Khalid, Chinese Academy of Sciences (CAS), China
Andrea Taschetto, University of New South Wales, Australia
Copyright © 2024 Goudard, Limberger and Carpenedo. This is an open-access article distributed under the terms of the Creative Commons Attribution License (CC BY). The use, distribution or reproduction in other forums is permitted, provided the original author(s) and the copyright owner(s) are credited and that the original publication in this journal is cited, in accordance with accepted academic practice. No use, distribution or reproduction is permitted which does not comply with these terms.
*Correspondence: Gabriela Goudard, gabigoudard.ufpr@gmail.com
†These authors have contributed equally to this work