Geochemical characteristics of Anak Krakatau’s (Indonesia) lava in the past half-century
 Dini Nurfiani1*
  Taufik Ismail1,2,3
  Aditya Pratama1,2
  Niken Angga Rukmini4
  Mirzam Abdurrachman2,3
  Idham Andri Kurniawan2,3
  Windi Anarta Draniswari1 Wilfridus Ferdinando Supriyadi Banggur1,2
  Putu Billy Suryanata1,5
- 1Research Center for Geological Disaster, National Research and Innovation Agency, Bandung, Indonesia
- 2Faculty of Earth Sciences and Technology, Bandung Institute of Technology, Bandung, Indonesia
- 3Department of Geology, Indonesia College of Mineral Technology, Bandung, Indonesia
- 4Balai Penyelidikan dan Pengembangan Teknologi dan Kebencanaan Geologi, Center for Volcanology and Geological Hazard Mitigation, Geological Agency of Indonesia, Yogyakarta, Indonesia
- 5Faculty of Mining and Petroleum Engineering, Bandung Institute of Technology, Bandung, Indonesia
1 Introduction
Anak Krakatau Volcano is located in the Sunda Strait, between Sumatra and Java islands, and surrounded by three islands (i.e., Panjang, Rakata, and Sertung), which are the remnants of ancient Krakatau. After the last caldera-forming eruption in 1883, the activity of the volcano resumed in 1927 with Surtseyan eruptions (Camus et al., 1987; Schipper and White, 2016), which later formed Anak Krakatau (AK). Since then, AK has erupted frequently, every 1 to 3 years, with a Volcanic Explosivity Index (VEI) of 1–2, except for the 2018 eruption, whose VEI of 3 (Global Volcanism Program, 2023) led to the flank collapse event that caused tsunamis. Since that event, the volcano has produced episodic eruptions until the present (end of 2023) (Global Volcanism Program, 2023).
Previous petrological and geochemical studies at AK predominantly involved products from the early eruptive history of AK (see Supplementary Table S1). The post-1996 products consisting of lava flow, ballistic blocks, and scoria from pyroclastic deposits are basaltic andesite in composition (Ardian et al., 2022). A few studies have been reported on the chemical compositions of recent eruptive materials. Fiantis et al. (2021) analyzed the 2018 volcanic deposits, i.e., ash and lapilli, resulting in two group compositions with a low SiO2 content (mean 39.01 wt%) and basaltic andesite (mean 54.93 wt%). Cutler et al. (2022) also reported the groundmass glass compositions of 2018 ash samples, which are andesitic. The latest lava product analyzed was from the 2020 eruption and has a basaltic composition, as reported by Pratama et al. (2023). They also analyzed older products of Krakatau even prior to the 1883 caldera-forming eruption, which were more evolved in composition, i.e., andesitic to rhyolitic.
Meanwhile, it can be proposed that the Anak Krakatau plumbing system consists of multiple magma storage regions, with depths ranging from intermediate to up to 26 km (Dahren et al., 2012; Agangi and Reddy, 2016; Pratama et al., 2023). Gardner et al. (2012) also revealed a complex plumbing system consisting of many small but shallow magma pockets beneath Anak Krakatau. Madden-Nadeau et al. (2021) suggested that different melt-rich regions in the shallow system coalesced and mixed over certain periods, leading to the 1883 climactic eruption. Continuous integrated multi-discipline studies are crucial to monitoring the evolution of the Anak Krakatau volcanic activity. Recent visual, seismicity, and deformation data analyses infer the potential hazards from the current activity with lava flows, ballistics, and volcanic ash resulting from Vulcanian and/or Strombolian eruptions (Kristianto et al., 2021).
Not many of these studies measured the matrix–glass compositions, which are commonly used for inferring magma differentiation and/or the evolution of magma compositions through time, combined with both (1) whole-rock and (2) mineral (titanomagnetite) compositions (de Maisonneuve et al., 2021; Keller et al., 2023). Our study provides a compilation of petrological and geochemical data on the lava products of 1973—2017, including the major element compositions of whole-rock, matrix-glass, and minerals. The aim of this study is to investigate the temporal evolution of magma composition at Anak Krakatau. We first performed petrography analysis to determine mineral assemblages and their proportions. The analysis of the chemistry and proportion of minerals in samples produced from different eruptions would infer whether or not there are any changes in the magma storage conditions. The matrix–glass compositions are also used to track magma differentiation in the past half-century. In addition, we applied crystal size distribution (CSD) (Cashman and Marsh, 1988) to obtain the (plagioclase) crystal residence times. The crystals formed in magma storage reflect the crystal growth rate and duration the magma remained stalled at a certain depth (Marsh, 1988; Higgins, 2000; Morgan and Jerram, 2006). Therefore, the plagioclase crystal residence time could indicate magma residence times in the reservoir.
This study provides valuable data as sampling older lava products can no longer be done since they have vanished along with the collapse of the west sector of the Krakatau volcanic edifice during the 2018 eruption (Grilli et al., 2019; Williams et al., 2019; Omira and Ramalho, 2020; Perttu et al., 2020; Zengaffinen et al., 2020). According to Pratama et al. (2023), AK is currently in the incubation phase in terms of a caldera cycle concept. De Maisonneuve et al. (2021) defined the incubation or “preheating” phase as the thermal maturation of the crust when mafic magmas migrate through the pre-existing crust. The characteristics of this phase are indicated by mafic products from frequent and small eruptions (VEI 1–2), as shown by the recent Anak Krakatau activity. Therefore, this study could offer basic information regarding the AK eruptive products over time, which can contribute to monitoring the possible temporal changes in a caldera cycle.
2 Samples
We used 13 lava samples obtained from the volcano-stratigraphy study of Ismail et al. (2020), where the sampling location sites are shown in Supplementary Figure S1. All the samples of Ismail et al. (2020), which are mostly from Anak Krakatau eruptive products, were stored in a workshop room at the Department of Geology, Indonesia, College of Mineral Technology. Following up on the volcano-stratigraphy study, we recently analyzed all the Anak Krakatau lava samples spanning from 1973 until 2017. The lava flow deposits are characterized as auto-breccia and aa lava, where the latter dominates the most. In general, the samples have a porphyritic texture and are mostly grayish in color, except for a few samples showing a reddish color, i.e., the 2014/ST73 product (Supplementary Figure S2). Hand sample observations show that the lava products of 1981, 1992, 1997, 1999, 2007, 2012, and 2017 are crystal-rich, while the rest have a relatively low crystal content.
3 Methods
The loss on ignition (LOI) measurement was done on dry powder samples using a Carbolite HTF High-Temperature Chamber Furnace (Carbolite Gero, United Kingdom) at the Advanced Characterization Laboratory, National Research and Innovation Agency of Republic Indonesia (Badan Riset dan Inovasi Nasional—BRIN). The LOI measurements were carried out twice on each sample and averaged. Approximately 1 g of the sample was heated to 105°C–110°C and then placed in a porcelain bowl whose weight was already known. It was heated to 400°C for 30 min before the temperature was increased to 1,000°C and left for 20 min. Afterward, the sample was cooled in a desiccator vacuum for 20 min and then weighed.
The whole-rock compositions of all samples were measured on pressed pellets using a Bruker S2 Puma XY X-Ray Fluorescence (XRF) spectrometer with a power of 50 W, a current of 2 mA, and an accelerating voltage of 50 kV at the Advanced Characterization Laboratories Serpong, National Research and Innovation Agency (Badan Riset dan Inovasi Nasional, BRIN). The spectrometer was calibrated using the FluXana FLX-K04/BAXS-S2 glass disc that was also used for drift monitoring. All samples were thin-sectioned for further analyses. The thin sections (0.03-mm-thick) were examined under an optical microscope to determine mineral assemblages and abundances. We determined the mineral percentage through visual semi-quantitative estimation, relying on a mineralogical chart for reference. Observations were conducted on five sections of the thin section, specifically in the upper right, upper left, middle, lower right, and lower left regions. Each section included a circular region with a diameter of 2 mm. The mineral percentage values for each section were then averaged to obtain modal mineral composition data that represented the respective thin section. This visual approach aids us in quickly estimating mineral percentages. The potential for errors exists, predominantly in the form of overestimating small percentages. To mitigate such errors, we employ the visual chart proposed by Reid (1985) for percentages below 1% and refer to the methodology outlined by Terry and Chilingar (1955) for percentages exceeding 1%.
The surface of thin sections was polished using a series of successive diamond pastes (6, 3, 1, and ¼ µm) and then examined using a scanning electron microscope (FEI Quanta 650 FEG) equipped with an energy dispersive X-ray spectroscopy (EDS) detector at Badan Penyelidikan dan Pengembangan Teknologi Kebencanaan Geologi (BPPTKG Yogyakarta)—Center for Volcanology and Geological Hazard Mitigation (CVGHM) to measure the compositions of minerals, matrix–glass, and/or melt inclusions. The backscattered electron images were taken with an accelerating voltage range of 10–20 kV and a spot size varying between 4 and 5. Meanwhile, EDS data were acquired using the point analysis method and measured for 5 s. Data acquisition uses AZtec (Oxford Instruments NanoAnalysis-OINA MicroAnalysis System), and the data were qualitatively calibrated. The results of the measurements were then normalized to 100%. For control, the laboratory carried out a backtest with the MPI-DING reference glasses (Supplementary Table S1). The compositions are reported in atomic percentage elements of O, Si, Al, Ca, Mg, Na, K, Fe, Mn, Ti, P, and Cr and then converted to oxides (weight %) via stoichiometry.
Furthermore, we applied crystal size distribution (CSD) analysis to infer the duration of the residing magma in the storage. Determining the crystal size distribution was done through several steps: 1) approximately 10–20 thin-section images were taken for each sample using an optical microscope, 2) the taken images were digitized for each mineral present using image analysis software ImageJ (Rasband, 1997), and 3) the digitized images, with at least 400 crystals digitized for each sample, were then analyzed using crystal size distribution (CSD) corrections (Higgins, 2000). We only digitized for phenocrysts (>0.5 mm) and microphenocrysts (0.05–0.5 mm). The data obtained from CSD are parameters in 2D (Morgan and Jerram, 2006), while the data required for analysis are 3D parameters (Mock and Jerram, 2005). The 3D parameters were estimated through conversion using a CSD-Slice worksheet created by Klein et al. (2017). The CSD results relate the population density to the crystal size. The population density (n) is defined as a total of measured crystals (N) for every crystal size (L) (Marsh, 1988).
The log-normal distribution diagram shows the values of the slope and intercept. Those values are used to estimate the duration of residing magma (T). The magma residence time is categorized into two crystal formations: microphenocryst and phenocryst. G is a constant of the crystal growth rate, and its value for the formation of plagioclase micro- and phenocrysts is 10–10 mm/s, as obtained by Cashman (1993), from studying the changes in the crystal size as the basaltic melt temperature decreased. This value was also used by Innocenti et al. (2013) and Nugroho et al. (2019) to calculate the residence time of lava from Mount Lasem and Merapi (Indonesia), respectively.
4 Results
4.1 Whole-rock and matrix–glass compositions
The whole-rock compositions of all samples are mostly basaltic (Figure 1A, Supplementary Table S2); however, other previous studies reported that older lavas are basaltic andesite. The most mafic lava in our samples with the lowest SiO2 (48.63 wt%) and total alkali (3.58 wt%) contents is the 1993 lava, while the highest SiO2 (52.35 wt%) and total alkali (4.26 wt%) contents are owned by the 1997 lava. All lava samples are characterized by medium-K calc-alkaline, but iron enrichment with 8.5–12 wt% FeO (total) shifted to an arc tholeiitic series (Supplementary Figure S3). In addition, all the samples can be categorized as high-alumina basalt due to their high Al2O3 content (21–22 wt%) (Supplementary Table S2; Supplementary Figure S4). Other major elements, i.e., FeO (total) and CaO, appear to have a negative trend, while MgO seems to show a positive trend in the variation diagrams against the silica content (Supplementary Figure S4).
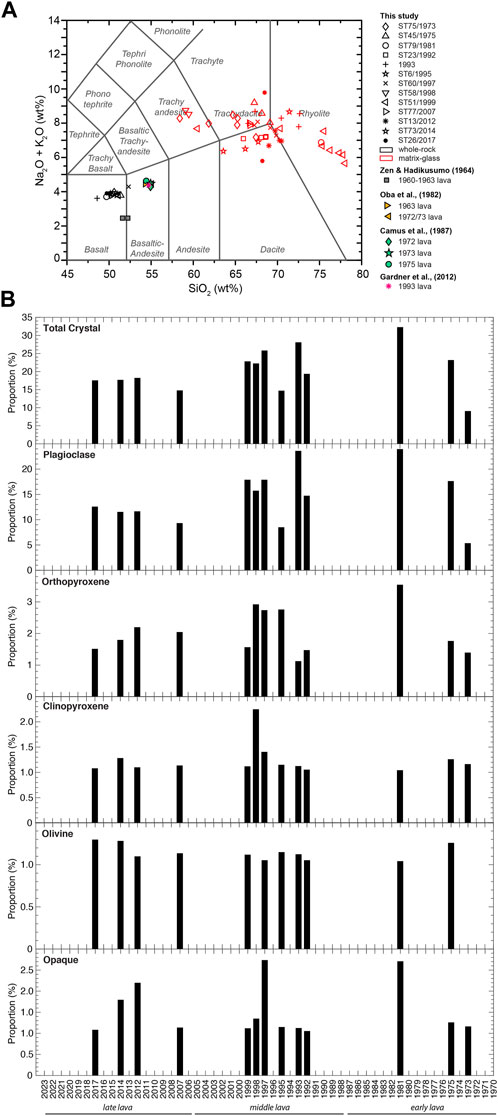
FIGURE 1. (A) Total alkali silica diagram for whole-rock and matrix–glass compositions following the plot of Bas et al. (1986). Lava samples before 1994 are provided and obtained from the studies of Zen and Hadikusumo (1964), Oba et al. (1982), Camus et al. (1987), and Gardner et al. (2012). (B) Mineral assemblage and proportion for all lava samples (vesicle-free basis).
Although the whole-rock compositions are basaltic, their matrix–glass compositions are more evolved, and most of them are dacitic–rhyolitic (Figure 1A; Supplementary Table S3). Even the earlier 1973 lava has andesitic–dacitic matrix–glass compositions. Figure 1A shows that the matrix–glass compositions have a dominant SiO2 content of ∼60–70 wt%. However, the 1999 lava has the most evolved matrix–glass composition, reaching ∼78 wt% of the SiO2 content. Representative BSE images of matrix–glass are shown in Supplementary Figure S5. Meanwhile, the melt inclusions are generally present in orthopyroxene/clinopyroxene and plagioclase hosts. However, the melt inclusions affected by post-entrapment processes (e.g., containing daughter minerals) are quite dominant (Supplementary Figure S6); hence, we do not report the melt inclusion composition data in Supplementary Table S1.
4.2 Mineralogy and mineral compositions
The crystal content in all samples varies from ∼9 to 32% (Figure 1B), with the ST75 (1973) and ST79 (1981) samples having the lowest and highest crystal content, respectively. Each sample contains plagioclase, orthopyroxene, clinopyroxene, olivine, and oxide minerals (magnetite). There is no significant difference in the occurrence of minerals in each sample. Representative thin section images are shown in Supplementary Figure S7.
4.2.1 Plagioclase
Plagioclase makes up the most abundant mineral in each sample (∼5–24%), which governs the proportion of the total crystal content (Figure 1B). The crystals are generally anhedral to euhedral and are 0.08–1.54 mm on average. Plagioclase minerals appear to have a low abundance in younger products (late lava). It can be seen in Figure 1B that the plagioclase content in middle and early lava is dominantly >10% (except 1973 and 1995 lavas), while the latest four samples (2007, 2012, 2014, and 2017 lava) contain approximately 10% plagioclase minerals.
The members of plagioclase in all samples are mostly andesine, labradorite, and bytownite (Supplementary Figure S8). Both micro- and phenocrysts of plagioclase have a wide range of compositions with An40-90 (Figure 2), where calcic plagioclase is dominant. For plagioclase phenocrysts, all samples contain a high An core (>An80); however, the samples with a high An rim (>An80) are the 1975, 1999, and 2017 lavas. For plagioclase microphenocrysts, a similar high An core is also observed in all samples, while no microphenocryst rims have a high An-content of >An80, except for the 1998 and 2014 samples that are close to An-rim80. The wide range of the An-content is reflected by various plagioclase textures found, such as sieve, skeletal, and normal zoning (Supplementary Figure S9).
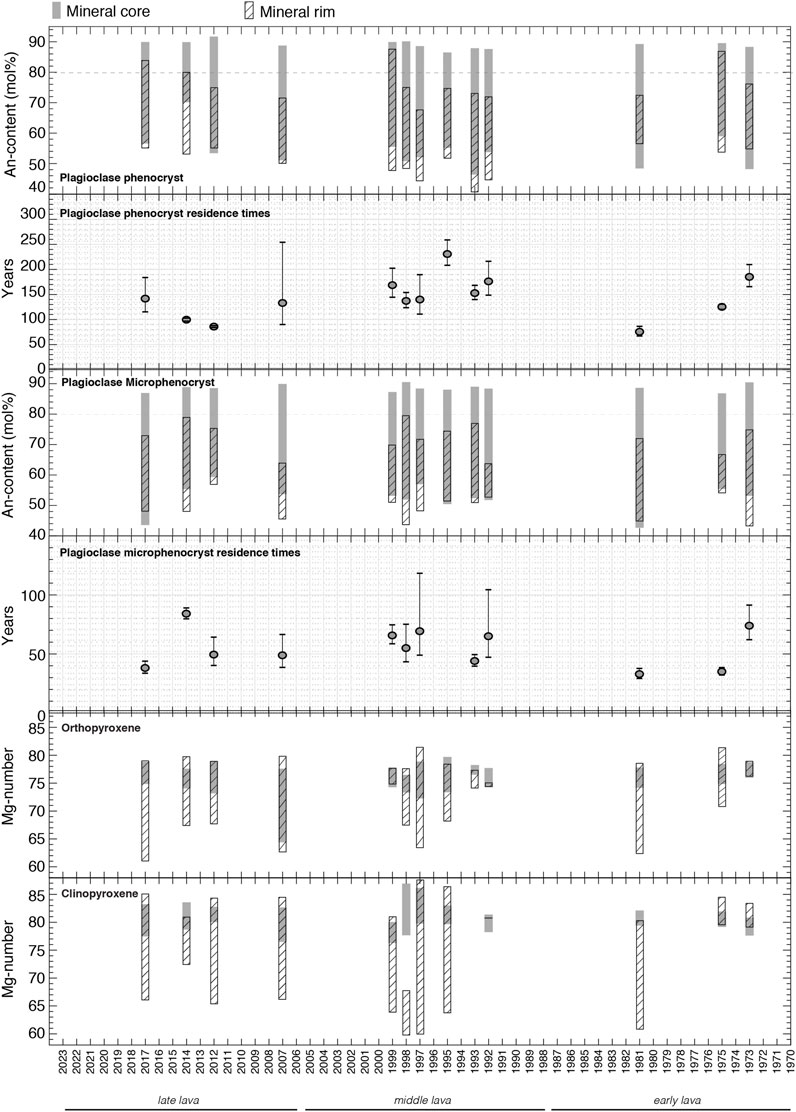
FIGURE 2. Temporal evolution of the An content of plagioclase and Mg number of pyroxene, as well as the estimates of residence times.
4.2.2 Pyroxene
Pyroxene in all samples consists of clinopyroxene (augite and pigeonite) and orthopyroxene (enstatite) (Supplementary Figure S8), where their proportions at each sample do not exceed 5% (Figure 1B). Orthopyroxene has a size of 0.07–0.46 mm and has subhedral to euhedral shapes, while clinopyroxene has a size of 0.01–0.37 mm with subhedral to euhedral crystal shapes. The proportion of pyroxene does not significantly vary with time, particularly for clinopyroxene.
The core and rim compositions of orthopyroxene have Mg numbers within the 60–80 range, with the core having a narrower range of Mg numbers (Mg70-80) than the rim (Figure 2). The Mg core of 2007 lava extends lower to Mg65 than that of other lavas. As an exception, the 1973, 1992, 1993, and 1999 lavas have both narrow ranges of Mg core and Mg rim. Meanwhile, most of the clinopyroxene (core and/or rim) contains an Mg number higher than that of orthopyroxene (i.e., >Mg80). Similar to orthopyroxene, clinopyroxene is generally characterized by narrow ranges of Mg core (Mg76-87) and wide ranges of Mg rim (Mg60-88). The dominant texture found in pyroxene is unzoned (Supplementary Figure S9).
4.2.3 Olivine
Olivine only takes up approximately 1% of all samples and is present as microphenocrysts with sizes of 0.02–0.12 mm. We did not observe olivine in the 1973 and 1998 lavas. Their compositions are distributed into forsterite end-members (Supplementary Figure S8).
4.2.4 Oxide minerals
The proportion of oxide minerals does not exceed 3%, and they are generally present as microphenocrysts with a size of 0.04–0.13 mm on average. The oxide minerals exist both as individual crystals and within plagioclase or pyroxene crystals.
4.3 CSD
Figure 2 also shows the magma residence time estimated from plagioclase micro- and phenocrysts. For the phenocrysts, the magmas producing all lava samples were stored for ∼100–230 years, except for the samples from 1981 and 2012, which were stored for ∼75 and 85 years, respectively. On average, they were typically stored for approximately 142 years. Meanwhile, the residence times of plagioclase microphenocrysts are between 33 and 84 years, with an average of ∼55 years. The supporting data for the residence time calculation can be found in Supplementary Table S1.
5 Conclusion
Overall, this dataset provides fundamental geochemical data and residence times of Anak Krakatau lavas prior to the 2018 collapse event. The petrography and geochemical analyses indicate the following:
1) The compositions of all AK lava products are predominantly basaltic, implying there are no changes toward more evolved magma compositions. However, the matrix–glass compositions of all samples indicate a more evolved, mostly dacitic–rhyolitic composition.
2) All samples dominantly consist of similar mineral assemblages of plagioclase, two-pyroxene, and oxide minerals, with fewer proportions of olivine. No hydrous minerals are observed.
3) All lavas contain plagioclase micro- and phenocrysts that have a high An core (>An80). Meanwhile, plagioclase phenocrysts that contain both a high An core and rim (>An80) were observed in the 1975, 1999, and 2017 lavas.
4) Both ortho- and clinopyroxene contain a narrower range of Mg-number core than the rim. In each pyroxene, some samples have a Mg-number rim slightly higher than the core.
5) On average, plagioclase phenocrysts and microphenocrysts were stored for approximately 142 years and 55 years, respectively.
Data availability statement
The original contributions presented in the study are included in the article/Supplementary Material; further inquiries can be directed to the corresponding author.
Author contributions
DN and TI contributed as the main contributors of this paper. DN, AP, and NR performed SEM-EDS analysis. TI, WB, MA, and IK collected the samples in the field. DN, TI, and WD analyzed CSD and geochemical data. DN and TI wrote the first draft of the manuscript. All authors contributed to the article and approved the submitted version.
Funding
This study was supported financially by the Earth Science and Maritime Research Organization, National Research and Innovation Agency of the Republic of Indonesia through Rumah Program Kebencanaan (No. SP DIPA-124.01.1.690501/2022 and SP DIPA -124.01.1.690501/2023) grant to DN, AP, and MA. Additional funding was also received from the Faculty of Earth Sciences and Technology, Institut Teknologi Bandung through Post-Doctoral Research Grants to AP (No. 1798/IT1.C01/SK-KP/2022 and 1607A/IT1.C01/SPK-KP.01/2023). This study was also supported by the Post-Doctoral Research Grant from the National Research and Innovation Agency Republic of Indonesia (BRIN) to DN (No. 64/II/HK/2022).
Acknowledgments
Permission to conduct field research at Krakatau volcano was given by the BKSDA (Balai Konservasi Sumber Daya Alam or Natural Resource Conservation Center) of Bengkulu Lampung, Indonesia. The authors thank Muhammad Zain Tuakia, Cinantya Nirmala Dewi, and Mohammad Hasib for the fruitful discussion and their assistance with the laboratory work.
Conflict of interest
The authors declare that the research was conducted in the absence of any commercial or financial relationships that could be construed as a potential conflict of interest.
Publisher’s note
All claims expressed in this article are solely those of the authors and do not necessarily represent those of their affiliated organizations, or those of the publisher, the editors, and the reviewers. Any product that may be evaluated in this article, or claim that may be made by its manufacturer, is not guaranteed or endorsed by the publisher.
Supplementary material
The Supplementary Material for this article can be found online at: https://www.frontiersin.org/articles/10.3389/feart.2024.1245001/full#supplementary-material
References
Abdurrachman, M., Widiyantoro, S., Priadi, B., and Ismail, T. (2018). Geochemistry and structure of krakatoa volcano in the Sunda Strait, Indonesia. Geosciences 8 (4), 111. doi:10.3390/geosciences8040111
Agangi, A., and Reddy, S. M. (2016). Open-system behaviour of magmatic fluid phase and transport of copper in arc magmas at Krakatau and Batur volcanoes, Indonesia. J. Volcanol. Geotherm. Res. 327, 669–686. doi:10.1016/j.jvolgeores.2016.10.006
Ardian, D. N., Darmawan, H., Mutaqin, B. W., and Haerani, N. (2022). Grain size, mineralogical, and geochemistry of the 1996-2018 volcanic products of Anak Krakatau volcano, Indonesia. IOP Conf. Ser. Earth Environ. Sci. 1071 (1), 012017. doi:10.1088/1755-1315/1071/1/012017
Bas, M. L., Maitre, R. L., Streckeisen, A., and Zanettin, B. (1986). A chemical classification of volcanic rocks based on the total alkali-silica diagram. J. petrology 27 (3), 745–750. doi:10.1093/petrology/27.3.745
Camus, G., Gourgaud, A., and Vincent, P. M. (1987). Petrologic evolution of Krakatau (Indonesia): implications for a future activity. J. Volcanol. Geotherm. Res. 33 (4), 299–316. doi:10.1016/0377-0273(87)90020-5
Cashman, K. V. (1993). Relationship between plagioclase crystallization and cooling rate in basaltic melts. Contributions Mineralogy Petrology 113, 126–142. doi:10.1007/BF00320836
Cashman, K. V., and Marsh, B. D. (1988). Crystal size distribution (CSD) in rocks and the kinetics and dynamics of crystallization II: makaopuhi lava lake. Contributions Mineralogy Petrology 99 (3), 292–305. doi:10.1007/bf00375363
Cutler, K. S., Watt, S. F., Cassidy, M., Madden-Nadeau, A. L., Engwell, S. L., Abdurrachman, M., et al. (2022). Downward-propagating eruption following vent unloading implies no direct magmatic trigger for the 2018 lateral collapse of Anak Krakatau. Earth Planet. Sci. Lett. 578, 117332. doi:10.1016/j.epsl.2021.117332
Dahren, B., Troll, V. R., Andersson, U. B., Chadwick, J. P., Gardner, M. F., Jaxybulatov, K., et al. (2012). Magma plumbing beneath Anak Krakatau volcano, Indonesia: evidence for multiple magma storage regions. Contributions Mineralogy Petrology 163, 631–651. doi:10.1007/s00410-011-0690-8
de Maisonneuve, C. B., Forni, F., and Bachmann, O. (2021). Magma reservoir evolution during the build up to and recovery from caldera-forming eruptions–A generalizable model? Earth-Science Rev. 218, 103684. doi:10.1016/j.earscirev.2021.103684
Fiantis, D., Ginting, F. I., Gusnidar, M., Van Ranst, E., and Minasny, B. (2021). Geochemical characterization and evolution of soils from Krakatau Islands. Eurasian Soil Sci. 54, 1629–1643. doi:10.1134/s1064229321110077
Gardner, M. F., Troll, V. R., Gamble, J. A., Gertisser, R., Hart, G. L., Ellam, R. M., et al. (2012). Crustal differentiation processes at Krakatau volcano, Indonesia. J. Petrology 54 (1), 149–182. doi:10.1093/petrology/egs066
Global Volcanism Program (2023). Volcanoes of the world (v. 5.1.4; 9 nov 2023). https://volcano.si.edu/gvp_votw.cfm.
Grilli, S. T., Tappin, D. R., Carey, S., Watt, S. F., Ward, S. N., Grilli, A. R., et al. (2019). Modelling of the tsunami from the december 22, 2018 lateral collapse of Anak Krakatau volcano in the Sunda straits, Indonesia. Sci. Rep. 9 (1), 11946. doi:10.1038/s41598-019-48327-6
Higgins, M. D. (2000). Measurement of crystal size distributions. Am. Mineralogist 85 (9), 1105–1116. doi:10.2138/am-2000-8-901
Innocenti, S., Del Marmol, M.-A., Voight, B., Andreastuti, S., and Furman, T. (2013). Textural and mineral chemistry constraints on evolution of Merapi Volcano, Indonesia. J. Volcanol. Geotherm. Res. 261, 20–37. doi:10.1016/j.jvolgeores.2013.01.006
Keller, F., Guillong, M., Geshi, N., Miyakawa, A., and Bachmann, O. (2023). Tracking caldera cycles in the Aso magmatic system–Applications of magnetite composition as a proxy for differentiation. J. Volcanol. Geotherm. Res. 436, 107789. doi:10.1016/j.jvolgeores.2023.107789
Klein, J., Mueller, S. P., and Castro, J. M. (2017). The influence of crystal size distributions on the rheology of magmas: new insights from analog experiments. Geochem. Geophys. Geosystems 18 (11), 4055–4073. doi:10.1002/2017gc007114
Kristianto, , Indrastuti, N., Basuki, A., Purnamasari, H. D., Adi, S., Patria, C., et al. (2021). Potential eruption and current activity of Anak Krakatau volcano, Indonesia. IOP Conf. Ser. Earth Environ. Sci. 873 (1), 012021. doi:10.1088/1755-1315/873/1/012021
Madden-Nadeau, A. L., Cassidy, M., Pyle, D. M., Mather, T. A., Watt, S. F. L., Engwell, S. L., et al. (2021). The magmatic and eruptive evolution of the 1883 caldera-forming eruption of Krakatau: integrating field-to crystal-scale observations. J. Volcanol. Geotherm. Res. 411, 107176. doi:10.1016/j.jvolgeores.2021.107176
Marsh, B. D. (1988). Crystal size distribution (CSD) in rocks and the kinetics and dynamics of crystallization: I. Theory. Contributions Mineralogy Petrology 99, 277–291. doi:10.1007/bf00375362
Mock, A., and Jerram, D. A. (2005). Crystal size distributions (CSD) in three dimensions: insights from the 3D reconstruction of a highly porphyritic rhyolite. J. Petrology 46 (8), 1525–1541. doi:10.1093/petrology/egi024
Morgan, D. J., and Jerram, D. A. (2006). On estimating crystal shape for crystal size distribution analysis. J. Volcanol. Geotherm. Res. 154 (1-2), 1–7. doi:10.1016/j.jvolgeores.2005.09.016
Nugroho, R. P., Disando, T., Kurniawan, I. A., and Abdurrachman, M. (2019). Crystal size distribution (CSD) of plagioclase phenocryst-microphenocryst and the calculation of crystal resident times in the continuous central eruption sequences of Mount Lasem, Central Java, Indonesia. J. Phys. Conf. Ser. 1363, 012041. doi:10.1088/1742-6596/1363/1/012041
Oba, N., Tomita, K., Yamamoto, M., Istidjab, M., Badruddin, M., and Parlin, M. (1982). Geochemical study of lava flows, ejecta and pyroclastic flow from the Krakatau Group, Indonesia. Kagoshima. Daigaku Rigakubu Kiyō. Chigaku seibutsugaku (15), 41–76.
Omira, R., and Ramalho, I. (2020). Evidence-calibrated numerical model of December 22, 2018, Anak Krakatau flank collapse and tsunami. Pure Appl. Geophys. 177, 3059–3071. doi:10.1007/s00024-020-02532-x
Perttu, A., Caudron, C., Assink, J. D., Metz, D., Tailpied, D., Perttu, B., et al. (2020). Reconstruction of the 2018 tsunamigenic flank collapse and eruptive activity at Anak Krakatau based on eyewitness reports, seismo-acoustic and satellite observations. Earth Planet. Sci. Lett. 541, 116268. doi:10.1016/j.epsl.2020.116268
Pratama, A., Nurfiani, D., Suryanata, P. B., Ismail, T., Bunga Naen, G. N. R., Abdurrachman, M., et al. (2023). Magma storage conditions beneath Krakatau, Indonesia: insight from geochemistry and rock magnetism studies. Front. Earth Sci. 11, 1128798. doi:10.3389/feart.2023.1128798
Schipper, C. I., and White, J. D. (2016). Magma-slurry interaction in Surtseyan eruptions. Geology 44 (3), 195–198. doi:10.1130/g37480.1
Terry, R. D., and Chilingar, G. V. (1955). Summary of" Concerning some additional aids in studying sedimentary formations," by MS Shvetsov. J. Sediment. Res. 25 (3), 229–234. doi:10.1306/74d70466-2b21-11d7-8648000102c1865d
Westerveld, J. (1952). Quaternaky volcanism on Sumatra. Geol. Soc. Am. Bull. 63 (6), 561–594. doi:10.1130/0016-7606(1952)63[561:qvos]2.0.co;2
Williams, R., Rowley, P., and Garthwaite, M. C. (2019). Reconstructing the Anak Krakatau flank collapse that caused the December 2018 Indonesian tsunami. Geology 47 (10), 973–976. doi:10.1130/g46517.1
Zen, M. T., and Hadikusumo, D. (1964). Recent changes in the Anak-Krakatau volcano. Bull. Volcanol. 27, 259–268. doi:10.1007/bf02597525
Keywords: Anak Krakatau, basaltic lava, petrology, geochemistry, crystal size distribution (CSD)
Citation: Nurfiani D, Ismail T, Pratama A, Rukmini NA, Abdurrachman M, Kurniawan IA, Draniswari WA, Banggur WFS and Suryanata PB (2024) Geochemical characteristics of Anak Krakatau’s (Indonesia) lava in the past half-century. Front. Earth Sci. 12:1245001. doi: 10.3389/feart.2024.1245001
Received: 23 June 2023; Accepted: 22 January 2024;
Published: 15 February 2024.
Edited by:
Nick Varley, University of Colima, MexicoReviewed by:
Luis E. Lara, Austral University of Chile, ChileNicholas Barber, Washington and Lee University, United States
Rebecca Williams, University of Hull, United Kingdom
Copyright © 2024 Nurfiani, Ismail, Pratama, Rukmini, Abdurrachman, Kurniawan, Draniswari, Banggur and Suryanata. This is an open-access article distributed under the terms of the Creative Commons Attribution License (CC BY). The use, distribution or reproduction in other forums is permitted, provided the original author(s) and the copyright owner(s) are credited and that the original publication in this journal is cited, in accordance with accepted academic practice. No use, distribution or reproduction is permitted which does not comply with these terms.
*Correspondence: Dini Nurfiani, dnurfianearth@gmail.com