Methanotroph activity and connectivity between two seep systems north off Svalbard
 Tim R. de Groot1*
  Dimitri Kalenitchenko2,3 Manuel Moser2
  Claudio Argentino2
  Giuliana Panieri2
  Matteus Lindgren2 Knut Ola Dølven2
  Benedicte Ferré2
  Mette M. Svenning2,4
  Helge Niemann1,2,5
- 1Marine Microbiology and Biogeochemistry, NIOZ Royal Netherlands Institute for Sea Research, Texel, Netherlands
- 2CAGE – Centre of Arctic Gas Hydrate, Environment and Climate, Department of Geosciences, UiT the Arctic University of Norway, Tromsø, Norway
- 3LIttoral ENvironnement et Sociétés (LIENSs)—UMR 7266, La Rochelle, France
- 4Department of Arctic and Marine Biology, UiT the Arctic University of Norway, Tromsø, Norway
- 5Department of Earth Sciences, Utrecht University, Utrecht, Netherlands
Understanding methane flux dynamics in Arctic cold seep systems and the influence of oceanic currents on microbial methane-oxidizing bacteria (MOB) is crucial for assessing their impact on Arctic methane emissions. Here, we investigate methane dynamics and associated microbial communities at two cold seep areas, Norskebanken and Hinlopen Trough, North of Svalbard. Methane concentrations and methane oxidation rates (MOx) were measured in bottom and surface waters, with higher values observed in bottom waters, particularly at Hinlopen Trough. Dominant water column MOB clusters were Milano−WF1B−03 and Methyloprofundus. Methane availability drove MOx activity, as indicated by higher concentrations in bottom waters and sediments where MOx was elevated, too. Sediment MOB communities varied among locations, with Hinlopen featuring higher diversity and abundance. Similarities between sediments and water column MOBs suggest potential recruitment from sediments, possibly via a bubble shuttle mechanism. In addition, bottom water MOB community composition also showed similarities between the Norskebanken and Hinlopen seeps, implying an exchange of water column microbes between the two seep areas, which may likely be driven by the regional current regime. Together, our results show that bubble-mediated transport and translocation via currents are important processes shaping the community structure and efficiency of the microbial methane filter in the water column.
1 Introduction
Methane, a potent greenhouse gas with a much higher global warming potential than carbon dioxide, is a key component in planed strategies to reduce global warming (Etminan et al., 2016; IPCC, 2021). In marine environments, methane production is primarily attributed to microbial or thermogenic processes in sediments. At cold seeps, this methane migrates upwards through stratigraphic or structural pathways, frequently accompanied by geofluids and other reduced chemical compounds such as sulfide (Reeburgh, 2007). At these systems, the reduced compounds and electron acceptors (oxygen, nitrite/nitrate, metal oxides and sulfate) form steep geochemical gradients close to the seafloor because a substantial amount of methane is reduced by a cascade of different modes of microbial methane oxidation. Most importantly, methane is oxidized with sulfate as a terminal electron acceptor in deeper sediment layers followed by other alternative electron acceptors and finally oxygen at the sediment surface (James et al., 2016). The geochemical gradients also play a vital role in supporting ecosystems that rely on chemosynthesis (Fisher et al., 1997; Gibson et al., 2005; Argentino et al., 2022).
On a global scale, most methane is retained in mare sediments, but substantial amounts typically circumvent the benthic microbial methane filter at cold seeps. Cold seeps thus release methane into the water column, but the activity of methane efflux at these geo structures can vary on geological (Suess, 2020), seasonal (Mau et al., 2013; Berndt et al., 2014; Silyakova et al., 2020; Dølven et al., 2022) and diel to hourly time scales (Römer et al., 2016; Sultan et al., 2020; Dølven et al., 2022). Net methane emissions from the ocean into the atmosphere are relatively low compared to other natural sources, but highly skewed towards higher emissions at shallow coastal areas. Here the vertical distance between the seafloor and sea surface is short, providing only a limited time window for microbial oxidation to efficiently consume methane before reaching the atmosphere (James et al., 2016; Weber et al., 2019; de Groot et al., 2023). In the water column, the aerobic oxidation of methane (MOx) is the most important methane sink. This is facilitated by aerobic methane−oxidizing bacteria (MOB), commonly referred to as methanotrophs. MOx can be summarized by the following equation (Reeburgh, 2007):
Known MOBs belong to the Gammaproteobacteria (type I and type X), Alphaproteobacteria (type II), Verrucomicrobia and members of the candidate division NC10 (Knief, 2015). MOB communities substantially mitigate the release of methane intro the atmosphere (Boetius and Wenzhöfer, 2013; Steinle et al., 2016; Gründger et al., 2021). However, the efficiency of MOx can be modulated by multiple environmental factors such as nutrient and methane availability, redox dynamics, water temperature and water depth (Reeburgh, 2007; Crespo-Medina et al., 2014; de Groot et al., 2023). Additionally, deep mixing and currents have been identified as important agents in the translocation of MOBs, thereby impacting the efficiency of the microbial methane filter (Steinle et al., 2015; James et al., 2016; Gründger et al., 2021). Methanotrophic activity in the water column can also be hampered by the availability of methane, oxygen, and nutrients (Reeburgh, 2007; Crespo-Medina et al., 2014; Steinle et al., 2017).
In the Arctic, currents play a vital role in introducing nutrients and biomass to higher latitudes (Oziel et al., 2020). The West Spitsbergen Current (WSC) carries warm nutrient−rich Atlantic Water (AW) north into the North Svalbard Current (NSC), passing Norskebanken and the Hinlopen Trough (Menze et al., 2020), where numerous cold seeps were reported (Geissler et al., 2016) (Figure 1). The WSC also passes by the seep systems West of Svalbard, which release methane of a mixed thermogenic/microbial origin to the water column (Graves et al., 2015; Mau et al., 2017; Sauer et al., 2021).
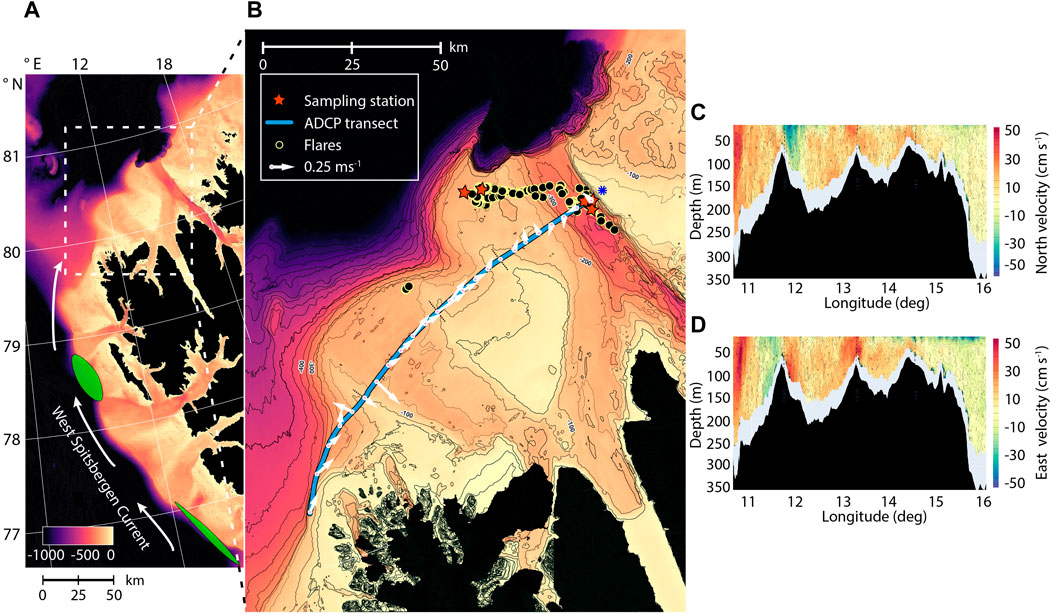
Figure 1. (A) Northwestern Spitsbergen, with arrows indicating the northward flow of the West Spitsbergen Current along the western side of Svalbard. Green ellipses denote extensive seep areas west of Prins Karls Forland, previously studied for MOB (Steinle et al., 2015; Mau et al., 2017; Gründger et al., 2021). (B) Map of Norskebanken (80˚37 N, 14˚06 E) and Hinlopen Trough (80˚30 N, 16˚04 E), showing sampling stations, flare observations, and the ADCP transect. Arrows represent bottom water velocity and direction at discrete locations. The easternmost velocity, denoted by a blue star, was derived from an earlier ADCP section (Supplementary Figure S1). (C) ADCP transect data illustrating the northward velocity component. (D) ADCP transect data displaying the eastward velocity component. Note that this ADCP transect was collected over a 9−h measurement period and velocities can be influenced by processes on short timescales such as tidal effects and surface wind forcing.
In this study, we focused on methane dynamics above two cold seep systems at Norskebanken and Hinlopen Trough, where we found extremely high methane concentrations but contrasting methane oxidation rates—low at Norskebanken but high in Hinlopen Trough. The aim of our study was to investigate the microbial communities associated with these seep sites and unravel whether the contrasting methane oxidation patterns are influenced by regional and local transport and exchange of microbial communities due to ocean currents.
2 Materials and methods
2.1 Site description and sampling
Samples were acquired during a research expedition with R/V Kronprins Haakon (CAGE 20-7) from November 2nd until 16 November 2020. Our study areas are located north of Svalbard, (i) a flat rocky section on the Yermak plateau called Norskebanken (∼200 m water depth) and (ii) a deep trench between the islands of Spitsbergen and Nordaustlandet on Svalbard’s northern margin called the Hinlopen Trough (500-meter water depth; Figure 1). Both sites are known to feature cold seep locations (Geissler et al., 2016) and could be a potential sources of methane to the atmosphere. During our cruise, we detected 288 acoustic “flares” indicative of bubble emission sites at Norskebanken and 239 at Hinlopen Trough during multibeam echosounder surveys. The flares extended 6—97 m (average = 35 m) from the seafloor at Norskebanken and 13—222 m (average = 98 m) at Hinlopen Trough. Our study areas are highly influenced by incoming Atlantic water (AW) that flows along the Western Svalbard shelf as part of the West Spitsbergen Current (WSC; Menze et al., 2020). The incoming AW can influence microbial diversity in the Arctic Ocean by introducing heat, nutrients, and (re) introducing bacterial communities (Steinle et al., 2015; Gründger et al., 2021).
Samples were taken from two locations at Norskebanken designated as Norskebanken West (80˚37.397 N, 14˚06.302 E) and Norskebanken East (80˚37.398 N, 14˚24.725 E), and from three locations in the Hinlopen Trough designated as Hinlopen West (80˚30.395 N, 16˚04.391 E), Hinlopen South (80˚28.885 N, 16˚09.311 E), and Hinlopen East (80˚30.520 N, 16˚10.194 E) (Figure 1B). The distance between Norskebanken (Norskebanken E) and in the Hinlopen Trough (Hinlopen W) was approximately 50 km.
Seafloor observations were conducted with the remotely operated vehicle (ROV) ÆGIR 6000 from the Norwegian Marine Robotics Laboratory at the University of Bergen. During hydro casts, we continuously measured water mass properties (temperature, salinity, pressure, oxygen) using a Sea−Bird (SBE911) + conductivity−temperature−depth (CTD) system. The CTD frame also featured a rosette sampler with 24 × 12 L Niskin bottles, which were used to acquire discrete water samples at each hydro cast location. At Norskebanken West, water samples were collected from five depths, while at Norskebanken East and in the Hinlopen Trough, samples were collected from six and eight depths, respectively. Immediately upon recovery, we subsampled Niskin bottles for subsequent analyses of water column constituents as well as microbial activity and microbial community composition. At Norskebanken East and Hinlopen East, the ROV was used to grab− and then position the CTD frame directly into the plume of rising bubbles close to the sea floor (hereafter, these samples are denoted as ROV−grab).
Suspended particulate organic matter (POM) was sampled from two depths at Norskebanken East (60 m and 160 m), Hinlopen West (120 m and 330 m), South (100 m and 345 m) and East (350 m) using two McLane in situ pumps (WTS−LV) equipped with glass fibre filters (142 mm, 0.3 µm nominal mesh size, Advantec MFS).
2.2 Sediments
We employed two different sampling methods to collect sediment samples from various locations at Hinlopen Trough and Norskebanken East. The choice of sampling method depended on the sediment characteristics at each site. The fine sediments in Hinlopen Trough allowed us to sample them with push core samplers operated by the ROV. At Norskebanken East, the high proportion of sand and rocks/carbonate crusts prevented the collection of sediments by push coring. Instead, we used a multiple corer deployed from the ship. Immediately after retrieval, the sediment cores were sliced into one−centimeter sections. Aliquots for microbiological analysis were taken with a sterile spatula and immediately frozen at −20°C for further analysis.
2.3 Dissolved methane concentrations
Dissolved methane concentrations were quantified using a headspace technique (Green, 2005). Immediately after CTD recovery, 120 mL flasks were filled headspace−free with seawater, and the samples were fixed with 1 mL 1M NaOH. The flasks were then crimp top−sealed and stored at 4°C. Before analysis, a headspace was introduced by replacing 5 mL of water with 5 mL N2 gas, and the samples were allowed to equilibrate for minimum 24 h. The headspace methane concentrations were measured using a gas chromatograph (Thermo Scientific Trace 1310 GC, FID detector, Thermo Scientific TG−BOND MSieve 5A column).
Sediments for methane concentration measurements were subsampled with cut−off syringes from sediment cores immediately upon core recovery. Methane concentrations were determined from 5 mL sediment aliquots fixed in 5 mL 1M NaOH solution in a 20 mL glass vials. All samples for methane concentration measurement were stored upside−down at 4°C. The headspace methane concentrations were measured using a gas chromatograph (Thermo Scientific Trace 1310 GC, FID detector, Restek Rt−Alumina BOND/Na2SO4 column).
2.4 Methane oxidation rate measurements
Methane oxidation rates were determined by ex−situ incubations with trace amounts of 3H-labelled methane as described previously (Niemann et al., 2015). Briefly, from each Niskin bottle, sea water aliquots were filled headspace free in 20 mL glass vials in quadruplicates and sealed with grey−bromobutyl stoppers that are known to not hamper methanotrophic activity and amended with 5 µL of 3H-CH4 in N2 (4.5 kBq, American Radiolabeled Chemicals, United States). Samples were incubated for 2–3 days in the dark at 4°C. Activities of residual C3H4 and the MOx product 3H2O were measured by liquid scintillation counting.
First order rate constants (k) were determined from fractional tracer turnover (Reeburgh, 2007):
Where t is the incubation time in days. k was corrected for (insubstantial) tracer turnover in killed controls (kKC, fixed with 50 µL HgCl2 directly after sampling). Together with methane concentrations [CH4], (k−kKC) yields MOx:
2.5 DNA extraction and 16S rRNA gene amplicon library preparation
DNA was extracted from filters (suspended POM) and sediment samples using the PowerSoil Pro DNA extraction kit (Mo Bio Laboratories, Carlsbad, CA, United States) and stored at −20°C until further analysis. Gene amplification was performed in triplicate with the universal SSU primer pair 515F-Y/926R targeting the V4 and V5 hypervariable regions (Parada et al., 2016) as described earlier (Vaksmaa et al., 2021) but with an adaptation to the PCR program: 5 min initial enzyme activation/DNA denaturation at 98°C, followed by 25 cycles of 98°C for 1 min, 58°C for 1 min, 72°C for 2 min, with a final elongation of 72°C for 10 min. The 16S rRNA gene products, comprising approximately 400 bp with unique Golay barcodes incorporated into the forward and reverse primers, underwent gel purification. Subsequently, library preparation, pooling, and Illumina MiSeq 2 × 300 sequencing were performed at Integrated Microbiome Resource (IMR).
To analyze the bacterial and archaeal 16S amplicon reads, we utilized the DADA2 algorithm (Callahan et al., 2016), implemented in Qiime2 (v2021.8.0). The following steps were performed on the raw reads: filtering, merging, denoising, and removal of chimeric sequences. Truncation lengths of 270 bp (forward) and 210 bp (reverse) were used during the process. This allowed us to obtain high−quality sequences for downstream analysis. Taxonomy assignment of the resulting inferred Amplicon Sequence Variants (ASVs) was done using Mothur (v1.43.0) (Schloss et al., 2009) and the SILVA non−redundant SSU database version 138 (Quast et al., 2013). ASVs assigned to Eukaryotes, mitochondria, chloroplasts, or those lacking domain−level taxonomy were excluded from further analysis to focus specifically on Bacteria and Archaea. Alpha and beta diversity was estimated using the R programming language with the vegan package (v. 2.5–6). Dispersed alpha diversity values were calculated as means of 25 iterations to account for potential variation. Hierarchical clustering and Non−Metric Multidimensional Scaling (NMDS) analyses were performed based on the Bray–Curtis dissimilarity index. These approaches allowed us to assess the similarity and dissimilarity of microbial communities across samples. To investigate potential correlations between bacterial phyla at the family level and selected environmental variables, Spearman’s rank correlation was conducted using the R package Hmisc (v.4.4–0). Only family−level clades (SILVA taxonomy v.132) that accounted for at least 0.5% of the total sequences in at least one sample were considered for the analysis. Furthermore, to evaluate differences between groups, we employed PERMANOVA (Permutational Multivariate Analysis of Variance) tests. This statistical approach allowed us to assess the significance of dissimilarities in microbial community composition between different sample groups. Additionally, an analysis was conducted using the DADA2−generated ASV abundance tables. A Venn diagram was constructed to visualize the distribution and overlap of ASVs across sampling regions. This analysis aimed to identify shared ASVs between sediment and water column habitats within specific sampling regions.
2.6 ADCP
Current velocities were measured with a 150 kHz Teledyne RD 206 Ocean Surveyor Acoustic Doppler Current Profiler (ADCP). The ADCP was set to operate in narrowband configuration with 60 ping ensemble over a 2-min ensemble interval. The blanking distance was 27 m (including ship draft), and bin size was set to 8 m. The data was averaged with a 500 m horizontal bin size. We calculated mass transport in the bottom 100 m of water column since this is where the main stock of methane oxidizing bacteria are situated.
The transect started from the Hinlopen Trough at 16.07oE, 80.50oN at 07:00 the 11th of November traversing Norskebanken from east to west, ending at the shelf break at the northwest corner of Spitsbergen at 10.42oE, 79.82oN at 17:00 the 11th of November. It covers the shelf break in the west then follows two depressions, the first one being part of a depression that connects to the Hinlopen Trough slightly south of the Hinlopen South/East/West sampling stations (Figure 1). The second depression is a shallow trough that tapers off into the shallowest central part of Norskebanken. The easternmost part of the transect goes into the Hinlopen and ends at the Hinlopen East sampling station.
3 Results
3.1 Water column properties and water masses
At Norskebanken, water temperatures were ∼3.5°C in the surface and increased relatively gradually with depth to 5.1°C in bottom waters. Hinlopen displayed lower surface temperatures of 2.4°C (West), 3.2°C (South), and 2.6°C (East), with increasing temperatures up to a maximum of 5.0°C at Hinlopen West and East, and 5.1°C at Hinlopen South at ∼180 m depth. Below this depth, temperatures decreased to ∼3.5°C in the bottom water at ∼350 m depth. Salinity showed a similar pattern, with values at Norskebanken ranging from 34.5 psu (surface) to 35.1 psu (bottom). At Hinlopen, salinity was 34.2 psu (surface) and reached a maximum of 35.0 psu at ∼180 m depth but were constant (rather than decreasing) from this depth to the bottom.
The two areas shared common water masses at specific depths, following the classification by previous studies (Cottier et al., 2005). At the Norskebanken stations, the water column featured relatively warm and saline Atlantic Water (AW: >3°C, >34.65 psu) below a ∼25 m deep surface layer (Figures 2, 3). At the Hinlopen stations, AW occupied waters below ∼105 m with similar densities as observed in the bottom waters of Norskebanken (∼1,027.5 kg m−3). This supports an assumption of recent/frequent exchange of water masses between the sampling stations.
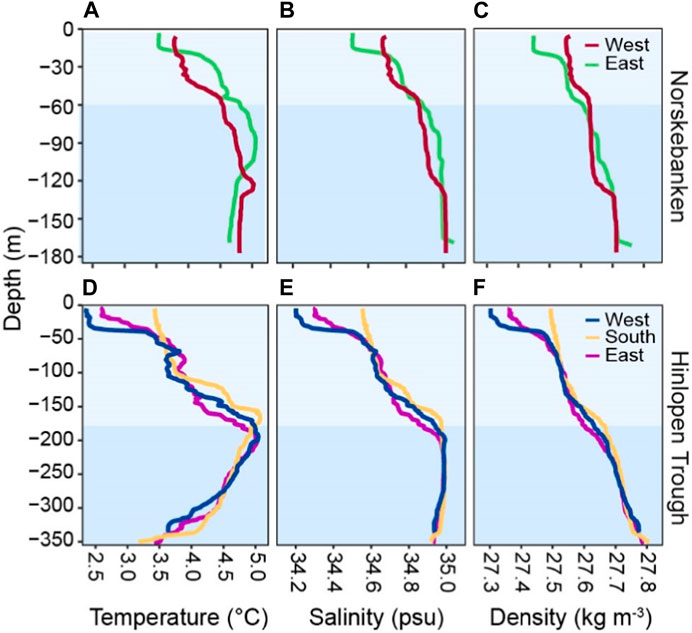
Figure 2. Water column characteristics of Norskebanken (A–C) and Hinlopen Trough (D–F); different water layers are highlighted as light (surface waters) and darker blue (bottom waters). At Norskebanken, the colors for surface and bottom waters correspond to water depths of 0–55 m, and 55–175 m, while at Hinlopen Trough, they correspond to depths of 0–180 m, and 180–350 m.
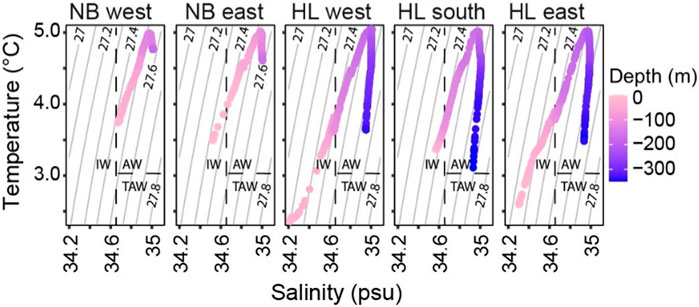
Figure 3. Temperature and salinity profiles of Norskebanken (NB) and Hinlopen Trough (HL) showing distinct water properties. The warm and saline Atlantic waters (AW) with temperatures above 3°C and salinities above 34.65 psu dominate the deeper layers, while intermediate waters (IW) with temperatures above 1°C and salinities between 34 and 34.65 psu are only present in surface layers.
At the western extension of the ADCP transect, we observed a robust northeastern flow with velocities reaching up to 50 cm/s associated with the West Spitsbergen Current situated at the western shelf break of Spitsbergen (Figure 1B, <11°E). Following the transect eastward onto Norskebanken, the western depression at ∼12−13°E featured a vigorous southeastward current into the depression (up to 40 cm s−1) on its western side, transitioning to a northeastward flow slightly further east (Figures 1C,D). From here, the whole central part of Norskebanken (from ∼12.5 to 14.5°E) exhibited a substantial east/northeastward current (>40 cm s−1). At the shallow northern/eastern part of Norskebanken and western slopes of the Hinlopen Trough (∼14.5–15.5°E), currents/transport were much weaker and pointing in various directions. Currents within the Hinlopen Trough were also comparatively weak (<∼10 cm s−1). However, we did observe a strong (up to ∼40 cm s−1) along−trough current core in the upper part of the water column associated with the eastern bank of Hinlopen in a separate ADCP section we collected during the CTD sampling in Hinlopen between 23:20 November 10 and 02:00 November 11 (Supplementary Figure S1).
3.2 Methane dynamics
At all stations, except Norskebanken West, which is situated at a greater distance from cold seeps (Figure 1), surface water methane concentrations were supersaturated in comparison to the atmospheric equilibrium (∼3 nM) (Figure 4; Table 1); in particular, Hinlopen East was characterized by high surface water methane concentrations. Dissolved methane concentrations generally increased with depth, with maximum values in bottom waters (Figure 4; Table 1). Comparing all sampling locations, minimum methane concentrations in bottom waters were found at Norskebanken West (average: 6.6 ± 3.5 nM), whereas Hinlopen East featured the highest methane concentrations in bottom waters (average: 874.1 ± 1763 nM, note that bottom waters were sampled with a CTD−grab, i.e., the sampler was positioned directly into the bubble plume, see Materials and Methods section). Methane concentrations in sediment porewaters at Hinlopen South ranged from 1.4—3.4 mM, while at Hinlopen East, methane concentrations ranged from 1—10.8 mM (Supplementary Table S1).
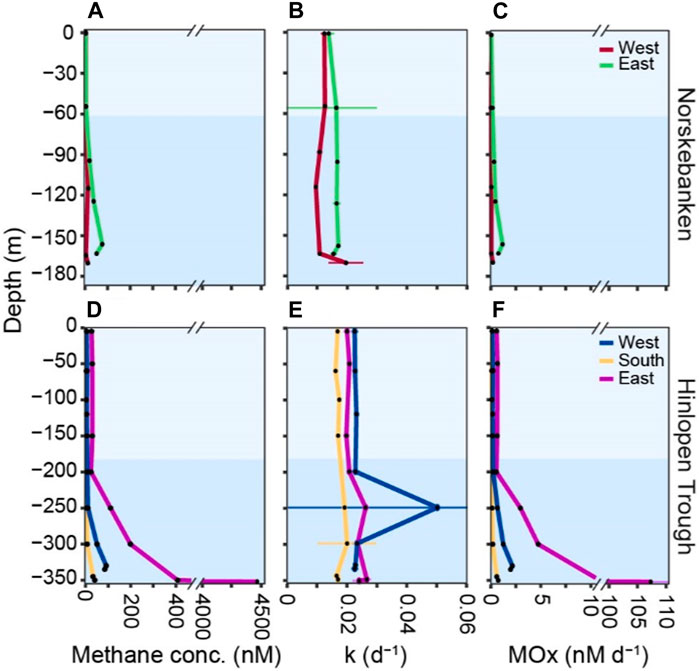
Figure 4. Methane concentrations, first−order rate constant (k), and MOx activity at Norskebanken (A–C) and Hinlopen Trough (D–F). Note the axis break on the x-axis for methane concentrations and MOx. The water column is divided into surface waters, also referred to as intermediate waters (IW), and bottom waters, also referred to as Atlantic waters (AW), based on distinct temperature and salinity characteristics (Figure 3). At Norskebanken, the colors correspond to water depths of 0–55 m, and 55–175 m, while at Hinlopen Trough, they correspond to depths of 0–180 m, and 180–350 m.
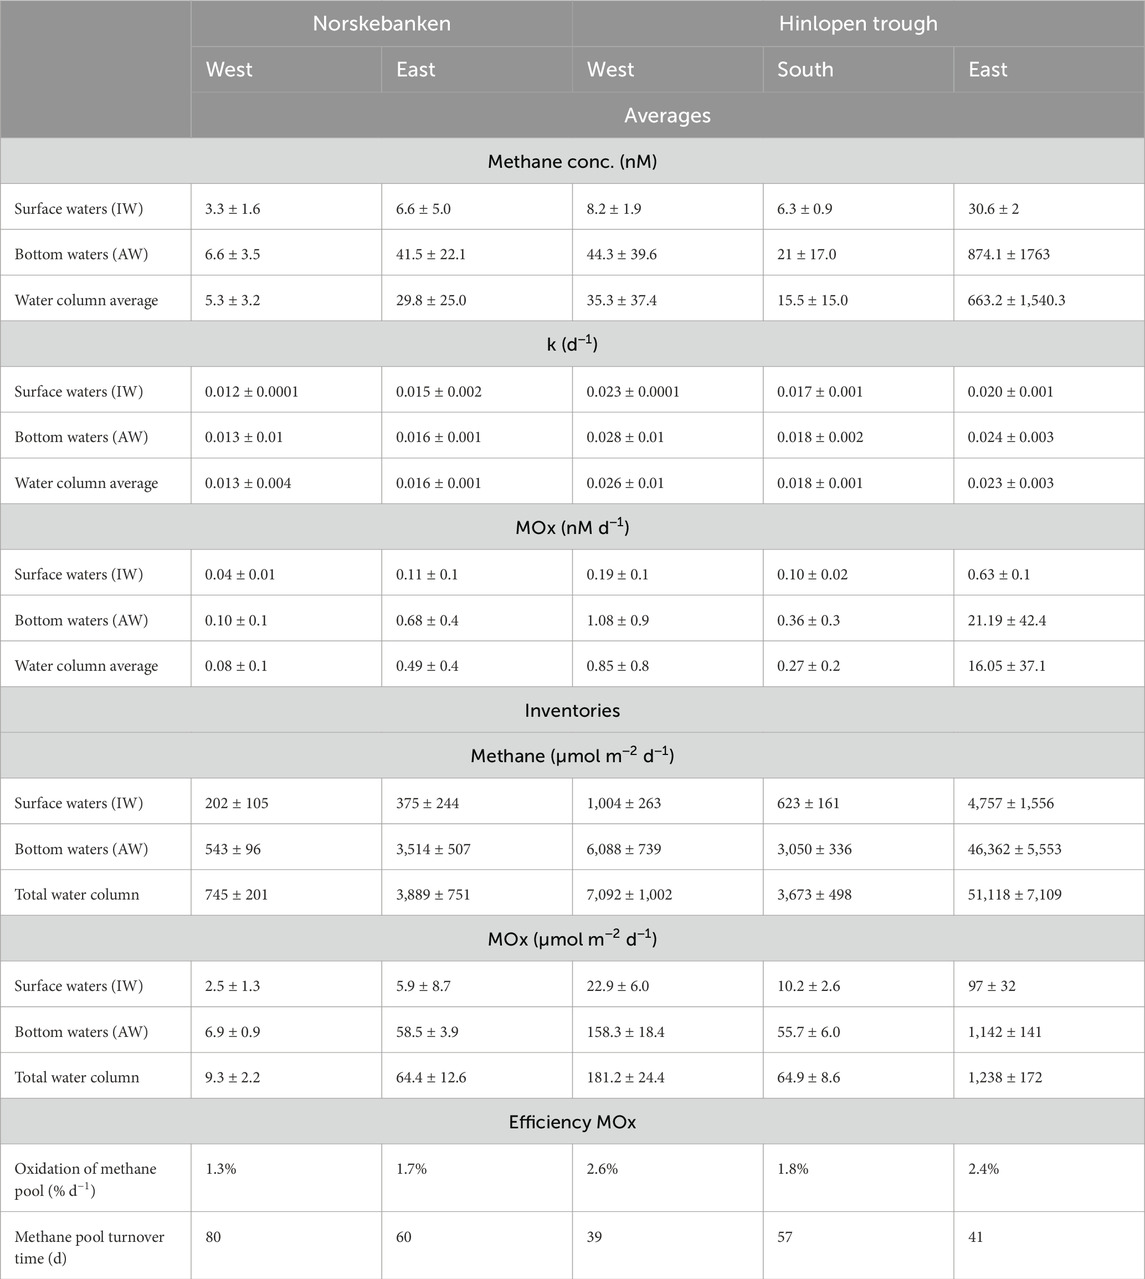
Table 1. Methane concentrations, dissolved methane inventories, and methane oxidation (MOx) activity in different water column layers. The water column is divided into surface waters (referred to as intermediate waters, IW) and bottom waters (referred to as Atlantic waters, AW; Figure 3). MOx efficiency is assessed as the fractional turnover of the methane pool per day and the turnover time of the methane pool. All values are presented as the arithmetic mean ± standard deviation.
3.3 Aerobic methane oxidation
MOx was generally lowest in surface waters but, just as methane concentrations, increased in bottom waters (Figure 4; Table 1). MOx in surface waters ranged from 0.04 to 0.19 nM d−1 and 0.10–1.08 nM d−1 in bottom waters at Norskebanken West and East, and Hinlopen West and South. At Hinlopen East, MOx was higher with 0.63 nM d−1 in surface waters and increased more substantially in bottom waters to a maximum of 107 nM d−1. Water column MOx was approximately 33-fold higher at Hinlopen East compared to Norskebanken East, while the rate constant (k) only increased 1.5-fold. Methane turnover time (i.e., the time it would take to fully oxidize the methane pool by MOx) was highest at Norskebanken West (80 days) and two−fold lower at Hinlopen West and East (39–41 days; Table 1).
3.4 Community of methane oxidizing bacteria
3.4.1 Water column
At Norskebanken, surface waters exhibited a relatively low presence of putative MOBs, accounting for only 0.05% (West) and 0.01% (East) of total bacterial reads (Figure 5A; Supplementary Table S2). In contrast, surface waters at Hinlopen South and West featured substantially higher MOB abundances, comprising 0.1% and 0.2% MOBs of total bacterial reads (note that no surface water samples were taken at Hinlopen East). However, we found strongest differences in MOB abundance when comparing surface and bottom waters: At Norskebanken, the MOB abundance in bottom waters amounted to 0.81% (West) and 0.83% (East) of total bacterial reads. At Hinlopen, MOB abundances similarly amounted to 0.8% (South), 0.95% (West), and 1.76% (East) of total bacterial reads.
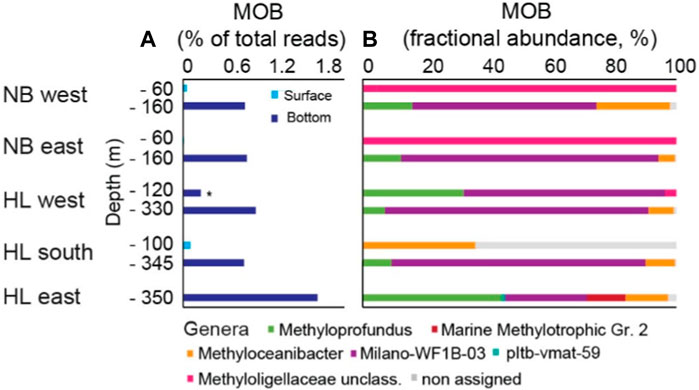
Figure 5. Methane−oxidizing bacteria (MOB) at Norskebanken (NB) and Hinlopen Trough (HL). (A) Proportion of MOB reads in relation to total bacterial reads. (B) Fractional abundance of MOB genera per water layer. See Supplementary Table S2 for comprehensive details on sequencing reads. * Note that at Hinlopen West, MOB samples were taken at two depths within the bottom water layer.
The composition of the MOB community varied between surface and bottom waters at different sampling locations (Figure 5B). At Norskebanken West and East, the majority of putative surface water MOBs belonged to unclassified genera within the Methyloligellaceae family. This contains both type II MOB and methylotrophs that metabolize C1 compounds other than methane (see discussion). At Hinlopen South, the assigned MOBs in surface waters belonged to the genus Methyloceanibacter (36%), which is part of this Methyloligellaceae family, while the remaining 64% of MOB reads were non−assigned.
In general, bottom waters featured a more diverse MOB community that was shared among locations, with the most abundant MOBs being the type I genera Methyloprofundus and Milano−WF1B−03, and the type II genus Methyloceanibacter. Other MOBs present in bottom waters belonged to the genera Marine methylotrophic group 2 (Hinlopen East). The community composition was similar in shallow and deeper bottom waters at Hinlopen West (Figure 5B).
3.4.2 Sediments
The assessment of MOB abundance within sediments revealed distinct patterns across the study sites. At Norskebanken and Hinlopen West, the abundances of MOB did not show significant variation with depth, representing approximately 0.3%–0.9% and 0.1%–0.6% of total reads, respectively. In contrast, at Hinlopen South and East, MOB were more abundant, particularly in the top 5 cm of sediment, with abundances ranging from 0.1% to 3.9% and 0.1%–4.2% of total reads, respectively (Figure 6; Supplementary Figure S2; Supplementary Table S2).
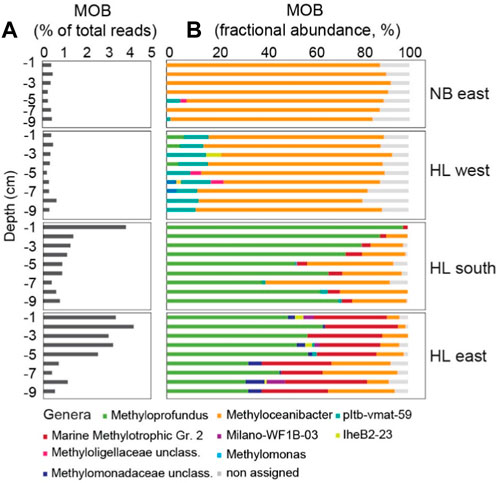
Figure 6. Methane oxidizing bacteria (MOB) in sediments at Norskebanken (NB) and Hinlopen (HL). (A) Proportion of total reads assigned to MOB in sediments at different depths and locations. (B) Fractional abundance of MOB genera in sediments at Norskebanken and Hinlopen. Supplementary Material (Supplementary Figure S2) shows MOB communities below 9 cm depth. See Supplementary Table S2 for comprehensive details on sequencing reads.
The community composition of MOB in sediments differed among the locations. At Norskebanken and Hinlopen West, this was dominated by type II MOB, specifically Methyloceanibacter, with the presence of other genera such as pltb−vmat−59 and unclassified genera of the family Methyloligellaceae. At Hinlopen West, the diversity of MOB was higher, with the additional presence of Methyloprofundus, lheB2−23, Methylomonas, and unclassified genera of the family Methylomonadaceae. At Hinlopen South, the sediments were dominated by Methyloprofundus, with a decrease in its abundance with depth, and the presence of MOB from other genera such as Methyloceanibacter, Marine methylotrophic group 2, pltb−vmat−59, and unclassified genera of MOB families Methylomonadaceae and Methyloligellaceae. At Hinlopen East, we found the largest MOB diversity. Methyloprofundus was the most abundant genus, followed by Marine methylotrophic group 2 and Methyloceanibacter. Additionally, reads of Milano−WF1B−03 were found in sediment layers at different depths (Figure 6; Supplementary Figure S2). Methane concentrations within sediments were notably higher at Hinlopen East, potentially influencing the observed higher diversity of MOB.
3.5 Statistical analysis
Comparison of the bacterial community composition (i.e., methanotrophs and other microbes) in the water column and in sediments was performed by a non−metric multidimensional scaling (NMDS) analysis. For this, the microbial community ASV data were converted to Bray−Curtis community dissimilarities. The NMDS results (Figure 7) reveal similarities between sediment samples from Norskebanken and Hinlopen West, that contrast Hinlopen East and Hinlopen South. Within these groups, surface sediments (<15 cm) and the deeper sediments (>15 cm) form distinct clusters (in particular at Hinlopen South and East). The water column samples form a separate group, with a clear differentiation between the surface and bottom water communities. Notably, the bacterial communities in the bottom waters were more similar to surface sediment communities, particularly at Hinlopen East.
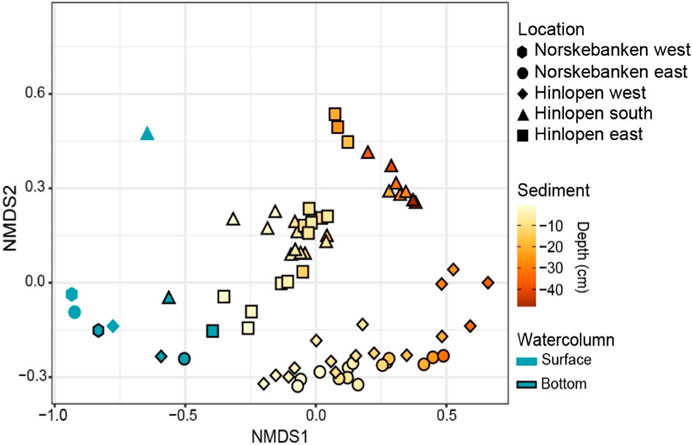
Figure 7. Non−metric multidimensional scaling (NMDS) plot based on Bray−Curtis’s dissimilarities using log−transformed ASV reads. Each sampling site is represented by a unique symbol shape. Sediment data are color−coded according to sediment depth, while water column samples are indicated by blue color with bottom samples having a black outline.
We further visualized overlaps in microbial community structures with the aid of Venn diagrams. For instance, 59% of ASVs in bottom waters at Norskebanken East and the Hinlopen region were the same (Figure 8). Similarly, we found a substantial overlap in ASVs when comparing sediments and bottom waters. At Hinlopen East, 36% of ASV in bottom waters and surface sediments were the same, while the percentage of shared ASVs was ∼20% at the other stations.
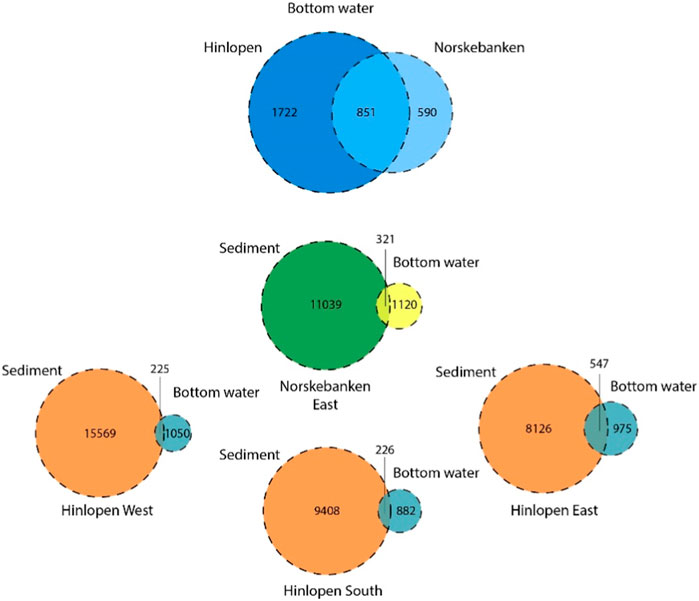
Figure 8. Venn diagram visualizing the distribution and overlap of ASVs across sampling regions. The blue circles indicate ASVs found in bottom waters from Norskebanken and Hinlopen (all stations combined). The orange/blue circles indicate ASVs present in sediments, with overlap observed in bottom waters from Hinlopen West, East, and South. The green/yellow circles indicate ASVs identified in sediments overlapping with bottom waters from Norskebanken East. Circle size reflects the number of ASVs within each group, with overlapping regions indicating shared ASVs between different groups.
4 Discussion
In this study, we investigate methane dynamics and associated microbial communities at two large cold seep areas, Norskebanken and Hinlopen Trough, which are located on the shelf North of Svalbard (Figure 1). The WSC transports relatively warm Atlantic water, crosses the large seep areas West of Svalbard before a side branch of the current deviates and flows North of Svalbard to the East. This side branch then crosses the Yermak plateau and the Norskebanken seep area before entering into the Hinlopen Trough area (Menze et al., 2020).
4.1 Methane dynamics at the cold seeps at Norskebanken and Hinlopen Trough
The studied areas at Norskebanken and Hinlopen Trough feature many active seepage sites where methane bubbles are released from the sea floor, as previously documented during a research expedition in 2013 (Geissler et al., 2016). This suggests that seepage in the two areas has been ongoing for at least a decade. The total number of detected flares was similar at Norskebanken (n = 288) and Hinlopen Trough (n = 239). However, flare heights between the two locations were substantially different, 35 m at Norskebanken and 98 m at Hinlopen Trough. We also found higher methane concentrations in the water column at Hinlopen Trough (Figure 4; Table 1) suggesting a higher seepage activity there. The water column at Hinlopen Trough also appears to support a higher standing stock and activity of MOBs. The maximum methane concentration (4,461 nM) and methane oxidation rates (107 nM d−1) that we measured at Hinlopen East are, to the best of our knowledge, the highest measured values in the Arctic Ocean. These concentrations and rates are comparable to measurements at sites of accidental, large scale gas release events at offshore hydrocarbon exploitation facilities (Valentine et al., 2010; Schneider von Deimling et al., 2015). Nevertheless, the horizontal extent of waters with high methane concentration and high MOx remains unknown as we positioned the CTD frame in the gas plume but did not measure across the gas release site (e.g., along a transect).
Independent of the sampling area, methane concentrations increased with depth, and methane inventories showed that between 73% and 90% of the dissolved methane was present in bottom waters. Rising bubbles constantly exchange gases with the surrounding sea water so that their initial methane content decreases during ascent, thus with distance from the sea floor (Leifer and Patro, 2002). The vertical methane profile, as well as transport in pure gas form, is mainly dependent on gas bubble size, flow rate (at the seabed) and vertical exchange of water masses (Jansson et al., 2019). We did not measure the size of methane bubbles, but the ROV video footage suggests that they are a few mm, likely <5 mm in diameter, when they escape from small orifices at the seafloor. Model simulations in similar conditions (offshore Western Spitsbergen, temperature ∼4°C and salinity ∼35 psu), using a Gaussian bubble size distribution peaking at 6 mm show that most (>90%) if not all of the methane will be exchanged with ambient water masses within ∼100 m of water column (Jansson et al., 2019). Density stratification reduces water mass exchange between well mixed surface and deeper water layers so that dissolved methane primarily remains in bottom waters (Rudels et al., 1991; James et al., 2016; Silyakova et al., 2020). Though bubbles may cross the pycnocline at our seep areas, it seems unlikely that they still contain high amounts of methane at the sea surface. This also explains the only slightly oversaturated methane concentrations when compared to the atmospheric equilibrium (∼3 nM) - with the exception of Hinlopen East, where we found much higher surface water methane concentrations (∼30 nM). Since the vertical stratification is similar between the Hinlopen sampling stations, this indicates that the gas flow from the seabed at Hinlopen East was comparably high, potentially accompanied by a larger bubble sizes. This aspect needs to be further investigated in the future, for example, through geometrically calibrated video analysis, calibrated hydroacoustic, air measurements and/or model simulations.
Similar to methane concentrations, MOx was generally highest in bottom waters and at the more active sites in Hinlopen Trough, foremost Hinlopen East. With the exception of Hinlopen East bottom waters, MOx was typically in the range of a few nM d−1; these values are consistent with previous studies investigating MOx in Arctic bottom waters at other locations around Svalbard (Mau et al., 2013; Gentz et al., 2014; Steinle et al., 2015; Gründger et al., 2021). On average, MOx in bottom waters was about 3 to 6 −fold (Norskebanken and Hinlopen south and east) and 33-fold (Hinlopen east) higher than in surface waters, indicating a more active MOB community in bottom waters. Dissolved methane availability was approximately 2–6 -fold (Norskebanken and Hinlopen South and East) and 29-fold (Hinlopen east) higher in bottom waters, indicating that MOx activity was primarily driven by substrate availability. However, the first−order rate constant, k, was only 7%–20% higher in bottom waters suggesting that MOx approaches (pseudo) zero order kinetics. We argue that this is caused by the very high access of methane in bottom waters which is not matched by a proportional increase in the standing stock of MOB in this water layer (Czepiel et al., 1996). In this situation, MOx is limited by the lack of available reaction sites (enzymes/MOB cells), so an increase in methane concentration does not result in a proportional increase in MOx. Furthermore, MOB also contends with other substrate limitations, such as the availability of essential elements like nitrogen, phosphorus, and trace metals, which are crucial for their growth. Nevertheless, the efficiency of MOx was high, particularly at Hinlopen South and East; methane turnover times were on the order of months at all locations (Table 1), which is much lower when compared to the seeps west of Svalbard (Gründger et al., 2021), but similar to findings from hydrothermal vents and maximum turnover times at other cold seeps (James et al., 2016).
4.2 Community of methane oxidizing bacteria
MOBs comprised a minor, though substantial fraction of the overall microbial community (up to 1.76%, Figure 5) and the relative abundance of MOBs was higher in bottom waters compared to surface waters. While DNA extraction and amplification protocols vary, it is worth noting that the abundance of MOBs observed in this study was somewhat higher compared to previous investigations of marine MOBs amounting to <1% at the highly active and spatially extensive seep sites west off Svalbard (Steinle et al., 2015; Gründger et al., 2021). However, the dominant MOBs found in our study, i.e., members of the Milano−WF1B cluster and Methyloprofundus are Type I MOB that are often found in the water column of cold seeps (Pop Ristova et al., 2015; Savvichev et al., 2018; Mau et al., 2020).
We found strong differences in MOB abundance when comparing surface and bottom waters, matching the segregation of these water layers (see below). The community composition of MOB also varied among the locations. Most prominently, we detected members of the Marine Methylotrophic group 2 in bottom waters at Hinlopen East, but not at the other sites. Members of this group are typically found in methane−rich waters and surface sediments (Ruff et al., 2013; Steinle et al., 2016; Uhlig et al., 2018). Indeed, we also found members of this group in high abundance in sediments at Hinlopen East, where seepage activity was particularly high. Our results thus suggest that members of the Marine Methylotrophic group 2 might be recruited from sediments, i.e., transported with rising bubbles into bottom waters and in the wake of the bubbles further upwards (see below).
Other strong differences in MOB community composition were the almost exclusive presence of Methyloceanibacter at Norskebanken and, to a lesser degree, at Hinlopen West. Some members of this genus may oxidize methane with a soluble methane monooxygenase (sMMO) similar to classical Type II MOB (Vekeman et al., 2016). The relative abundance of this group was much lower at Hinlopen South and East, where, instead, we found higher proportions of Methyloprofundus. These sites, in particular Hinlopen East, featured the highest sediment MOB diversity of all sites. With our data set, we cannot determine which environmental factors drive MOB community composition at Norskebanken and Hinlopen Trough. Nevertheless, the sites differ in (apparent) methane availability and sediment characteristics with coarser/more rocky sediments with relatively low methane levels at Norskebanken and finer and methane enriched sediments in Hinlopen Trough, which could be a key factor selecting for distinct MOBs.
MOBs were consistently present within the top decimeter of surface sediments (i.e., the section that we could target at Norskebanken and Hinlopen Trough). However, O2 in marine sediments is typically consumed within the upper millimeters of the sediment surface (Jørgensen and Kasten, 2006). Unless that bio−irrigation through larger marine benthic organisms introduces O2 to deeper sediment layers (Kristensen, 2000; Dauwe et al., 2001; Niemann et al., 2006), or that some of the detected MOBs can utilize electron acceptors other than O2 (Kits et al., 2015; Martinez-Cruz et al., 2017; Su et al., 2023), it seems likely that MOBs in subsurface sediments at Norskebanken and Hinlopen Trough are mostly dormant in situ. Nevertheless, at Hinlopen Trough (specifically station East), we found a maximum in MOB abundance close to the sediment surface (Figure 6; Supplementary Figure S2) suggesting that MOB cell numbers near the sediment−water interface in this region are elevated, too. Notably, this pattern aligns with the observed higher methane availability, reaching 11 mM, in this area. Such elevated MOB abundance near the sediment surface is consistent with earlier reports on high MOB abundances at highly active seeps (Niemann et al., 2006; Steinle et al., 2016).
Overall, the MOB community composition was more diverse at Hinlopen East, implying a comparably greater range of methane−consuming processes and/or associated microbial interactions. This increased diversity and complexity could be driven by larger substrate availability, which matches the overall high values of MOx at Hinlopen East. The observed variations in MOB abundance and community composition among the different locations highlight the heterogeneity of seep environments. These differences are likely influenced by various environmental conditions, including sediment characteristics, availability of methane sources, essential elements, and local hydrodynamic factors. The unique combination of these factors at each seep location investigated here likely shapes the MOB community structure and its functioning in methane oxidation.
4.3 Segregation and connectivity
Across multiple locations in Norskebanken and Hinlopen Trough, this study explores MOBs and other microbes that are, potentially, involved in methane cycling in the water column and sediments. Our findings indicate a notable dissimilarity in community composition when contrasting sediment and water column samples from Norskebanken and Hinlopen West, while revealing a more pronounced similarity in the communities within Hinlopen South and East. This pattern was also visible when considering the entire bacterial community. Previous research has shown that MOBs, along with other microbes, can be transported from sediments into the water column via drag induced by rising bubbles − a phenomenon that has been coined as ‘the bubble shuttle’ (Schmale et al., 2015). This bubble mediated transport has been shown for a few marine seeps at different marine locations (Schmale et al., 2015; Steinle et al., 2016; Jordan et al., 2020; 2021). As a result of this transport process, water column MOBs may be recruited, at least in parts, from sediments. Our NMDS and Venn diagram analysis (Figures 7, 8) indeed indicates a higher degree of similarity of surface sediment and bottom water communities (while this similarity decreases when comparing the microbial community in deeper sediment layers with bottom waters). This was mostly pronounced at Hinlopen East, where we also found the highest seepage activity. At this site, we also found all of the water column MOBs in sediments. For the seeps North of Svalbard, our data consequently suggest that sedimentary microbes, including MOBs, are translocated from surface sediments to the water column via a ‘bubble shuttle’ effect.
The observed variations in the overlap of the microbial community structure in bottom waters versus surface sediments when comparing the different locations might be related to differences in sediment characteristics and seep activity. Norskebanken features rocky sediments, while sediments at Hinlopen are predominantly muddy, with a greater abundance of benthic megafauna (Supplementary Figure S3). The variation in sediment composition likely influences the mobilization of sediment particles through rising bubbles and whether MOBs, potentially attached to particles/surfaces, are dragged into the water column where they are subsequently dispersed.
MOB communities in bottom waters exhibited similar characteristics across all locations (Figure 5). This observation prompted us to investigate the potential for hydrological connectivity, i.e., for frequent and substantial water mass exchange between the seep areas at Norskebanken and Hinlopen. Previous studies by (Menze et al., 2020) measured and modelled current dynamics north of Svalbard showing a profound eastern branch of the West Spitsbergen Current following the northern shelf break of Norskebanken with inflow into Hinlopen straight as well as onto Norskebanken proper at its western depression. Our ADCP transect (Figure 1B) provided in situ measurements approximately at sampling time. It has to be noted that our ADCP measurements (Figures 1C,D) only provide a snapshot of the situation at transect time and are influenced by tidal and other short−term effects, such as, e.g., wind forcing. They do not resolve net transport trajectories over longer time scales across Norskebanken. Nonetheless, this transect clearly highlights water mass flow crossing Norskebanken from West to East and we observed a strong out−trough plume associated with the eastern bank of Hinlopen in a separate ADCP transect. This is generally in line with observations and model simulations in (Menze et al., 2020). Similarities in water mass properties at the two sampling stations support the notion that there is considerable exchange of water masses between the Hinlopen and Norskebanken stations. It is also important to consider the potential for periodic and frequent exchange of water masses between the sampling sites due to tidal and/or eddy activity. The distance between the Norskebanken and Hinlopen station is approximately 50 km, which is on the high end of typical eddy length scales in the region (Wekerle et al., 2020). However, considerable baroclinic and atmospheric forcing, as well as freeze/melt processes and energy provided by the West Spitsbergen Current, make the frequent presence of eddies and turbulent flows, which can drive water mass exchange between the sites, likely. This notion is further supported by our ADCP data, which show strong currents not only in the West Spitsbergen Current core but also across large portions of Norskebanken.
Furthermore, our Venn diagram analysis (Figure 8) shows a substantial overlap in the microbial community composition in bottom waters at Norskebanken and Hinlopen (Figure 5), indicating a hydrological connection. This suggests that, along with water masses, MOBs are likely transported between the two seep areas. Hence, some of the MOBs in bottom waters at Hinlopen (in addition to a sedimentary origin) may indeed be recruited from the Norskebanken seep area.
Approximately 250 km away of Norskebanken and Hinlopen lies the massive seep area off Prins Karls Forlandet (West of Svalbard). There, MOBs in bottom waters were dominated by Milano−WF1B−03 and Methyloprofundus (Steinle et al., 2015; Gründger et al., 2021), matching our observations at Norskebanken and Hinlopen Trough. Also, Verrucomicrobia of the families Rubritaleaceae and Luteolibacter were detected in bottom waters West of Svalbard (Gründger et al., 2021) and in bottom waters at our sites (Supplementary Figure S4). Previous studies by (Menze et al., 2020) and our data show that AW water from the WSC enters Hinlopen facilitated through generally eastward water mass transport North of Svalbard. Tentatively, we therefore suggest that water column microbes that drift with the WSC (Steinle et al., 2015) towards the North might be transported East to the Yermak plateau North of Svalbard. The West Spitsbergen current is consequently a potential conduit for the dispersal and redistribution of microbial populations across geographically distant seep habitats.
5 Summary and conclusion
This study investigates methane dynamics and associated microbial communities at cold seep areas North of Svalbard, Norskebanken and Hinlopen Trough. The activity of MOBs in the water column was mostly determined by the availability of methane; under conditions of extremely high methane concentrations, to the point that MOx approaches pseudo zero order kinetics. The MOB community composition in the water column and in sediments at Hinlopen Trough showed similarities, indicating that MOBs in the water column are, at least partially, recruited from sediments. This could not be observed at Norskebanken, potentially related to the rocky sea floor there. In addition to a bubble−mediated transport, the high degree of similarity when comparing MOBs from North and West of Svalbard suggests that the major current system in the region, the WSC, translocate a seeding community of MOBs from the seeps West of Svalbard towards those North of Svalbard. Ocean currents thus facilitate long−range transport and hydrologically connect spatially segregated ‘submarine island habitats’ such as cold seeps. Additionally, the microbial community structures on local/regional scales may be influenced by advective transport of microbes facilitated through the ascent of bubbles or through currents. This mechanism holds the potential to regulate crucial microbial processes, including trace gas cycling.
Data availability statement
All data will be archived and made publicly available in the NIOZ data base DAS (Data Archive System, https://doi.org/10.25850/nioz/7b.b.pf). The sequence data generated in this study have been deposited in the NCBI BioProject database under accession number PRJNA1118678.
Author contributions
TG: Conceptualization, Formal Analysis, Investigation, Methodology, Software, Validation, Visualization, Writing–original draft. DK: Formal Analysis, Investigation, Methodology, Writing–review and editing. MM: Writing–review and editing, Formal Analysis, Investigation, Software. CA: Writing–review and editing, Formal Analysis, Investigation. GP: Supervision, Writing–review and editing, Investigation. ML: Formal Analysis, Investigation, Writing–review and editing. KD: Data curation, Formal analysis, Visualization, Writing–review and editing. BF: Writing–review and editing, Conceptualization, Funding acquisition, Supervision. MS: Supervision, Writing–review and editing, Funding acquisition. HN: Conceptualization, Funding acquisition, Methodology, Project administration, Resources, Supervision, Validation, Writing–review and editing.
Funding
The author(s) declare that financial support was received for the research, authorship, and/or publication of this article. We would like to extend our sincere appreciation to Utrecht University and NIOZ for their generous internal grant that played a pivotal role in supporting this project. Additionally, we wish to express our profound gratitude to the Center for Arctic Gas Hydrate Environment and Climate (CAGE), which provided essential financial support through RCN grant No. 223259 for our research. Furthermore, we would like to acknowledge the invaluable contribution of the AKMA project, also funded by RCN grant No. 287869, to our research efforts.
Acknowledgments
The unwavering support from the captain, crew, and onboard scientific team of R/V Kronprins Haakon, as well as the operators of ROV ÆGIR 6000, played an instrumental role in the success of our research. We wish to express our profound gratitude to Marie Stetzler from CAGE for her invaluable contribution to the molecular work carried out in this study. All support has been instrumental in the success of our work, and we are genuinely thankful for the received contributions.
Conflict of interest
The authors declare that the research was conducted in the absence of any commercial or financial relationships that could be construed as a potential conflict of interest.
Publisher’s note
All claims expressed in this article are solely those of the authors and do not necessarily represent those of their affiliated organizations, or those of the publisher, the editors and the reviewers. Any product that may be evaluated in this article, or claim that may be made by its manufacturer, is not guaranteed or endorsed by the publisher.
Supplementary material
The Supplementary Material for this article can be found online at: https://www.frontiersin.org/articles/10.3389/feart.2024.1287226/full#supplementary-material
References
Argentino, C., Savini, A., and Panieri, G. (2022). “Integrating fine-scale habitat mapping and pore water analysis in cold seep research: a case study from the SW barents sea,” in World atlas of submarine gas hydrates in continental margins. Editors J. Mienert, C. Berndt, A. M. Tréhu, A. Camerlenghi, and C.-S. Liu (Cham: Springer International Publishing), 505–514.
Berndt, C., Feseker, T., Treude, T., Krastel, S., Liebetrau, V., Niemann, H., et al. (2014). Temporal constraints on hydrate-controlled methane seepage off svalbard. Science 343, 284–287. doi:10.1126/science.1246298
Boetius, A., and Wenzhöfer, F. (2013). Seafloor oxygen consumption fuelled by methane from cold seeps. Nat. Geosci. 6, 725–734. doi:10.1038/ngeo1926
Callahan, B. J., Mcmurdie, P. J., Rosen, M. J., Han, A. W., Johnson, A. J. A., and Holmes, S. P. (2016). DADA2: high-resolution sample inference from Illumina amplicon data. Nat. Methods 13, 581–583. doi:10.1038/nmeth.3869
Cottier, F., Tverberg, V., Inall, M., Svendsen, H., Nilsen, F., and Griffiths, C. (2005). Water mass modification in an Arctic fjord through cross-shelf exchange: the seasonal hydrography of Kongsfjorden, Svalbard. J. Geophys. Res. Oceans 110. doi:10.1029/2004jc002757
Crespo-Medina, M., Meile, C. D., Hunter, K. S., Diercks, A. R., Asper, V. L., Orphan, V. J., et al. (2014). The rise and fall of methanotrophy following a deepwater oil-well blowout. Nat. Geosci. 7, 423–427. doi:10.1038/ngeo2156
Czepiel, P. M., Mosher, B., Crill, P. M., and Harriss, R. C. (1996). Quantifying the effect of oxidation on landfill methane emissions. J. Geophys. Res. Atmos. 101, 16721–16729. doi:10.1029/96jd00222
Dauwe, B., Middelburg, J. J., and Herman, P. M. (2001). Effect of oxygen on the degradability of organic matter in subtidal and intertidal sediments of the North Sea area. Mar. Ecol. Prog. Ser. 215, 13–22. doi:10.3354/meps215013
De Groot, T. R., Mol, A. M., Mesdag, K., Ramond, P., Ndhlovu, R., Engelmann, J. C., et al. (2023). Diel and seasonal methane dynamics in the shallow and turbulent Wadden Sea. EGUsphere 2023, 3857–3872. doi:10.5194/bg-20-3857-2023
Dølven, K. O., Ferré, B., Silyakova, A., Jansson, P., Linke, P., and Moser, M. (2022). Autonomous methane seep site monitoring offshore western Svalbard: hourly to seasonal variability and associated oceanographic parameters. Ocean. Sci. 18, 233–254. doi:10.5194/os-18-233-2022
Etminan, M., Myhre, G., Highwood, E. J., and Shine, K. P. (2016). Radiative forcing of carbon dioxide, methane, and nitrous oxide: a significant revision of the methane radiative forcing. Geophys. Res. Lett. 43 (12), 614–612. doi:10.1002/2016gl071930
Fisher, C., Urcuyo, I., Simpkins, M., and Nix, E. (1997). Life in the slow lane: growth and longevity of cold-seep vestimentiferans. Mar. Ecol. 18, 83–94. doi:10.1111/j.1439-0485.1997.tb00428.x
Geissler, W. H., Gebhardt, A. C., Gross, F., Wollenburg, J., Jensen, L., Schmidt-Aursch, M. C., et al. (2016). Arctic megaslide at presumed rest. Sci. Rep. 6, 38529. doi:10.1038/srep38529
Gentz, T., Damm, E., Schneider Von Deimling, J., Mau, S., Mcginnis, D. F., and Schlüter, M. (2014). A water column study of methane around gas flares located at the West Spitsbergen continental margin. Cont. Shelf Res. 72, 107–118. doi:10.1016/j.csr.2013.07.013
Gibson, R., Atkinson, R., and Gordon, J. (2005). Ecology of cold seep sediments: interactions of fauna with flow, chemistry and microbes. Oceanogr. Mar. Biol. Annu. Rev. 43, 1–46. doi:10.1201/9781420050943
Graves, C. A., Steinle, L., Rehder, G., Niemann, H., Connelly, D. P., Lowry, D., et al. (2015). Fluxes and fate of dissolved methane released at the seafloor at the landward limit of the gas hydrate stability zone offshore western Svalbard. J. Geophys. Res. Oceans 120, 6185–6201. doi:10.1002/2015jc011084
Green, J. D. (2005). “Headspace analysis | static,” in Encyclopedia of analytical science. Editors P. Worsfold, A. Townshend, and C. Poole (Oxford: Elsevier), 229–236.
Gründger, F., Probandt, D., Knittel, K., Carrier, V., Kalenitchenko, D., Silyakova, A., et al. (2021). Seasonal shifts of microbial methane oxidation in Arctic shelf waters above gas seeps. Limnol. Oceanogr. 66, 1896–1914. doi:10.1002/lno.11731
IPCC (2021). “Climate Change 2021: The Physical Science Basis,” in Contribution of Working Group I to the Sixth Assessment Report of the Intergovernmental Panel on Climate Change. Editors V. P. Masson-Delmotte, A. Zhai, S. L. Pirani, C. Connors, S. Péan, N. Bergeret al. (Cambridge, United Kingdom and New York, NY, United States: Cambridge University Press) (In press). doi:10.1017/9781009157896
James, R. H., Bousquet, P., Bussmann, I., Haeckel, M., Kipfer, R., Leifer, I., et al. (2016). Effects of climate change on methane emissions from seafloor sediments in the Arctic Ocean: a review. Limnol. Oceanogr. 61, S283–S299. doi:10.1002/lno.10307
Jansson, P., Ferré, B., Silyakova, A., Dølven, K. O., and Omstedt, A. (2019). A new numerical model for understanding free and dissolved gas progression toward the atmosphere in aquatic methane seepage systems. Limnol. Oceanogr. Methods 17, 223–239. doi:10.1002/lom3.10307
Jordan, S. F. A., Gräwe, U., Treude, T., Van Der Lee, E. M., Schneider Von Deimling, J., Rehder, G., et al. (2021). Pelagic methane sink enhanced by benthic methanotrophs ejected from a gas seep. Geophys. Res. Lett. 48, e2021GL094819. doi:10.1029/2021gl094819
Jordan, S. F. A., Treude, T., Leifer, I., Janssen, R., Werner, J., Schulz-Vogt, H., et al. (2020). Bubble-mediated transport of benthic microorganisms into the water column: identification of methanotrophs and implication of seepage intensity on transport efficiency. Sci. Rep. 10, 4682. doi:10.1038/s41598-020-61446-9
Jørgensen, B. B., and Kasten, S. (2006). “Sulfur cycling and methane oxidation,” in Marine geochemistry. Editors H. D. Schulz, and M. Zabel (Berlin, Heidelberg: Springer Berlin Heidelberg), 271–309.
Kits, K. D., Klotz, M. G., and Stein, L. Y. (2015). Methane oxidation coupled to nitrate reduction under hypoxia by the Gammaproteobacterium <i>M</i>ethylomonas denitrificans, sp. nov. type strain FJG1. Environ. Microbiol. 17, 3219–3232. doi:10.1111/1462-2920.12772
Knief, C. (2015). Diversity and habitat preferences of cultivated and uncultivated aerobic methanotrophic bacteria evaluated based on pmoA as molecular marker. Front. Microbiol. 6, 1346. doi:10.3389/fmicb.2015.01346
Kristensen, E. (2000). Organic matter diagenesis at the oxic/anoxic interface in coastal marine sediments, with emphasis on the role of burrowing animals. Hydrobiologia 426, 1–24. doi:10.1007/978-94-011-4148-2_1
Leifer, I., and Patro, R. K. (2002). The bubble mechanism for methane transport from the shallow sea bed to the surface: a review and sensitivity study. Cont. Shelf Res. 22, 2409–2428. doi:10.1016/s0278-4343(02)00065-1
Martinez-Cruz, K., Leewis, M.-C., Herriott, I. C., Sepulveda-Jauregui, A., Anthony, K. W., Thalasso, F., et al. (2017). Anaerobic oxidation of methane by aerobic methanotrophs in sub-Arctic lake sediments. Sci. Total Environ. 607-608, 23–31. doi:10.1016/j.scitotenv.2017.06.187
Mau, S., Blees, J., Helmke, E., Niemann, H., and Damm, E. (2013). Vertical distribution of methane oxidation and methanotrophic response to elevated methane concentrations in stratified waters of the Arctic fjord Storfjorden (Svalbard, Norway). Biogeosciences 10, 6267–6278. doi:10.5194/bg-10-6267-2013
Mau, S., Römer, M., Torres, M. E., Bussmann, I., Pape, T., Damm, E., et al. (2017). Widespread methane seepage along the continental margin off Svalbard - from Bjørnøya to Kongsfjorden. Sci. Rep. 7, 42997. doi:10.1038/srep42997
Mau, S., Tu, T.-H., Becker, M., Dos Santos Ferreira, C., Chen, J.-N., Lin, L.-H., et al. (2020). Methane seeps and independent methane plumes in the south China sea offshore taiwan. Front. Mar. Sci. 7. doi:10.3389/fmars.2020.00543
Menze, S., Ingvaldsen, R. B., Nikolopoulos, A., Hattermann, T., Albretsen, J., and Gjøsæter, H. (2020). Productive detours – Atlantic water inflow and acoustic backscatter in the major troughs along the Svalbard shelf. Prog. Oceanogr. 188, 102447. doi:10.1016/j.pocean.2020.102447
Niemann, H., Losekann, T., De Beer, D., Elvert, M., Nadalig, T., Knittel, K., et al. (2006). Novel microbial communities of the Haakon Mosby mud volcano and their role as a methane sink. Nature 443, 854–858. doi:10.1038/nature05227
Niemann, H., Steinle, L., Blees, J., Bussmann, I., Treude, T., Krause, S., et al. (2015). Toxic effects of lab-grade butyl rubber stoppers on aerobic methane oxidation. Limnol. Oceanogr. Methods 13, 40–52. doi:10.1002/lom3.10005
Oziel, L., Baudena, A., Ardyna, M., Massicotte, P., Randelhoff, A., Sallée, J. B., et al. (2020). Faster Atlantic currents drive poleward expansion of temperate phytoplankton in the Arctic Ocean. Nat. Commun. 11, 1705. doi:10.1038/s41467-020-15485-5
Parada, A. E., Needham, D. M., and Fuhrman, J. A. (2016). Every base matters: assessing small subunit rRNA primers for marine microbiomes with mock communities, time series and global field samples. Environ. Microbiol. 18, 1403–1414. doi:10.1111/1462-2920.13023
Pop Ristova, P., Wenzhöfer, F., Ramette, A., Felden, J., and Boetius, A. (2015). Spatial scales of bacterial community diversity at cold seeps (Eastern Mediterranean Sea). ISME J. 9, 1306–1318. doi:10.1038/ismej.2014.217
Quast, C., Pruesse, E., Yilmaz, P., Gerken, J., Schweer, T., Yarza, P., et al. (2013). The SILVA ribosomal RNA gene database project: improved data processing and web-based tools. Nucleic Acids Res. 41, D590–D596. doi:10.1093/nar/gks1219
Reeburgh, W. S. (2007). Oceanic methane biogeochemistry. Chem. Rev. 107, 486–513. doi:10.1021/cr050362v
Römer, M., Riedel, M., Scherwath, M., Heesemann, M., and Spence, G. D. (2016). Tidally controlled gas bubble emissions: a comprehensive study using long-term monitoring data from the NEPTUNE cabled observatory offshore Vancouver Island. Geochem. Geophys. Geosystems 17, 3797–3814. doi:10.1002/2016gc006528
Rudels, B., Larsson, A.-M., and Sehlstedt, P.-I. (1991). Stratification and water mass formation in the Arctic Ocean: some implications for the nutrient distribution. Polar Res. 10, 19–32. doi:10.3402/polar.v10i1.6724
Ruff, S. E., Arnds, J., Knittel, K., Amann, R., Wegener, G., Ramette, A., et al. (2013). Microbial communities of deep-sea methane seeps at hikurangi continental margin (New Zealand). PLOS ONE 8, e72627. doi:10.1371/journal.pone.0072627
Sauer, S., Hong, W.-L., Yao, H., Lepland, A., Klug, M., Eichinger, F., et al. (2021). Methane transport and sources in an Arctic deep-water cold seep offshore NW Svalbard (Vestnesa Ridge, 79°N). Deep Sea Res. Part I Oceanogr. Res. Pap. 167, 103430. doi:10.1016/j.dsr.2020.103430
Savvichev, A. S., Kadnikov, V. V., Kravchishina, M. D., Galkin, S. V., Novigatskii, A. N., Sigalevich, P. A., et al. (2018). Methane as an organic matter source and the trophic basis of a laptev sea cold seep microbial community. Geomicrobiol. J. 35, 411–423. doi:10.1080/01490451.2017.1382612
Schloss, P. D., Westcott, S. L., Ryabin, T., Hall, J. R., Hartmann, M., Hollister, E. B., et al. (2009). Introducing mothur: open-source, platform-independent, community-supported software for describing and comparing microbial communities. Appl. Environ. Microbiol. 75, 7537–7541. doi:10.1128/aem.01541-09
Schmale, O., Leifer, I., Deimling, J. S. V., Stolle, C., Krause, S., Kießlich, K., et al. (2015). Bubble Transport Mechanism: indications for a gas bubble-mediated inoculation of benthic methanotrophs into the water column. Cont. Shelf Res. 103, 70–78. doi:10.1016/j.csr.2015.04.022
Schneider Von Deimling, J., Linke, P., Schmidt, M., and Rehder, G. (2015). Ongoing methane discharge at well site 22/4b (North Sea) and discovery of a spiral vortex bubble plume motion. Mar. Petroleum Geol. 68, 718–730. doi:10.1016/j.marpetgeo.2015.07.026
Silyakova, A., Jansson, P., Serov, P., Ferré, B., Pavlov, A. K., Hattermann, T., et al. (2020). Physical controls of dynamics of methane venting from a shallow seep area west of Svalbard. Cont. Shelf Res. 194, 104030. doi:10.1016/j.csr.2019.104030
Steinle, L., Graves, A. C., Treude, T., Ferré, B., Biastoch, A., Bussmann, I., et al. (2015). Water column methanotrophy controlled by a rapid oceanographic switch. Nat. Geosci. 8, 378–382. doi:10.1038/ngeo2420
Steinle, L., Maltby, J., Treude, T., Kock, A., Bange, H. W., Engbersen, N., et al. (2017). Effects of low oxygen concentrations on aerobic methane oxidation in seasonally hypoxic coastal waters. Biogeosciences 14, 1631–1645. doi:10.5194/bg-14-1631-2017
Steinle, L., Schmidt, M., Bryant, L., Haeckel, M., Linke, P., Sommer, S., et al. (2016). Linked sediment and water-column methanotrophy at a man-made gas blowout in the North Sea: implications for methane budgeting in seasonally stratified shallow seas. Limnol. Oceanogr. 61, S367–S386. doi:10.1002/lno.10388
Su, G., Lehmann, M. F., Tischer, J., Weber, Y., Lepori, F., Walser, J.-C., et al. (2023). Water column dynamics control nitrite-dependent anaerobic methane oxidation by Candidatus “Methylomirabilis” in stratified lake basins. ISME J. 17, 693–702. doi:10.1038/s41396-023-01382-4
Suess, E. (2020). “Marine cold seeps: background and recent advances,” in Hydrocarbons, oils and lipids: diversity, origin, chemistry and fate. Editor H. Wilkes (Cham: Springer International Publishing), 747–767.
Sultan, N., Plaza-Faverola, A., Vadakkepuliyambatta, S., Buenz, S., and Knies, J. (2020). Impact of tides and sea-level on deep-sea Arctic methane emissions. Nat. Commun. 11, 5087. doi:10.1038/s41467-020-18899-3
Uhlig, C., Kirkpatrick, J. B., D'hondt, S., and Loose, B. (2018). Methane-oxidizing seawater microbial communities from an Arctic shelf. Biogeosciences 15, 3311–3329. doi:10.5194/bg-15-3311-2018
Vaksmaa, A., Knittel, K., Abdala Asbun, A., Goudriaan, M., Ellrott, A., Witte, H. J., et al. (2021). Microbial communities on plastic polymers in the mediterranean sea. Front. Microbiol. 12, 673553. doi:10.3389/fmicb.2021.673553
Valentine, D. L., Kessler, J. D., Redmond, M. C., Mendes, S. D., Heintz, M. B., Farwell, C., et al. (2010). Propane respiration jump-starts microbial response to a deep oil spill. Science 330, 208–211. doi:10.1126/science.1196830
Vekeman, B., Kerckhof, F.-M., Cremers, G., De Vos, P., Vandamme, P., Boon, N., et al. (2016). New Methyloceanibacter diversity from North Sea sediments includes methanotroph containing solely the soluble methane monooxygenase. Environ. Microbiol. 18, 4523–4536. doi:10.1111/1462-2920.13485
Weber, T., Wiseman, N. A., and Kock, A. (2019). Global ocean methane emissions dominated by shallow coastal waters. Nat. Commun. 10, 4584–4610. doi:10.1038/s41467-019-12541-7
Keywords: Arctic, cold seep, methane, methane oxidation, microbial connectivity
Citation: de Groot TR, Kalenitchenko D, Moser M, Argentino C, Panieri G, Lindgren M, Dølven KO, Ferré B, Svenning MM and Niemann H (2024) Methanotroph activity and connectivity between two seep systems north off Svalbard. Front. Earth Sci. 12:1287226. doi: 10.3389/feart.2024.1287226
Received: 01 September 2023; Accepted: 08 May 2024;
Published: 14 June 2024.
Edited by:
Carolyn Ruppel, US Geological Survey (USGS), United StatesReviewed by:
Casey R. J. Hubert, University of Calgary, CanadaWolfram Geissler, Alfred Wegener Institute Helmholtz Centre for Polar and Marine Research (AWI), Germany
Copyright © 2024 de Groot, Kalenitchenko, Moser, Argentino, Panieri, Lindgren, Dølven, Ferré, Svenning and Niemann. This is an open-access article distributed under the terms of the Creative Commons Attribution License (CC BY). The use, distribution or reproduction in other forums is permitted, provided the original author(s) and the copyright owner(s) are credited and that the original publication in this journal is cited, in accordance with accepted academic practice. No use, distribution or reproduction is permitted which does not comply with these terms.
*Correspondence: Tim R. de Groot, tim.de.groot@nioz.nl