Infrared spectroscopy of volcanoes: from laboratory to orbital scale
 Daniel B. Williams
 Michael S. Ramsey
- 1Department of Geology and Environmental Science, University of Pittsburgh, Pittsburgh, PA, United States
- 2Jet Propulsion Laboratory, California Institute of Technology, Pasadena, CA, United States
Understanding the composition, texture, and morphology of volcanic rocks that have erupted at the surface better constrains the eruption style and is vital to infer subsurface processes, the development of magma upon ascent, and the potential for future eruptions. The reflectance and emission spectroscopy of these rocks, collected from the near-infrared (NIR) through the thermal infrared (TIR) portion of the electromagnetic (EM) spectrum, provides the data necessary to retrieve composition, micron-scale surface roughness, and particle size. Remote imaging systems enable the analyses of active volcanoes in remote regions, where sample collection for laboratory analysis poses a significant challenge. Laboratory hyperspectral data of samples acquired at volcanic deposits are easily resampled to the spectral resolution of any infrared sensor and provide a means of estimating the composition of volcanoes and their products worldwide, as well as those on other planetary bodies such as the Moon and Mars. In this review paper, we provide an overview of the current use of infrared reflectance and emission spectroscopy as an analysis tool in volcanology, including ground-based imaging systems that acquire unprecedented detail and serve as testbeds for new orbital concepts. We also discuss the potential impact that future satellite missions will have on volcano science as spectral, spatial, and temporal resolutions improve.
1 Introduction
Mapping igneous rocks at any volcano is an important endeavor for assessing future hazards (Finn, et al., 2007; Sieron et al., 2019; Kereszturi et al., 2020). For example, the combination of different volcanic minerals and glasses provides insight into the lifespan of magma underneath a volcano from generation through eruption, solidification, transport, and deposition at the surface (Popa et al., 2021). The changes in reflected and emitted energy that different surfaces exhibit in different regions of the electromagnetic (EM) spectrum are governed by physical properties from which we can infer the probable processes that led to their eruption. In particular, the use of infrared spectroscopy within the field of volcanology allows us to determine the physiochemical properties of the products of volcanic eruptions, both recent and ancient, on Earth and other planetary bodies. By determining the composition of suspected volcanic deposits, we can then begin to assess the causes and mechanisms behind volcanic eruptions on these objects in the early history of our solar system (Burns, 1989; Flynn et al., 2000).
Emission and reflectance spectroscopy can be performed in several ways, from the assessment of samples in a laboratory setting that have been collected in the field to the acquisition of per-pixel spectra in airborne or satellite image data. One of the significant advantages of infrared spectroscopy is that it can be used at multiple scales and also enables the easy comparison of spectra between laboratory and satellite measurements (Christensen et al., 2000). For example, a sample from an individual lava flow can be measured in a laboratory setting, and the spectrum can subsequently be compared to that of entire lava flow fields that have been imaged by satellite sensors. This is particularly beneficial in the field of planetary science, where for many sites throughout the solar system, we only have data collected using imaging spectrometers and lack collected samples that can be analyzed through other geochemical methods. By comparing infrared spectra obtained by these orbital sensors to laboratory measurements of analog materials, we infer the probable processes that lead to their formation without the need for expensive and logistically difficult sample return missions. A further advantage of laboratory measurements is that they are non-destructive, unlike other analytical methods. However, when coupled with other geochemical analyses, such as x-ray florescence (XRF), details not possible with spectroscopy alone can be obtained, such as the wt percentages (%) of different oxides (Baird, 1984).
The field of remote sensing and its use in volcanology is vast, and this review does not attempt to include all tools and methods applied within the broad field of spectroscopy. Here, we focus on the use of surface reflectance and emission spectroscopy, elucidating how those data help to determine the properties of volcanoes, their landforms, and their products. Here, we focus our attention on terrestrial volcanism, although we also highlight important planetary studies that could aid future spectral studies on Earth. Furthermore, the planetary volcanism literature is vast because infrared data are commonly the only data source available. Therefore, we discuss some of the basic principles, including relevant examples from the literature, with a focus on recent developments rather than attempting an exhaustive review of all studies in the field. We begin by discussing the basic principles of spectroscopy and how electronic and vibrational processes of important ions and compounds in volcanic materials result in diagnostic spectral features. We also provide an overview of the methods used to collect laboratory infrared reflectance and emissivity spectra and discuss how these measurements compare to those taken from field, airborne, and orbital instrumentation. The primary focus is, therefore, the current state of these spectroscopic studies in volcano science and where future measurements may improve.
2 Basic principles of spectroscopy
Although this article is not designed to provide a detailed overview of the theory behind reflectance and emission spectroscopy, some background is warranted to give those readers less familiar with these measurements a foundation in the science. We also discuss the laboratory methods that are used to acquire reflectance and emission spectra and comment on the best practices so that the community understands how these measurements should be acquired, as well as presenting some of the freely available spectral libraries.
The EM spectrum is divided into regions, the divisions of which depend on the application and preference of the author. In this paper, we define the visible-near-infrared (VNIR) as between 0.4 and 1 μm (with visible light defined as 0.4–0.7 μm and NIR defined as 0.7–1.0 μm), the shortwave infrared (SWIR) as 1–2.5 μm, and thermal infrared (TIR) as 2.5–14 μm following the work of Hackwell et al. (1996) and Hecker et al. (2010). However, we also use the terminology VSWIR as a combination of the VNIR and SWIR regions, as these data are commonly acquired together in remote sensing of volcanic minerals.
2.1 Basic principles
All objects in our solar system and beyond radiate energy governed by the temperature of the object as well as its composition. A “perfect” emitter is termed a blackbody, which emits the maximum amount of energy possible at a given wavelength as a function of its temperature. This is determined using the Planck equation:
where B is the blackbody radiance at wavelength λ and temperature T in kelvin, ελ is the wavelength-dependent emissivity, h is Planck’s constant, c is the speed of light in a vacuum, and k is the Boltzmann constant. The wavelength of the peak energy derived from Eq. 1 can be approximated using Wien’s Law:
where λmax is the peak wavelength, b is Wien’s displacement constant, and T is the temperature in kelvin. If emissivity is unity at all wavelengths (i.e., a blackbody), then Eq. 1 produces an ideal Planck curve. The peak of the curve shifts to shorter wavelengths and increases in magnitude (as does the total radiant flux of the object) with an increase in temperature. These curves have implications for determining the wavelength region and spectroscopic measurements that can be acquired of a particular body. By looking at the short wavelength cutoff of each of the Planck curves, for example, any object has a specific wavelength region from which emitted energy can be detected. Additionally, for colder objects, the amount of energy emitted decreases with a decrease in temperature, making them harder to detect. For very cold targets, instrument design parameters, such as the signal-to-noise (SNR) ratio, must be considered.
The spectral emissivity of a specific geologic material is described as the ratio of the energy emitted by the material to the energy emitted by a blackbody at the same temperature. Although a blackbody is a perfect emitter at all wavelengths, natural materials have specific wavelength regions at which energy is absorbed (where observed in emission) or reflected. The fundamental vibrational frequency is termed the Reststrahlen band (RB), which occurs due to the high absorption coefficient of the material. At this frequency, the material is highly reflective (lower emissivity). The intensity of this band is related to the mineral composition and its atomic configuration (Lyon, 1965). Immediately preceding the RB is the Christiansen frequency (CF), where the material’s index of refraction approaches that of the surrounding medium, representing the frequency corresponding to the maximum absorption (i.e., where the emissivity approaches 1).
The relationship between emissivity and reflectance can be approximated through Kirchhoff’s law, which states that
where rλ is hemispherical reflectance. In addition to the CF and RB, we can also use other diagnostic regions of absorption or reflectance that, despite being weaker than the RB, are also indicative of composition. These bands are termed overtones and combination bands and occur at a series of integer multiples of the fundamental absorption band. Calculating the ratio of the material’s measured emission to that of a blackbody allows us to determine the absorption depth and position independently of the temperature. This is demonstrated in Figure 1, which shows the emissivity spectra of common volcanic minerals.
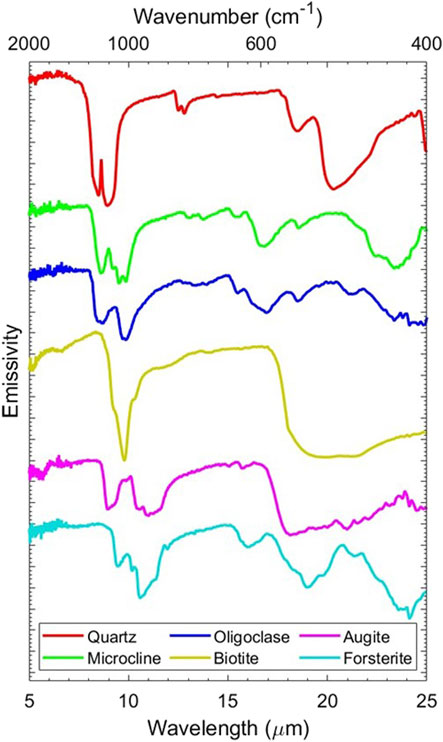
FIGURE 1. TIR emissivity spectra of common volcanic minerals [according to the work of Christensen et al. (2000)]. The RB for each of the minerals occurs between ∼7 and 12 μm. Each spectrum has been offset for clarity, with major Y-axis tick marks representing an emissivity of 0.05. Quartz and biotite have been scaled to provide easier comparison to the other spectra.
The compositional makeup of a material exerts significant control over the amount of energy emitted at any given wavelength. There are distinct differences in the position and strength of these features depending on the composition. For silicate minerals and glasses that make up the bulk of volcanic materials, these fundamental features are found in the 8–12 μm region. Specifically, for silicate minerals, the spectral features are a function of the state of Si–O bonds, with a shift of the RB and CF to shorter wavelengths with an increase in the order of the silicate structure [i.e., shift from isolated (e.g., olivine) to framework (e.g., quartz) silicates]. The same is also true for igneous rocks that shift from low-wt% SiO2 to high (i.e., mafic to felsic), with basalt and gabbro exhibiting longer-wavelength RB absorption than rhyolite and granite (Salisbury and Walter, 1989). This is shown in Figure 2.
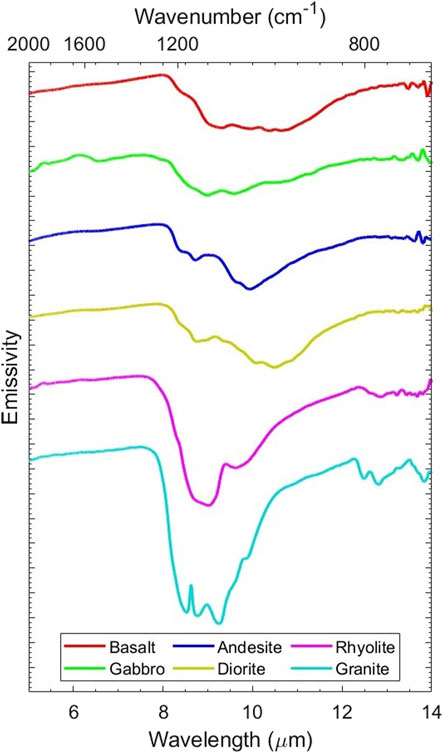
FIGURE 2. TIR emissivity spectra of common volcanic rocks from the JHU spectral library (Salisbury et al., 1991). Each spectrum has been offset for clarity, with major Y-axis tick marks representing an emissivity of 0.05. Spectra were originally collected as hemispherical reflectance measurements but converted to emissivity using Kirchhoff’s law (Eq. 3) to provide better comparison to the pure mineral spectra found in Figure 1. Despite each being mixtures of different minerals, these rocks demonstrate similar trends to minerals, with the increase in SiO2 content being associated with a shift to shorter wavelengths of the Reststrahlen band and Christiansen frequency.
When Kirchhoff’s law is applied, reflectance can be determined from TIR emissivity spectra and vice versa. However, laboratory TIR reflectance measurement approaches, such as bi-directional or biconical, invalidate Kirchhoff’s law, as do scattering effects caused by porosity, macro- and microscale roughness, etc. (Hapke, 1984; Hapke, 2002). However, because the incoming solar radiance remains strong enough up to SWIR wavelengths, we can also measure the solar reflectance in these regions. This opens further possibilities in compositional determination. In the SWIR region, for example, we also observe vibrational processes; however, these processes manifest as reflectance rather than emission. Of particular importance in volcanology is the vibrational mode found in OH−-bearing minerals at ∼ 2.1 μm. This is vital in the identification of alteration products such as clay minerals that are found in hydrothermal deposits (Clark, 1983; Crosta et al., 1998; Rowan et al., 2000). In the VNIR region, higher-energy photons interact with specific atoms at an electronic level. We no longer observe the vibration of atoms but rather changes in the electronic state associated with specific photon frequencies. This is particularly useful for detecting the presence of transition metals such as iron, copper, and sulfur. There are several different effects that are seen in this wavelength range that are diagnostic of the presence of specific elements important to volcanic minerals (e.g., electron transition, conduction band absorption, and the charge transfer effects). Examples of the position and strength of these bands are found in Figure 3.
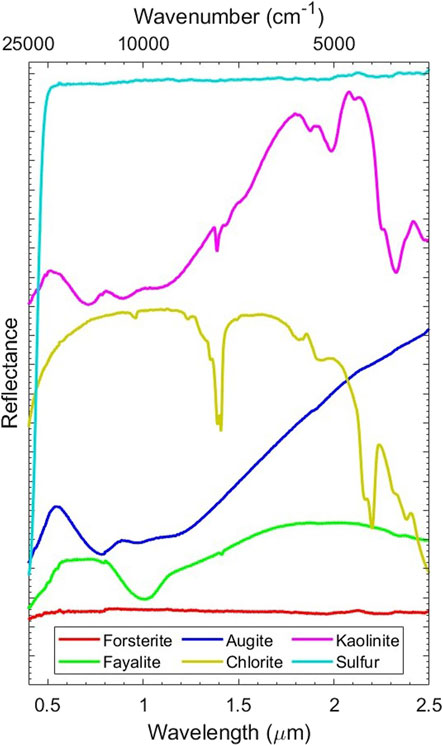
FIGURE 3. Spectra of volcanic and alteration minerals showing the location of key vibrational and electronic diagnostic spectral features. Each spectrum has been offset for clarity, with major Y-axis tick marks representing an emissivity of 5%. Forsterite is shown here to demonstrate that the replacement of Mg with Fe in olivine (fayalite) leads to a featureless spectrum due to a lack of electronic processes. Many other important silicate minerals, such as quartz and plagioclase feldspar, appear similarly featureless and so are not easily identified in VSWIR spectra compared with the TIR.
These effects cause the migration of electronics to higher energy levels in an atom (electron transition and conduction band absorption) or the migration of electrons to other ions found within the material lattice (charge transfer effect). This can be used to identify Fe-rich minerals such as fayalite. Determining its presence in a deposit can help better constrain the properties of magma such as density and viscosity (Le losq et al., 2021).
Independent of the processes that cause VSWIR and TIR spectral features, physical properties of the material such as particle size can result in a change in the spectral contrast potentially combined with the development of new spectral features (Figure 4).
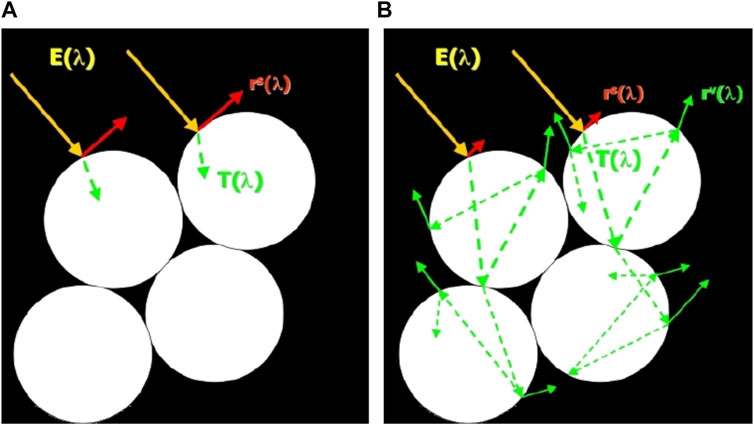
FIGURE 4. Schematic showing the effects of particle size on incident radiance. (A) Behavior of larger grains, where volume scattering is less; (B) how transmission and scattering between grains increase at smaller particle sizes is shown.
In both emissivity and reflectance spectroscopy, incident energy [E(λ)] interacts with the grain boundary. Depending on the material’s index of refraction and absorption coefficient, some fraction of that incident energy is transmitted into the material [T(λ)] and absorbed, whereas the remainder is reflected as a specular component [rs(λ)]. As particle size decreases relative to the incident energy’s wavelength, less of the transmitted component is absorbed, leading to an increased amount of photon scattering occurring at grain-to-grain interfaces. This increases the amount of volume scattering [rv(λ)] for particles that have passed through multiple grains/grain boundaries. The rv(λ) term received at the sensor is increased relative to rs(λ), as shown in Figure 4A. A similar process occurs in larger particles but at wavelengths where the absorption coefficient is much smaller, thus enabling more rv(λ), as shown in Figure 4B. It is at these wavelengths where the primary absorption features are reduced in spectral contrast and the development of new “transparency” features for particles < ∼ 60 μm (Conel, 1969), as shown in Figure 5. The emergence of these features can confuse how spectra are interpreted, and so, measuring the spectra of different grain sizes of a material is important for remote sensing analysis of fine-grained volcanic materials. These spectral measurements, as with the others discussed here, can also be used to process satellite data so as to determine particle size distributions in image data.
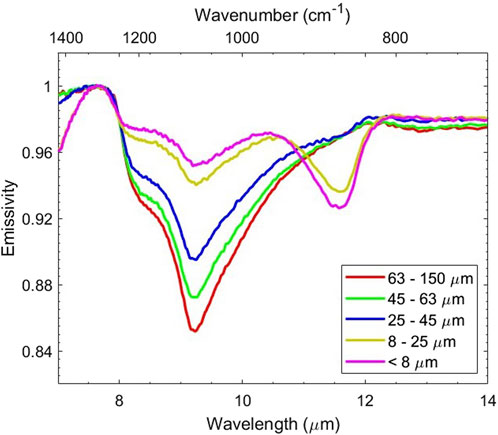
FIGURE 5. Crushed sample of obsidian from the Mono-Inyo Domes, CA [according to the work of Williams and Ramsey (2019)]. The decrease in particle size is associated with an increase in emissivity at the RB. The transparency feature at ∼ 11.5 μm (∼870 cm−1) deepens as particle size decreases in the finest grain sizes.
We provided an overview of the effects of mineralogy and particle size. However, in volcanic rocks, glasses can also make up a significant portion of the viewable surface, particularly if observing lava flow crust that has been rapidly quenched, or tephra deposits, which can be anywhere from ∼20 to 80 wt% glass (Horwell et al., 2007). Silicate glasses do not have a long-range ordering, which means that the emission or reflectance of glass tends to occur at a broader range of wavelengths compared to minerals of the same chemistry (Byrnes et al., 2007). In the TIR, silicate glasses do, however, follow similar trends to their mineral counterparts, with low-SiO2 glasses having their emissivity minima/reflectance peak at longer wavelengths compared to high-SiO2 glasses. Furthermore, there is a significant change in spectral shape, also related to wt% SiO2. This can be seen in Figure 6.
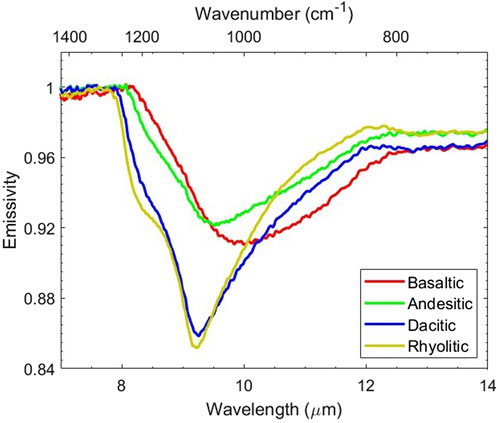
FIGURE 6. Comparison of glass spectra taken from the work of both Minitti and Hamilton (2010) and Williams and Ramsey (2019) demonstrating the major spectral changes depending on the composition. As glasses increase in wt% SiO2, the spectrum of glass changes from a broad bowl shape (basaltic glass) to one that is more defined with a narrower spectral feature (rhyolite glass), coupled with the development of the “shoulder” feature at ∼8.6 μm (∼1,163 cm−1).
Pisello et al. (2019) demonstrated that the distinction between glasses of different compositions can be determined from TIR spectral data. It was noted that the CF shift from basalt to rhyolite is only ∼0.5 μm, yet the change in overall spectral shape allows straightforward identification of these glasses, provided that comparable spectra are obtained from the imaging system used. In VSWIR reflectance spectra, the petrologic analysis of glasses, as with minerals, becomes much more challenging, owing to the paucity of diagnostic spectral features. For example, if a glass contains Fe in its structure, then an absorption band is present at ∼ 1.0 and 2 μm; however, this is also diagnostic of other Fe-bearing minerals such as olivine (Dyar and Burns, 1982). However, it has been shown that VNIR reflectance can instead be used to estimate the percentage of glass versus crystals due to changes in the reflectance strength (Cloutis et al., 1990; Minitti et al., 2002; Carli et al., 2016). This is seen in reflectance spectra between 0.3 and 2.5 μm as an increase in the spectral slope with increased glass content, with the caveat that this change can be quantified provided that the chemical composition of the material being observed does not change significantly.
As described, there are many different spectral effects that are observed in the emissivity and reflectance data of volcanic materials. By using a combination of different wavelength regions, a much more complete picture of how a volcanic system works can be obtained, which can then be augmented by other datasets such as heat flux, deformation, and seismicity, to understand and ultimately predict future activity (Ramsey et al., 2023).
3 Laboratory measurements
Infrared spectroscopy is fundamentally based on the interaction of photons of different wavelengths with the medium that is present. This interaction is dependent on the energy of the photon, with shorter wavelengths (<∼ 2 μm) related to the electronic processes in an atom or compound and longer wavelengths (>∼ 2 μm) related to vibrational processes in a specific atomic group. Each analysis has its benefits depending on the goals of the study. High-fidelity laboratory measurements are a key component of infrared spectroscopy. They can precisely identify the composition of volcanic materials collected in the field. However, two additional advantages over other analytical laboratory methods are as follows: (1) spectroscopy is non-destructive, and (2) the spectra can be resampled to the spectral resolution of other ground, airborne, and satellite instruments. This directly enables comparisons from the laboratory sample to the areal distribution in the image. Laboratory measurements can also provide analog spectra for volcanic materials in studies of the Moon, Mercury, and Mars. The different types of measurements that can be acquired are shown below in Figure 7.
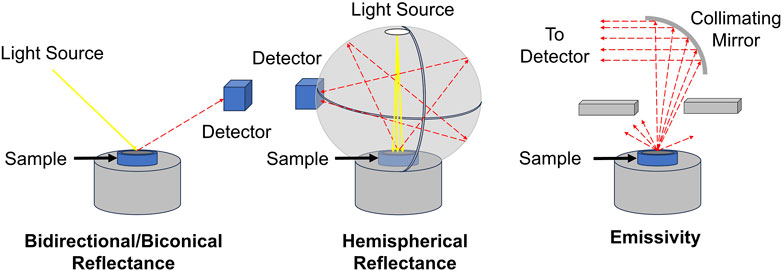
FIGURE 7. Comparison of different modes of spectral acquisition for reflectance and emissivity.
We next provide an overview of how these laboratory measurements are acquired, including the information extracted from volcanic samples and surfaces, both active and inactive.
3.1 Reflectance
Field, airborne, and satellite measurements of reflectance tend to focus on the VNIR/SWIR range because of solar input, which decreases markedly after 3 μm. However, the laboratory provides a setting where TIR reflectance can also be measured, provided that the appropriate combination of light source, beam splitter, and detector is utilized. The style of reflectance measurement can vary depending on the needs of the user. For example, reflectance spectra are sensitive to the incidence angle of incoming energy, influenced by factors such as the position of the light source, the detector, and the roughness of the surface (Figure 7). The chosen style of measurement also influences the spectral morphology in a distinct way.
Hemispherical reflectance spectra, which are most similar to the data acquired in remote sensing data as well as most comparable to TIR emission spectra, are obtained using a spectrometer with an attached integrating sphere. Energy from a light source is directed onto the sample, and the reflected energy (at all angles from the surface) is reflected (and integrated) by the sphere before eventually arriving at the detector. These spectra can be directly compared to emissivity spectra through Kirchhoff’s law, as no information is lost due to scattering effects that can occur in bi-directional measurements (Hapke, 1981). In these measurements, the percentage of reflected light per wavelength is compared to a high-reflectance material standard. The coating of both the standard and interior of the sphere is dependent on the wavelength range that is to be measured. For example, coatings such as Spectralon™ have high reflectivity at shorter wavelengths in the VSWIR portion of the EM spectrum, whereas gold is favored for the TIR where it has a consistently high reflectance.
Several reflectance spectral libraries have compiled information on a range of different Earth materials. These resources have developed from some of the earliest works investigating the spectral features of different rocks and minerals. There are many volumes covering different mineral and rock groups of interest. Several of these studies would be of interest to volcanologists, as they cover important groups, specifically silicate minerals (Adams and Filice, 1967; Hunt and Salisbury, 1970), oxides and hydroxides, and sulfides and sulfates (Hunt et al., 1971a; Hunt et al., 1971b), and mafic, intermediate, and felsic igneous rocks (Hunt et al., 1973a; Hunt et al., 1973b; Hunt et al., 1974). Many of these papers focused exclusively on the VNIR region of the EM spectrum. Further work by Clark and Roush (1983), Clark et al. (1993), Salisbury and D’Aria (1992a), and Salisbury et al. (1994) expanded these measurements into the SWIR and TIR spectral ranges, collecting spectra of not just minerals but also bulk igneous rocks, which would later be used to create the Johns Hopkins University (JHU) spectral library (Salisbury et al., 1991). Furthermore, much of this work would eventually lead to the development of a new reflectance spectral library by the National Aeronautics and Space Administration (NASA) Jet Propulsion Laboratory (JPL) library (Grove et al., 1992). This originally contained mineral spectra of 160 specimens from 0.4 to 2.5 μm. Later, the JPL and JHU libraries’ measurements were gathered together and resampled to the resolution of the Advanced Spaceborne Thermal Emission and Reflection Radiometer (ASTER; Baldrige et al., 2009) and the ECOsystem Spaceborne Thermal Radiometer Experiment on Space Station (ECOSTRESS; Meerdink et al., 2019).
One of the most comprehensive resources for reflectance spectra in the VSWIR region is the United States Geological Survey (USGS) Spectral Library (Speclib; Clark et al., 1993). This library is currently in its seventh version and is described in depth by Kokaly et al. (2017). The library has extended its range of both samples and wavelengths well beyond its initial scope. Speclib version 7 now covers reflectance spectra of several different subdivisions of materials, from minerals and soils through organic and human-made materials over a spectral range of 0.2–216 μm. The library is freely available (https://www.usgs.gov/labs/spectroscopy-lab) and also provides software such as the Processing Routines in IDL for Spectroscopic Measurements (PRISM), a package that runs in Interactive Data Language (IDL) to process spectra from a variety of sources as well as using library spectra to identify those of unknown composition (Kokaly, 2011).
There are other important VSWIR and TIR reflectance spectral libraries, specifically from John Hopkins University (Salisbury et al., 1991) and Brown University’s Relab experiment (Pieters, 1983). These libraries contain some of the same silicate minerals that are in the JPL and USGS libraries; however, they are of particular interest to planetary scientists as they also contain spectra of lunar soils and meteorite surfaces.
3.2 Emissivity
Laboratory measurements of emissivity are primarily focused on the TIR region of the EM spectrum. The fundamental absorption frequencies of silicate minerals and glasses associated with volcanic activity are found here. Instruments that measure energy in the TIR region collect the surface emitted energy rather than using solar reflected energy. Therefore, quantifying the emission spectra of different minerals in the laboratory is essential for understanding the measurements acquired remotely. Below, we describe how these measurements are obtained in the laboratory, and we also present some of the spectral library resources that are available.
3.2.1 Low-temperature emission spectroscopy
Direct laboratory emission spectroscopy (as opposed to reflectance spectroscopy converted to emissivity using Eq. 3) has been well constrained as a technique over the past 25 years (Ruff et al., 1997). We refer to this as “low-temperature emission spectroscopy” here to distinguish it from newer approaches designed to measure samples well above the liquidus temperature. With the low-temperature approach, the samples are heated to temperatures <373 K to elevate their emission above that of the laboratory environment and not cause any fundamental change to the sample. Currently, the methods to obtain these spectra are primarily based on the two-temperature method of Ruff et al. (1997). The FTIR spectrometer first measures two standards that closely represent blackbodies. These temperatures set the bounds for the heated sample and are used to calculate the instrument response function. Following the measurement of the blackbodies, each sample is then measured. The samples are first heated prior to spectral acquisition in a drying oven. Powdered samples, such as tephra, are placed in metal sample cups that are actively heated to keep them in thermal equilibrium during spectral acquisition. Bulk rock samples, however, must be measured more rapidly to limit the effects of cooling during the measurement, which can take several minutes. Cooling during sample measurement imparts the complicating effect of averaging multiple Planck curves at multiple temperatures that result in an inaccurate sample spectrum. Both blackbodies and samples are measured from inside an environmental chamber that is kept at a constant temperature of 298 K. The chamber is used to limit stray photons from other energy sources in the room from entering the spectrometer. A hole at the top of this chamber allows the emitted sample and blackbody emission to reflect off of a collimating mirror and onto the spectrometer’s detector. Both liquid nitrogen-cooled and uncooled detectors have been used to collect these measurements. Cooled detectors do not have to be monitored as closely for drifts in the internal temperature of the instrument, which can cause calibration errors over time (Ruff et al., 1997). The two-temperature method is a major improvement over previously developed methods and is still the standard practice for acquiring accurate emissivity spectral measurements.
As with reflectance, there are several laboratory spectral libraries containing pure minerals, minerals, and volcanic glass mixtures, as well as bulk volcanic rocks. Emissivity measurements of volcanic rocks have been collected for several decades (Lyon, 1965; Walter and Salisbury, 1989; Salisbury and D’Aria, 1992b). However, one of the most comprehensive resources for TIR emissivity spectra is found in Arizona State University’s Thermal Emission Spectral (TES) Library (Christensen et al., 2000), which has spectra of different materials for use in both terrestrial and planetary studies. This library contains the solid solution series of the most important silicate mineral groups found in volcanic rocks, such as plagioclase and potassium feldspars, pyroxene, and olivine. This resource is freely available (https://speclib.asu.edu/) and is regularly updated to include new spectra, including the emissivity spectra of pure volcanic glasses (Minitti and Hamilton, 2010), something that is commonly overlooked in spectral studies despite their importance in both terrestrial and planetary volcanic studies. Other libraries are more narrowly tailored. For example, the ASTER Volcanic Ash Library (AVAL; Williams and Ramsey, 2019) focuses on the emissivity spectra of volcanic ash, given its complex spectral signature due to the varying proportions of minerals and glass. Additionally, this library also contains spectra of multiple size fractions of ash, including fine ash (<64 μm). Given the importance of this fraction in volcanic plumes and clouds coupled with the complicating spectral effects due to fine particle sizes, future development is essential. Other libraries have focused on the availability of data for specific missions. For example, the Berlin Emissivity Database (BED; Maturilli et al., 2008) was designed as a complimentary library to the ASU TES library, which focused on analog emissivity spectra to those that would be collected by the Planetary Fourier Spectrometer (PFS) on MarsExpress and the Visible and Infrared Thermal Imaging Spectrometer (VIRTIS) on Venus Express and MERTIS on BepiColombo. Alemanno et al. (2021) developed a new emissivity library focusing on planetary applications specific to the interpretation of spectra obtained from Mars.
3.2.2 High-temperature experiments
In the past decade, interest has grown in understanding the spectral changes that result from a material cooling through its glass transition from a molten to a solid state. Given that TIR spectroscopy measures specific vibrational frequencies to determine the composition, the spectrum should change with state. This is particularly relevant for basaltic lava flows with higher eruptive temperatures (1,373–1523 K), meaning that a significant portion of the material is molten on eruption. Furthermore, emissivity is an important property in determining the rate of cooling of a material (Pieri et al., 1990; Flynn et al., 1993; Pinkerton et al., 2002; Thompson and Ramsey, 2020). A lower emissivity in the liquid state means less-efficient cooling over time, which will affect properties such as its viscosity (affected not only by the overall composition but also by the proportion of liquid and crystals) and, ultimately, the overall runout distance of a lava flow (Thompson and Ramsey, 2021). Additionally, there are potential planetary applications, particularly to understanding potential active lava flows on the surface of Venus, where it has been suggested that activity has persisted to the present day (Herrick and Hensley, 2023), but where the thick atmosphere precludes observations of their thermal signatures. Over the course of a lava flow cooling, minerals that have already crystallized in a magma chamber may be carried along with the liquid that begins to form a crust soon after it has erupted. A molten lava flow will not have the same repeating atomic chains seen in the minerals formed from them; therefore, the spectral signature will be markedly different. This information is, therefore, critical in assessing the hazard state of lava producing eruption, as well as the potential eruptive processes that may have formed lava flows on the surfaces of the terrestrial planets. However, there are significant challenges in developing high-quality, properly calibrated laboratory experiments at these high temperatures.
Several studies have attempted to overcome the challenge of measuring such high temperatures in the laboratory using the general outline of Ruff et al. (1997). Blackbody measurements must be taken at bounding temperatures to understand the response of the detector. However, producing a furnace that allows temperature-stabilized spectra to be obtained is challenging. Lee et al. (2013) initially developed an apparatus using molybdenum disilicide electric heating elements, allowing the apparatus to reach temperatures up to 1673 K at Earth’s atmospheric pressures in the same purged air environment that is used to collect low-temperature emissivity spectra. The samples in this system were placed in platinum crucibles and then in a cavity directly underneath the mirror, with the furnace insert being made of alumina. This experiment produced “relative spectra” due to the lack of a repeatable calibration procedure. The approach underwent a redesign and the methods for acquiring spectra were further developed by Thompson et al. (2021). A more robust error analysis has also allowed quantitative emissivity spectra to be derived from this system that accounts for the downwelling radiance emitted by the insulating material. Emissivity measurements in this setup are taken from 2.5 to 25 μm. Biren et al. (2022) collected high-temperature measurements (first described by Meneses et al., 2015); however, they used a 500 W CO2 laser to heat the sample. This system utilizes two spectrometers to increase the spectral range from 1.25 to 28.5 μm. One spectrometer measured direct emission from the sample at temperatures exceeding 500 K, whereas below this temperature, a separate spectrometer measured the reflected energy of the surface. A third system was developed by Maturili et al. (2019), which has applications to planetary science. This system is capable of a much wider spectral range, from 0.7 to 200 μm, but measures samples at a lower maximum temperature (∼900 K). However, this spectrometer configuration allows measurements under vacuum pressures if desired. The major difference here compared to Lee et al. (2013) and Thompson et al.’s (2019) furnace setup is that both hemispheric and bi-directional reflectances are acquired as opposed to emissivity.
There are differences between the two major high-temperature laboratories (Thompson et al., 2019; Biren et al., 2022) in the resulting emissivity features at higher temperatures. Both reach comparatively high temperatures, with Thompson et al. (2019) recording 1573 K and Biren et al. (2022) recording in the range of 1,640–1654 K. For these measurements, both laboratories witnessed a change in the position of the CF with an increase in temperature, with its movement from shorter to longer wavelengths (decreasing wavenumber) being attributed to the change in silicate bonds as the amount of melt within the sample increases. However, there is disagreement in the basaltic sample results with an increase in temperature. Thompson et al. (2019) showed a decrease in emissivity with an increase in temperature, whereas Biren et al. (2022) observed the inverse. This discrepancy is important, as both laboratories have demonstrated that emissivity changes significantly with temperature, which can then, in turn, alter the results of lava flow modeling where changes in emissivity are considered (Ramsey et al., 2019). These measurements are indisputably complicated owing to the high temperatures of both the samples and the other laboratory components (i.e., the sample cavity walls). These can contribute downwelling energy that reflects off the sample or backscattered energy from the surface of the sample by the heating source itself (i.e., where a laser is utilized to heat the sample). Therefore, precise calibration is critical. For example, depending on the laser frequency, scattered reflected energy would increase the measured incident photons in that wavelength region and, therefore, result in shallower spectral features. The results obtained by Thompson and Ramsey (2020) using a field-based system, the miniature multispectral thermal camera (MMT-Cam), have also shown that the emissivity of molten materials decreases at the RB, and this was observed while studying higher-temperature basaltic lava from Kilauea volcano, Hawaii. The comparison of different data sources collected with different instruments to determine the accuracy of these measurements is, therefore, essential in adequately quantifying this behavior.
The need for high-fidelity laboratory measurements is becoming clear in volcanology, especially given computer modeling efforts to understand the influence that emissivity has on the runout distance of both recent volcanism on Earth and ancient volcanism on Mars and Venus. Ramsey et al. (2019) and Thompson and Ramsey (2021) adapted the FLOWGO model of Harris and Rowland (2001) to include emissivity variability with temperature, which has led to increased modeled flow runout distances and lower overall heat flux. Although Ramsey et al. (2019) attempted to account for liquid vs. crust coverage by using a different emissivity value for each (i.e., the two-component emissivity model), Thompson and Ramsey (2021) utilized high-spatial resolution multispectral TIR camera data to link changes in the emissivity directly to the temperature (i.e., the variable emissivity model). A later study by Rogic et al. (2022) also demonstrated this trend using the GPUFLOW (Capello et al., 2022) model, with their results showing changes in both the runout distance as well as the width of the lava flow compared to the results obtained by using a constant emissivity value. These are important considerations for hazard planning and risk mitigation, and so, the accurate retrieval of accurate emissivity for different lithologies at varying temperatures is essential. This has already been performed at Piton de la Fournaise Volcano, Réunion (Harris et al., 2019; Chevrel et al., 2022), and it is hoped that these models will be adopted by the network of volcano observatories to better predict lava flow hazards.
More recent work has taken the updated FLOWGO model (pyFLOWGO; Chevrel et al., 2018) and applied it to define the emplacement conditions for lava flows on the surface of both Mars (Flynn et al., 2022) and Venus (Flynn et al., 2023). This work is made difficult given the limited compositional and elevation knowledge (particularly for Venus). Furthermore, both planets have significant differences in their atmospheric pressure and surface temperatures, which makes understanding the flow emplacement processes more challenging. Modeling the conditions required to reproduce the mapped flows is important in understanding the different ways in which volcanism evolved on these planets. A more accurate emissivity results in a more accurate estimate of the composition and the cooling and viscosity of these flows. Studies such as these help lay the groundwork for future flow modeling, given the possibility of active eruptions on Venus in recent years (Herrick and Hensley, 2023) and the recorded silicate volcanism on Jupiter’s moon Io (Davies et al., 2023). DAVINCI+ (Garvin et al., 2020), VERITAS (Smrekar et al., 2022), and EnVision (Helbert et al., 2019) are three missions planned to explore the surface of Venus in the next decade with similar goals of detecting and measuring active volcanism.
4 Volcano spectroscopy from the ground, air, and space
We showed how laboratory measurements are used to directly determine composition and particle size and indirectly used for improved lava flow propagation modeling through temperature-dependent emissivity, for example. In the study of volcanoes, remote sensing also provides the advantage of safety, imaging eruptive processes without the need for detailed in situ sampling, as well as providing a much greater synoptic coverage at different temporal scales. Figure 8 shows an example of the 2018 eruption of Kilauea volcano, Hawaii, at three different spatial scales from airborne and orbital instruments.
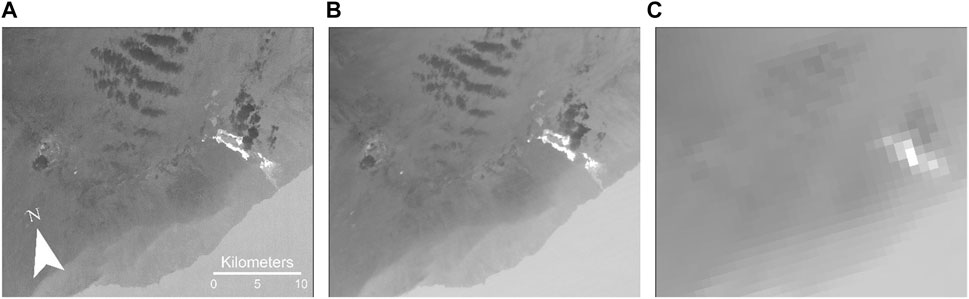
FIGURE 8. Radiance data of eruption processes observed by using different instruments during the 2018 Lower East Rift Zone eruption. (A) the MASTER, spatial resolution = 50 m; (B) the ASTER, spatial resolution = 90 m; and (C) the MODIS, spatial resolution = 1.0 km. All images were acquired on 8 February 2018 with an interval of 5 min (MASTER, 0839 UTC; MODIS, 0840 UTC; and ASTER, 0842 UTC).
To date, there has never been an airborne or satellite sensor designed specifically for terrestrial volcano science. Although many of the instruments that are discussed here can be used to quantify volcanic deposits and activity, the data are not always routinely acquired or acquired at the necessary spatial/spectral scales required. By contrast, the literature for planetary science using these same techniques, particularly for Mars, is much more robust, with IR measurements being some of the only examples that provide physiochemical maps of Martian volcanoes.
The limitations of IR sensors from the Earth orbit can result in data that may not be useful or timely particularly if a volcano’s state becomes hazardous. In volcano monitoring using IR data, the primary focus has been on detecting thermally elevated pixels (Figure 8). However, these data can also be compared to other geophysical measurements such as seismic (Thompson et al., 2022) or geodetic techniques (Alvarado et al., 2018) to understand both the subsurface processes occurring alongside the development of volcanic flows (Patrick et al., 2017). In this section, we first present the methods with which we determine composition from the IR spectra. Following this, we discuss the different sensor types that can be used to obtain spectroscopic information about volcanoes and what process information has been derived. Where possible, we utilize the most recent literature to demonstrate the current research using these sensors and also comment on some of the future directions for volcanic studies.
4.1 Spectral modeling
A key component of the analyses discussed here is the ability to derive the physical properties (e.g., composition and temperature) of volcanic materials directly from their spectra. In situ spectra acquired by different sensors are nearly always comprised of multiple materials mixed below the scale of the image pixel. Determining this sub-pixel composition and endmember percentage is commonly classified as linear spectral deconvolution or spectral mixture analysis (SMA, Ramsey and Christensen, 1998). Using a library of mineral spectra as endmembers paired with a spectral fitting model (either linear or non-linear), the identity and amount of each endmember in each pixel can be extracted. Sub-pixel thermal mixing can also occur, and a two- or three-endmember thermal model (depending on the number of wavelength bands of the instrument) is used to extract the area and temperature of those thermal endmembers (Dozier, 1981; Rothery et al., 1988; Harris et al., 1999; Rose et al., 2014).
As described earlier, one of the distinct advantages of reflectance and emission laboratory spectroscopy is the ability to compare these data to those taken from field, airborne, and satellite instruments, providing proper calibration for the atmosphere. Without comparative laboratory spectra, it would be very difficult to determine the materials present in a given scene. Therefore, we require methods that can provide a statistical spectral match allowing us to determine the composition. Overall, unmixing of spectra is linear (i.e., for a given pixel, the contribution of each component to its spectrum is proportional to the endmember’s areal abundance in that pixel) in the SWIR and TIR regions. These methods are computationally simple, with models developed for emission, such as spectral deconvolution or SMA (Ramsey and Christensen, 1998), or reflectance, such as the multiple endmember spectral mixture analysis (MESMA; Roberts et al., 1998). Despite their developments for a range of applications (e.g., MESMA has been used extensively to model hyperspectral data from urban areas; Franke et al., 2009), all linear unmixing approaches are applicable to spectra acquired from volcanic environments. These algorithms follow the principle of finding the best endmember solution through the best spectral fit (i.e., the lowest root-mean-square (RMS) error for each modeled spectrum compared to that from the actual pixel).
However, for VNIR spectra in particular, the linear assumption is no longer valid due to the increased amount of photon transmission through particles (Hapke, 1981). In the non-linear mixing model described, photons experience a significant amount of volume scattering due to the lower absorption coefficients. This leads to photons interacting with more than one surface, causing a greater number of reflections, which can then be exacerbated by dark or highly absorbing minerals (Clark, 1983). Given the relative simplicity of linear unmixing methods, the non-linear spectral modeling algorithms are by comparison still considered immature and much more complex (Celik, 2023). However, other approaches to spectral analysis have been developed and work well on hyperspectral data by determining statistical metrics of diagnostic spectral feature [e.g., the USGS Tetracorder (formerly Tricorder) algorithm (Clarke and Swayze, 1995; Clark et al., 2003)]. The most dominant spectral feature present in a pixel is assumed to be the primary constituent and that pixel is mapped as that spectral endmember. In the simplest terms, mixing is not considered here, whereas it is with SMA approaches.
Furthermore, linear methods are widely available in different software packages. For example, QGIS, an open-source GIS and remote sensing software package that is maintained by the user community, has modules that can be installed to provide MESMA or the QGIS Linear Spectral Unmixing (QLSU) plugin (Celik, 2023). Tetracorder is directly available from the USGS (https://www.usgs.gov/labs/spectroscopy-lab), and commercial software packages such as ENVI (Environment for Visualizing Images) also contain SMA-based algorithms. Coupled with the spectral libraries described in Section 3, these algorithms allow the rapid analysis of remote sensing data from both terrestrial and planetary missions.
The future of spectral modeling lies in machine learning (ML), which can greatly improve the ability to deconstruct the spectral signal from any given pixel in an image. ML has already vastly improved the concept of image classification at the pixel scale. By training an ML model on well-calibrated laboratory spectra for example, it should be possible to identify mineral/rock suites present at the sub-pixel scale as well. Additionally, by informing an ML model of where specific bending/stretching modes of different molecular groups (e.g., Si–O and OH) exist in wavelength space, minerals could be assessed for their chemical composition. This would be especially advantageous for hyperspectral measurements, data with higher levels of noise, and/or data from multi-component temperature mixing. For planetary applications, there may be surface compositions not represented by current spectral libraries; therefore, ML could be used to identify those spectral components more efficiently and with greater accuracy.
4.2 Ground-based data collection
Ground-based remote sensing continues to be a vital part of volcanic system monitoring because of the high-temporal frequency and near-real-time measurements that are possible. Further advantages include higher-spatial resolution data compared to airborne and satellite sensors and the different viewing angles possible (i.e., the ability to collect data from the rising plume column vs. the cloud top seen from space). The use of ground-based remote imagers covers a range of different applications from thermal anomaly detection and temperature measurements (Spampinato et al., 2011) to quantification of volcanic degassing (Realmuto et al., 1997) and detection of drifting, optically transmissive volcanic ash clouds (Prata and Bernardo, 2009). There are also many systems that use other variations on spectroscopy such as correlation spectroscopy (COSPEC; Millán et al., 1985) in the ultraviolet (UV) range as well as cameras in the TIR that use the same methods as those applied to satellite data to obtain the mass of ash and SO2 plumes (Prata and Bernardo, 2014). However, the use of reflectance or emission spectrometers/imagers for the quantification of volcanic deposits and flows is not as common (Thompson and Ramsey, 2020).
The use of VNIR and SWIR reflectance spectroscopy is particularly useful in detecting the alteration of volcanic rocks from hydrothermal activity, for example. In Section 2, we discussed the importance of quantifying the OH− bands in reflectance spectra that are indicative of different types of clay minerals, as well as the electronic processes detectable in oxide and sulfate minerals. For example, the process of palgonitization in tephra resulting from hydrothermal activity creates a suite of minerals at grain boundaries. Minerals such as kaolinite, illite, nontronite, and gypsum can be found in these environments depending on the composition of original minerals and the dissolved ions in the hydrothermal fluids (Jakobsson and Moore, 1986; Thollot et al., 2012; Rodriguez and van Bergen, 2017). VSWIR reflectance spectroscopy has been utilized in these settings previously to identify hydrothermal alteration minerals to better understand rock–fluid interactions (Yang et al., 2000; 2005) and volcanic hazard assessment (Crowley and Zimbelman, 1997), with others (Deon et al., 2022; Abdale et al., 2023) combining the field spectroscopy with other laboratory methods (XRD) in order to better interpret clay mineralization.
Because several of the reflectance features can overlap, the spectra can be difficult to interpret. Combining field and laboratory studies can provide much greater detail by simultaneously leveraging the robust nature of XRD for microanalysis with the broad field of view and multiple location analysis of reflectance spectroscopy. The presence of these alteration minerals is important in mapping as they indicate active (or past) geothermal systems and also play an important role in slope failure hazards at volcanoes (Lopez and Williams, 1993; John et al., 2008; Heap et al., 2021). This approach of alternation mineral detection has been used to look for evidence of past sector collapse and debris avalanche events from volcanoes (e.g., Askja, Iceland; Marzban et al., 2023). The search for possible ancient hydrothermal systems on Mars is also important for the search for evidence of life. Instruments such as the SuperCam onboard NASA’s Perseverance rover, which landed in the Jezero Crater, which is found within the Isidis Planitia region of Mars (Fouchet et al., 2022), could be used to examine alteration mineralogy to understand these processes if evidence of these systems exist.
We have previously discussed how changes in the spectral slope in the VSWIR region can be correlated with a change in the percentage of glass versus crystals. By using an ASD TerraSpec® Halo field spectrometer coupled with laboratory petrographic analysis, Rader et al. (2022) were able to use reflectance in 0.5–1.0 μm to examine whether the trend of decreasing reflectance with increasing glass content in basaltic rocks could be quantified. This approach is only possible in this region of the VNIR because of the reflectance features that appear in basaltic rocks, namely, the mineral assemblages such as olivine, clinopyroxene, plagioclase feldspars, and Fe oxides. The reflective behavior of glass versus minerals in the VNIR has also been used by Sinha and Horgan (2022) to suggest the identification of volcanic ash layers within the North Polar layered deposits (NPLDs) on Mars, using data from the Compact Reconnaissance Imaging Spectrometer for Mars (CRISM) instrument (Murchie et al., 2007). Although these VNIR reflectance spectra cannot explicitly determine the exact silicate mineral composition, as can be achieved through the TIR, they do provide measurements of crystal content that could be coupled with other methods to better constrain the processes that formed them.
The strength of the TIR silicate spectral features allows for their rapid quantification if coupled with one of the spectral libraries described in Sections 3.1 and 3.2.1. However, although there have been many previous studies conducted using VNIR and SWIR field reflectance spectrometers, the use of multi- to hyperspectral TIR instrumentation for ground-based studies is not as well developed. Transmission spectroscopy from the UV through TIR from ground-based systems is used to quantify ash and SO2 emissions from volcanoes; however, it is not used for determining the composition of volcanic deposits and rocks. Commercial systems do exist that are capable of collecting multi- to hyperspectral TIR image data, such as the HyperCam developed Telops, which has been tested in volcanic environments (Smekens and Gouhier, 2018). These systems, however, do have a significant cost, limiting their widespread availability.
Researchers have also developed their own TIR imaging solutions. In these cases, bandpass filters or interferometers are used to split the incoming energy prior to the detectors to provide multispectral image data in a similar way to satellite imaging systems. These designs use a wheel to move the bandpass filters into and out of the camera’s field of view to build a multispectral image dataset. Some, such as the Cyclops camera (Prata and Bernardo, 2009), which was followed by nicAIR (Prata and Bernardo, 2014), contain up to four spectral bands that were designed specifically to detect atmospheric phenomena, such as distinguishing meteorological clouds from volcanic ash and SO2 (Lopez et al., 2015). However, another more recent system called the MMT-Cam (Thompson et al., 2019) was designed for multispectral imaging of active volcanic surfaces. This system is unique as it collects images at six different wavelength bands in the TIR, chosen to best discriminate volcanic rocks and minerals. Furthermore, it is also complimentary to laboratory high-temperature measurements, as it theoretically can obtain emissivity spectra of surfaces up to 2060 K (although the maximum temperature recorded in practice was 1550 K; Thompson and Ramsey, 2021). MMT-Cam data acquired on lava flows at Kilauea volcano in 2017 and 2018 imaged the variability of crust coverage on active lava surfaces and correlated the surface temperature to emissivity variations (Thompson and Ramsey, 2020). Relatively low-cost camera systems such as these that combine commercial, off-the-shelf technologies have the potential to better assess silicate mineralogy and glass composition of hot surfaces in ultra-high-spatial resolution that allows smaller features to be imaged and quantified.
Despite these types of ground-based TIR imaging systems not being common, their efficacy at acquiring comparable measurements to those taken in the laboratory means that important model parameters can be easily acquired in situ, as well as providing sub-pixel information for data acquired from orbit. In contrast, however, collecting these data requires the researcher to get much closer to potentially dangerous volcanic activity, thus increasing the risk. Additionally, to obtain quantifiable information, instruments with a high SNR and an appropriate number of wavelength bands in the correct position for diagnostic feature determination are required. However, it is expected that new systems will be developed in the future that utilize additional spectral bands with better spatial and temporal resolution that will link the thermal/spectral information to other geophysical monitoring techniques acquired at the same cadence.
Multi- to hyper- spectral camera systems mounted on autonomous landers and rovers have quantified the constituents of volcanic rocks on Mars. The Miniature Thermal Emission Spectrometer (Mini-TES; Christensen et al., 2004) found on both the Spirit and Opportunity Mars Exploration Rovers provided these data at both Gusev Crater and the Meridiani Planum, respectively. The detailed observations of the mineralogy of the basaltic rocks found at the Gusev site (McSween et al., 2004; Ruff et al., 2006; Hamilton and Ruff, 2012) led to the identification of different classes of Martian basalt, the Adirondack Class (olivine rich) and Wishbone Class (plagioclase rich), with bound water molecules and basaltic glass found in very specific locations. Future rover or lander missions to other volcanic worlds would greatly benefit from including these spectral systems, as the physiochemical characteristics of an active or ancient lava flow could be derived at a much higher spatial and spectral resolution than is possible from orbit.
4.3 Airborne campaigns
Aerial studies of volcanoes provide synoptic coverage over a much larger area than localized field studies, and although there is a loss of spatial resolution, these systems still provide data at a higher resolution than satellites. Airborne data are also acquired at a comparable viewing geometry to orbital sensors, an important aspect where feature geometry such as lava flow channel dimensions are important, for example. However, aerial data can be limited by the narrow swath width, and more importantly, flights must be requested and arranged commonly at a high cost. These logistical and cost limitations are being reduced with the use of uncrewed aerial systems (UASs). Regardless of the platform, the frequency of repeat measurements for studies using aerial systems tends to be less than with those using satellite sensors, meaning that active volcanism is measured less recurrently.
There are numerous commercial, private, and NASA-sponsored instruments that are designed for airborne platforms and cover the range of infrared measurements discussed here. Commercially available instruments that span the infrared range include the AISAFenix VSWIR hyperspectral imaging system (Kereszturi et al., 2020) and the Telops airborne Hyper-Cam mini (Turcotte et al., 2023). These have the capability to be used for volcanology and the additional advantage of being multipurpose: they can be used as both ground-based or airborne sensors. These types of adaptable systems enable identical data to be collected from multiple view angles allowing more detailed analysis to be performed. NASA sensors include the airborne visible/infrared imaging spectrometer (AVIRIS; Green et al., 1998), which has been improved to the AVIRIS-NG (next-generation) instrument, HyMAP (Rejas et al., 2012), the MODIS/ASTER airborne simulator (MASTER; Hook et al., 2001), and the Hyperspectral Thermal Emission Spectrometer (HyTES; Hook et al., 2013). These are flown on both low- and high-altitude aircraft, producing a wide range of potential swath widths and spatial resolutions. Coverage maps for AVIRIS and MASTER for the past 20 years can be seen in Figure 9.
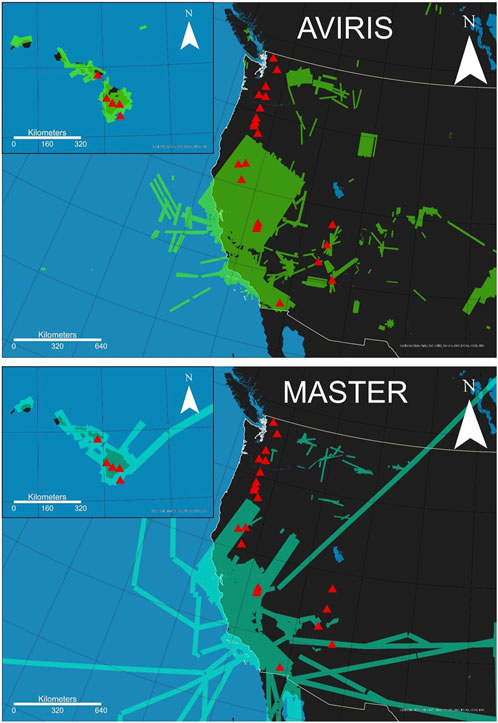
FIGURE 9. Coverage of the NASA AVIRIS and MASTER sensors from 2012 to 2022 compared with the location of volcanic complexes in the United States active within the past 2000 years. No campaigns were made in Alaska.
Despite the infrequent volcano observations by these sensors, the increased spectral and spatial resolution provides improved accuracy in measuring volcanic processes. For example, AVIRIS VSWIR data have been used to detect and map clay mineralization related to hydrothermal processes on stratovolcanoes in the Pacific Northwest of the United States. The clay mineralogy mapping coupled with topographic analysis can better help map zones of potential sector collapse or debris flow events in areas of potential high risk from volcanic landslides (Crowley and Zimbelman, 1997). A similar analysis has been performed recently by Schaefer et al. (2023) on Mt. Ruapehu, New Zealand, where hyperspectral data collected by the AisaFENIX system were used to inform sample collection and reflectance spectral laboratory analysis. In contrast, the MASTER sensor has the advantage of simultaneous spectral coverage in the VNIR to the TIR, allowing concurrent VSWIR reflectance and TIR emission measurements to be made, albeit at a lower spectral resolution than AVIRIS or HyTES. For example, MASTER data were used to map hydrothermal alteration using the VSWIR data (Bragado-Massa et al., 2014) and monitor the renewed activity at Mt. St. Helens in 2004 (Vaughan et al., 2005). Both VNIR and TIR systems have been used simultaneously to collect spectral data and map the properties of the Mauna Ulu flow field (Byrnes et al., 2004) and, more recently, over active lava flows from Kilauea, which was performed in conjunction with hyperspectral TIR data from HyTES (Thompson and Ramsey, 2020).
Airborne campaigns are now being carried out with sensors deployed on UAS platforms. There are many different UAS options capable of different payloads, which allow the acquisition of data at similar viewing geometries to other airborne and satellite missions, but at a higher spatial resolution. However, due to battery limitations, these flights commonly image much smaller areas and are ideal for focused high-resolution studies. In addition, these systems operate much closer to the ground, therefore requiring less-complicated atmospheric corrections. Multi- and hyperspectral remote sensing from these types of platforms is particularly beneficial during active volcanic crises with highly dynamic processes (e.g., the eruption of lava flows over the surface or the explosive eruption and deposition of tephra). However, more critical is the ability to rapidly acquire and process these data to produce information such as the composition, temperature, and/or particle size of erupted material that are important to the monitoring agency for predictive modeling (James et al., 2020). Remote sensing from a UAS has also successfully occurred on another planet. The ingenuity UAS traveled onboard the Mars 2020 rover Perseverance and has flown numerous times demonstrating that autonomous flight is possible (Balaram et al., 2021). Future UASs can be designed to carry more complex instrumentation, such as the types of imaging spectrometers discussed here, and reach regions not accessible by traditional landers/rovers. For example, the pervasive dust cover on Mars makes it difficult to study most of the larger volcanic regions (Heavens et al., 2015) from orbit. The fine spatial resolution UAS data could identify gaps in the dust coverage (including from the sides of rocks/outcrops) from which mineralogy and petrology can be determined for the first time. Because of their potential, it is likely that remote sensing from UAS platforms will continue to expand and address the fundamental questions of volcanism in the solar system.
4.4 Orbital instrument imaging
Orbital data collection used for volcanology is, unsurprisingly, the most common form because of the data quantity and coverage over the past ∼50 years. Orbital studies are arguably the most convenient as data can be collected without the need for field deployments or flight scheduling. This is a significant advantage for remote and hazardous locations. Additionally, these data provide repeat and regular acquisition of a volcano over long time periods (e.g., sensors on the Landsat and Terra satellites have been operational for decades). Although aerial and ground-based studies provide higher spatial and spectral detail of specific regions, satellite data are capable of imaging an entire volcanic field enabling views of multiple lava flows or large plumes. However, not all these systems were designed for solid Earth science in general and volcanology in particular.
Earth’s atmosphere further restricts the placement of spectral bands for a given instrument, making them less capable than air- or ground-based systems. Beyond the effects of phenomena such as clouds, which completely obscure the ground, in the TIR region, there is also significant absorption by O3 at ∼ 9–10 μm and nearly complete absorption by H2O and CO2 from ∼5–8 μm and longward of 13 μm, respectively. These obscure direct observations of Earth’s surface and are too strong to be removed by atmospheric correction algorithms. Therefore, the lack of a complete spectrum (as compared to laboratory data) means certain important diagnostic regions are inaccessible. For example, the strongest SO2 absorption occurs in the 7–8 μm region where it is obscured by H2O vapor in the troposphere.
Throughout most of the satellite era, orbital instruments have had multispectral capability in the VSWIR and/or TIR making them useful in spectral studies of volcanoes. Only more recently have hyperspectral VSWIR systems been deployed on both satellites and the International Space Station (ISS). However, numerous studies using orbital remote sensing demonstrate that the bulk composition of materials can be derived even with a limited number of bands (i.e., such as the five TIR bands on the ASTER sensor onboard Terra). These instruments are used across the infrared region of the EM spectrum to detect important compositional details as well as changes at volcanic systems on Earth and other silicate worlds in our solar system.
There are dozens of multi- and hyperspectral satellite sensors used in the study of volcanoes; however, of those, only a limited number are well suited for surface processes and deposits. For these studies, sensors with a higher spatial resolution (∼100 m or less) are preferred for a greater level of detail over the entire volcanic system. Many of the methods and spectral characteristics described in the previous sections are also used with satellite data to acquire information about the state of the volcano. However, novel developments have been made in the use of orbital data to map and interpret volcanic deposits.
The greater swath width of individual images from satellite sensors such as Landsat (180 km) and ASTER (60 km) allows for more complete observations of the formation and development of lava flow fields over time. For example, Ramsey et al. (2019) used numerous ASTER, Landsat, and other imaging systems to track and model the complex lava flow field at Tolbachik volcano, Russia. Although the high temperatures of lava flows can commonly saturate orbital sensors that were designed for more common surface temperatures, the data can still be useful in time series studies of flow progression. In addition, identifying individual flows in a complex flow field is difficult and requires high spatial resolution data. Furthermore, over time, older flows can become quickly vegetated, meaning that they are difficult to discern using spectral ratio methods such as the normalized difference vegetation index (NDVI). Li et al. (2015) demonstrated that lava flows on Nyamuragira volcano in the Democratic Republic of the Congo can become over 50% covered by vegetation within 40 years of their emplacement.
Many remote studies of lava flows utilize VNIR to SWIR observations to characterize recent volcanic surfaces. However, without TIR data, mapping the distribution of silicate minerals becomes much more difficult if not impossible. TIR data are routinely collected from the Mars orbit, in the past from the Thermal Emission Spectrometer (TES; Christensen et al., 1992) and later from the Thermal Emission Imaging System (THEMIS; Christensen et al., 2004). The TES acquired hyperspectral TIR data of the planet’s surface for over 20 years, developing compositional analyses for Martian basalts in multiple locations, including Noachis Terra (Rogers and Nekvasil, 2015) and Arsia Mons (Crown and Ramsey, 2017). Analysis of THEMIS data over the Syrtis Major caldera has offered evidence through TIR spectra that magmas on Mars may be more evolved in some locations than others, through the discovery of what is assumed to be a low-silica dacite (Christensen et al., 2005).
These same data analysis techniques are applicable to Earth-based volcanoes and are complimentary to VSWIR reflectance studies that have already been performed. Older, weathered flows experience change in their surface mineralogy, and VSWIR reflectance data help to characterize this change. Head et al. (2013) used unsupervised classification methods to map individual flow units on Nyamuragira using Landsat data. This was then further augmented by Li et al. (2015), who took the approach of using linear spectral unmixing to identify age relationships and identify vegetation coverage over time. This information can help us understand the evolution of a volcanic complex and its changes. Adding TIR data analysis improves the ability to detect rock compositional change over time that could indicate differences in magma composition, which in turn helps determine the future hazard potential (e.g., as was observed during the 2010 Eyjafjallajökull eruption, Iceland; Sigmarsson et al., 2011).
Surface unit morphology can also be derived from TIR spectroscopy and can be a way to quantify smaller-scale roughness features, such as micron-scale vesicularity in a way that compliments the larger-scale flow surface roughness derived from radar remote sensing (Campbell and Blackwell, 1996). An increase in the vesicularity of a sample causes an increase in the emissivity at the Reststrahlen band absorption feature, essentially muting it. This is related to multiple internal reflections of photons that occur in the small exterior vesicle cavities (Figure 10; Ramsey and Fink, 1998).
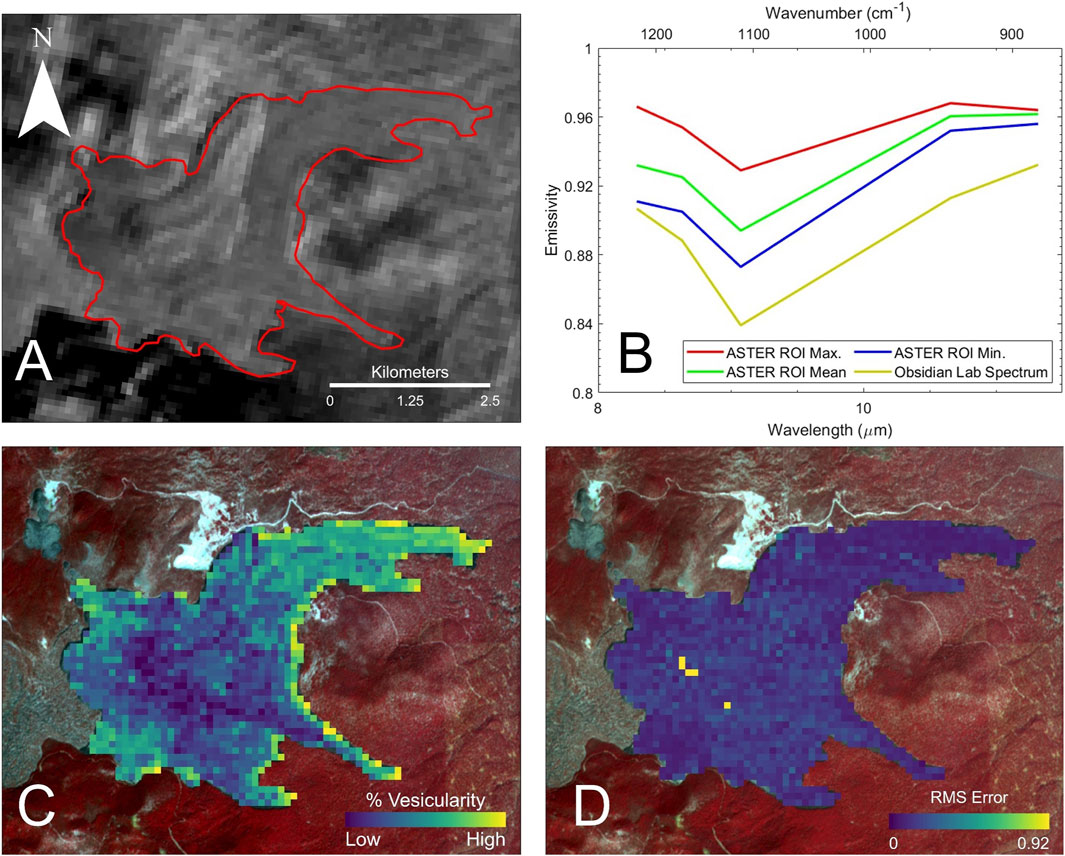
FIGURE 10. (A) ASTER TIR radiance data of Glass Mountain, California (acquired 5 September 2021). (B) Mean, minimum, and maximum spectra obtained using a region of interest (ROI) shown in red in (A) compared to a laboratory spectrum of obsidian glass collected from this flow. The main diagnostic spectral features are evident in these spectra, even with the five spectral bands of the ASTER TIR sensor. (C) Furthermore, by utilizing the methods of Ramsey and Fink (1999), micron-scale roughness associated with the percentage of vesicles can be derived using a linear deconvolution approach of glass plus a featureless blackbody spectrum. (D) RMS errors are low overall, indicating a good spectral fit.
This effect has also been shown to be linear, and therefore, if the spectrum of a vesicle free material is acquired, then a blackbody spectrum can be used as the proxy for the vesicularity and the areal percentage of vesicles in a rock established using a simple two-endmember model. This is particularly applicable to pyroclastic rocks (Carter and Ramsey, 2009) as well as viscous lava domes (Ramsey et al., 2012). Vesicularity in lava domes can fluctuate over time related to high-volatile contents within magma (Ramsey et al., 2012; Fink and Anderson, 2023). This information is particularly vital at high-temporal revisits (>1 image per day if possible) during an ongoing dome emplacement, and combining this with atmospheric degassing measurements of volatiles, such as SO2, helps better constrain potential future activity. These processes can be understood even better through a combination of other datasets, such as those acquired from synthetic aperture radar (SAR). Provided that the radar sensor coverage over a particular volcano exists, SAR data provide information on macroscale roughness features on a lava flow (e.g., the distribution of blocks and boulders, a’a versus pahoehoe textures; Tolometi et al., 2020). Furthermore, repeated SAR measurements can provide the volume of lava to be determined using interferometric synthetic aperture radar (InSAR). Given that InSAR is sensitive to ground changes on the order of millimeters to centimeters, then syn- and post-eruption volume changes can be calculated over the time period between the data collections (Kubanek et al., 2015). The combination of these methods can, therefore, be a powerful tool for understanding the mechanisms behind the eruption of lava and provide better constraints for flow modeling (Harris et al., 2019).
Tephra can also be an important indicator of the state of a volcano. The size and shape of volcanic ash particles can illuminate eruption mechanics (Heiken, 1972), and their composition is evidence of the composition of the magma. Tephra has a range of different particle sizes, with a significant very fine portion (<63 μm). As described, fine particle sizes can affect spectra through the development of new spectral features (transparency features) that must be considered, along with the varying proportions of glass versus crystals found in different ash samples. The AVAL library (Williams and Ramsey, 2019) was developed in response to the lack of tephra and ash spectral data in existing spectral libraries. This spectral information is also useful for the analysis of the proximal regions of ash-rich plumes. For example, Williams and Ramsey (2022) studied Vulcanian-style eruptions from Nishinoshima volcano, Japan, and used AVAL to derive the composition and distribution of particle sizes in ASTER TIR emissivity data. Another example of mapping ash-rich plumes using a linear deconvolution approach and ASTER TIR is shown below for Sakurajima volcano, Japan (Figure 11).
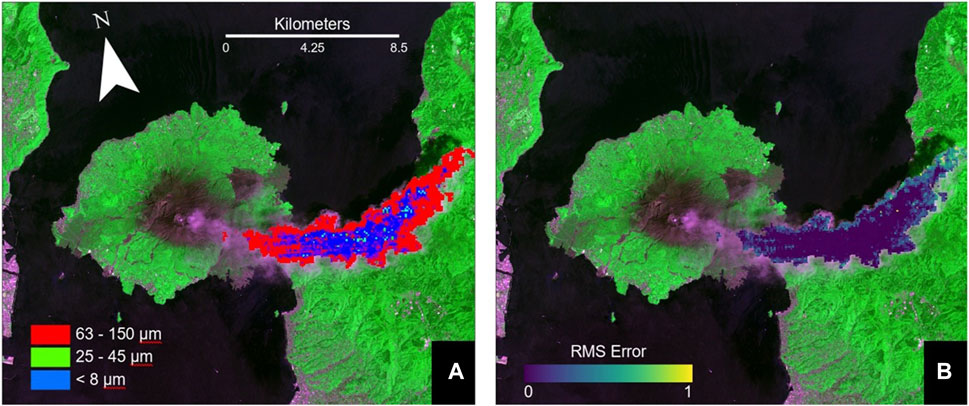
FIGURE 11. Physiochemical analysis of volcanic ash erupted from Sakurajima volcano, Japan, using an ASTER image acquired on 29 April 2010 [according to the work of Williams and Ramsey (2019)]. Only those pixels where the plume is opaque are used in this analysis (where the optical depth OD is >4) so that only emissivity from the ash cloud is modeled (Williams and Ramsey, 2022). Linear deconvolution model results for particle size (A) and the RMS error (B) are draped over an ASTER VNIR image for clarity. A sample of volcanic ash collected from Sakurajima provided the best overall fit to the modeled data.
Using spectroscopy to assess the composition of volcanic ash in proximal plumes can also provide data for radiative transfer models needed to analyze the more distal drifting volcanic ash (Grainger et al., 2013). Together, these measurements of the entire plume plus the deposited tephra enable a complete view of the ongoing eruption processes.
There are currently a limited number of instruments capable of making TIR measurements at the appropriate spatial/spectral resolution to discern volcanic features. ASTER was the first and has been in orbit since December 1999, followed much later by the ECOSTRESS instrument on the ISS (Hulley et al., 2017). VSWIR data are much more common and include the ASTER VNIR subsystem, the suite of Operational Land Imagers (OLIs) on Landsat, and the Multispectral Instrument (MSI) on board Sentinel-2, which provides multispectral measurements. Newer instruments such as the Earth Surface Mineral Dust Source Investigation (EMIT) on the ISS, the Copernicus Hyperspectral Imaging Mission for the Environment (CHIME), and the Precursore Iperspettrale della Missione Applicativa (PRISMA) now provide hyperspectral VSWIR reflectance data at spatial resolutions between 20 and 60 m. The future Surface Biology and Geology (SBG) VSWIR and TIR instruments, however, will eventually replace ASTER and augment the Landsat and Sentinel missions. These systems will provide the first global hyperspectral VSWIR data combined with much high-temporal resolution (∼3 days) multispectral TIR for the first time. Such data will be critical to better discern and map volcanic features and their changes with time. SBG TIR is the only planned polar-orbiting instrument that will be capable of providing emissivity maps at the appropriate resolution to quantify volcanic rocks through spectral mapping.
5 Summary and future directions
This article provides information on the literature resources needed to understand volcanic rocks using infrared spectroscopy in all its forms (from the laboratory to orbital data). Using reflectance and emissivity over this wavelength range, various properties of volcanic rocks can be derived. When performing future studies, it is important to understand both the advantages and limitations of each wavelength region and instrument to determine the appropriate use for the type of analysis desired. We provided an overview of the types of instruments currently available to perform this research, including the satellite data that are appropriate for each different application. The resolution of the instrument, whether it is spatial, spectral, or radiometric, will greatly influence both the accuracy and precision of a given study.
This also leads us as a community to consider what types of remote sensing data will be needed in the future. As mentioned, there are several current and future missions that can provide VSWIR reflectance data. For the TIR, the current ECOSTRESS and future SBG missions can provide data comparable to (and in some ways better than) the ASTER sensor. Looking further, toward the end of the 2020 decade, the planned Landsat-Next mission will also be able to provide multispectral TIR data over ∼5 bands plus >20 bands in the VSWIR region. However, none of these sensors are dedicated to volcanology missions. The next step in orbital volcano science will come from such a mission that acquires multi- to hyper- spectral image data on a scale of minutes to hours to capture dynamic volcanic processes. This kind of information is essential in the volcanology community moving forward.
Author contributions
DW: conceptualization, visualization, writing–original draft, and writing–review and editing. MR: writing–review and editing.
Funding
The authors declare that financial support was received for the research, authorship, and/or publication of this article. Funding for this article was provided by NASA grant 80NSSC21K0840 awarded to MR.
Acknowledgments
The authors would like to thank the editor, Nick Varley, as well as two reviewers whose comments helped strengthen the final manuscript.
Conflict of interest
The authors declare that the research was conducted in the absence of any commercial or financial relationships that could be construed as a potential conflict of interest.
Publisher’s note
All claims expressed in this article are solely those of the authors and do not necessarily represent those of their affiliated organizations, or those of the publisher, the editors, and the reviewers. Any product that may be evaluated in this article, or claim that may be made by its manufacturer, is not guaranteed or endorsed by the publisher.
References
Abdale, L., Leiter, S., Wilson, S., Russell, K., and Groat, L. (2023). Characterization of hydrothermal alteration in palagonitized deposits using short-wave infrared spectroscopy and X-ray diffraction methods. Can. J. Mineralogy Petrology 61 (2), 365–385. doi:10.3749/2200056
Adams, J. B., and Filice, A. L. (1967). Spectral reflectance 0.4 to 2.0 microns of silicate rock powders. J. Geophys. Res. 72 (22), 5705–5715. doi:10.1029/JZ072i022p05705
Alemanno, G., Maturilli, A., D’Amore, M., and Helbert, J. (2021). A new laboratory emissivity and reflectance spectral library for the interpretation of Mars thermal infrared spectral data. Icarus 368, 114622. doi:10.1016/j.icarus.2021.114622
Alvarado, A., Ruiz, M., Mothes, P., Yepes, H., Segovia, M., Vaca, M., et al. (2018). Seismic, volcanic, and geodetic networks in Ecuador: building capacity for monitoring and research. Seismol. Res. Lett. 89 (2A), 432–439. doi:10.1785/0220170229
Baird, A. K. (1984). Rapid discrimination of granitic rock compositions by low-resolution near-infrared reflectance. J. Geophys. Res. Solid Earth 89 (B4), 2491–2496. doi:10.1029/jb089ib04p02491
Balaram, J., Aung, M., and Golombek, M. P. (2021). The ingenuity helicopter on the perseverance rover. Space Sci. Rev. 217 (4), 56. doi:10.1007/s11214-021-00815-w
Baldridge, A. M., Hook, S. J., Grove, C. I., and Rivera, G. (2009). The ASTER spectral library version 2.0. Remote Sens. Environ. 113 (4), 711–715. doi:10.1016/j.rse.2008.11.007
Biren, J., Slodczyk, A., Andújar, J., del Campo, L., Cosson, L., Li, H., et al. (2022). High temperature spectral emissivity of glass and crystal-bearing basalts. J. Volcanol. Geotherm. Res. 430, 107623. doi:10.1016/j.jvolgeores.2022.107623
Bragado-Massa, E., Marchamalo, M., Rejas, J. G., Bonatti, J., Martínez-Frías, J., and Martínez, R. (2014). Monitoreo de la alteración hidrotermal en volcanes activos mediante teledetección: el caso del volcán Turrialba (Costa Rica). Rev. Geol. América Cent. 51 (51), 69–82. doi:10.15517/rgac.v51i1.16848
Burns, R. G. (1989). Spectral mineralogy of terrestrial planets: scanning their surfaces remotely. Mineral. Mag. 53 (370), 135–151. doi:10.1180/minmag.1989.053.370.02
Byrnes, J. M., Ramsey, M. S., King, P. L., and Lee, R. J. (2007). Thermal infrared reflectance and emission spectroscopy of quartzofeldspathic glasses. Geophys. Res. Lett. 34 (1). doi:10.1029/2006GL02789
Byrnes, J. M., Ramsey, M. S., and Crown, D. A. (2004). Surface unit characterization of the Mauna Ulu flow field, Kilauea Volcano, Hawai′ i, using integrated field and remote sensing analyses. J. Volcanol. Geotherm. Res. 135 (1-2), 169–193. doi:10.1016/j.jvolgeores.2003.12.016
Campbell, B. A., and Shepard, M. K. (1996). Lava flow surface roughness and depolarized radar scattering. J. Geophys. Res. Planets 101, 18941–18951. E8. doi:10.1029/95je01804
Cappello, A., Bilotta, G., and Ganci, G. (2022). Modeling of geophysical flows through GPUFLOW. Appl. Sci. 12 (9), 4395. doi:10.3390/app12094395
Carli, C. R., Roush, T. L., Pedrazzi, G., and Capaccioni, F. A. B. R. I. Z. I. O. (2016). Visible and Near-Infrared (VNIR) reflectance spectroscopy of glassy igneous material: spectral variation, retrieving optical constants and particle sizes by Hapke model. Icarus 266, 267–278. doi:10.1016/j.icarus.2015.10.032
Carter, A. J., and Ramsey, M. S. (2009). ASTER-and field-based observations at Bezymianny Volcano: focus on the 11 May 2007 pyroclastic flow deposit. Remote Sens. Environ. 113 (10), 2142–2151. doi:10.1016/j.rse.2009.05.020
Celik, B. (2023). QLSU (QGIS Linear Spectral Unmixing) Plugin: an open source linear spectral unmixing tool for hyperspectral & multispectral remote sensing imagery. Environ. Model. Softw. 168, 105782. doi:10.1016/j.envsoft.2023.105782
Chevrel, M. O., Harris, A., Peltier, A., Villeneuve, N., Coppola, D., Gouhier, M., et al. (2022). Volcanic crisis management supported by near real-time lava flow hazard assessment at Piton de la Fournaise, La Réunion. Volcanica 5 (2), 313–334. doi:10.30909/vol.05.02.313334
Chevrel, M. O., Labroquère, J., Harris, A. J., and Rowland, S. K. (2018). PyFLOWGO: an open-source platform for simulation of channelized lava thermo-rheological properties. Comput. Geosciences 111, 167–180. doi:10.1016/j.cageo.2017.11.009
Christensen, P. R., Anderson, D. L., Chase, S. C., Clark, R. N., Kieffer, H. H., Malin, M. C., et al. (1992). Thermal emission spectrometer experiment: Mars Observer mission. J. Geophys. Res. Planets 97, 7719–7734. E5. doi:10.1029/92je00453
Christensen, P. R., Bandfield, J. L., Clark, R. N., Edgett, K. S., Hamilton, V. E., Hoefen, T., et al. (2000). Detection of crystalline hematite mineralization on Mars by the Thermal Emission Spectrometer: evidence for near-surface water. J. Geophys. Res. Planets 105, 9623–9642. E4. doi:10.1029/1999je001093
Christensen, P. R., Jakosky, B. M., Kieffer, H. H., Malin, M. C., McSween, H. Y., Nealson, K., et al. (2004). The thermal emission imaging system (THEMIS) for the Mars 2001 Odyssey Mission. Space Sci. Rev. 110, 85–130. doi:10.1023/b:spac.0000021008.16305.94
Christensen, P. R., McSween, H. Y., Bandfield, J. L., Ruff, S. W., Rogers, A. D., Hamilton, V. E., et al. (2005). Evidence for magmatic evolution and diversity on Mars from infrared observations. Nature 436 (7050), 504–509. doi:10.1038/nature03639
Clark, R. N. (1983). Spectral properties of mixtures of montmorillonite and dark carbon grains: implications for remote sensing minerals containing chemically and physically adsorbed water. J. Geophys. Res. Solid Earth 88, 10635–10644. B12. doi:10.1029/jb088ib12p10635
Clark, R. N., and Swayze, G. A. (1995). “Mapping minerals, amorphous materials, environmental materials, vegetation, water, ice and snow, and other materials: the USGS Tricorder algorithm,” in JPL, Summaries of the Fifth Annual JPL Airborne Earth Science Workshop. Volume 1: AVIRIS Workshop, Pasadena, California, January, 1995.
Clark, R. N., Swayze, G. A., Gallagher, A., King, T. V. V., and Calvin, W. M. (1993). The U.S. geological survey, digital spectral library: version 1 (0.2 to 3.0 um). U.S.Geol. Surv. Open File Rep., 93–592. Available at: http://speclab.cr.usgs.gov
Clark, R. N., Swayze, G. A., Livo, K. E., Kokaly, R. F., Sutley, S. J., Dalton, J. B., et al. (2003). Imaging spectroscopy: earth and planetary remote sensing with the USGS Tetracorder and expert systems. J. Geophys. Res. Planets 108. E12. doi:10.1029/2002je001847
Cloutis, E. A., Gaffey, M. J., Smith, D. G., and Lambert, R. S. J. (1990). Reflectance spectra of glass-bearing mafic silicate mixtures and spectral deconvolution procedures. Icarus 86 (2), 383–401. doi:10.1016/0019-1035(90)90226-y
Conel, J. E. (1969). Infrared emissivities of silicates: experimental results and a cloudy atmosphere model of spectral emission from condensed particulate mediums. J. Geophys. Res. 74 (6), 1614–1634. doi:10.1029/jb074i006p01614
Crosta, A. P., Sabine, C., and Taranik, J. V. (1998). Hydrothermal alteration mapping at Bodie, California, using AVIRIS hyperspectral data. Remote Sens. Environ. 65 (3), 309–319. doi:10.1016/s0034-4257(98)00040-6
Crowley, J. K., and Zimbelman, D. R. (1997). Mapping hydrothermally altered rocks on Mount Rainier, Washington, with airborne visible/infrared imaging spectrometer (AVIRIS) data. Geology 25 (6), 559–562. doi:10.1130/0091-7613(1997)025<0559:mharom>2.3.co;2
Crown, D. A., and Ramsey, M. S. (2017). Morphologic and thermophysical characteristics of lava flows southwest of Arsia Mons. Mars. J. Volcanol. Geotherm. Res. 342, 13–28. doi:10.1016/j.jvolgeores.2016.07.008
Davies, A. G., Wilson, L., Head, J. W., de Kleer, K., and de Pater, I. (2023). Discharge rate and composition controls on thermal emission from voluminous lava flow emplacement on Io. LPI Contrib. 2806, 1728.
Deon, F., van Ruitenbeek, F., van der Werff, H., van der Meijde, M., and Marcatelli, C. (2022). Detection of interlayered Illite/smectite clay minerals with XRD, SEM analyses and reflectance spectroscopy. Sensors 22 (9), 3602. doi:10.3390/s22093602
Dozier, J. (1981). A method for satellite identification of surface temperature fields of subpixel resolution. Remote Sens. Environ. 11, 221–229. doi:10.1016/0034-4257(81)90021-3
Dyar, M. D., and Burns, R. G. (1982). “Coordination chemistry of iron in glasses contributing to remote-sensed spectra of the moon,” in Lunar and Planetary Science Conference, 12th, Houston, TX, March 16-20, 1981, Proceedings. Section 1.(A82-31677 15-91) (Vol. 12, pp. 695-702), New York and Oxford, March 16-20, 1982 (Pergamon Press), 695–702.
Fink, J., and Anderson, S. (2023). Lessons learned from the 1980–1986 eruption of the Mount St. Helens composite lava dome. Bull. Volcanol. 85 (6), 35. doi:10.1007/s00445-023-01642-3
Finn, C. A., Deszcz-Pan, M., Anderson, E. D., and John, D. A. (2007). Three-dimensional geophysical mapping of rock alteration and water content at Mount Adams, Washington: implications for lahar hazards. J. Geophys. Res. Solid Earth 112. B10. doi:10.1029/2006jb004783
Flynn, I. T. W., Chevrel, M. O., and Ramsey, M. S. (2023). Adaptation of a thermorheological lava flow model for Venus conditions. J. Geophys. Res. Planets 128 (7), e2022JE007710. doi:10.1029/2022je007710
Flynn, I. T. W., Crown, D. A., and Ramsey, M. S. (2022). Determining emplacement conditions and vent locations for channelized lava flows southwest of Arsia Mons. J. Geophys. Res. Planets 127 (11), e2022JE007467. doi:10.1029/2022je007467
Flynn, L. P., Harris, A. J., Rothery, D. A., and Oppenheimer, C. (2000). High-spatial-resolution thermal remote sensing of active volcanic features using Landsat and Hyperspectral data. Remote Sens. Act. volcanism 116, 161–177. doi:10.1029/gm116p0161
Flynn, L. P., Mouginis-Mark, P. J., Gradie, J. C., and Lucey, P. G. (1993). Radiative temperature measurements at Kupaianaha lava lake, Kilauea Volcano, Hawaii. J. Geophys. Res. Solid Earth 98, 6461–6476. B4. doi:10.1029/92jb02698
Fouchet, T., Reess, J. M., Montmessin, F., Hassen-Khodja, R., Nguyen-Tuong, N., Humeau, O., et al. (2022). The SuperCam infrared spectrometer for the perseverance rover of the Mars2020 mission. Icarus 373, 114773. doi:10.1016/j.icarus.2021.114773
Franke, J., Roberts, D. A., Halligan, K., and Menz, G. (2009). Hierarchical multiple endmember spectral mixture analysis (MESMA) of hyperspectral imagery for urban environments. Remote Sens. Environ. 113 (8), 1712–1723. doi:10.1016/j.rse.2009.03.018
Garvin, J. B., Getty, S., Arney, G. N., Johnson, N., Malespin, C., Webster, C. R., et al. (2020). “Deep atmosphere of Venus investigation of noble gases, chemistry, and imaging plus (DAVINCI+): discovering a new Venus via a flyby, probe, orbiter mission,” in AGU fall meeting abstracts (Vol. 2020), United States, December, 2020, P026–P0001.
Grainger, R. G., Peters, D. M., Thomas, G. E., Smith, A. J. A., Siddans, R., Carboni, E., et al. (2013). Measuring volcanic plume and ash properties from space. Geol. Soc. Lond. Spec. Publ. 380 (1), 293–320. doi:10.1144/sp380.7
Green, R. O., Eastwood, M. L., Sarture, C. M., Chrien, T. G., Aronsson, M., Chippendale, B. J., et al. (1998). Imaging spectroscopy and the airborne visible/infrared imaging spectrometer (AVIRIS). Remote Sens. Environ. 65 (3), 227–248. doi:10.1016/s0034-4257(98)00064-9
Grove, C. I., Hook, S. J., and Paylor, E. D. (1992). Laboratory reflectance spectra of 160 minerals, 0.4 to 2.5 micrometers (No. JPL-Publ-92-2).
Hackwell, J. A., Warren, D. W., Bongiovi, R. P., Hansel, S. J., Hayhurst, T. L., Mabry, D. J., et al. (1996). “LWIR/MWIR imaging hyperspectral sensor for airborne and ground-based remote sensing,” in Imaging spectrometry II (Vol. 2819), Denver CO, United States, November, 1996, 102–107.
Hamilton, V. E., and Ruff, S. W. (2012). Distribution and characteristics of Adirondack-class basalt as observed by Mini-TES in Gusev crater, Mars and its possible volcanic source. Icarus 218 (2), 917–949. doi:10.1016/j.icarus.2012.01.011
Hapke, B. (1981). Bidirectional reflectance spectroscopy: 1. Theory. J. Geophys. Res. Solid Earth 86, 3039–3054. B4. doi:10.1029/jb086ib04p03039
Hapke, B. (1984). Bidirectional reflectance spectroscopy: 3. Correction for macroscopic roughness. Icarus 59 (1), 41–59. doi:10.1016/0019-1035(84)90054-x
Hapke, B. (2002). Bidirectional reflectance spectroscopy: 5. The coherent backscatter opposition effect and anisotropic scattering. Icarus 157 (2), 523–534. doi:10.1006/icar.2002.6853
Hapke, B. (2012). Theory of reflectance and emittance spectroscopy. New York: Cambridge University Press.
Harris, A. J., Flynn, L. P., Rothery, D. A., Oppenheimer, C., and Sherman, S. B. (1999). Mass flux measurements at active lava lakes: implications for magma recycling. J. Geophys. Res. Solid Earth 104, 7117–7136. B4. doi:10.1029/98jb02731
Harris, A. J., and Rowland, S. (2001). FLOWGO: a kinematic thermo-rheological model for lava flowing in a channel. Bull. Volcanol. 63, 20–44. doi:10.1007/s004450000120
Harris, A. J. L., Chevrel, M. O., Coppola, D., Ramsey, M. S., Hrysiewicz, A., Thivet, S., et al. (2019). Validation of an integrated satellite-data-driven response to an effusive crisis: the April–May 2018 eruption of Piton de la Fournaise. Ann. Geophys. 62 (2), 1–18. doi:10.4401/ag-7972
Head, E. M., Maclean, A. L., and Carn, S. A. (2013). Mapping lava flows from Nyamuragira volcano (1967–2011) with satellite data and automated classification methods. Geomatics, Nat. Hazards Risk 4 (2), 119–144. doi:10.1080/19475705.2012.680503
Heap, M. J., Baumann, T., Gilg, H. A., Kolzenburg, S., Ryan, A. G., Villeneuve, M., et al. (2021). Hydrothermal alteration can result in pore pressurization and volcano instability. Geology 49 (11), 1348–1352. doi:10.1130/g49063.1
Heavens, N. G., Cantor, B. A., Hayne, P. O., Kass, D. M., Kleinböhl, A., McCleese, D. J., et al. (2015). Extreme detached dust layers near Martian volcanoes: evidence for dust transport by mesoscale circulations forced by high topography. Geophys. Res. Lett. 42 (10), 3730–3738. doi:10.1002/2015gl064004
Hecker, C., Van der Meijde, M., and Van der Meer, F. D. (2010). Thermal infrared spectroscopy on feldspars - successes, limitations and their implications for remote sensing. Earth-Science Rev. 103 (1-2), 60–70. doi:10.1016/j.earscirev.2010.07.005
Heiken, G. (1972). Morphology and petrography of volcanic ashes. Geol. Soc. Am. Bull. 83 (7), 1961–1988. doi:10.1130/0016-7606(1972)83[1961:mapova]2.0.co;2
Helbert, J., Vandaele, A. C., Marcq, E., Robert, S., Ryan, C., Guignan, G., et al. (2019). “The VenSpec suite on the ESA EnVision mission to Venus,” in Infrared remote sensing and instrumentation XXVII (vol. 11128) (San Diego, CA, United States: SPIE), 18–32.
Herrick, R. R., and Hensley, S. (2023). Surface changes observed on a Venusian volcano during the Magellan mission. Science 379 (6638), 1205–1208. doi:10.1126/science.abm7735
Hook, S. J., Johnson, W. R., and Abrams, M. J. (2013). “NASA’s hyperspectral thermal emission spectrometer (HyTES),” in Thermal infrared remote sensing: sensors, methods, applications (Dordrecht: Springer Netherlands), 93–115.
Hook, S. J., Myers, J. J., Thome, K. J., Fitzgerald, M., and Kahle, A. B. (2001). The MODIS/ASTER airborne simulator (MASTER)—a new instrument for earth science studies. Remote Sens. Environ. 76 (1), 93–102. doi:10.1016/s0034-4257(00)00195-4
Horwell, C. J. (2007). Grain-size analysis of volcanic ash for the rapid assessment of respiratory health hazard. J. Environ. Monit. 9 (10), 1107–1115. doi:10.1039/b710583p
Hulley, G., Hook, S., Fisher, J., and Lee, C. (2017). “ECOSTRESS, A NASA Earth-Ventures Instrument for studying links between the water cycle and plant health over the diurnal cycle,” in 2017 IEEE international geoscience and remote sensing symposium (IGARSS), Fort Worth, TX, USA, July 23-28, 2017 (IEEE), 5494–5496.
Hunt, G. R., and Salisbury, J. W. (1970). Visible and near-infrared spectra of minerals and rocks, I. Silicate minerals. Mod. Geol. 1, 283–300.
Hunt, G. R., Salisbury, J. W., and Lenhoff, C. J. (1971a). Visible and near-infrared spectra of minerals and rocks, III. Oxides and hydroxides. Mod. Geol. 2, 195–205.
Hunt, G. R., Salisbury, J. W., and Lenhoff, C. J. (1971b). Visible and near-infrared spectra of minerals and rocks, IV. Sulphides sulphates, Mod. Geol. 3, 1–14.
Hunt, G. R., Salisbury, J. W., and Lenhoff, C. J. (1973a). Visible and near-infrared spectra of minerals and rocks, VII. Acidic igneous rocks. Mod. Geol. 4, 217–224.
Hunt, G. R., Salisbury, J. W., and Lenhoff, C. J. (1973b). Visible and near-infrared spectra of minerals and rocks, VIII. Intermediate igneous rocks. Mod. Geol. 4, 237–244.
Hunt, G. R., Salisbury, J. W., and Lenhoff, C. J. (1974). Visible and near-infrared spectra of minerals and rocks, IX. Basic and ultrabasic igneous rocks. Mod. Geol. 5, 15–22.
Jakobsson, S. P., and Moore, J. G. (1986). Hydrothermal minerals and alteration rates at Surtsey volcano, Iceland. Geol. Soc. Am. Bull. 97 (5), 648–659. doi:10.1130/0016-7606(1986)97<648:hmaara>2.0.co;2
James, M. R., Carr, B., D'Arcy, F., Diefenbach, A., Dietterich, H., Fornaciai, A., et al. (2020). Volcanological applications of unoccupied aircraft systems (UAS): developments, strategies, and future challenges. Volcanica 3 (1), 67–114. doi:10.30909/vol.03.01.67114
John, D. A., Sisson, T. W., Breit, G. N., Rye, R. O., and Vallance, J. W. (2008). Characteristics, extent and origin of hydrothermal alteration at Mount Rainier Volcano, Cascades Arc, USA: implications for debris-flow hazards and mineral deposits. J. Volcanol. Geotherm. Res. 175 (3), 289–314. doi:10.1016/j.jvolgeores.2008.04.004
Kereszturi, G., Schaefer, L. N., Miller, C., and Mead, S. (2020). Hydrothermal alteration on composite volcanoes: mineralogy, hyperspectral imaging, and aeromagnetic study of Mt Ruapehu, New Zealand. Geochem. Geophys. Geosystems 21 (9), e2020GC009270. doi:10.1029/2020gc009270
Kokaly, R. F. (2011). PRISM: Processing routines in IDL for spectroscopic measurements (installation manual and user’s guide, version 1.0) (No. 2011-1155). Reston, VA, United States: US Geological Survey.
Kokaly, R. F., Clark, R. N., Swayze, G. A., Livo, K. E., Hoefen, T. M., Pearson, N. C., et al. (2017). Usgs spectral library version 7 data: us geological survey data release. Reston, VA, USA: United States Geological Survey USGS, 61.
Kubanek, J., Richardson, J. A., Charbonnier, S. J., and Connor, L. J. (2015). Lava flow mapping and volume calculations for the 2012–2013 Tolbachik, Kamchatka, fissure eruption using bistatic TanDEM-X InSAR. Bull. Volcanol. 77, 106–113. doi:10.1007/s00445-015-0989-9
Lee, R. J., Ramsey, M. S., and King, P. L. (2013). Development of a new laboratory technique for high-temperature thermal emission spectroscopy of silicate melts. J. Geophys. Res. Solid Earth 118 (5), 1968–1983. doi:10.1002/jgrb.50197
Le Losq, C., Cicconi, M. R., and Neuville, D. R. (2021). Iron in silicate glasses and melts: implications for volcanological processes. Magma redox Geochem., 233–253. doi:10.1002/9781119473206.ch12
Li, L., Canters, F., Solana, C., Ma, W., Chen, L., and Kervyn, M. (2015). Discriminating lava flows of different age within Nyamuragira’s volcanic field using spectral mixture analysis. Int. J. Appl. earth observation geoinformation 40, 1–10. doi:10.1016/j.jag.2015.03.015
Lopez, D. L., and Williams, S. N. (1993). Catastrophic volcanic collapse: relation to hydrothermal processes. Science 260 (5115), 1794–1796. doi:10.1126/science.260.5115.1794
Lopez, T., Thomas, H. E., Prata, A. J., Amigo, A., Fee, D., and Moriano, D. (2015). Volcanic plume characteristics determined using an infrared imaging camera. J. Volcanol. Geotherm. Res. 300, 148–166. doi:10.1016/j.jvolgeores.2014.12.009
Lyon, R. J. P. (1965). Analysis of rocks by spectral infrared emission (8 to 25 microns). Econ. Geol. 60 (4), 715–736. doi:10.2113/gsecongeo.60.4.715
Marzban, P., Bredemeyer, S., Walter, T. R., Kästner, F., Müller, D., and Chabrillat, S. (2023). Hydrothermally altered deposits of 2014 Askja landslide, Iceland, identified by remote sensing imaging. Front. Earth Sci. 11, 1083043. doi:10.3389/feart.2023.1083043
Maturilli, A., Helbert, J., and Arnold, G. (2019). “The newly improved set-up at the Planetary Spectroscopy Laboratory (PSL),” in Infrared remote sensing and instrumentation XXVII (vol. 11128) (San Diego, CA, United States: SPIE), 187–196.
Maturilli, A., Helbert, J., and Moroz, L. (2008). The Berlin emissivity database (BED). Planet. Space Sci. 56 (3-4), 420–425. doi:10.1016/j.pss.2007.11.015
McSween, H. Y., Arvidson, R. E., Bell, J. F., Blaney, D., Cabrol, N. A., Christensen, P. R., et al. (2004). Basaltic rocks analyzed by the Spirit rover in Gusev Crater. Science 305 (5685), 842–845. doi:10.1126/science.3050842
Meerdink, S. K., Hook, S. J., Roberts, D. A., and Abbott, E. A. (2019). The ECOSTRESS spectral library version 1.0. Remote Sens. Environ. 230, 111196. doi:10.1016/j.rse.2019.05.015
Meneses, D. S., Melin, P., Del Campo, L., Cosson, L., and Echegut, P. (2015). Apparatus for measuring the emittance of materials from far infrared to visible wavelengths in extreme conditions of temperature. Infrared Phys. Technol. 69, 96–101. doi:10.1016/j.infrared.2015.01.011
Millán, M. M., Gallant, A. J., Chung, Y. S., and Fanaki, F. (1985). COSPEC observation of Mt. St. Helens volcanic SO2 eruption cloud of 18 May 1980 over southern Ontario. Atmos. Environ. 19 (2), 255–263. doi:10.1016/0004-6981(85)90093-9
Minitti, M. E., and Hamilton, V. E. (2010). A search for basaltic-to-intermediate glasses on Mars: assessing Martian crustal mineralogy. Icarus 210 (1), 135–149. doi:10.1016/j.icarus.2010.06.028
Minitti, M. E., Mustard, J. F., and Rutherford, M. J. (2002). Effects of glass content and oxidation on the spectra of SNC-like basalts: applications to Mars remote sensing. J. Geophys. Res. Planets 107, 6–1. E5. doi:10.1029/2001je001518
Murchie, S., Arvidson, R., Bedini, P., Beisser, K., Bibring, J. P., Bishop, J., et al. (2007). Compact reconnaissance imaging spectrometer for Mars (CRISM) on Mars reconnaissance orbiter (MRO). J. Geophys. Res. Planets 112. E5. doi:10.1029/2006je002682
Patrick, M., Orr, T., Fisher, G., Trusdell, F., and Kauahikaua, J. (2017). Thermal mapping of a pāhoehoe lava flow, Kīlauea Volcano. J. Volcanol. Geotherm. Res. 332, 71–87. doi:10.1016/j.jvolgeores.2016.12.007
Pieri, D. C., Glaze, L. S., and Abrams, M. J. (1990). Thermal radiance observations of an active lava flow during the June 1984 eruption of Mount Etna. Geology 18 (10), 1018–1022. doi:10.1130/0091-7613(1990)018<1018:trooaa>2.3.co;2
Pieters, C. M. (1983). Strength of mineral absorption features in the transmitted component of near-infrared reflected light: first results from RELAB. J. Geophys. Res. Solid Earth 88, 9534–9544. B11. doi:10.1029/jb088ib11p09534
Pinkerton, H., James, M., and Jones, A. (2002). Surface temperature measurements of active lava flows on Kilauea volcano, Hawai′ i. J. Volcanol. Geotherm. Res. 113 (1-2), 159–176. doi:10.1016/s0377-0273(01)00257-8
Pisello, A., Vetere, F. P., Bisolfati, M., Maturilli, A., Morgavi, D., Pauselli, C., et al. (2019). Retrieving magma composition from TIR spectra: implications for terrestrial planets investigations. Sci. Rep. 9 (1), 15200. doi:10.1038/s41598-019-51543-9
Popa, R. G., Bachmann, O., and Huber, C. (2021). Explosive or effusive style of volcanic eruption determined by magma storage conditions. Nat. Geosci. 14 (10), 781–786. doi:10.1038/s41561-021-00827-9
Prata, A. J., and Bernardo, C. (2009). Retrieval of volcanic ash particle size, mass and optical depth from a ground-based thermal infrared camera. J. Volcanol. Geotherm. Res. 186 (1-2), 91–107. doi:10.1016/j.jvolgeores.2009.02.007
Prata, A. J., and Bernardo, C. (2014). Retrieval of sulfur dioxide from a ground-based thermal infrared imaging camera. Atmos. Meas. Tech. 7 (9), 2807–2828. doi:10.5194/amt-7-2807-2014
Rader, E., Ackiss, S., Sehlke, A., Bishop, J., Orrill, B., Odegaard, K., et al. (2022). Average VNIR reflectance: a rapid, sample-free method to estimate glass content and crystallinity of fresh basaltic lava. Icarus 383, 115084. doi:10.1016/j.icarus.2022.115084
Ramsey, M., Chevrel, M. O., Coppola, D., and Harris, A. J. (2019). The influence of emissivity on the thermo-rheological modeling of the channelized lava flows at Tolbachik volcano. Ann. Geophys. 61. doi:10.4401/ag-8077
Ramsey, M. S., and Christensen, P. R. (1998). Mineral abundance determination: quantitative deconvolution of thermal emission spectra. J. Geophys. Res. Solid Earth 103 (B1), 577–596. doi:10.1029/97jb02784
Ramsey, M. S., Corradino, C., Thompson, J. O., and Leggett, T. N. (2023). Statistical retrieval of volcanic activity in long time series orbital data: implications for forecasting future activity. Remote Sens. Environ. 295, 113704. doi:10.1016/j.rse.2023.113704
Ramsey, M. S., and Fink, J. H. (1999). Estimating silicic lava vesicularity with thermal remote sensing: a new technique for volcanic mapping and monitoring. Bull. Volcanol. 61, 32–39. doi:10.1007/s004450050260
Ramsey, M. S., Wessels, R. L., and Anderson, S. W. (2012). Surface textures and dynamics of the 2005 lava dome at Shiveluch Volcano, Kamchatka. Bulletin 124 (5-6), 678–689. doi:10.1130/b30580.1
Realmuto, V. J., Sutton, A. J., and Elias, T. (1997). Multispectral thermal infrared mapping of sulfur dioxide plumes: a case study from the East Rift Zone of Kilauea Volcano, Hawaii. J. Geophys. Res. Solid Earth 102, 15057–15072. (B7). doi:10.1029/96jb03916
Reid, M. E., Sisson, T. W., and Brien, D. L. (2001). Volcano collapse promoted by hydrothermal alteration and edifice shape, Mount Rainier, Washington. Mt. Rainier, Wash. Geol. 29 (9), 779–782. doi:10.1130/0091-7613(2001)029<0779:vcpbha>2.0.co;2
Rejas, J. G., Martínez-Frías, J., Bonatti, J., Martínez, R., and Marchamalo, M. (2012). Anomaly detection and comparative analysis of hydrothermal alteration materials trough hyperspectral multisensor data in the Turrialba Volcano. Int. Archives Photogrammetry, Remote Sens. Spatial Inf. Sci. 39, 151–155. doi:10.5194/isprsarchives-xxxix-b7-151-2012
Roberts, D. A., Gardner, M., Church, R., Ustin, S., Scheer, G., and Green, R. O. (1998). Mapping chaparral in the Santa Monica Mountains using multiple endmember spectral mixture models. Remote Sens. Environ. 65 (3), 267–279. doi:10.1016/s0034-4257(98)00037-6
Rodríguez, A., and van Bergen, M. J. (2017). Superficial alteration mineralogy in active volcanic systems: an example of Poás volcano, Costa Rica. J. Volcanol. Geotherm. Res. 346, 54–80. doi:10.1016/j.jvolgeores.2017.04.006
Rogers, A. D., and Nekvasil, H. (2015). Feldspathic rocks on Mars: compositional constraints from infrared spectroscopy and possible formation mechanisms. Geophys. Res. Lett. 42 (8), 2619–2626. doi:10.1002/2015gl063501
Rogic, N., Bilotta, G., Ganci, G., Thompson, J. O., Cappello, A., Rymer, H., et al. (2022). The impact of dynamic emissivity–temperature trends on spaceborne data: applications to the 2001 Mount Etna eruption. Remote Sens. 14 (7), 1641. doi:10.3390/rs14071641
Rose, S. R., Watson, I. M., Ramsey, M. S., and Hughes, C. G. (2014). Thermal deconvolution: accurate retrieval of multispectral infrared emissivity from thermally-mixed volcanic surfaces. Remote Sens. Environ. 140, 690–703. doi:10.1016/j.rse.2013.10.009
Rothery, D. A., Francis, P. W., and Wood, C. A. (1988). Volcano monitoring using short wavelength infrared data from satellites. J. Geophys. Res. Solid Earth 93, 7993–8008. B7. doi:10.1029/jb093ib07p07993
Rowan, L. C., Crowley, J. K., Schmidt, R. G., Ager, C. M., and Mars, J. C. (2000). Mapping hydrothermally altered rocks by analyzing hyperspectral image (AVIRIS) data of forested areas in the Southeastern United States. J. Geochem. Explor. 68 (3), 145–166. doi:10.1016/s0375-6742(99)00081-3
Ruff, S. W., Christensen, P. R., Barbera, P. W., and Anderson, D. L. (1997). Quantitative thermal emission spectroscopy of minerals: a laboratory technique for measurement and calibration. J. Geophys. Res. Solid Earth 102, 14899–14913. B7. doi:10.1029/97jb00593
Ruff, S. W., Christensen, P. R., Blaney, D. L., Farrand, W. H., Johnson, J. R., Michalski, J. R., et al. (2006). The rocks of Gusev Crater as viewed by the Mini-TES instrument. J. Geophys. Res. Planets 111. E12. doi:10.1029/2006je002747
Salisbury, J. W., and ’ D'Aria, D. M. (1992a). Infrared (8–14 μm) remote sensing of soil particle size. Remote Sens. Environ. 42 (2), 157–165. doi:10.1016/0034-4257(92)90099-6
Salisbury, J. W., and ’ D'Aria, D. M. (1992b). Emissivity of terrestrial materials in the 8–14 μm atmospheric window. Remote Sens. Environ. 42 (2), 83–106. doi:10.1016/0034-4257(92)90092-x
Salisbury, J. W., and D’Aria, D. M. (1994). Emissivity of terrestrial materials in the 3–5 μm atmospheric window. Remote Sens. Environ. 47 (3), 345–361. doi:10.1016/0034-4257(94)90102-3
Salisbury, J. W., D'Aria, D. M., and Wald, A. (1994). Measurements of thermal infrared spectral reflectance of frost, snow, and ice. J. Geophys. Res. Solid Earth 99, 24235–24240. B12. doi:10.1029/94jb00579
Salisbury, J. W., and Walter, L. S. (1989). Thermal infrared (2.5–13.5 μm) spectroscopic remote sensing of igneous rock types on particulate planetary surfaces. J. Geophys. Res. Solid Earth 94, 9192–9202. B7. doi:10.1029/jb094ib07p09192
Salisbury, J. W., Walter, L. S., Vergo, N., and D’Aria, D. M. (1991). Infrared (2.1-25 micrometers) spectra of minerals. Baltimore, MD, United States: Johns Hopkins University Press, 294.
Schaefer, L. N., Kereszturi, G., Kennedy, B. M., and Villeneuve, M. (2023). Characterizing lithological, weathering, and hydrothermal alteration influences on volcanic rock properties via spectroscopy and laboratory testing: a case study of Mount Ruapehu volcano, New Zealand. Bull. Volcanol. 85 (8), 43–29. doi:10.1007/s00445-023-01657-w
Sieron, K., Ferres, D., Siebe, C., Capra, L., Constantinescu, R., Agustín-Flores, J., et al. (2019). Ceboruco hazard map: part I-definition of hazard scenarios based on the eruptive history. J. Appl. Volcanol. 8, 9–22. doi:10.1186/s13617-019-0088-2
Sigmarsson, O., Vlastélic, I., Andreasen, R., Bindeman, I., Devidal, J. L., Moune, S., et al. (2011). Remobilization of silicic intrusion by mafic magmas during the 2010 Eyjafjallajökull eruption. Solid earth. 2 (2), 271–281. doi:10.5194/se-2-271-2011
Sinha, P., and Horgan, B. (2022). Sediments within the icy North Polar deposits of Mars record recent impacts and volcanism. Geophys. Res. Lett. 49 (8), e2022GL097758. doi:10.1029/2022gl097758
Smekens, J. F., and Gouhier, M. (2018). Observation of SO2 degassing at Stromboli volcano using a hyperspectral thermal infrared imager. J. Volcanol. Geotherm. Res. 356, 75–89. doi:10.1016/j.jvolgeores.2018.02.018
Smrekar, S., Hensley, S., Nybakken, R., Wallace, M. S., Perkovic-Martin, D., You, T. H., et al. (2022). “VERITAS (Venus emissivity, radio science, InSAR, topography, and spectroscopy): a discovery mission,” in 2022 IEEE Aerospace Conference (AERO), Big Sky, Montana, USA, 5-12 March 2022 (IEEE), 1–20.
Spampinato, L., Calvari, S., Oppenheimer, C., and Boschi, E. (2011). Volcano surveillance using infrared cameras. Earth-Science Rev. 106 (1-2), 63–91. doi:10.1016/j.earscirev.2011.01.003
Thollot, P., Mangold, N., Ansan, V., Le Mouélic, S., Milliken, R. E., Bishop, J. L., et al. (2012). Most Mars minerals in a nutshell: various alteration phases formed in a single environment in Noctis Labyrinthus. J. Geophys. Res. Planets. 117 (E11). doi:10.1029/2011JE004028
Thompson, J. O., Contreras-Arratia, R., Befus, K. S., and Ramsey, M. S. (2022). Thermal and seismic precursors to the explosive eruption at La soufrière volcano, st. Vincent in April 2021. Earth Planet. Sci. Lett. 592, 117621. doi:10.1016/j.epsl.2022.117621
Thompson, J. O., and Ramsey, M. S. (2020). Spatiotemporal variability of active lava surface radiative properties using ground-based multispectral thermal infrared data. J. Volcanol. Geotherm. Res. 408, 107077. doi:10.1016/j.jvolgeores.2020.107077
Thompson, J. O., and Ramsey, M. S. (2021). The influence of variable emissivity on lava flow propagation modeling. Bull. Volcanol. 83 (6), 41. doi:10.1007/s00445-021-01462-3
Thompson, J. O., Ramsey, M. S., and Hall, J. L. (2019). MMT-Cam: a new miniature multispectral thermal infrared camera system for capturing dynamic earth processes. IEEE Trans. Geoscience Remote Sens. 57 (10), 7438–7446. doi:10.1109/tgrs.2019.2913344
Thompson, J. O., Williams, D. B., Lee, R. J., and Ramsey, M. S. (2021). Quantitative thermal emission spectroscopy at high temperatures: a laboratory approach for measurement and calibration. J. Geophys. Res. Solid Earth 126 (7), e2021JB022157. doi:10.1029/2021jb022157
Tolometti, G. D., Neish, C. D., Osinski, G. R., Hughes, S. S., and Nawotniak, S. K. (2020). Interpretations of lava flow properties from radar remote sensing data. Planet. Space Sci. 190, 104991. doi:10.1016/j.pss.2020.104991
Turcotte, C., Bouffard, F., and Lahaie, P. (2023). “Performance assessment of the new Telops hyper-cam airborne mini,” in Algorithms, technologies, and applications for multispectral and hyperspectral imaging XXIX (vol. 12519) (Orlando, FL, United States: SPIE), 170–177.
Vaughan, R. G., Hook, S. J., Ramsey, M. S., Realmuto, V. J., and Schneider, D. J. (2005). Monitoring eruptive activity at Mount St. Helens with TIR image data. Geophys. Res. Lett. 32 (19). doi:10.1029/2005gl024112
Walter, L. S., and Salisbury, J. W. (1989). Spectral characterization of igneous rocks in the 8-to 12-μm region. J. Geophys. Res. Solid Earth 94 (B7), 9203–9213. doi:10.1029/jb094ib07p09203
Williams, D. B., and Ramsey, M. S. (2019). On the applicability of laboratory thermal infrared emissivity spectra for deconvolving satellite data of opaque volcanic ash plumes. Remote Sens. 11 (19), 2318. doi:10.3390/rs11192318
Williams, D. B., and Ramsey, M. S. (2022). Analysis of ash emissions from the 2020 Nishinoshima eruption using ASTER thermal infrared orbital data. J. Volcanol. Geotherm. Res. 421, 107424. doi:10.1016/j.jvolgeores.2021.107424
Yang, K., Huntington, J. F., Browne, P. R., and Ma, C. (2000). An infrared spectral reflectance study of hydrothermal alteration minerals from the Te Mihi sector of the Wairakei geothermal system, New Zealand. Geothermics 29 (3), 377–392. doi:10.1016/s0375-6505(00)00004-3
Keywords: spectroscopy, volcano monitoring, emissivity, reflectance, infrared, planetary science
Citation: Williams DB and Ramsey MS (2024) Infrared spectroscopy of volcanoes: from laboratory to orbital scale. Front. Earth Sci. 12:1308103. doi: 10.3389/feart.2024.1308103
Received: 05 October 2023; Accepted: 05 January 2024;
Published: 24 January 2024.
Edited by:
Nick Varley, University of Colima, MexicoReviewed by:
Muhammad Aufaristama, University of Twente, NetherlandsGoutham Krishna Teja Gunda, Indian Institute of Remote Sensing, India
Copyright © 2024 Williams and Ramsey. This is an open-access article distributed under the terms of the Creative Commons Attribution License (CC BY). The use, distribution or reproduction in other forums is permitted, provided the original author(s) and the copyright owner(s) are credited and that the original publication in this journal is cited, in accordance with accepted academic practice. No use, distribution or reproduction is permitted which does not comply with these terms.
*Correspondence: Daniel B. Williams, dbwilliams@pitt.edu