Soil degradation in andean watersheds: a case study using remote sensing
 Fernando Oñate-Valdivieso
 Arianna Oñate-Paladines
 - Hydrology and Climatology Research Group, Department of Civil Engineering, Universidad Técnica Particular de Loja, Loja, Ecuador
Soil degradation is one of the greatest challenges faced by arid and semi-arid zones, as it causes a progressive loss of the capacity of soils to sustain life and human activities. In the present study, five spectral indices, individually associated with erosion, desertification, salinity, and soil sealing, were evaluated in a semi-arid region of the Ecuadorian Andes to study of soil degradation. The results were validated through field observations and samples processed in the laboratory. The spectral indices presented correlation coefficients between 0.5278 and 0.8809 with field observations. These indices provided useful information to understand the current state of the soils and their potential deterioration. The study area showed greater vulnerability to erosion caused by the combination of scarce vegetation, irregular topography, and significant seasonal rainfall. The advance of urbanization, mechanized agriculture, and overgrazing had a high impact by impermeabilizing considerable surfaces, while the advance of desertification and soil salinization showed little incidence in the study area. The systematic application of these indices would become a valuable means for monitoring soil degradation in Andean watersheds.
1 Introduction
Land degradation is one of the biggest challenges to people’s livelihoods and the environment all around the world (Dubovyk, 2017). Soil degradation can be defined as the gradual deterioration of soil quality, which leads to the loss of its ability to support life and human activities. In the case of agricultural lands or soils subjected to anthropic impact, if sustainable soil protection and management practices are not implemented, the soil will not be able to recover its normal ecological functions (Osman, 2018).
Erosion produces land degradation and reduces fertility, leading to eutrophication of water, blockage of riverbeds, and damage to infrastructure (Borrelli et al., 2017). Bare soil is considered one of the main causes of erosion (Morgan, 2005). The loss of vegetation cover is the result of forest clearing, forest fires, agricultural activities, urban growth, among others. The maintenance of soil cover reduces soil erosion by dissipating the kinetic energy of raindrops, decreasing the flow velocity (Li et al., 2021) and attenuating soil compaction (Martíni et al., 2021).
On the other hand, the presence of salts in the soil is considered a limiting factor for crop yields, especially in arid and semi-arid or near-shore regions (Rodríguez et al., 2016; Ponce et al., 2018). The genesis of natural salinity is primarily based on the physical and/or chemical weathering of salts and their migration from parent material, geologic deposits, or groundwater. Secondary salinization is mainly caused by external factors, such as irrigation, other agricultural practices, and/or acidic precipitation. Salinity usually occurs in irrigated soils due to the accumulation of soluble salts resulting from the continuous use of irrigation water containing high or medium amounts of soluble salts (Allbed and Kumar, 2013). Saline soil conditions have resulted in a significant decrease in the value and productivity of vast land areas worldwide (Asfaw et al., 2018).
Additionally, soil compaction is the physical form of soil degradation that changes soil structure and influences soil productivity. Soil grains are rearranged to decrease void space and bring them into closer contact with each other, increasing the bulk density (Nawaz et al., 2013). Compaction can be a natural phenomenon caused by freezing and drying, precipitation, seasonal cycles, etc., that affects the superficial layers of the soil or an artificial phenomenon caused by mechanical operations or animal trampling that compacts the soil to greater depths or urban growth that creates impervious surfaces (Oñate-Valdivieso et al., 2022). No matter its origin, soil compaction influences water dynamics, pesticide diffusion, soil erosion, carbon and nitrogen cycles, plant growth, among others (Nawaz et al., 2013).
Finally, desertification is land degradation in arid, semi-arid, and dry sub-humid areas, where the ratio of annual precipitation to potential evapotranspiration falls within the range of 0.05–0.65, resulting from various factors, including climatic variations and human activities (ICCD, 1994). Desertification has led to the expansion of desert-like characteristics in non-desert areas throughout human history and is a major obstacle to sustainable development (Lyu et al., 2020). The causes and consequences of land degradation and desertification concern several interdependent human activities, directly implicating more than one land resource (soil, water, and vegetation), and involving diverse economic sectors, social groups, and institutions, spanning the local to global spectrum. Its occurrence exposes land resources and human populations to multiple threats, such as the loss of land productivity, food insecurity, water shortages and scarcity, economic hardship, social deprivation, and health risks (Briassoulis et al., 2019). The texture of topsoil is closely related to land degradation. The more severe the desertification, the coarser the topsoil grain composition. Therefore, this may be an indicator that can be monitored by remote sensing (Xiao et al., 2006).
Remote sensing and satellite imagery have been widely utilized for environmental studies, including urban expansion (Dou et al., 2017; Chai et al., 2018; Zhang et al., 2020; Oñate-Valdivieso, et al., 2022), deforestation (Souza et al., 2013; Hamunyela et al., 2016; Schultz et al., 2016), climate change impacts (Mo et al., 2019; Zhu et al., 2020), wildfire damage (Meddens et al., 2016; Hislop et al., 2018) and other natural and anthropogenic dynamics.
Regarding the study of land degradation, remote sensing has been widely applied with different approaches. Here are some examples: Multitemporal analysis of Landsat TM/ETM images has been used to study the presence of salinity and vegetation degradation in transition zones between grasslands and crops in China (Chen and Rao, 2008). Visual analysis of TM/ETM+ and MODIS images, spectral indices, and multitemporal analysis were used to study land degradation processes in Niger (Fiorillo et al., 2017). The relation between measured Land Surface Temperature and Normalized Difference Vegetation Index was used to assess land degradation and desertification in India using Landsat 8 (Kumar et al., 2022). Spectroscopy technique and RUSLE model were used to evaluate soil loss by water erosion in a sugarcane cropland in Brazil (Gallo et al., 2023). Retrospective monitoring of soil and land cover, deep machine learning using convolutional neural networks, and cartographic analysis were used to study eroded areas in Russia (Rukhovich et al., 2023). Gridded precipitation products, the Revised universal Soil Loss Equation, and the Revised Wind Erosion Equation (RWEQ) were applied to the modeling of water and wind erosion in Australia (Zhang et al., 2022). Sentinel-1 C radar data and Sentinel-2 optical data acquired simultaneously, along with several machine learning algorithms, were applied to predict soil salinity in drylands of Egypt.
There are diverse high-resolution satellites that positively support environmental studies. Landsat data is commonly used in numerous studies worldwide since its data cover nearly 50 years consecutively (Wulder et al., 2019). Landsat imagery provides moderate spatial resolution, which means it can capture finer details on the earth’s surface compared to lower resolution sensors. This is crucial for detecting subtle changes in land cover and identifying degraded areas. Moreover, Landsat satellites offer a relatively high revisit frequency. The Landsat satellite constellation has enabled global coverage every few days, which facilitates regular monitoring of land changes and assessment of the temporal dynamics of degradation (Oñate-Valdivieso et al., 2022b). In addition, the Landsat series has an extensive data history spanning several decades. This provides the ability to perform time series analysis to assess long-term trends in land degradation, something that can be essential for understanding patterns and underlying causes. In addition, a major advantage is that Landsat data are freely available through the NASA Landsat Program and the U.S. Geological Survey (USGS), which facilitates access to the information for researchers and practitioners without significant financial constraints (Mera-Parra et al., 2021).
Landsat’s versatility allows for diverse applications, not only in land degradation detection, but also in land use change monitoring, water resource studies, vegetation assessment, among others. Considering these advantages, choosing Landsat imagery for spectral index analysis in land degradation identification provides a unique combination of resolution, frequency and data accessibility that makes it ideal for many environmental studies.
A spectral index is a quantitative value derived from measurements at different wavelengths of the electromagnetic spectrum. It is calculated to characterize specific conditions of vegetation, soil, climate, among others. The Normalized Difference Vegetation Index (NDVI) has been widely used in environmental and vegetation studies (Hussain et al., 2022) as it has a great capacity to identify seasonal changes in vegetation and has been used to detect crop types and land use change (LULC), as well as to evaluate crop yield and production (Hussain et al. (2023). The Bare Soil Index (BSI) allows the identification of areas of bare soil or with very little vegetation and with some modifications, it has also been used in the study of land conversion, impervious surface, and its relation to surface temperature (Nguyen, et al., 2021). The Grain Size Index (GSI) is appropriated to characterize the texture of the soil surface depending on the soil reflectance curve (Xiao et al., 2006; Ngandam et al., 2016). The Normalized Difference Impervious Surface Index (NDISI) allows identifying impervious surfaces by suppressing background noise, such as sand, soil and water, delineating the distribution of impervious surfaces and delimiting their actual surface area. (Xu, 2010; Sun et al., 2017). Finally, the Salinity Index (SI) is based on the fact that the salt-affected soils had relatively higher reflectance compared with other land use (Abbas and Khan, 2007).
The literature reports the use of spectral indices to study soil degradation, studying its components individually. The objective of this work is to study the possibilities of applying five spectral indices (NDVI, BSI, GSI, NDISI and SI indices) in a semi-arid region of the Ecuadorian Andes for the study of soil degradation, considering four factors related to soil erosion, desertification, salinity and impermeability, combining the spectral indices in order to obtain an integral vision of the phenomenon of soil degradation, and validating the results obtained through field observations and samples processed in the laboratory.
2 Materials and methods
2.1 Study area
Two test sites were selected, both located in the province of Loja, Ecuador, near the border between Ecuador and Peru.
Test Site 1 (7181.955 ha) is in the Catamayo Valley between coordinates 79.402ºW, 3.989ºS and 79.320ºW, 4.062ºS. It has a hot and dry climate with annual rainfall that fluctuates between 500 and 700 mm and an average temperature of 21°C. It has areas with bushes, native forest, and sugarcane crops, which are the main economic activity of the canton. The soils are Aridic Lithic Ustorthents, Fluventic Haplustepts, Haplic Ustarents, Lithic Torriorthents, Typic Dystrudepts, Typic Haplocambids, Typic Haplustalfs, Typic Ustifluvents, Typic Ustipsamments and Typic Ustorthents (SNI, 2023). The natural vegetation of Catamayo Valley is part of the Andean dry forest and is considered one of the most important centers of endemism in the Northern Andes. In addition, Test Site 1 includes part of the city of Catamayo, which has a population of 35,000 inhabitants and large agricultural areas of sugar cane; this, in combination with its hot-dry climate, makes it an interesting case study of soil degradation, since several factors that influence soil degradation can be studied in a single place.
Test Site 2 (7208.955 ha) is in the Zapotillo canton between coordinates 80.386ºW, 4.391ºS and 80.304ºW, 4.463ºS. It has an average rainfall of 500 mm per year with an average annual temperature of 24°C and has areas of dry forest, pasture, and irrigated crops (Oñate-Valdivieso and Bosque, 2014). The soils are Aridic Ustifluvents, Lithic Torriorthents, Torrifluventic Haplustepts, Typic Torriorthents (SNI, 2023). At the two test sites, precipitation varies throughout the year with two seasons: a rainy season between December and May and a dry season between June and November. Precipitation intensities can be considered high at the two test sites since for a return period of 2 years and duration of 30 min, the intensity reaches maximum values of 37.96 mm/h at Test Site 1 and 61.89 mm/h at Test Site 2. (Oñate-Valdivieso et al., 2020). Zapotillo has several interesting characteristics for the study of soil degradation since it has a semi-arid climate and is geographically located near the Sechura desert in northern Peru, so the advance of desertification has a high influence on the test site 2. The location of the test sites is presented in Figure 1.
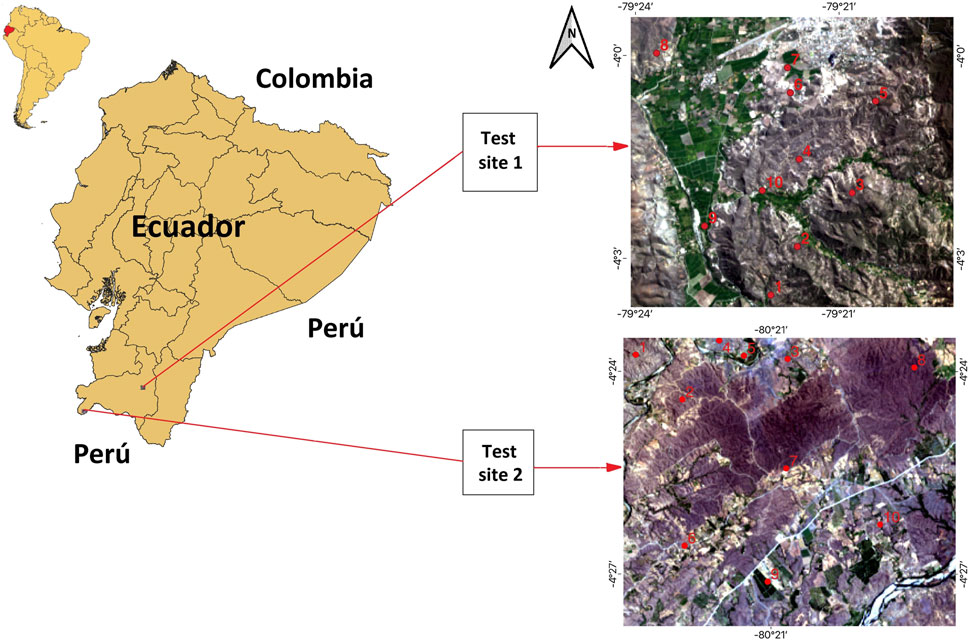
FIGURE 1. Location of study areas.
2.2 Data collection
A Landsat 8 Operational Land Imager (OLI)-Thermal Infrared Sensor (TIRS) dataset was collected in the study area. The acquisition dates, spectral bands, and spatial resolutions are summarized in Table 1. Atmospheric correction was performed on each image using the Atmospheric/Topographic Correction for Mountainous Terrain (ATCOR) software developed by the German Aerospace Center, Wessling, Germany (Richter et al., 2015). The Landsat images archived in the U.S. Geological Survey (USGS, 2021) data clearinghouse have been georeferenced (USGS, 2022).
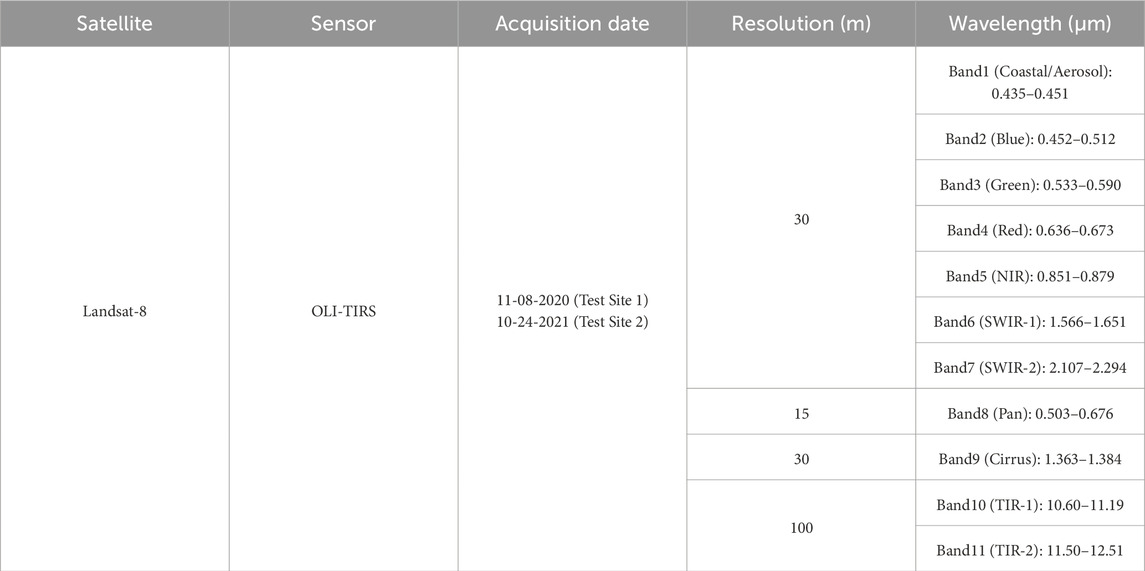
TABLE 1. Satellite images from the Landsat OLI-TIRS sensor used in this study.
2.3 Field work and laboratory analysis
The field survey was conducted from August 16th to 20 August 2022. Ten sampling points were selected randomly in each of the test sites, and in situ measurements were taken, including infiltration, vegetation cover, and topsoil sampling. At each sample site, two to three duplicate points were measured and averaged for analysis. Infiltration was measured using a minidisk infiltrometer (METER Group, Inc. United States) (Báťková et al., 2022). Vegetation cover was coarsely estimated by experience using a tape measure, and the type of existing vegetation was also recorded. Simultaneously, soil samples from the top 1–2 cm were randomly collected from four holes of 20 cm by 20 cm from each observation point and mixed for laboratory salinity and grain size analysis. A portable GPS was used to record the geo-positions of each sampling site.
Soil salinity was measured in the laboratory as electrical conductivity (EC) of a 1:5 soil: distilled water suspension, following 1 h of end-over-end mixing, applying the procedure described by (Hardie et al., 2012) Grain size distribution/composition analyses of topsoil samples were carried out using Bouyoucos method in the laboratory (Mwendwa, 2022). Each topsoil sample was divided into three classes: clay (<0.002 mm), silt (0.002–0.05 mm), and sand (0.05–2 mm), obtaining the textural classes of each sample.
2.4 Spectral indices
Five spectral indices were applied to study four factors with a high influence on soil degradation: cover loss, surface sealing, salinity, and surface texture change.
2.4.1 Normalized difference vegetation index (NDVI)
The NDVI index uses reflected light in the visible and near-infrared bands to detect and quantify the presence of live green plants. Simply put, NDVI is a metric that measures the greenness and health of vegetation in each pixel in a satellite image. The NDVI value varies from +1 to −1. Positive values help to distinguish between vegetated and non-vegetated areas, whereas negative values suggest non-vegetated areas (Zhou et al., 2019; Kumar et al., 2022). The NDVI is computed using:
where R and NIR stand for the spectral reflectance measurements acquired in the red (visible) and near-infrared regions, respectively.
2.4.2 Bare soil index (BSI)
The Bare Soil Index (BSI) (Chen et al., 2004; Nguyen, et al., 2021) is a quantitative indicator that allows observation of changes in areas with bare soil or little vegetation, which are vulnerable to water and wind erosion, resulting in the loss of soil. Low BSI values are present in soils with vegetation or water, while high values indicate bare soil. The BSI is determined by applying the following equation:
where BSI is the bare soil index, SWIR1 shortwave infrared band 5 (Landsat TM/ETM) and band 6 (Landsat 8), R is the reflectivity in the red band, NIR is the near-infrared, and B is the reflectivity in the blue band.
2.4.3 Grain size index (GSI)
The texture of topsoil is closely related to land degradation. The sand content in severely eroded farmland is significantly higher than in good soil, so surface soil particle size can be used as an indicator of soil degradation. The Grain Size Index (GSI) (Xiao et al., 2006) can detect the abundance of fine sand areas well and shows potential for monitoring the desertification process in arid regions.
Where R, B, and G are the reflectance of the red, blue, and green bands of the Landsat 8 OLI-TIRS sensors.
The GSI value is close to 0 in vegetated and water areas, and sometimes it can even be negative. High GSI values are associated with ground surfaces fully covered by fine sand (Xiao et al., 2006).
2.4.4 Normalized difference impervious surface index (NDISI)
Soil impermeabilization has a direct impact on the hydrological cycle of a watershed because it reduces infiltration and evapotranspiration rates, decreases the hydrological response time of a watershed, and makes it sensitive to extreme precipitation events. On the other hand, impermeabilized soils lose all their capacity as a fundamental element of the ecosystem of which they are a part. The Normalized Difference Impervious Surface Index (NDISI) (Xu, 2010; Hamunyela et al., 2016) is used to enhance impervious surfaces and suppress land covers such as soil, sand, and water bodies.
Tb refers to the brightness temperature of the TIRS1 thermal band. MNDWI represents the Modified Normalized Difference Water Index (Eq. (5)), NIR refers to the pixel values extracted from the near-infrared band, and SWIR1 refers to the pixel values extracted from the first shortwave infrared band.
G represents the pixel values extracted from the green band.
2.4.5 Salinity index (SI)
Soil salinity is a prevalent environmental hazard in arid and semiarid regions around the world. Soil salinity adversely affects plant growth, crop production, soil and water quality, and eventually results in soil erosion and land degradation. To highlight the saline zones and suppress those with vigorous vegetation, the salinity index was proposed (Abbas and Khan, 2007; Allbed and Kumar, 2013).
Where: SI is the salinity index, B is the reflectivity in the blue band, and R is the reflectivity in the red band.
Eqs 1–6 were applied to generate images for each index based on the collected data (Table 1). The NDVI was reclassified into five categories to differentiate existing covers and their vegetative state. A manually adjusted threshold was used to extract critical areas for the BSI, GSI, NDISI, and SI images. Pixels with values greater than the threshold were considered critical areas and assigned a value of 1, while pixels with values equal to or less than the threshold were considered non-critical areas and assigned a value of 0. The resulting image is a binary image that only displays the extracted critical areas.
3 Results
Table 2 present the data collected at Test Site 1. It can be observed that the texture is variable, with soils ranging from sandy clay loam, sandy loam, clay loam, clay, and loam, with sand content varying between 35.0% and 75.6%, and significant amounts of silt (between 17% and 37.2%) and clay (7.2% and 41.3%). The permeability of these soils’ ranges from 0.05 cm/h (very slow) to 2.5 cm/h (moderately slow). The salinity analysis shows electrical conductivities less than 2 dS/m in all cases, which corresponds to non-saline soils. The observed vegetation is mainly composed of natural dry deciduous forest, shrubs, sugarcane crops, grasslands, and heavily eroded areas. The estimated coverage percentage ranges from 20% in eroded areas to 97% in sugarcane crops. Table 3 shows the values obtained for the different spectral indices at Test Site 1, where the BSI values fluctuate between −0.0747 and 0.0459. The SI values fluctuate between −0.0359 and 0.0182. The NDISI presents values that fluctuate between 0.4944 and 0.6034. Finally, the GSI presents values that fluctuate between −0.0118 and 0.0243.
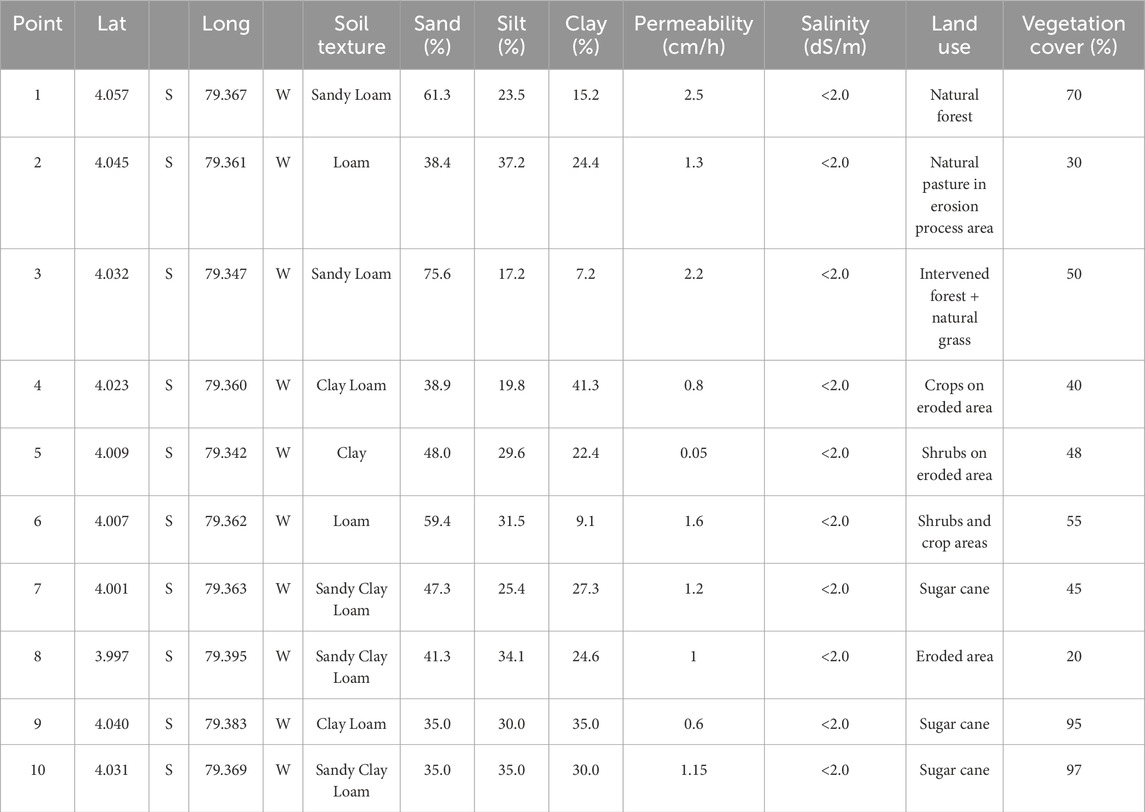
TABLE 2. Values obtained in Test Site 1.
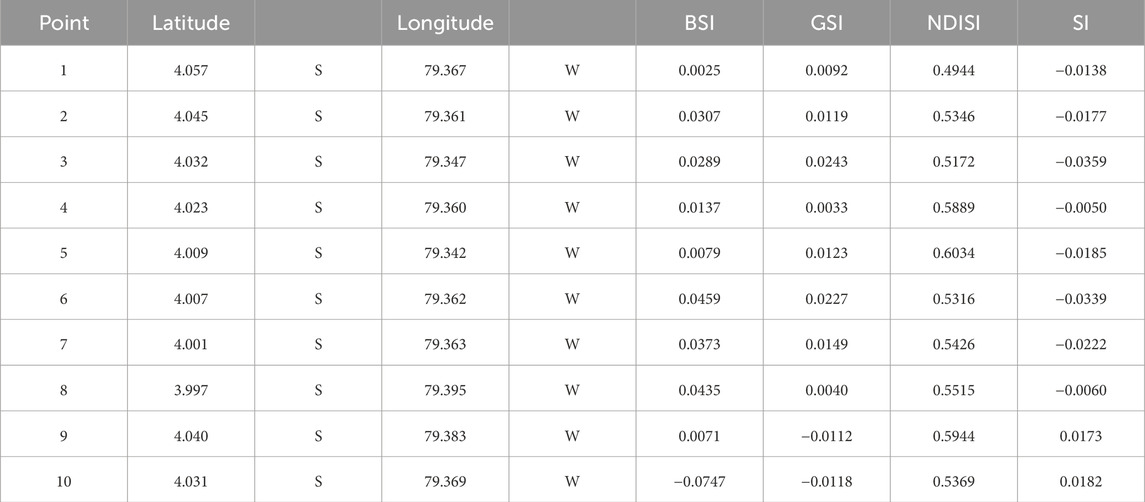
TABLE 3. Values of the spectral indices at Test Site 1.
Table 4 show the data collected at Test Site 2. The soil texture is variable, with sandy loam, sandy clay, and loam having sand percentages ranging between 38.9% and 78.3%, silt percentages between 12.4% and 32.0%, and clay between 5.3% and 41.3%. The permeability of the soils ranges from 0.9 cm/h (moderately slow) to 2.6 cm/h (moderate). The salinity analysis shows in all cases electrical conductivities of less than 2 dS/m, corresponding to non-saline soils. The vegetation corresponds mostly to natural deciduous forest, dry scrub, fallow, and crop areas, the percentage of ground cover at the sampling points ranges between 38% and 83%. Table 5 shows the values obtained for the different spectral indices at Test Site 2. The BSI values fluctuate between −0.17367 and 0.07467. The SI values fluctuated between −0.04127 and 0.07216. The NDISI presents values that fluctuate between 0.43993 and 0.5678. Finally, the GSI presents values that fluctuate between −0.0462 and 0.0278.
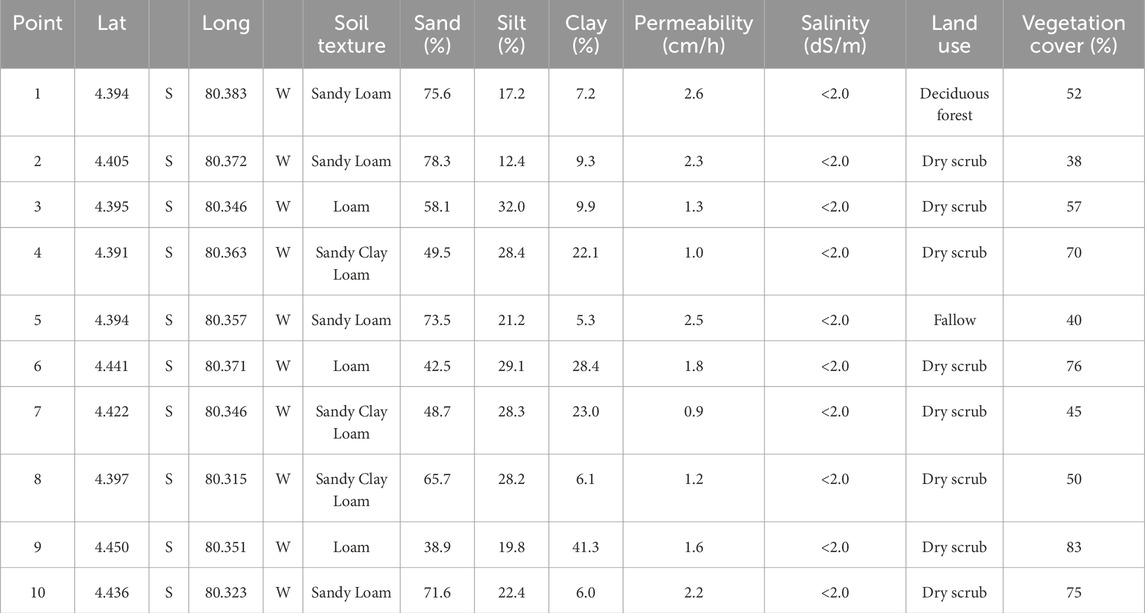
TABLE 4. Values obtained at Test Site 2.
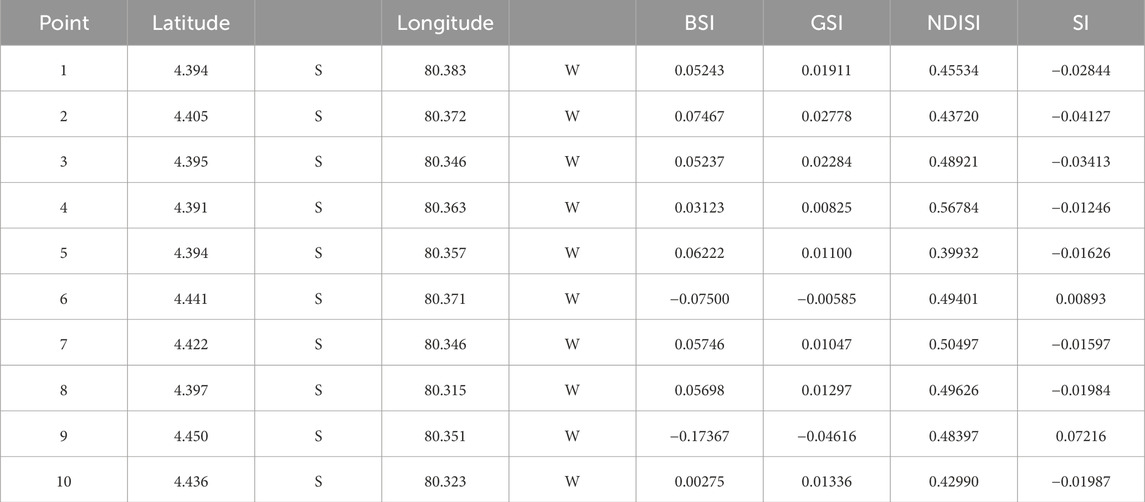
TABLE 5. Values of the spectral indices at Test Site 2.
4 Discussion
In both study sites, BSI and GSI values were lower than those reported in the literature (Xiao et al., 2006; Zhou et al., 2019; Mzid et al., 2021). The differences can be attributed to the conditions of the surfaces analyzed, since vegetation is present at both sites, although with low levels of cover; and the surface soils are of the loam and clay type without a marked predominance of sand. Since the percentages of sand were lower than those reported, the GSI presented lower values. On the other hand, the SI and NDISI values are like those reported (Xu, 2010; Hamunyela et al., 2016; Golabkesh et al., 2021). Although the soil salinity conditions are in the lower part of the ranges presented in the literature, the conditions of imperviousness are considered similar.
Figure 2 shows the degree of correlation between the calculated indexes and the parameters obtained in the field and laboratory. When relating permeability with NDISI, significant correlation values of the order of 0.8809 (Test Site 1) and 0.7925 (Test Site 2) were obtained, which shows an inversely proportional correlation. Similarly, the percentage of sand on the soil surface has a direct relationship with the GSI, reaching determination coefficients of the order of 0.6781 (Test Site 1) and 0.5278 (Test Site 2), considered moderate. Finally, the percentage of ground cover has an inverse relationship with the BSI, reaching moderate determination coefficient values of the order of 0.5384 (Test Site 1) and 0.6751 (Test Site 2). In the case of the SI it was not possible to perform any correlation analysis since the laboratory results showed very low conductivities corresponding to non-saline soils. If the values of the correlation coefficients obtained for all the variables are averaged, a value of 0.6991 is obtained for Test Site 1, and 0.6651 is obtained for Test Site 2. On average, these values indicate an acceptable correlation between the spectral indices and the data obtained in the field.
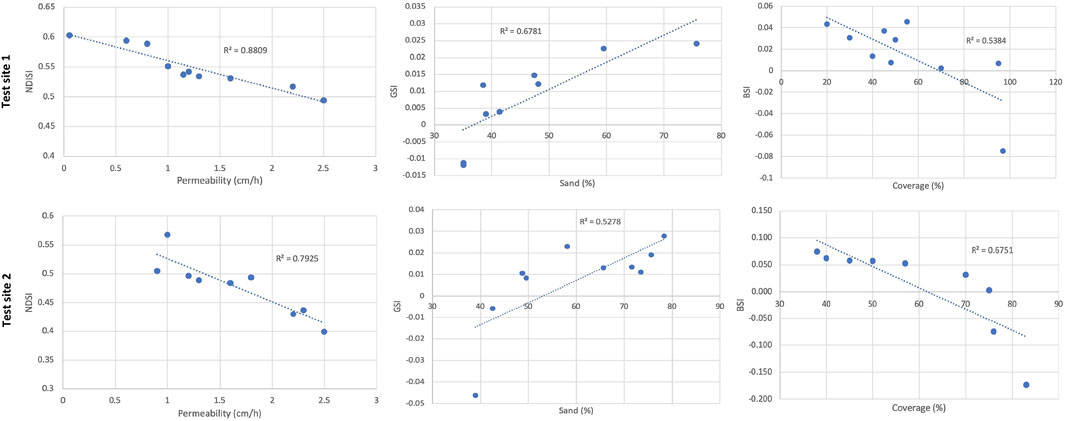
FIGURE 2. Correlation between the indices applied and the values obtained in the field and labor-atory
The areas with the highest degree of soil degradation due to erosion, desertification, salinity, and soil imperviousness were identified by manually adjusting thresholds for each calculated index. The adopted thresholds and the corresponding areas with values above the thresholds for NDISI, GSI, BSI, and SI are presented in Table 6. Figures 3, 4 showing for Test Site 1 and Test Site 2: (a) Natural color composition, (b) spatial variation of each of the calculated indices and (c) areas with values above the adopted thresholds.
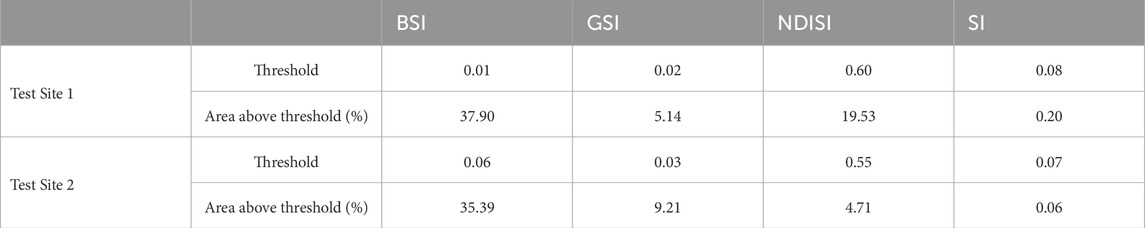
TABLE 6. Thresholds adopted for each index and corresponding areas with values exceeding the thresholds.
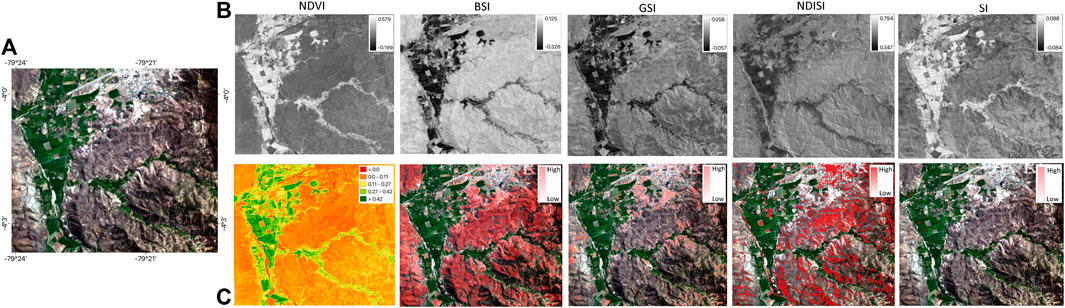
FIGURE 3. Spectral indices calculated for Test Site 1. (A) Natural color composition, (B) spatial variation of each of the calculated indices and (C) areas with values above the adopted thresholds.
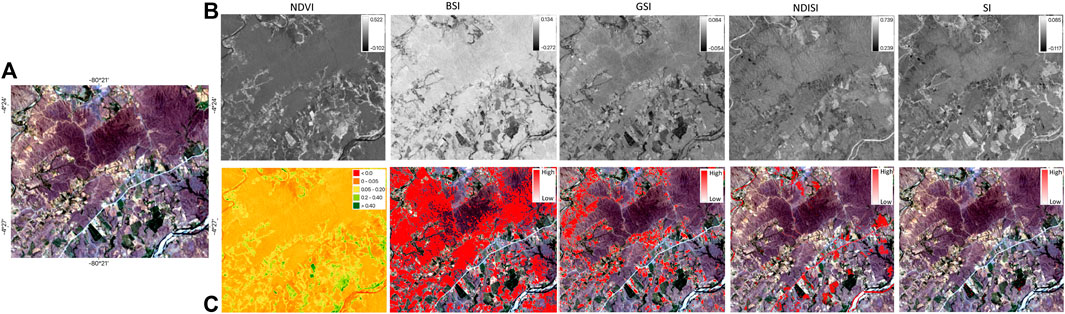
FIGURE 4. Spectral indices calculated for Test Site 2. (A) Natural color composition, (B) spatial variation of each of the calculated indices and (C) areas with values above the adopted thresholds.
When observing the NDVI values included in Figure 3, a marked difference can be seen between the areas destined for sugarcane crops (NDVI >0.27) and the areas in which deciduous forests, shrubs, and bare soil predominate.
By defining a threshold for the BSI of 0.01 (Table 6), an area equivalent to 37.90% is obtained that exceeds said threshold (Figure 3), which would be occupied by little or no vegetation cover. This result is similar to that obtained by NDVI and the observations in the field that allowed us to verify that the cultivation areas were surrounded by wide spaces with low levels of vegetation cover.
In the case of the GSI, the adopted threshold is 0.02, which allows for the identification of 5.14% of the surface with the highest concentration of sand in the upper layer of the soil (Figure 3). The greatest presence of sand on the surface was observed in areas that were subjected to water erosion, resulting in a significant removal of fine particles. This area is relatively small and corresponds to sectors with low vegetation cover that were previously identified by NDVI and BSI.
To analyse the NDISI, a threshold of 0.60 was established (Table 6), which allows the identification of impervious zones in the study area, equivalent to 19.53% of the total area (Figure 3B). Most of the impervious zones are located (a) in the upper part of the mountainous areas, where there are clayey soils and shallow, (b) in some of the agricultural plots that were possibly made impermeable due to mechanical action during harvest tasks, and (c) in the city of Catamayo, located to the north of Test Site 1. It should also be noted that the areas identified as having a high percentage of sand on the surface do not overlap with the impervious areas determined using NDISI.
On the other hand, since no saline soils have been identified in the sampling points of Test Site 1, the application of SI is done to evaluate in a very preliminary way its potential application. By establishing the threshold of 0.08 (Table 6), soils that could become saline can be identified, and these would occupy 0.20% of the entire surface. In Figure 3, potentially saline soils are found in agricultural areas, observed in the plots that have been harvested. If salinity comes from agricultural tasks, in the case of saline soils, the application of IS could be efficient.
The NDVI values determined for Test Site 2 (Figure 4) reveal that most of the study area is covered by dry deciduous forest and shrubs (NDVI <0.2), which is part of the equatorial dry forest. This forest type is known to lose its leaves during the dry season. Additionally, small portions of the area are allocated for crop cultivation (NDVI >0.2) areas without coverage and riverbeds (NDVI> 0) are also observed.
By adopting a threshold of 0.06 for the BSI (Table 6), it identifies an area equivalent to 35.39% of the total area, which would have little or no vegetation cover. The areas with high BSI values correspond to the areas with minimal vegetation cover identified by NDVI, and they are part of the equatorial dry forest.
Using a threshold of 0.03 for the GSI (refer to Table 6), it delimits an area equivalent to 9.21% with higher concentrations of fine sand on the surface soil. The highest concentrations of GSI (shown in Figure 4) are found in relatively flat areas at the foot of the small elevations within Test Site 2, which may be due to the deposit of material caused by wind and water erosion. The areas with high GSI values correspond to areas with little vegetation cover identified by the NDVI and BSI.
The impervious zones occupy a surface area of 4.71% (Figure 4) of Test Site 2, considering a threshold for the NDISI of 0.55 (Table 6), and correspond to shallow loam, sandy clay, or sandy loam soils that are possibly compacted by grazing activities of goats. Additionally, several dirt roads that are compacted by the flow of vehicles or paved roads are also identified. As observed in Test Site 1, the areas identified as having a higher percentage of sand on the surface do not overlap with the impervious areas determined with the NDISI.
At test site 2, no saline soils were identified at the sampling points. Thus, the SI results were used to evaluate their application very preliminarily. By setting a threshold of 0.07 (Table 6), the soils which could become saline can be identified, which would occupy 0.06% of the entire surface. Figure 4 shows that these potentially saline soils are found in agricultural areas, particularly in plots that have already been harvested. Since salinity comes from agricultural activities, The application of SI could be useful in soils with significant salt concentrations.
The applied indices realistically reflect the situation of the study area. The NDVI satisfactorily characterizes the vegetation, which corresponds to the equatorial dry forest and dry shrubs, while keeping correspondence with the BSI. The GSI successfully identifies areas with a higher presence of sand on the surface, which also correspond to the BSI and the NDVI. The NDISI efficiently identifies the existing urban area in Test Site 1, road axes in Test Site 2, and areas with better impermeability conditions. Although no saline soils were identified in the study area, the SI presented higher values in agricultural areas, where salinity can become a serious soil degradation problem. The five indices analysed complement each other and offer useful information to understand the state of the soil and its possible degradation. Applying them periodically could become a valuable means of monitoring soil degradation in Andean basins.
Among the five factors related to soil degradation in the study area, the lack of vegetation cover has the most significant impact, affecting 35% of the studied area. Although there are no areas without coverage, the equatorial dry forest is a delicate ecosystem that human activities can further reduce, making the soil vulnerable to erosion due to the loss of vegetation, pronounced relief, and significant seasonal rainfall. The presence of sand, related to desertification processes, is relatively low, with no sandstorms in the study area, but erosion processes are appreciable. Soil impermeabilization occurs in almost 20% of Test Site 1, with higher clay content, agricultural areas, parturition areas, shallow soils, urban areas, and road axes being affected. The growth of the city of Catamayo in Test Site 1 could increase the area of impervious surfaces, and its impact in the medium and long term should be evaluated. Salinity has the least impact in the study area, with large areas of sugar cane cultivation in Test Site 1 properly managed to reduce salinity presence, and the effects of possible salinization are low in Test Site 2, where areas dedicated to crops are relatively small.
5 Conclusion
Five spectral indices were applied to study of soil degradation in an Andean semi-arid zone. The values obtained through the indices were correlated with observations made in the field and laboratory to assess their application capabilities.
The calculated indices efficiently reflected the conditions of the study area. The NDVI adequately discriminated the different existing coverages, while the BSI allowed the identification of areas with little or no vegetation, corresponding with what was shown by the NDVI. The GSI successfully identified the areas with higher presence of sand, correlating with the orography of the study area. The NDISI efficiently discriminated impervious zones originating from urbanization, road axes, mechanical and animal com-paction. Even though saline soils were not identified at the sampling points, the SI allowed the identification of small sectors in the cultivation areas that could present this type of degradation.
The combination of the five examined indices provided useful information to understand the current state of the soils and their potential deterioration. If used regularly, these indices could become a valuable tool for monitoring land degradation in the Andean basins.
The greatest threat in the study area is the loss of vegetation cover, which is part of a fragile ecosystem such as the equatorial dry forest. Human actions can considerably affect it. Erosion is observed in the study area caused by the lack of cover, pronounced relief, and considerable seasonal rainfall. The impermeabilization of soils is significant, with urban growth, the increase in agricultural activities, and intensive grazing being factors that could increase its incidence. The presence of sand, as an indication of desertification, is not significant in the study area. Salinity also has the lowest incidence among the studied factors.
In areas subject to degradation, it is necessary to implement mitigation measures that are adjusted to the conditions specific to each one of them, and sustainable soil management practices can be implemented, such as crop rotation and agroforestry, the promotion of sustainable agricultural practices that avoid overexploitation of the soil, encouraging direct sowing to avoid soil compaction, as well as the controlled and efficient use of fertilizers, implementing reforestation and habitat restoration programs to recover the vegetation cover, and controlling the disorderly growth of urban areas, all of this supported by extensive environmental education campaigns.
In future studies, the temporal variation of soil degradation could be analysed and evaluated using spectral indices. It is also recommended to consider larger areas with greater variability in their characteristics.
Data availability statement
The original contributions presented in the study are included in the article/Supplementary material, further inquiries can be directed to the corresponding author.
Author contributions
FO-V: Conceptualization, Formal Analysis, Methodology, Project administration, Validation, Writing–original draft, Writing–review and editing. AO-P: Formal Analysis, Methodology, Resources, Validation, Writing–original draft. RD: Formal Analysis, Resources, Visualization, Writing–original draft.
Funding
The author(s) declare that no financial support was received for the research, authorship, and/or publication of this article.
Conflict of interest
The authors declare that the research was conducted in the absence of any commercial or financial relationships that could be construed as a potential conflict of interest.
Publisher’s note
All claims expressed in this article are solely those of the authors and do not necessarily represent those of their affiliated organizations, or those of the publisher, the editors and the reviewers. Any product that may be evaluated in this article, or claim that may be made by its manufacturer, is not guaranteed or endorsed by the publisher.
References
Abbas, A., and Khan, S. (2007). “Using remote sensing techniques for appraisal of irrigated soil salinity,” in Proceedings of the international congress on modelling and simulation (MODSIM). Editors L. Oxley, and D. Kulasiri (Christchurch, New Zealand: Modelling and Simulation Society of Australia and New Zealand), 2632–2638.
Allbed, A., and Kumar, L. (2013). Soil salinity mapping and monitoring in arid and semi-arid regions using remote sensing Technology: a review. Adv. Remote. Sens. 2, 373–385. doi:10.4236/ars.2013.24040
Asfaw, E., Suryabhagavan, K., and Argaw, M. (2018). Soil salinity modeling and mapping using remote sensing and GIS: the case of Wonji sugar cane irrigation farm, Ethiopia. J. Saudi Soc. Agric. 17, 250–258. doi:10.1016/j.jssas.2016.05.003
Báťková, K., Miháliková, M., and Matula, S. (2022). Hydraulic properties of a cultivated soil in temperate continental climate determined by mini disk infiltrometer. Water 12 (3), 843. doi:10.3390/w12030843
Borrelli, P., Van Oost, K., Meusburger, K., Alewell, C., Lugato, E., and Panagos, P. (2018). A step towards a holistic assessment of soil degradation in Europe: coupling on-site erosion with sediment transfer and carbon fluxes. Environ. Res. 161, 291–298. doi:10.1016/j.envres.2017.11.009
Briassoulis, H. (2019). Combating land degradation and desertification: the land-use planning quandary. Land 8 (2), 27. doi:10.3390/land8020027
Chai, B., and Li, P. (2018). Annual urban expansion extraction and spatio-temporal analysis using landsat time series data: a case study of tianjin, China. IEEE J. Sel. Top. Appl. Earth Obs. Remote Sens. 11, 2644–2656. doi:10.1109/jstars.2018.2829525
Chen, S., and Rao, P. (2008). Land degradation monitoring using multi-temporal Landsat TM/ETM data in a transition zone between grassland and cropland of northeast China. Int. J. Remote Sens. 29 (7), 2055–2073. doi:10.1080/01431160701355280
Chen, W., Liu, L., Zhang, C., Wang, J., Wang, J., and Pan, Y. (2004). Monitoring the seasonal bare soil areas in Beijing using multi-temporal TM images. Int. Geosci. Remote Sens. Symp. 5, 3379–3382. doi:10.1109/IGARSS.2004.1370429
Dou, P., and Chen, Y. (2017). Dynamic monitoring of land-use/land-cover change and urban expansion in shenzhen using landsat imagery from 1988 to 2015. Int. J. Remote Sens. 38, 5388–5407. doi:10.1080/01431161.2017.1339926
Dubovyk, O. (2017). The role of Remote Sensing in land degradation assessments: opportunities and challenges. Eur. J. Remote Sens. 50 (1), 601–613. doi:10.1080/22797254.2017.1378926
Fiorillo, E., Maselli, F., Tarchiani, V., and Vignaroli, P. (2017). Analysis of land degradation processes on a tiger bush plateau in South West Niger using MODIS and LANDSAT TM/ETM+ data. Int. J. Appl. Earth Obs. Geoinf. 62, 56–68. doi:10.1016/j.jag.2017.05.010
Gallo, B. C., Magalhães, P. S. G., Demattê, J. A. M., Cervi, W. R., Carvalho, J. L. N., Barbosa, L. C., et al. (2023). Soil erosion satellite-based estimation in cropland for soil conservation. Remote Sens. 15, 20. doi:10.3390/rs15010020
Golabkesh, F., Ghanavati, N., Nazarpour, A., and Nejad, T. B. (2021). Monitoring soil salinity changes, comparison of different maps and indices extracted from landsat satellite images (case study: atabieh, khuzestan). Pol. J. Environ. Stud. 30 (2), 1139–1154. doi:10.15244/pjoes/123503
Hamunyela, E., Verbesselt, J., and Herold, M. (2016). Using spatial context to improve early detection of deforestation from Landsat time series. Remote Sens. Environ. 172, 126–138. doi:10.1016/j.rse.2015.11.006
Hardie, M., and Doyle, R. (2012). “Measuring soil salinity – chapter 28,” in Plant salt tolerance: methods and protocols. Editors S. Shabala, and T. A. Cuin (Clifton, NJ, USA.: Springer Science), 415–425.
Hislop, S., Jones, S., Soto-Berelov, M., Skidmore, A., Haywood, A., and Nguyen, T. H. (2018). Using Landsat spectral indices in time-series to assess wildfire disturbance and recovery. Remote Sens. 10, 460. doi:10.3390/rs10030460
Hussain, S., Lu, L., Mubeen, M., Nasim, W., Karuppannan, S., Fahad, S., et al. (2022). Spatiotemporal variation in land use land cover in the response to local climate change using multispectral remote sensing data. Land 11, 595. doi:10.3390/land11050595
Hussain, S., Raza, A., Abdo, H. G., Mubeen, M., Tariq, A., Nasim, W., et al. (2023). Relation of land surface temperature with different vegetation indices using multi-temporal remote sensing data in Sahiwal region, Pakistan. Pak. Geosci. Lett. 10, 33. doi:10.1186/s40562-023-00287-6
International Convention to Combat Desertification (ICCD), (1994). International convention to combat desertification at united nations general assembly. New York, NY, USA: UNCCD.
Kumar, B. P., Raghu Babu, K., Anusha, B. N., and Rajasekhar, M. (2022). Geo-environmental monitoring and assessment of land degradation and desertification in the semi-arid regions using Landsat 8 OLI/TIRS, LST, and NDVI approach. Environ. Challeng. 8, 100578. doi:10.1016/j.envc.2022.100578
Li, Y., Mo, Y., Are, K. S., Huang, Z., Guo, H., Tang, C., et al. (2021). Sugarcane planting patterns control ephemeral gully erosion and associated nutrient losses: evidence from hillslope observation. Ecosyst. Environ. 309, 107289. doi:10.1016/j.agee.2020.107289
Lyu, Y., Shi, P., Han, G., Liu, P., Guo, L., Hu, X., et al. (2020). Desertification control practices in China. Sustainability 12, 3258. doi:10.3390/su12083258
Martíni, A. F., Valani, G. P., da Silva, L. F., Bolonhezi, D., Di Prima, S., and Cooper, M. (2021). Long-term trial of tillage systems for sugarcane: effect on topsoil hydrophysical attributes. Sustain 13 (6), 3448. doi:10.3390/su13063448
Meddens, A. J. H., Kolden, C. A., and Lutz, J. A. (2016). Detecting unburned areas within wildfire perimeters using Landsat and ancillary data across the northwestern United States. Remote Sens. Environ. 186, 275–285. doi:10.1016/j.rse.2016.08.023
Mera-Parra, C., Oñate-Valdivieso, F., Massa-Sánchez, P., and Ochoa-Cueva, P. (2021). Establishment of the baseline for the IWRM in the Ecuadorian andean basins: land use change, water recharge, meteorological forecast and hydrological modeling. Land 10 (5), 513. doi:10.3390/land10050513
Mo, Y., Kearney, M. S., and Turner, R. E. (2019). Feedback of coastal marshes to climate change: long-term phenological shifts. Ecol. Evol. 9, 6785–6797. doi:10.1002/ece3.5215
Mwendwa, S. (2022). Revisiting soil texture analysis: practices towards a more accurate Bouyoucos method. Heliyon 8 (5), e09395. doi:10.1016/j.heliyon.2022.e09395
Mzid, N., Pignatti, S., Huang, W., and Casa, R. (2021). An analysis of bare soil occurrence in arable croplands for remote sensing topsoil applications. Remote Sens. 13, 474. doi:10.3390/rs13030474
Nawaz, M., Bourrié, G., and Trolard, F. (2013). Soil compaction impact and modelling. A review. A Rev. Agron. sustain. Dev. 33, 291–309. doi:10.1007/s13593-011-0071-8
Ngandam, M., Etouna, J., Nongsi, B., Mvogo, F., and Noulaquape, F. (2016). Assessment of land degradation status and its impact in arid and semi-arid areas by correlating spectral and principal component analysis neo-bands. Int. J. Adv. Remote Eens. GIS 5 (1), 1539–1560. doi:10.23953/cloud.ijarsg.77
Nguyen, C. T., Chidthaisong, A., Kieu Diem, P., and Huo, L.-Z. A. (2021). A modified bare soil index to identify bare land features during agricultural fallow-period in southeast asia using landsat 8. Land 10, 231. doi:10.3390/land10030231
Oñate-Valdivieso, F., Oñate-Paladines, A., and Collaguazo, M. (2022). Spatiotemporal dynamics of soil impermeability and its impact on the hydrology of an urban basin. Land 11, 250. doi:10.3390/land11020250
Oñate-Valdivieso, F., Oñate-Paladines, A., and Núñez, D. (2022b). Evaluation of satellite images and products for the estimation of regional reference crop evapotranspiration in a valley of the Ecuadorian Andes. Remote Sens. 14 (18), 4630. doi:10.3390/rs14184630
Oñate-Valdivieso, F., and Sendra, J. B. (2014). Semidistributed hydrological model with scarce information: application to a large south american binational basin. J. Hydrol. Eng. 19 (5), 1006–1014. doi:10.1061/(asce)he.1943-5584.0000853
Oñate-Valdivieso, F., Uchuari, V., and Oñate-Paladines, A. (2020). Large-scale climate variability patterns and drought: a case of study in south – America. Water Resour. Manag. 34, 2061–2079. doi:10.1007/s11269-020-02549-w
Ponce, V. M., Onate-Valdivieso, F., and Cobos-Aguilar, R. (2018). The right of nature to dispose of its salts. TyCA 9 (3), 1–28. doi:10.24850/j-tyca-2018-03-01
Richter, R., and Schlapfer, D. (2015). Atmospheric/topographic correction for satellite imagery: ATCOR-2/3 user guide, DLR-IB 565-01/15. Wessling, Germany: German Aerospace Center.
Rodríguez, V., Ruíz, J., and PadillaSilva, J. M. (2016). Spatial mapping of soil salinity through remote sensing. Case study North. Tamaulipas. Remesca 13, 2577–2587.
Rukhovich, D. I., Koroleva, P. V., Rukhovich, A. D., and Komissarov, M. A. (2023). Informativeness of the long-term average spectral characteristics of the bare soil surface for the detection of soil cover degradation with the neural network filtering of remote sensing data. Remote Sens. 15, 124. doi:10.3390/rs15010124
Schultz, M., Clevers, J. G. P. W., Carter, S., Verbesselt, J., Avitabile, V., Quang, H. V., et al. (2016). Performance of vegetation indices from Landsat time series in deforestation monitoring. Int. J. Appl. Earth Obs. Geoinf. 52, 318–327. doi:10.1016/j.jag.2016.06.020
Servicio Nacional de Información (SNI) (2023). Coberturas. Available online: https://sni.gob.ec/coberturas (accessed on May 15, 2023).
Souza, C. M., Siqueira, J. V., Sales, M. H., Fonseca, A. V., Ribeiro, J. G., Numata, I., et al. (2013). Ten-year Landsat classification of deforestation and forest degradation in the brazilian amazon. Remote Sens. 5, 5493–5513. doi:10.3390/rs5115493
Sun, Z., Wang, C., Guo, H., and Shang, R. A. (2017). A modified normalized difference impervious surface index (MNDISI) for automatic urban mapping from landsat imagery. Remote Sens. 9, 942. doi:10.3390/rs9090942
U.S. Geological Survey (USGS) (2021). Landsat 8 (L8) data users handbook. Available online: https://landsat.usgs.gov/landsat-8-l8-data-users-handbook (accessed on November 18, 2021).
U.S. Geological Survey (USGS) (2022). Earthexplorer. Available online: https://earthexplorer.usgs.gov (accessed on November 10, 2022).
Wulder, M. A., Loveland, T. R., Roy, D. P., Crawford, C. J., Masek, J. G., Woodcock, C. E., et al. (2019). Current status of Landsat program, science, and applications. Remote Sens. Environ. 225, 127–147. doi:10.1016/j.rse.2019.02.015
Xiao, J., Shen, Y., Tateishi, R., and Bayaer, W. (2006). Development of topsoil grain size index for monitoring desertification in arid land using remote sensing. Int. J. Remote Sens. 27 (12), 2411–2422. doi:10.1080/01431160600554363
Xu, H. (2010). Analysis of impervious surface and its impact on urban heat environment using the Normalized Difference Impervious Surface Index (NDISI). Photogramm. Eng. Remote Sens. 76, 557–565. doi:10.14358/pers.76.5.557
Zhang, M., Viscarra Rossel, R. A., Zhu, Q., Leys, J., Gray, J. M., Yu, Q., et al. (2022). Dynamic modelling of water and wind erosion in Australia over the past two decades. Remote Sens. 14, 5437. doi:10.3390/rs14215437
Zhang, Y., Shen, W., Li, M., and Lv, Y. (2020). Assessing spatio-temporal changes in forest cover and fragmentation under urban expansion in Nanjing, eastern China, from long-term Landsat observations (1987–2017). Appl. Geogr. 117, 102190. doi:10.1016/j.apgeog.2020.102190
Zhou, D., Xiao, J., Bonafoni, S., Berger, C., Deilami, C., Zhou, Y., et al. (2019). Satellite remote sensing of surface urban heat islands: progress, challenges, and perspectives. Remote Sens. 11 (1), 48. doi:10.3390/rs11010048
Keywords: spectral indices, erosion, salinity, desertification, impervious surface
Citation: Oñate-Valdivieso F, Oñate-Paladines A and Díaz R (2024) Soil degradation in andean watersheds: a case study using remote sensing. Front. Earth Sci. 12:1325189. doi: 10.3389/feart.2024.1325189
Received: 20 October 2023; Accepted: 05 February 2024;
Published: 21 February 2024.
Edited by:
Sheng Nie, Chinese Academy of Sciences (CAS), ChinaReviewed by:
Sajjad Hussain, COMSATS Institute of Information Technology, PakistanTing Yang, Chinese Academy of Sciences (CAS), China
Copyright © 2024 Oñate-Valdivieso, Oñate-Paladines and Díaz. This is an open-access article distributed under the terms of the Creative Commons Attribution License (CC BY). The use, distribution or reproduction in other forums is permitted, provided the original author(s) and the copyright owner(s) are credited and that the original publication in this journal is cited, in accordance with accepted academic practice. No use, distribution or reproduction is permitted which does not comply with these terms.
*Correspondence: Fernando Oñate-Valdivieso, fronate@utpl.edu.ec