New cold seep sites on the continental slope southwest to Svalbard
 V. K. Bellec
 S. Chand
 J. Knies
 L. R. Bjarnadóttir
 A. Lepland1
  A. Sen
 T. Thorsnes
- 1Geological Survey of Norway (NGU), Trondheim, Norway
- 2iC3: Centre for ice, Cryosphere, Carbon and Climate, Department of Geosciences, UiT The Arctic University of Norway, Tromsø, Norway
- 3Arctic Biology, The University Centre in Svalbard (UNIS), Longyearbyen, Norway
- 4Faculty of Biosciences and Aquaculture, Nord University, Bodø, Norway
We discovered seafloor features such as bacterial mats and carbonate crusts typical for active methane seeps on the continental slope southwest of Svalbard. These features are associated with two main northwest-southeast trending morphological structures that are oriented parallel to the regional continental slope. Both structures occur at c. 800 m water depth, at the boundary between the Storfjorden trough mouth fan to the south and the Hornsund trough mouth fan to the north, which suggests a loading related fluid seepage. The main structure displays depressions and ridges forming a crater in its center. Other occurring features include small sediment mounds, domes often covered by bacterial mats, and hummocky seafloor colonized by siboglinid tubeworms. Free gas bubbles were spotted close to the centre and plumes along the rims of the structure. Thick carbonate crusts indicate a long seepage history in the center of the structure and on top of the ridges. The sources of the seeps are likely to be Miocene old organic-rich deposits, or Paleocene hydrocarbon reservoirs.
1 Introduction
Cold seeps correspond to areas of gas or fluid venting from the seafloor at passive and active oceanic margins. They are characterized by different seafloor morphologies like pockmarks, mud volcanoes and mounds or just include gas seeps and/or chemosynthetic biological communities without prominent structures (see Talukder, 2012, for review) and are observed on bathymetry data and videos or photos around the world (e.g., Orange et al., 2002; Somoza et al., 2003; Paull et al., 2008a; Jones et a., 2010; Hart et al., 2011; Feng et al., 2018; Kim et al., 2020). In Norwegian waters, from south Norway to the Svalbard margins, more than 5,000 gas seeps were reported by Thorsnes et al. (2023) and a thousand more by Mau et al. (2017). Moreover, new seeps are continually discovered, like the new mud volcano southwest of the Bear Island found in May 2023 [University of Tromsø, 2023, https://uit.no/nyheter/artikkel?p_document_id=811650 (Accessed 9 May 2023)]. In the Barents Sea and the western Svalbard margin, cold seeps create structures like pockmarks (Vogt et al., 1994; Vogt et al., 1999; Bünz et al., 2012), mud volcanoes (Håkon Mosby mud volcano; Vogt et al., 1991), or gas-hydrate pingos and craters (e.g., Andreassen et al., 2017; Serov et al., 2017; Nixon et al., 2019). They can also occur without any seafloor expressions such as in the flare areas off Prins Karls Forland, western Svalbard (Westbrook et al., 2009; Ferré et al., 2020). Gas seeps are commonly associated with carbonate crusts, showing evidence of both past and present gas emissions (Crémière et al., 2016; Himmler et al., 2019; Thorsnes et al., 2019).
Along the western Norwegian continental slope, cold seeps are often associated to mass-movement structures (e.g., Bryn et al., 2005; Solheim et al., 2005). Striking examples of these are the Håkon Mosby mud volcano located in the middle of the Late Pleistocene Bear Island trough slide scar (Laberg and Vorren, 1993), gas-hydrates stored within the headwall side of the Storegga slide (e.g., Mienert et al., 2005) with cold seeps and pockmarks found on its northern rim at Nyegga (Bünz and Mienert, 2004; Bünz et al., 2005), and Sklinnadjupet slide and associated mud flows (Riis et al., 2005; Rise et al., 2006). Gas and fluids from subsurface reservoirs move up through open conduits such as faults becoming focussed zones of fluid escape locations like the large concentration of gas flares observed along the Hornsund fault complex (Mau et al., 2017; Figure 1). Fluids with or without sediments can also move vertically upward by loading of high-water content ooze and mud as observed in the cases of Sklinnadjupet slide (Riis et al., 2005), Håkon Mosby mud volcano (Vogt et al., 1991) and the Nyegga area (Hustoft et al., 2009).
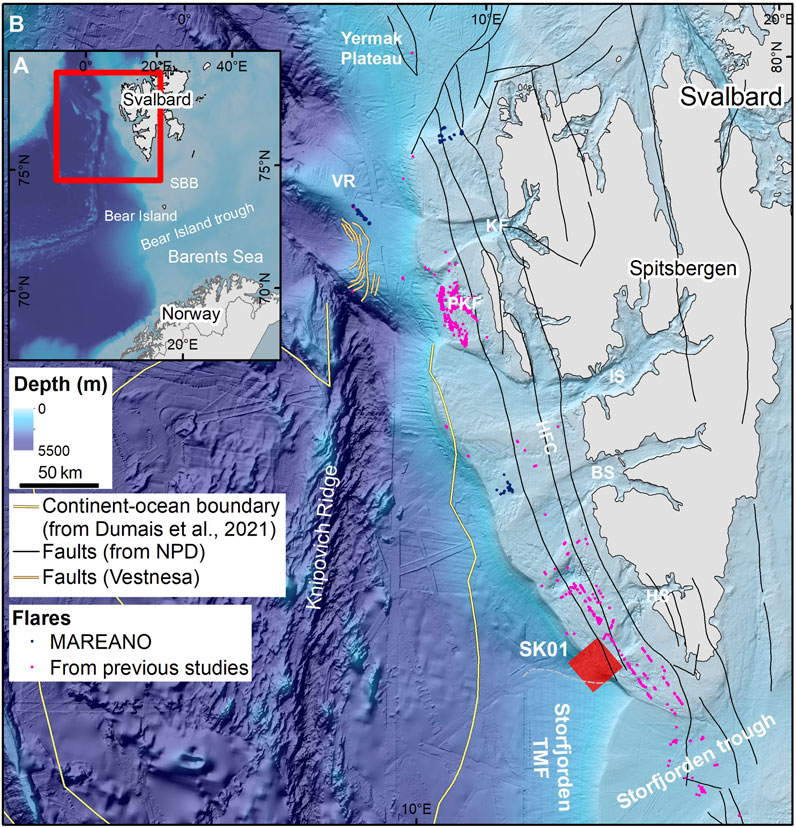
Figure 1. (A) Inset map and (B) Study location (SK01 in red) as well as the faults (from the Norwegian Petroleum Directorate–NPD), the continent-ocean boundary (Dumais et al., 2021) and gas flares found west to Svalbard. BS, Bellsund; HFC, Hornsund Fault Complex; HS, Hornsund; IS, Isjorden; KF, Kongsfjordrenna; PKF, Prins Karls Forland; SBB, Spitsbergen bank; TMF, trough mouth fan; VR, Vestnesa Ridge. Background bathymetry: IBCAO (Jakobsson et al., 2020). Flares from previous studies extracted from Knies et al., 2018; Mau et al., 2017; Myhre et al., 2016; Panieri, 2015; Sahling et al., 2014.
Methane brought by cold seeps is consumed by microbes in the water column. Indeed chemical reactions (anaerobic oxidation of methane and sulphate reduction) occur in the upper part of the sediment layer when methane meets sulphate held in seawater in presence of methanotrophic archaea and sulphate-reducing bacteria (Boetius et al., 2000; Boetius and Wenzhöfer, 2013). These processes lead to the formation of hydrogen sulphide, bicarbonate, and also to CO2 which impacts oceanic pH (e.g., Biastoch et al., 2011). Even if limited amounts of greenhouse gases escape to the atmosphere from these seeps, knowing their extents and possible origins give more information on their possible impact on oceanic chemistry, biological habitat, and their contribution to greenhouse gases.
In this study, we will focus on the southwestern Svalbard margin at about 76° 30′ (Figure 1). This area forms part of a regional network of study areas in the MAREANO programme (www.mareano.no), where the goal is to describe seabed nature types, including assessment of the impact of previous and future fishing activity (bottom trawling). Here a new cold seep area has been discovered on the continental slope, thereby representing a different environment than the three main known Svalbard seep sites, Vestnesa Ridge (deepwater contourite), Prins Karls Forland (continental shelf), and Storfjorden gas-hydrate pingos (glacial trough). The aim of this study is to characterize this new seep discovery and assess its formation controls.
2 Study area
The Svalbard continental shelf is quite narrow, 50–60 km wide, and is crossed by glacial troughs formed during the Plio-Pleistocene glaciations by the efficient erosion of fast flowing ice streams (e.g., Ottesen et al., 2005). At the mouth of major troughs, glacially eroded materials were deposited in large fans (e.g., Vorren and Laberg, 1997) forming the trough mouth fans we can observe today on the bathymetry (Figure 1). Two fan deposits cover the study area, the large Storfjorden trough mouth fan in the south and the smaller partly covered Hornsund trough mouth fan in the north (Figures 1, 2A). During the last glaciation, the ice sheet reached the western Svalbard continental shelf break and might have covered the seabed in the study area (SK01) (Hughes et al., 2016). Nowadays, the area is free of sea ice.
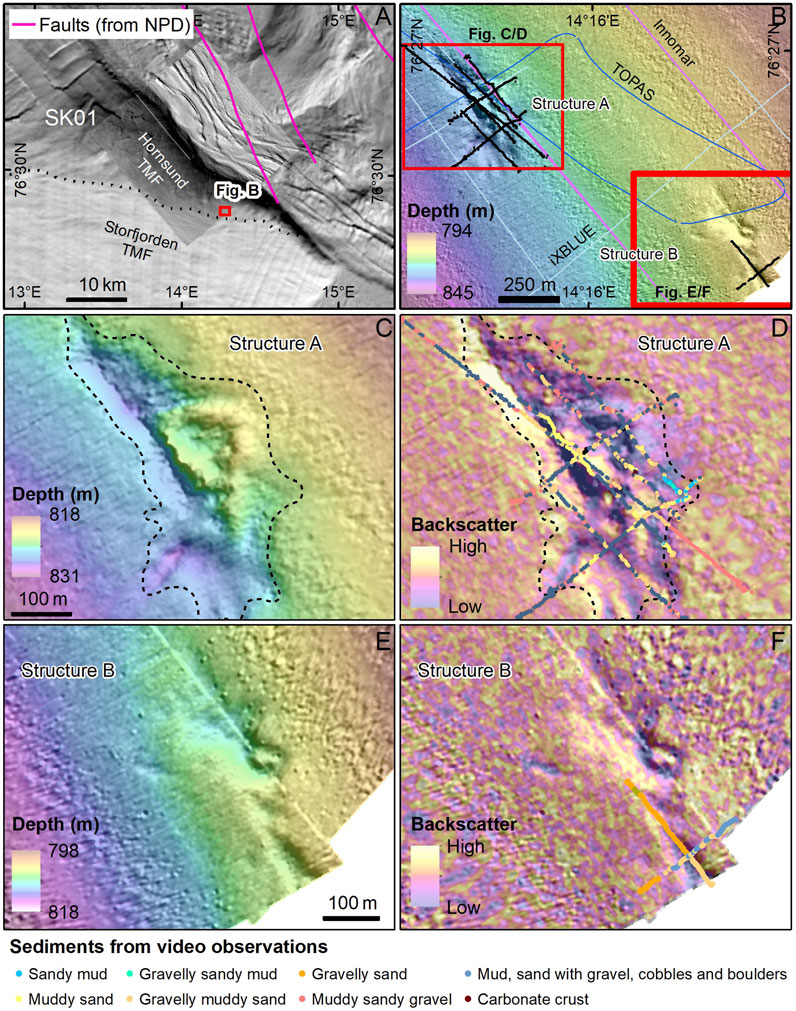
Figure 2. (A) Overview of SK01 (see Figure 1 for location, NPD: Norwegian Petroleum Directorate), (B) overview of the seep structures, (C–F) detailed maps of the two structures A and B. The limit of the structure A is highlighted by a black dotted line. Sediment observations from videos are on top of the backscatter maps. (C, D) display the structure A, while (E, F) show the structure B. Background map: IBCAO. Detailed bathymetry data supplied by MAREANO/Norwegian Hydrographic Survey.
The northwest Barents Sea and the Svalbard areas are under the influence of two main water masses. The warm and saline Atlantic Water comes from the south and flows along the western Barents Sea margin, forming the West Spitsbergen Current, and into the Storfjorden trough. The cold Arctic Water forms a clockwise gyre around Svalbard, mostly along the Svalbard coastline (East and West Spitsbergen Currents) and on the Spitsbergen bank (Loeng, 1989).
3 Data and methods
The study area, named SK01 (Figure 1), has been mapped by the MAREANO programme in 2017 using EM710 Kongsberg multibeam echosounder. The Norwegian Hydrographic Service (NHS) quality checked and processed the multibeam bathymetry using Teledyne CARIS. Cleaned XYZ points and grids were then supplied to the Geological Survey of Norway (NGU). NGU processed the backscatter data using QPS FMGT software. Water column data were processed and interpreted using QPS Fledermaus Midwater software.
Multibeam data were gridded with 5 m resolution shallower than 1,000 m, and with 10 m–25 m resolution below this depth. However, the high density of points allowed some higher resolution gridding up to 2 m on the shelf and the upper slope. Smoothing and filtering with Esri ArcGIS low filter have been applied to reduce the artifacts while regridding data at 2 m resolution. Water column data were also acquired in the western part of the SK01 box (covering about 50% of the box). However, the data were very noisy (a lot of artifacts) above the continental slope, making difficult a fine-scale interpretation of the gas flares.
Innomar SES 2000 Medium 70 sub bottom profiler lines were acquired simultaneously with multibeam data by FUGRO which delivered them as seismic SEG-Y files to NGU. Lines from Kongsberg TOPAS PS18 parametric sonar data were acquired during MAREANO cruises in October 2017 and 2019 (both with R/V G.O. Sars), while lines from iXBLUE Echoes 3500 T7 sub bottom profiler data were acquired during a third cruise in September 2022 (R/V Celtic Explorer) and were delivered as SEG-Y files. Filter and gain were applied on the TOPAS lines by using the TOPAS software.
Video lines of the seafloor were acquired during two MAREANO cruises. In October 2019, a 700 m long video line was acquired using a towed video platform dragged close to the seafloor and stationery at the start of the line. In September 2022, 8 video lines with a total length of about 2,650 m were acquired using the ROV Holland 1 (ROV: remotely operated vehicle). Positions were recorded every 10 s.
A carbonate crust sample (10 cm in diameter) was collected in 2022 at 76.4477° N/14.2522° E using the manipulator arm of the ROV. Eight micro drilled subsamples from the crust were analysed for stable carbon and oxygen isotope composition (δ13C and δ18O) and for mineral composition. Both analyses were conducted at the University of Tartu, Estonia. Stable isotope analyses were conducted using a GasBench II sample preparation device coupled to a Thermo Scientific Delta V Advantage isotope ratio mass spectrometer (IRMS). Samples were dissolved in >99% phosphoric acid with a reaction time of >8 h to ensure complete dissolution of carbonate minerals. Analyses were calibrated against the standard reference materials NBS 18, IAEA 603, LSVEC, and IAEA 611, with 1σ uncertainties smaller than ±0.2‰. Mineral composition analyses were conducted by X-ray diffraction (XRD) on a Bruker D8 Advance instrument using CuKα radiation and LynxEye positive sensitive detector. Mineral composition qualifications (relative error <20%) of the samples were interpreted and modelled using the Rietveld algorithm-based code Topaz by Bruker.
4 Results
4.1 Morphology of the cold seeps
Two conspicuous protruding structures (A and B) occurs at about 810–820 m water depth at SK01, where the seabed is otherwise flat (Figures 2A, B). The structure B is located at the edge of our dataset, 750 m southeast from the structure A. These two structures are located right at the border between Hornsund and Storfjorden trough mouth fans.
The structures A and B have a northwest-southeast orientation, more or less perpendicular to the regional slope. The structure A forms an elongated depression (about 600 m long, 250 m wide and up to 4 m deep) with two ridges inside (Figures 2C, D). The deeper ridge rises about 8 m up from the seafloor and follows part of the depression, while the shallowest ridge is about 4 m high and is not bounded by a trench upslope. The two ridges join to form a crater-like depression (about 2 m deep and 100 m wide). The southernmost structure B (Figures 2E, F) forms a large dome which is more than 480 m long, at least 2–3 m high and crossed by short depressions, an elongated one at the top of the structure, and more curved ones on the side of the structure. No flares were observed from the multibeam water column data at the cold seep area around and above the structures A and B.
4.2 Video observations
The sediments covering the seafloor outside the structure A, characterized by high backscatter (Figures 2D, F), comprise mixed grain sizes ranging from mud to cobbles and boulders. Inside the structure, this type of sediments is also present, especially on top of the ridges. Large areas with softer and muddier/sandier sediments, however, occur mainly on the flanks of the ridges and in depressions. These areas are marked by lower backscatter values (Figures 2D, F).
Carbonate crusts, crust fragments, bacterial mats, chemosynthetic tubeworms and different kinds of seabed deformation (sediment mounds, small domes and hummocky seafloor) are visible at the surface of the structures A and B (Figures 3, 4). Video observations on top of the structure A are described in more details below.
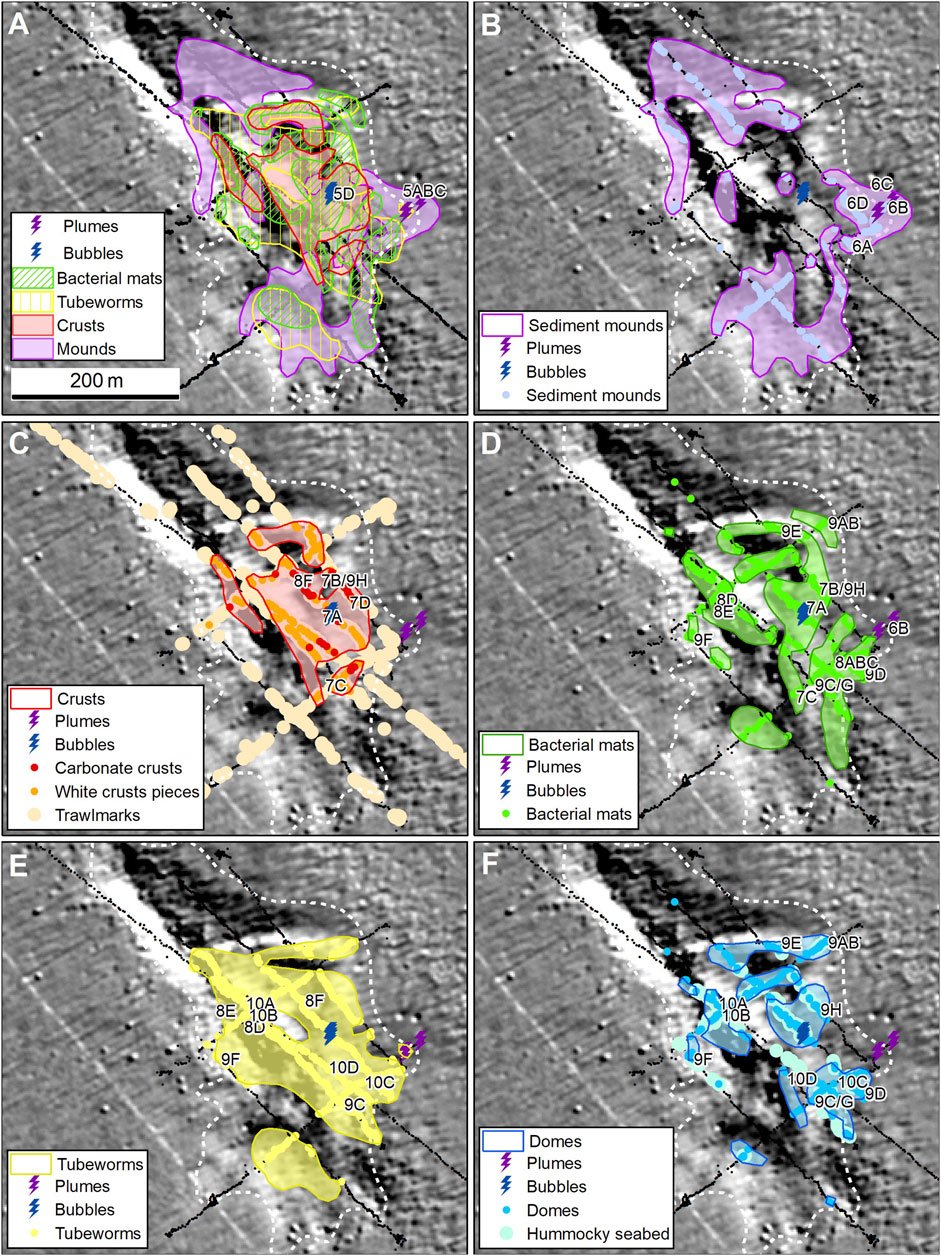
Figure 3. Mapping of the different features on the structure A. (A) summarizes the different features, while (B–F) show respectively the location of the sediment mounds, the crusts, the bacterial mats, the tubeworms, the domes and the hummocky seabed areas. Locations of bubbles and plumes have been added on all panels. The structure limit is highlighted by a white dotted line. Location of Figures 5–10 are indicated on the different panels. Bathymetry data supplied by MAREANO/Norwegian Hydrographic Survey.
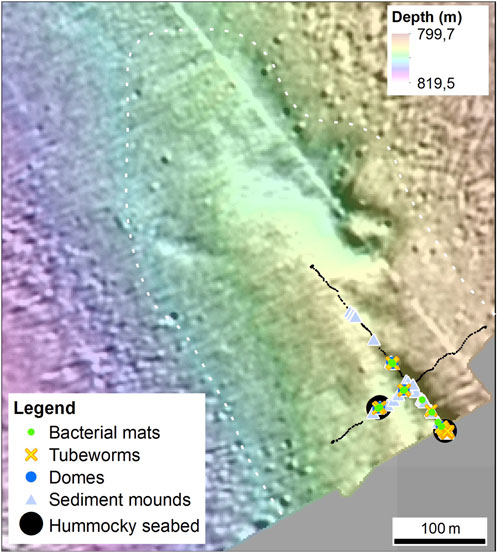
Figure 4. Mapping of the features on the structure B. See Figure 2 for location of this structure. Detailed bathymetry data supplied by MAREANO/Norwegian Hydrographic Survey.
Signs of active seepage were observed in two different places on the structure A (Figures 3A, 5). A stream of gas bubbles started when the ROV’s arm sampled a piece of carbonate crust located inside the crater in the middle of the structure A. In this area, the carbonate crust was covered by bacterial mats (Figure 5D). When the ROV was lifted about 2′30′ after the sampling, the bubble stream was still active. Several plumes were also observed at the southeast corner of the structure, where a large area is covered by small sediment mounds of different colours (Figures 5A–C); their accumulation forming larger hummocky features. A dark grey plume started on top of one of these small mounds at about 1–2 m from the ROV. The plume was intermittent and was active 6 times in about 3.5 min and was a few centimetres high. Before the plume, the seafloor was covered by light coloured sediment (Figure 5A), while once the plume stopped, a thin layer of dark grey coloured sediment had been deposited (Figure 5C).
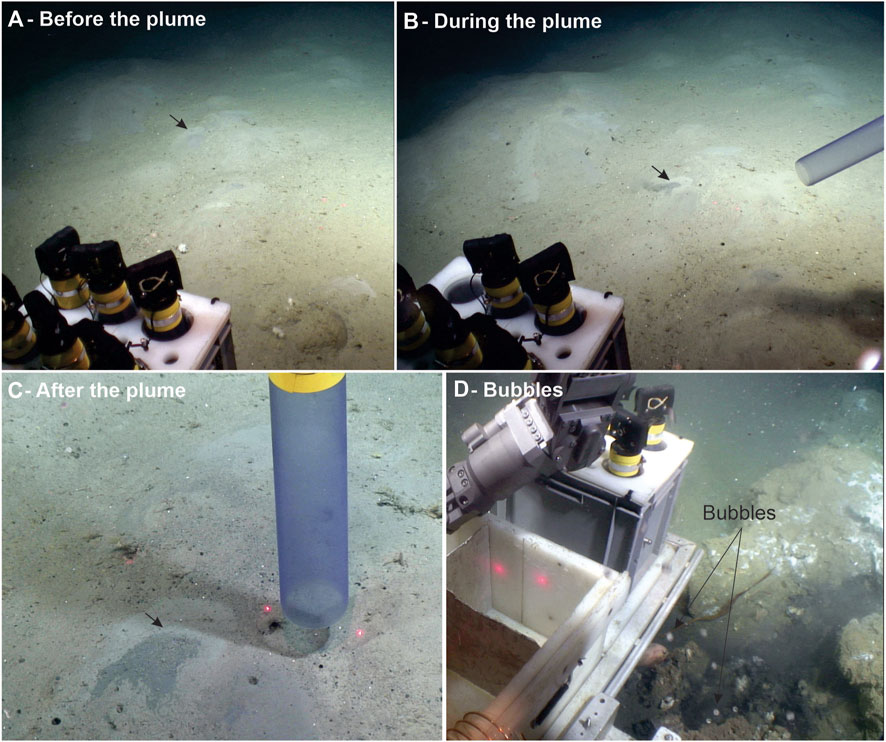
Figure 5. During a still (A), a plume appeared several times a little bit further from the ROV (B). It deposited a dark grey sediment lobe which was not there before the plume (C). Similar dark grey lobes have been observed in several places (see Figure 6 mounds). Black arrows in (A–C) indicate the location of the plume. Bubbles were observed in one location where carbonate crusts were present (D). They appeared after the ROV moved a piece of carbonate crust and were constant the 2′30′ the ROV stayed there. 10 cm between the red laser dots. Video data supplied by MAREANO/Institute of Marine Research.
Small bluish sediment mounds (Figure 6), some covered with dark grey lobes (Figures 6B–D), others with lighter coloured lobes (Figures 6A–D), are mostly found in the outer parts of the structure A (Figure 3B) and occur in both gravelly and muddy sediments. A similar light bluish colour is often found in the underlying sediments, below a few centimetres of brownish sediments. They are up to 20 cm high and a few decimetres wide and can display sediment lobes originating from their top showing colours like light grey or dark grey (showing by small dark arrows in Figure 6). No chemosynthetic tubeworms or bacterial mats occur on top of these mounds, even if they occur between the mounds at a few locations (Figure 6B).
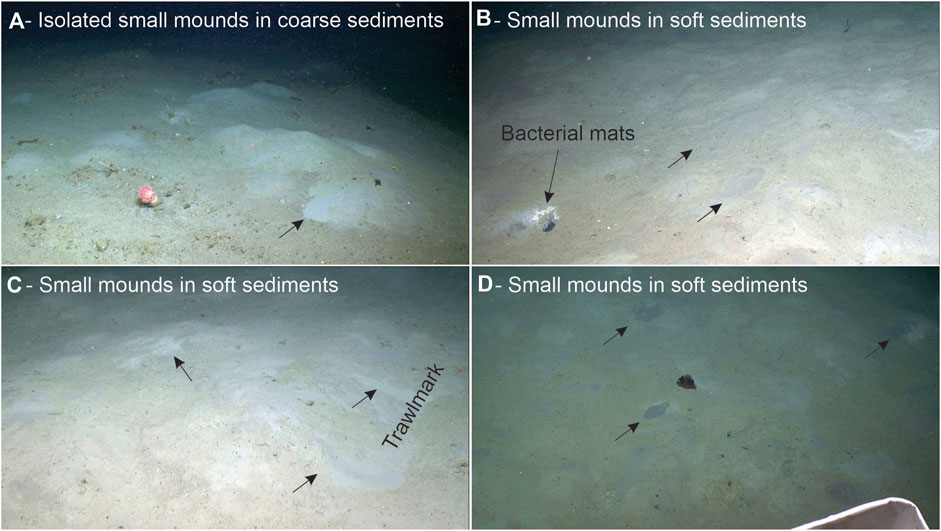
Figure 6. Sediment mounds which disturbed the seafloor. They occur in coarse sediment bottom (A) or in softer sediments (B–D). They show different colours which do not correspond to the brownish surface sediment colours. Soft sediment lobes occur around these mounds (indicated by small black arrows). These mounds often occur without visible bacterial mats. However, some localized spots of mats can occur (B). 10 cm between red laser dots. Video data supplied by MAREANO/Institute of Marine Research.
Carbonate crusts rising up to 80 cm above the seafloor were observed at several places, on and around the ridges and in the center of the structure A (Figures 3C, 7). Some crusts are covered by bacterial mats (Figure 7A, bubble stream site). Smaller crust fragments were observed on top of the ridges where they are often crushed and redistributed to a large area by trawling (Figures 7B–D). In fact, as shown by Figure 3A, the area has been intensively trawled and most of the higher areas are completely disturbed (Figures 7C, D).
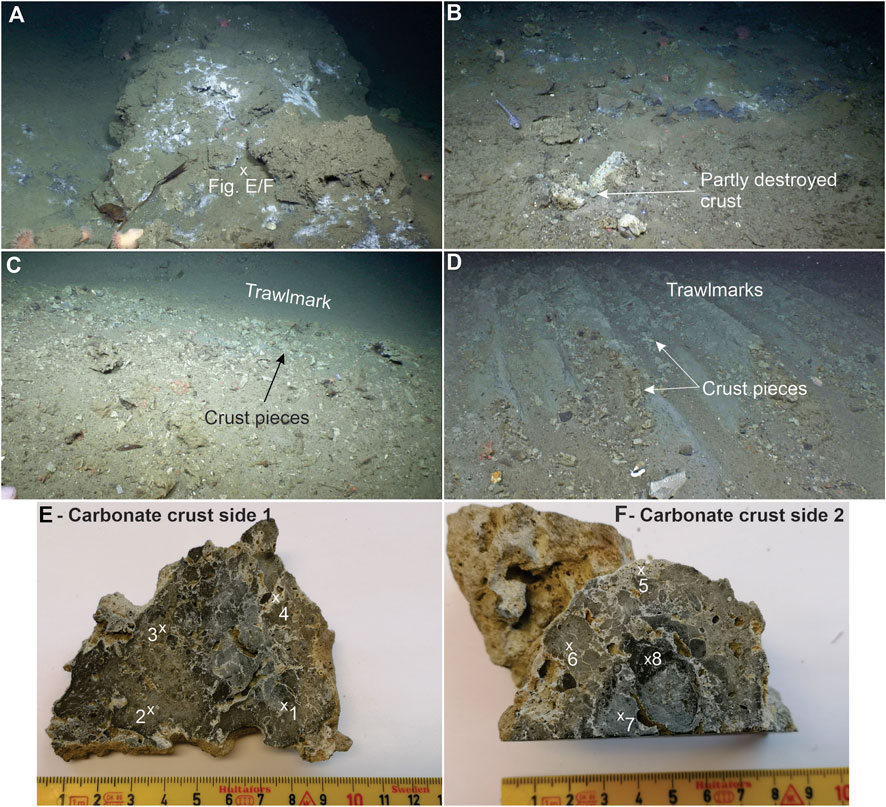
Figure 7. Large areas with carbonate crusts occur (A) as well as smaller crusts. Crusts were destroyed by trawling in large areas (B) and pieces of crusts associated with trawlmarks are interpreted as broken carbonate crusts (C,D). A sample of carbonate crust (E,F) were taken on the carbonate crusts of (A). Locations of crust analysis are indicated by numbers on (E,F). Video data supplied by MAREANO/Institute of Marine Research.
Bacterial mats are present both over the ridges and in depressions (Figures 3D, 8). However, as for the carbonate crusts, very few bacterial mats occur in the northern depression. Bacterial mats can cover large areas, like along the southern ridge where mats are found continuously on an 18 m long transect, or just be tiny millimetre white spots. They can occur in rounded shapes (Figure 8C), form lines or nets of lines (Figure 8D), be present under stones (Figures 8A, B) or on top of domes (Figure 9). They are also present in areas recently disturbed by trawling (Figure 7B). They are often, but not always, associated with chemosynthetic tubeworms.
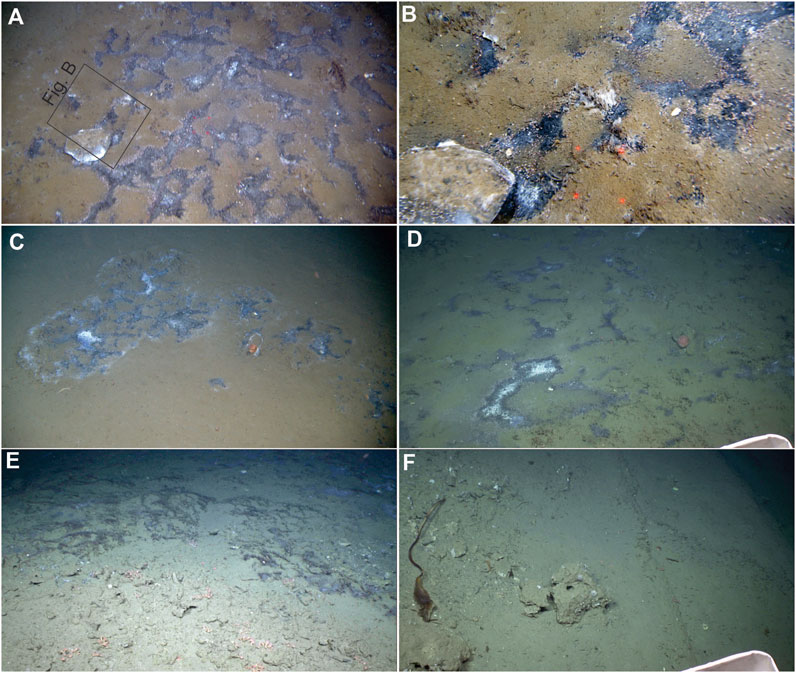
Figure 8. Bacterial mats and chemosynthetic tubeworms. (A) shows an example of an 18 m long area with bacterial mats, with a zoom in (B). Bacterial mats can also be found in circular structures (C) or on top of domes (Figure 9). They are often associated with chemosynthetic siboglinid tubeworms (D,E). Tubeworms can also be found without bacterial mats (F), but also on highs (see also Figure 10). Note the carbonate crust on (F) as well as the seafloor layering. 10 cm between red laser dots. Video data supplied by MAREANO/Institute of Marine Research.
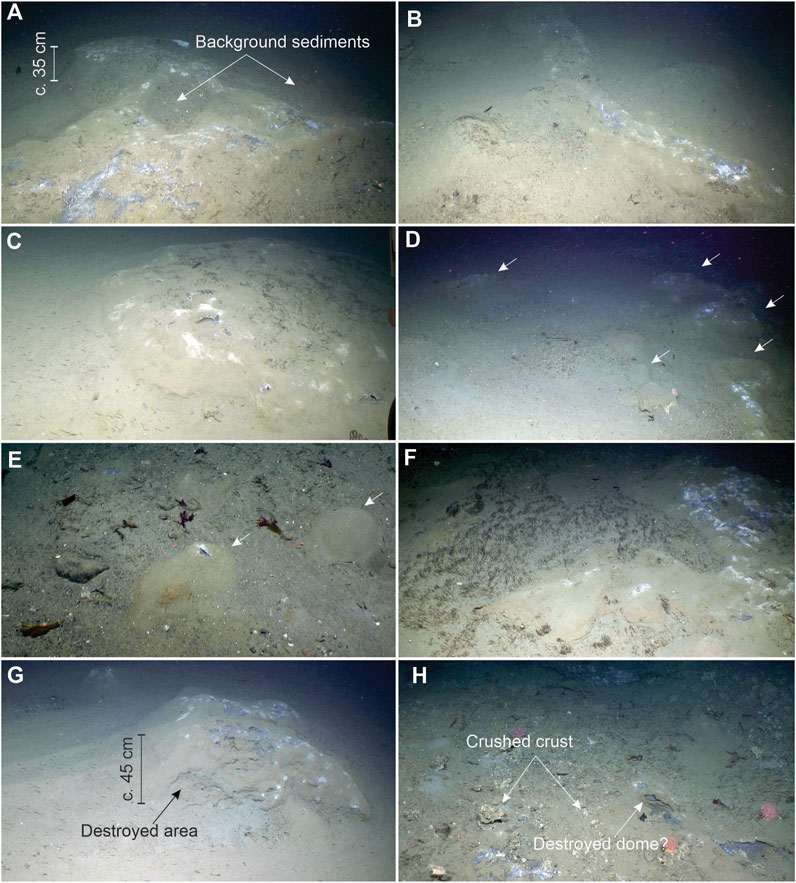
Figure 9. Domes show different shapes and sizes and are generally partly covered by bacterial mats (A–H), and more rarely by chemosynthetic tubeworms (A–C). Like for the carbonate crusts, domes can be destroyed and crushed by trawling (G,H). 10 cm between red laser dots. Video data supplied by MAREANO/Institute of Marine Research.
Possible chemosynthetic tubeworms are present on most of the structure A (Figures 3E, 8D–F, 9F, 10). They often form patches on top of highs of different sizes (Figures 10A–D). They also occur in a few decimetres long lines together with the bacterial mats (Figures 8D, E) or form more scattered patches (Figure 8F). However, they rarely occur on domes (Figure 9, one exception is the Figure 9C), even if they can be largely present between them (Figure 9F). The tubeworms are most likely Oligograchia frenulate siboglinids and more specifically either Oligobrachia webbi or Oligobrachia sp. CPL-clade, but a genetic study is necessary to differentiate them (Sen et al., 2018; Sen et al., 2023). The moniliferan siboglinid, Sclerolinum contortum might also be present (Lösekenn et al., 2008).
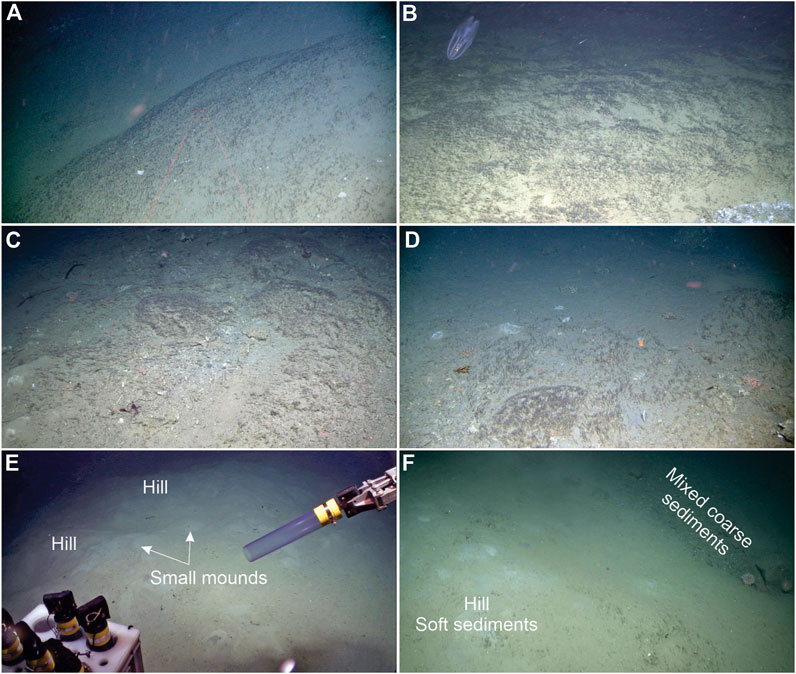
Figure 10. Small hills forming hummocky sediments have different sizes, from decimetric to metric, and are generally covered by chemosynthetic tubeworms (A–D). Accumulation of small sediment mounds can also form hills (E). Large hills are also observed covering the background mixed coarse sediments (F) with here some sediment mounds and chemosynthetic tubeworms present on top of the hill. 10 cm between red laser dots. Video data supplied by MAREANO/Institute of Marine Research.
Domes are small highs up to 20 cm high and from a few centimetres to several metres long (Figure 9). Their shape is generally rounded (Figures 9C–E), but metre long ridges also occur (Figures 9A, B) as well as more complex shapes, like the q shape in the Figure 9D or the irregular dome of the Figure 9F. Gravelly sediments occur in some places in the middle of some domes (Figure 9A). They appear to be slightly harder than the surrounding sediment, even if they can also be damaged and destroyed by trawling (Figures 9G, H), letting their internal structure to be apparent. Their body are formed by layered sediments which show empty spaces between the layers. Bacterial mats are generally present on their top, where craters of different sizes might occur. Their occurrences are very similar to the bacterial mat locations (Figures 3D, F). Domes are often associated with a pinkish coloured surface (Figure 9F).
Hills forming hummocky surfaces are one the largest features observed on the structure A (Figures 3F, 10), aside from the ridges forming the structure A. They are often covered by chemosynthetic tubeworms which highlight highs and lows as they tend to settle on highs. They can also be covered by small sediment mounds (Figures 10E, F). They seem to be mostly restricted to the central and southeast areas. In some places, the original mixed coarse sediment is visible at the foot of the hill made by soft sediments, while sediment mounds and chemosynthetic tubeworms are present on the top of the hill (Figure 10E).
On the structure B located at the edge of the dataset, bacterial mats, chemosynthetic tubeworms and small sediment mounds mostly occur close or in an elongated depression at the top of the structure (Figure 4). However, only two video lines have been acquired on this structure, not enough to cover the entire area.
4.3 Seismic observations
The sediments around the protruding structure A show alternating seismic units, either acoustically stratified or transparent (Figure 11). The part right below the protruding structure A is characterised by complete acoustic blanking which can extend horizontally along strata. The top of the structure is marked by chaotic reflections, likely rising from diffractions from the ridges. The along-slope-profile (Figure 11 yy’) does not show the same pattern on the two sides of the structure A. One debris flow (marked GDF on Figure 11), about 6 m deep and likely coming from the Storfjorden trough mouth fan, stopped right against the acoustic blanking area.
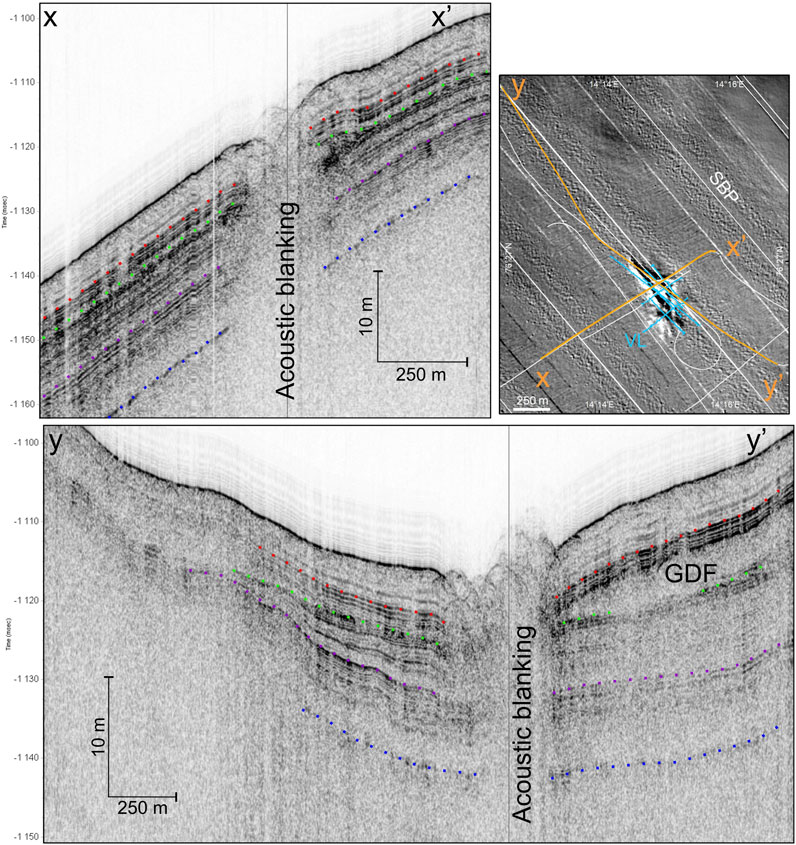
Figure 11. TOPAS lines showing the structure A of the SK01 box. Top panel: line perpendicular to the structure and parallel to the regional slope, lower panel: line parallel to the structure. The dotted blue line follows the same reflections on both TOPAS lines. VL, video lines; SBP, sub-bottom profiler. Detailed bathymetry data supplied by MAREANO/Norwegian Hydrographic Survey. TOPAS data: MAREANO/NGU.
Carbonate crusts and crust pieces occur on and around the ridges, which are also right above the main acoustic blanking corridor (Figure 12), that we can follow down as deep as the signal penetration. This acoustic blanking widens upwards at about 20 m below the seabed. This part of the acoustic blanking corresponds to the long north depression where little carbonate crusts or bacterial mats have been found and where mostly sediment mounds exist. Sediment mounds also occur on the other side of the structure A, where no acoustic blanking is present.
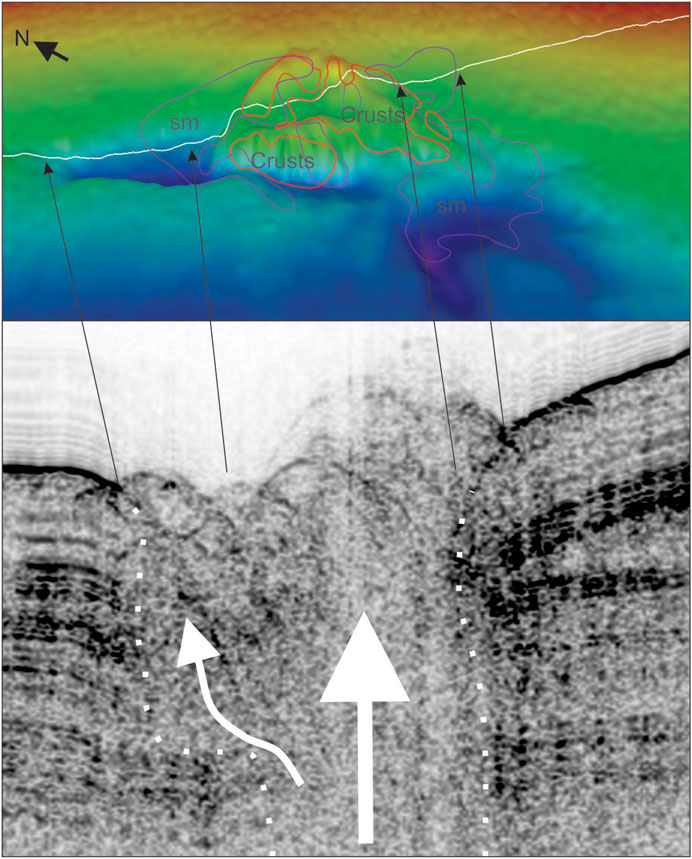
Figure 12. Comparison between the acoustic blanking areas (zoom from the yy’ TOPAS line of in this figure, lower panel) and the presence of sediment mounds and crusts (large carbonate crusts and small pieces), displayed on top of a 3D view of the structure A [higher panel, white line: TOPAS line, violet lines: limits of the sediment mounds (sm), red lines: limits of the crusts]. The main acoustic blanking (large white arrow) is below the area of carbonate crusts, while the area with a shallower acoustic blanking (smaller arrow) corresponds to the long north depression where the only seepage expressions observed are the sediment mounds. Sediment mounds are also the main sign of seepage on the east border of the structure, where very little acoustic blanking occurs. Detailed bathymetry data supplied by MAREANO/Norwegian Hydrographic Survey. TOPAS data: MAREANO/NGU.
4.4 Results from the carbonate crust analysis
Carbonate crusts form due to cementation of seafloor sediments via precipitation of authigenic carbonate minerals, and typically contain variable propositions of detrital silicate and authigenic carbonate components. Carbonate contents of studied subsamples microdrilled from different parts of the crust taken in the center of the structure A (Figures 7E–F) exhibit minor colour variations range from 67 to 77% wt., except one subsample which carbonate content is 38% wt. Aragonite is the predominant carbonate phase in studied subsamples (ca 90% of carbonate fraction), but trace amounts of dolomite, calcite and Mg-calcite are also present. Stable isotope composition of the eight subsamples is similar with δ13C values ranging between −52.7 and −48.4‰ VPDB and δ18O values ranging between 4.3 and −5.5‰ VPDB (Figure 7; Table 1).
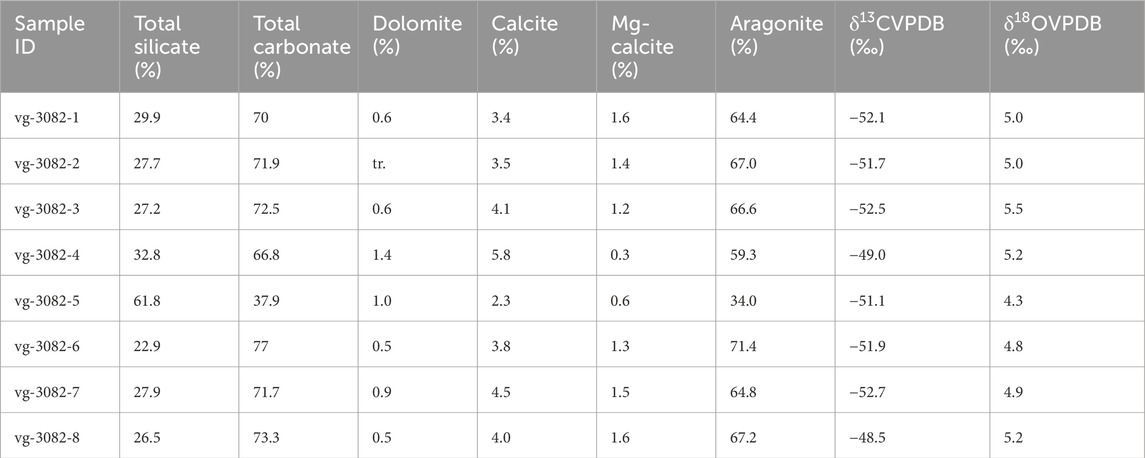
Table 1. Results of the carbonate crust analysis.
5 Discussion
5.1 Origin of the gas seeps
The seepage may originate from several sources. The middle Miocene organic-rich deposits recovered in the central Fram Strait (Knies and Mann, 2002) is considered to be the most likely source of the ongoing gas and oil seeps on Vestnesa Ridge and Prins Karls Forland (Daszinnies et al., 2021). Southwest of Svalbard, the Storfjorden trough mouth fan is one of the largest and thickest Plio-Pleistocene fans of the western Svalbard-Barents Sea margin (Vorren and Laberg, 1997). Burial of Tertiary organic-rich deposits below these thick wedges of prograding sediment sequences since the intensification of the Barents Sea glaciation (Laberg et al., 2012) may have caused organic matter maturation and eventually expulsion and migration of hydrocarbons (Daszinnies et al., 2021). Indeed, recent data compilation of oil-source rock correlation for the western Svalbard margin indicate an unequivocal correspondence between a Tertiary source rock of deltaic origin and seeping oil at the sea surface (Mattingsdal, 2023). If this Tertiary source rock has reached its maturation window below the trough mouth fan, it may have led to generation of fluids and migration along the limit of the trough mouth fan. Another source of fluids might be older deposits, like gas migrating from Paleocene hydrocarbon reservoirs through the Hornsund fault complex. These reservoirs are likely responsible for the gas-charged sediments at the gas hydrate pingos in Storfjorden trough (Waage et al., 2019), c. 90 km to the south of our study area.
We can rule out any direct link to gas hydrate boundary related seepages, as observed at many locations along the western Svalbard margin (Westbrook et al., 2009; Berndt et al., 2014) as our structures are located much deeper than the upward limit of the gas hydrate stability zone close to 400 m (Vogt et al., 1999; Vadakkepuliyambatta et al., 2017). However, the high δ13C values, consistent with methane seepage and its anaerobic oxidation as the underlying cause for the authigenic carbonate precipitation and crust formation, and the bubbles at the structure A (Figures 3, 5) suggest a breach of free gas through the hydrate stability zone towards the sea surface. This might explain the relatively high δ18O values which indicate a possible involvement of fluids released by gas hydrate during the carbonate precipitation. The breach of free gas can occur where the hydrate stability parameters are changed, specifically pore fluid temperature altered by seeping fluids or an overpressure buildup due to fluid flow from deeper formations (Paull et al., 2008b), resulting in gas migration from a deep-seated reservoir, below the Plio-Pleistocene trough mouth fan deposits. We cannot rule out that these gases are mixed with gases from microbial origin, as the last ones might occur everywhere.
5.2 Interpretation of the seepage features
No gas flares in multibeam water column data were observed above the structure A in SK01. As the water column data was of poor quality along the slope, we cannot, however, completely rule out the presence of gas flares in this area at the time of surveying. Also, their apparent absence may be due to seepages occurring intermittently rather than continuously. Indeed, a constant bubble stream occurred after sampling a piece of carbonate crusts in the center of the structure A, and several sporadic plumes were observed in its southeast part (Figure 5). Moreover, gas flares only represent free gas emissions, their absence does not mean that dissolved gases are not present and indeed the presence of extensive bacterial mats and siboglinid tubeworms (Figures 3D, E), which depend directly on dissolved gases for their chemosynthesis-based nutrition (see, e.g., Schulze and Halanych, 2003; Sen et al., 2018; Åström et al., 2020), indicate an active and mostly diffuse seepage (Boetius and Wenzhofer, 2013; Panieri et al., 2017). This on-going seepage is also marked by the recolonization by tubeworms and bacterial mats in areas relatively recently disturbed by trawlmarks (Figures 7B, 9H). In fact, the slightly elevated, circular structures with bacterial mats in the centre and siboglinid tubeworms often on the rims indicates a limited chemical impact, with a more focused seepage in one place, in the centre, where the bacterial mats occur, and less, or deeper, chemical reactions supplying sulphide or methane used by the tubeworms’ symbionts (e.g., Sen et al., 2018) away from the center where the tubeworms are observed. On the other hand, large areas with bacterial mats, sometimes forming a net of lines, may indicate a more diffuse seepage with gas/fluids migrating upwards through cracks/small faults over larger areas.
Several other features (small sediment mounds, domes, and small hills forming a hummocky surface) have been interpreted as a result of seepages in this area. A common characteristic of these features is that all of them show a positive relief. Another common characteristic is that all these features occur only inside the structure A or just at its border.
The small sediment mounds of disturbed sediments with no bacterial mats or siboglinid tubeworms on their tops are the most extended feature, occurring also slightly outside the structure A in the east/southeast but rarely in the center of the structure (Figure 6). They may represent one-time or short-time fluid/gas seep events at the border of the seep area with too little gas to create chemical reactions. On-going short-time seepages have been observed with sporadic plumes leaving behind dark grey sediment lobes (Figures 5A–C). Small sediment lobes have often been observed originating from these mounds, likely linked to these short seepage events, even if not all of them show a dark grey colour. The location of these mounds, mostly observed on the external part of the structure A, supports a lower supply of gas/fluids. Moreover, when checking their location with the imprint of the acoustic blanking (Figure 12), which is interpreted as a blanking linked to gas migration, these mounds occur at the border or outside of the main acoustic blanking corridor. The fact that they do not cover the northern part of the northeast depression while they occur and show active signs of seepage in the east may indicate an actual gas migration towards the east, which is towards the structure B. No correspondences have been found in the literature in the marine domain about these structures. However, they might appear slightly like gryphons found in onshore mud volcano areas. These gryphons are conic features formed from the expulsion of gas, water, oil and mud and gather in cluster or fields in the central part of the mud volcano crater. Their body is made by superposed mud flows resulting from the semi-continuous mud eruption (Mazzini and Etiope, 2017).
Mostly located on the flank and on top of the ridges, the domes show different sizes and shapes with bacterial mats but scarce siboglinid tubeworms on top (Figure 9). They are interpreted as sediments pushed-up by gas/fluids, and they represent areas of more focused and constant seepage pushing the sediments upwards over a more or less long period, which explain why bacterial mats are almost always present on their top. The fact that no signs of mass-movement are visible in the sediment at the surface of the domes may indicate harder/consolidated sediments, which may be confirmed as well by pieces looking like crusts from domes destroyed by trawling. This is also substantiated by the almost total absence of tubeworms on the top on most of the domes, as the worms need softer sediments to settle. The material of these domes might come from the sediments/crust often observed on top of bacterial mats (Figure 8). We do not have enough data to know if these crusts have a chemical origin (like thin layers of carbonate crusts), are originated from bacterial secretions, or simply come from sediments trapped by the bacterial filaments constituting the mats. Once these crusts form a layer, the bacterial mats settle again on top and a new crust starts covering the mats again, and so on until the supply in gas/fluid stops (Figure 13). This kind of formation will explain the empty space between the layers as well as why bacterial mats always occur on top. If the domes are made from carbonate crusts, they might be similar to the small mounds of porous carbonate crusts found at the Nile deep-sea fan (Gontharet et al., 2007). They might also correspond to small gas-hydrate pingos as the ones found in Nyegga (Hovland and Svensen, 2006).
Figure 13. Possible formation of the domes. (A) Crusts form at the surface of the bacterial mats. (B) Bacterial mats. grow again on top of the crusts due to a constant flux of gas. (A–C) repeat themselves several times up to forming a dome shape structure. Video data supplied by MAREANO/Institute of Marine Research.
Hills forming a hummocky seafloor are most of the time made of soft sediments, which do not correspond to the mixed coarse background seafloor sediments. As they are often covered by chemosynthetic siboglinid tubeworms, it is likely that some diffuse seepages occur in these areas. If they do not reach the surface, the worms need to dig deeper in the sediments, but these seepages do not create domes or favour the growth of bacterial mats. They might correspond to the accumulation of older small sediment mound areas, like the one of the Figure 10A or Figure 10E.
5.3 Formation
The structure A found at about 820 m depth in SK01 is the first of its kind to be observed on the western Svalbard continental margin. The presence of more than 80 cm thick methane-derived authigenic carbonate crusts near the centre of the structure suggests a relatively long seepage history of at least several thousand years (Ye et al., 2019), similar to what it was documented from both theVestnesa Ridge (Himmler et al., 2019) and the southwestern Barents Sea (Crémière et al., 2016). This is further supported by the presence of a glacigenic debris flow stopping nearby the acoustic blanking corridor below the structure A covered by several metres of post-glacial sediments (Figure 11).
The structure A is shaped as an elongated depression with ridges inside. Bacterial mats, siboglinid tubeworms and crusts occur on top and on the sides of these ridges, as well as in the depression southeast to the ridges. These indicate that the ridges may have been the results of sediments pushed upwards by gas migration, quite similar to but much larger than the domes, likely in a comparable way than gas-hydrate pingos (e.g., Hovland and Svensen, 2006; Waage et al., 2019). The ridges and the southeast depression appear more active than the west part of the elongated NW-SE depression where the bottom is filled by muddier sediments.
The sediment distribution along the structure A is interesting, as similar sediments (mud, sand, gravel, cobbles and boulders) occur on the top of the ridges and in the surrounding areas, as well as in the crater, while muddier sediments are found on the flanks of the ridges and in the lower areas. However, in the crater, the mixed sediments alternate with softer sediments often linked to sediments mounds or small hills. This means that the seafloor likely did not collapse at the NW-SE depression (no presence of stones in the deeper areas) but instead opened in the same way that we can see on the southernmost structure, with small cracks, perhaps aided by the regional slope which helps pulling the sediments down the slope (Figure 14). However, as cobbles and boulders are present in the crater, the seafloor likely collapsed in this area.
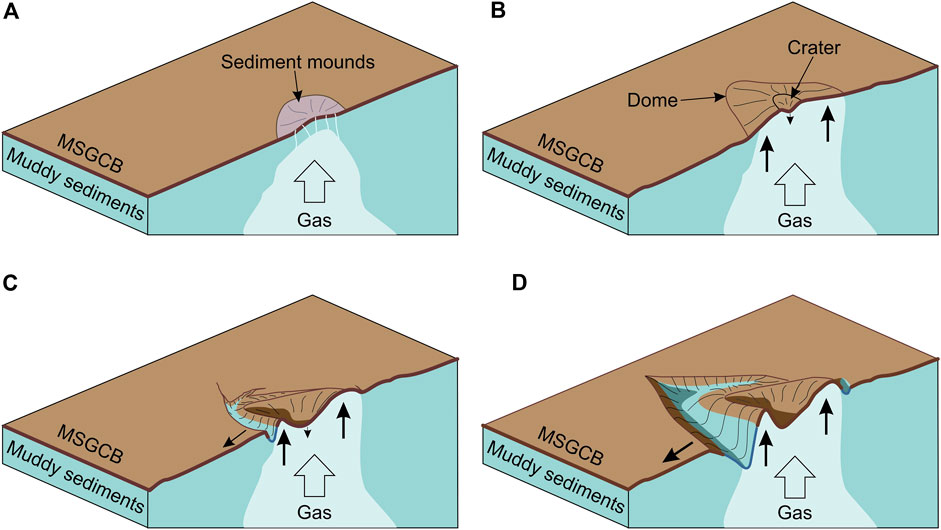
Figure 14. Schematic model of the formation of the SK01 structure A. (A) Gas (or fluids) migrates upwards forming a small dome. (B) Once the gas reaches the surface, the seepage becomes more important, and a larger dome starts forming. A crater may appear at the top of the dome due to the release of pressure below. (C) Under the sediment load pressure downslope, cracks start forming parallel to the regional slope. (D) Actual shape of the structure, with soft sediments clearly visible on the walls and the bottom of the cracks. MSGCB: Mud, sand, gravel, cobbles and boulders.
The first step of the structure A formation would be gas/fluids coming up, disturbing the sediments (Figure 14A) before forming a large positive structure. A partial collapse at the top of the structure might have led to the formation of a crater in the middle, likely linked to stronger gas/fluid seepages at this place (Figure 14B). Around the seepage areas, the sediments might be a little bit more consolidated, either because of carbonate crusts, gas hydrates or because of crusts-like sediments on top of the ridges. Cracks could have occurred along these slightly more consolidated areas (Figure 14C), and as the ridges were going up, cracks opened under the upwards pressure of the ridge and the downwards pressure of the regional slope until the modern structure (Figure 14D). The effect of the slope likely explained why there are no depressions on the shallowest side of the ridges.
Both the structure A and the edge of structure B are located at the limit between the Storfjorden and Hornsund trough mouth fans, out of which the latter is much less developed (Rebesco et al., 2014). The location of the seep structures at the boundary between the Storfjorden and Hornsund trough mouth fan deposits could suggest a loading related fluid seepage where these two deposits are absent or thinner. The overpressure caused by the glacial loading may have driven the fluids upwards to a preferably easier and permeable formation. Indeed, as the glacigenic debris flows constituting the Storfjorden trough mouth fan (Laberg and Vorren, 1996) are less permeable (e.g., Bünz et al., 2003), it is possible that gas have escaped at this boundary due to a low-pressure passage towards the surface.
This model can be compared to that suggested for Nyegga Area where similar features where observed. At Nyegga area, the loading from high sedimentation rate during a glacial advance created an overpressure scenario (Hustoft et al., 2009) which resulted in focussing of fluids to the region outside less permeable glacial debris flow deposits and concentrated escape of fluids creating a region of pockmarks. The enhanced fluid flow activity died out but the structures are preserved, and micro seepage is still reported from some of these pockmarks (Chevalier et al., 2014; Roalkvam et al., 2012; Krylova et al., 2011). This process might be one of the explanations of the formation of the structures right at the border of the two trough mouth fans. Another formation model includes the expulsion of mud or ooze if present along with the fluids. The video and photos indicate fresh flows of material through vents at the sites indicating some material also coming out. This could be also fluids carrying fine particles while they move upwards during the already established conduits. The expulsion of such material also indicates that the overpressure from the loading of two fan deposits are still not accommodated and the processes related to it are still active creating these seafloor features.
Cold seeps occur on both passive and active margins and in different environmental settings (Suess, 2014; Ceramicola et al., 2017). Suess (2014) indicates that, on passive margins, the driving mechanisms for fluid expulsion at passive margins are linked to sediment loading, differential compaction, overpressure and facies changes. And on this, the SK01 cold seeps are not different from the other passive margin seeps.
Some of the environmental settings favouring cold seeps can also be compared with the SK01 cold seep environment: deltaic environments with high sedimentation rate leading to sediment overload, like, for example, the Nile delta where several seeps occur along the fan (e.g., Dupré et al., 2010) or deep-sea fans like the Congo deep-sea fan (e.g., Rabouille et al., 2017; Sen et al., 2017). Glacial trough mouth fans, deltaic fans and deep-sea fans, while occurring at different latitudes or depths, all represent a higher sedimentation rate than the surrounding areas. The major factor triggering the migration of gas or fluids around these fans is likely to be this higher sedimentation rate leading to a sedimentary loading and/or overpressure, like for the Nyegga area (Hustoft et al., 2009).
However, there is a wide range of shapes associated with cold seeps with sediment loading as a primary cause, from pockmarks at the Congo deep-sea fan to mud volcanoes at the Nile delta or possibly ridges and crater at SK01. This indicate that other factors affect the shape of the seeps which might be the flow rate and its upwards migration pathways (e.g., chimneys, faults or through the sediments), the presence of gas hydrates, the composition of the gases/fluids or even the sediment characteristics at the seep location.
6 Conclusion
We report new morphological structures on the southwest continental slope of Svalbard (c. 800 m water depth), which are interpreted as the result of methane seepages. No gas flares were observed in the study area indicating that present seepages, while extensive, might be minimal or intermittent. The structures are located right at the border between two glacial trough mouth fans, Hornsund and Storfjorden, that probably have influenced their formation by the local sediment overpressure they create. Several hypotheses are plausible for the gas origin, either shallow reservoirs charged by the same middle Miocene organic-rich deposits responsible for the gas seepage at Vestnesa Ridge and Prins Karls Forland, or from older (Paleocene/Eocene) and deeper seated rocks. Video observations show typical features for diffusive gas emission at the seafloor including bacterial mats, chemosynthetic animals, and thick methane-derived authigenic carbonates. Moreover, the micro and mega structures observed within the site such as small mounds, domes, and flow structures indicate that gas seepage is still occurring. Some features seem to indicate a constant and more focused seepage, like the domes, while others like the small mounds appear to be linked to short-time seepages.
Our seep formation hypothesis is that the upwards migration of gas or fluids formed a large dome, likely similar to gas-hydrate pingos, whose the center later collapsed to form the actual crater surrounding by ridges. The mode of seepage is mainly liquid based and is today mostly active when the sediments are disturbed and at the eastern limit of the structure which seems to indicate a migration of the fluids towards this direction.
Extensive diffuse seepages have the potential to release methane in the water column and are known to form special habitats with chemosymbiotrophic fauna. Certainly, more in-depth knowledge from ROV based sampling and multi-scale analytical investigations is needed to fully understand the spatial distribution, controlling processes, chronological constraints and origin of this new discovered seep site.
Data availability statement
The original contributions presented in the study are publicly available. This data can be found here: geo.ngu.no/kart/marin_mobil/ and www.mareano.no.
Author contributions
VB: Investigation, Writing–original draft, Writing–review and editing. SC: Writing–review and editing. JK: Writing–review and editing. LB: Writing–review and editing. AL: Writing–review and editing. AS: Writing–review and editing. TT: Writing–review and editing.
Funding
The author(s) declare that no financial support was received for the research, authorship, and/or publication of this article.
Acknowledgments
We acknowledge all participants of the MAREANO programme (www.mareano.no) for invaluable cooperation. The multibeam data were acquired and supplied by the Norwegian Hydrographic Service at the Norwegian Mapping Authority (Kartverket). The data is released under a Creative Commons Attribution 4.0 International (CC BY 4.0): https://creativecommons.org/licenses/by/4.0/. Fundings for campaigns, research and analysis were supported by the Mareano program. JK was supported by the Research Council of Norway (grant #332635).
Conflict of interest
The authors declare that the research was conducted in the absence of any commercial or financial relationships that could be construed as a potential conflict of interest.
Publisher’s note
All claims expressed in this article are solely those of the authors and do not necessarily represent those of their affiliated organizations, or those of the publisher, the editors and the reviewers. Any product that may be evaluated in this article, or claim that may be made by its manufacturer, is not guaranteed or endorsed by the publisher.
Supplementary material
The Supplementary Material for this article can be found online at: https://www.frontiersin.org/articles/10.3389/feart.2024.1328357/full#supplementary-material
SUPPLEMENTARY TABLE S1
Locations of the still images shown in this study.
References
Andreassen, K., Hubbard, A., Winsborrow, M., Patton, H., Vadakkepuliyambatta, S., Plaza-Faverola, A., et al. (2017). Massive blow-out craters formed by hydrate-controlled methane expulsion from the Arctic seafloor. Science 356 (6341), 948–953. doi:10.1126/science.aal4500
Åström, E. K. L., Sen, A., Carroll, M. L., and Carroll, J. (2020). Cold seeps in a warming Arctic: insights for benthic ecology. Front. Mar. Sci. 7, 244. doi:10.3389/fmars.2020.00244
Berndt, C., Feseker, T., Treude, T., Krastel, S., Liebetrau, V., Niemann, H., et al. (2014). Temporal constraints on hydrate-controlled methane seepage off Svalbard. Science 343, 284–287. doi:10.1126/science.1246298
Biastoch, A., Treude, T., Rüpke, L. H., Riebesell, U., Roth, C., Burwicz, E. B., et al. (2011). Rising Arctic Ocean temperatures cause gas hydrate destabilization and ocean acidification. Geophys. Res. Lett. 38 (8), L08602. doi:10.1029/2011gl047222
Boetius, A., Ravenschlag, K., Schubert, C. J., Rickert, D., Widdel, F., Gieseke, A., et al. (2000). A marine microbial consortium apparently mediating anaerobic oxidation of methane. Nature 407 (6804), 623–626. doi:10.1038/35036572
Boetius, A., and Wenzhofer, F. (2013). Seafloor oxygen consumption fuelled by methane from cold seeps. Nat. Geosci. 6, 725–734. doi:10.1038/ngeo1926
Bryn, P., Berg, K., Forsberg, C. F., Solheim, A., and Kvalstad, T. J. (2005). Explaining the storegga slide. Mar. Petroleum Geol. 22 (1-2), 11–19. doi:10.1016/j.marpetgeo.2004.12.003
Bünz, S., and Mienert, J. (2004). Acoustic imaging of gas hydrate and free gas at the Storegga Slide. J. Geophys. Res. Solid Earth 109 (B4), B04102. doi:10.1029/2003jb002863
Bünz, S., Mienert, J., and Berndt, C. (2003). Geological controls on the Storegga gashydrate system of the mid-Norwegian continental margin. Earth Planet. Sci. Lett. 209, 291–307. doi:10.1016/s0012-821x(03)00097-9
Bünz, S., Mienert, J., Vanneste, M., and Andreassen, K. (2005). Gas hydrates at the storegga slide: constraints from an analysis of multicomponent, wide angle seismic data. Geophysics 70, B19–B34. doi:10.1190/1.2073887
Bünz, S., Polyanov, S., Vadakkepuliyambatta, S., Consolaro, C., and Mienert, J. (2012). Active gas venting through hydrate-bearing sediments on the Vestnesa Ridge, offshore W-Svalbard. Mar. Geol. 332-334, 189–197. doi:10.1016/j.margeo.2012.09.012
Ceramicola, S., Dupré, S., Somoza, L., and Woodside, J. (2017). “Cold seep systems,” in Submarine geomorphology. Editors A. Micallef, S. Krastel, and A. Savini (Charm: Springer), 367–387.
Chevalier, N., Bouloubassi, I., Stadnitskaia, A., Taphanel, M.-H., and Sinninghe Damsté, J. S. (2014). Lipid biomarkers for anaerobic oxidation of methane and sulphate reduction in cold seep sediments of Nyegga pockmarks (Norwegian margin): discrepancies in contents and carbon isotope signatures. Geo-Marine Lett. 34, 269–280. doi:10.1007/s00367-014-0363-5
Crémière, A., Lepland, A., Chand, S., Sahy, D., Condon, D. J., Noble, S. R., et al. (2016). Timescales of methane seepage on the Norwegian margin following collapse of the Scandinavian Ice Sheet. Nat. Commun. 7 (1), 11509. doi:10.1038/ncomms11509
Daszinnies, M., Plaza-Faverola, A., Sylta, Ø., Bünz, S., Mattingsdal, R., Tømmerås, A., et al. (2021). The Plio-Pleistocene seepage history off western Svalbard inferred from 3D petroleum systems modelling. Mar. Petroleum Geol. 128, 105023. doi:10.1016/j.marpetgeo.2021.105023
Dumais, M.-A., Gernigon, L., Olesen, O., Johansen, S. E., and Brönner, M. (2021). New interpretation of the spreading evolution of the Knipovich Ridge derived from aeromagnetic data. Geophys. J. Int. 224 (2), 1422–1428. doi:10.1093/gji/ggaa527
Dupré, S., Woodside, J., Klaucke, I., Mascle, J., and Foucher, J.-P. (2010). Widespread active seepage activity on the Nile Deep Sea Fan (offshore Egypt) revealed by high-definition geophysical imagery. Mar. Geol. 275, 1–19. doi:10.1016/j.margeo.2010.04.003
Feng, D., Qiu, J.-W., Hu, Y., Peckmann, J., Guan, H., Tong, H., et al. (2018). Cold seep systems in the South China Sea: an overview. J. Asian Earth Sci. 168, 3–16. doi:10.1016/j.jseaes.2018.09.021
Ferré, B., Jansson, P. G., Moser, M., Serov, P., Portnov, A., Graves, C., et al. (2020). Reduced methane seepage from Arctic sediments during cold bottom-water conditions. Nat. Geosci. 13, 144–148. doi:10.1038/s41561-019-0515-3
Gontharet, S., Pierre, C., Blanc-Valleron, M.-M., Rouchy, J. M., Fouquet, Y., Bayon, G., et al. (2007). Nature and origin of diagenetic carbonate crusts and concretions from mud volcanoes and pockmarks of the Nile deep-sea fan (eastern Mediterranean Sea). Deep-Sea Res. II 54, 1292–1311. doi:10.1016/j.dsr2.2007.04.007
Hart, P. E., Pohlman, J. W., Lorenson, T. D., and Edwards, B. D. (2011). “Beaufort Sea deep-water gas hydrate recovery from a seafloor mound in a region of widespread BSR occurrence,” in Proceedings of the 7th International Conference on Gas Hydrates (ICGH 2011), Edinburgh, Scotland, United Kingdom, July 17-21, 2011.
Himmler, T., Sahy, D., Martma, T., Bohrmann, G., Plaza-Faverola, A., Bünz, S., et al. (2019). A 160,000-year-old history of tectonically controlled methane seepage in the Arctic. Sci. Adv. 5 (8), eaaw1450. doi:10.1126/sciadv.aaw1450
Hovland, M., and Svensen, H. (2006). Submarine pingoes: indicators of shallow gas hydrates in a pockmark at Nyegga, Norwegian Sea. Mar. Geol. 228, 15–23. doi:10.1016/j.margeo.2005.12.005
Hughes, A. L. C., Gyllencreutz, R., Lohne, Ø. S., Mangerud, J., and Svendsen, J. I. (2016). The last Eurasian ice sheets – a chronological database and time-slice reconstruction, DATED-1. Boreas 45, 1–45. doi:10.1111/bor.12142
Hustoft, S., Dugan, B., and Mienert, J. (2009). Effects of rapid sedimentation on developing the Nyegga pockmark field: constraints from hydrological modeling and 3-D seismic data, offshore mid-Norway. Geochem. Geophys. Geosystems 10 (6), Q06012. doi:10.1029/2009gc002409
Jakobsson, M., Mayer, L. A., Bringensparr, C., Castro, C. F., Mohammad, R., Johnson, P., et al. (2020). The international bathymetric chart of the arctic ocean version 4.0. Sci. Data 7, 176. doi:10.1038/s41597-020-0520-9
Jones, A. T., Greinert, J., Bowden, D. A., Klaucke, I., Petersen, C. J., Netzeband, G. L., et al. (2010). Acoustic and visual characterisation of methane-rich seabed seeps at Omakere Ridge on the Hikurangi Margin, New Zealand. Mar. Geol. 272 (1-4), 154–169. doi:10.1016/j.margeo.2009.03.008
Kim, Y. G., Kim, S., Lee, D.-H., Kim, H. J., Kang, S.-G., Jin, Y. K., et al. (2020). Occurrence of active gas hydrate mounds in the southwestern slope of the Chukchi Plateau, Arctic Ocean. Arct. Ocean. Episodes 43 (2), 811–823. doi:10.18814/epiiugs/2020/020053
Knies, J., Daszinnies, M., Plaza-Faverola, A., Chand, S., Sylta, Ø., Bünz, S., et al. (2018). Modelling persistent methane seepage offshore western Svalbard since early Pleistocene. Mar. Petroleum Geol. 91, 800–811. doi:10.1016/j.marpetgeo.2018.01.020
Knies, J., and Mann, U. (2002). Depositional environment and source rock potential of Miocene strata from the central Fram Strait: introduction of a new computing tool for simulating organic facies variations. Mar. Pet. Geol. 19, 811–828. doi:10.1016/s0264-8172(02)00090-9
Krylova, E. M., Gebruk, A. V., Portnova, D. A., Todt, C., and Haflidson, H. (2011). New species of the genus Isorropodon (Bivalvia: Vesicomyidae: Pliocardiinae) from cold methane seeps at Nyegga (Norwegian Sea, Vøring Plateau, Storrega Slide). J. Mar. Biol. Assoc. U. K. 91 (5), 1135–1144.
Laberg, J. S., Andreassen, K., and Vorren, T. O. (2012). Late Cenozoic erosion of the high-latitude southwestern Barents Sea shelf revisited. GSA Bull. 124 (1-2), 77–88. doi:10.1130/b30340.1
Laberg, J. S., and Vorren, T. O. (1993). A late Pleistocene submarine slide on the bear Island trough mouth fan. Geo Mar. Lett. 13, 227–234. doi:10.1007/bf01207752
Laberg, J. S., and Vorren, T. O. (1996). The glacier-fed fan at the mouth of Storfjorden trough, western Barents Sea: a comparative study. Geol. Rundsch. 85, 338–349. doi:10.1007/s005310050079
Loeng, H. (1989). “Ecological features of the Barents Sea,” in Proc. 6th Conf. Comité Arct. Internat., E. J. Brill. Leiden, 13-15 May 1985, 327–365.
Lösekann, T., Robador, A., Niemann, H., Knittel, K., Boetius, A., and Dubilier, N. (2008). Endosymbioses between bacteria and deep-sea siboglinid tubeworms from an arctic cold seep (haakon Mosby mud volcano, Barents Sea). Environ. Microbiol. 10, 3237–3254. doi:10.1111/j.1462-2920.2008.01712.x
Mattingsdal, R. (2023). “A new young source rock offshore western Svalbard proven with oil seep geochemical results – possible regional implication for the westernmost Barents Sea,” in Norwegian Petroleum Directorate, Petroleum Systems Conference, Oslo, Norway, 23-24/05/2023.
Mau, S., Römer, M., Torres, M. E., Bussmann, I., Pape, T., Damm, E., et al. (2017). Widespread methane seepage along the continental margin off Svalbard - from Bjørnøya to Kongsfjorden. Sci. Rep. 7, 42997. doi:10.1038/srep42997
Mazzini, A., and Etiope, G. (2017). Mud volcanism: an updated review. Earth-Science Rev. 168, 81–112. doi:10.1016/j.earscirev.2017.03.001
Mienert, J., Vanneste, M., Bünz, S., Andreassen, K., Haflidson, H., and Sejrup, H. P. (2005). “Ocean warming and gas hydrate stability on the mid-Norwegian margin at the Storegga Slide,” in Ormen lange–an integrated study for safe field development in the Storegga submarine area. Editors A. SOLHEIM, P. BRYN, K. BERG, H. P. SEJRUP, and J. MIENERT (Amsterdam, Netherlands: Elsevier), 233–244.
Myhre, C. L., Ferré, B., Platt, S. M., Silyakova, A., Hermansen, O., Allen, G., et al. (2016). Extensive release of methane from Arctic seabed west of Svalbard during summer 2014 does not influence the atmosphere. Geophys. Res. Lett. 43, 4624–4631. doi:10.1002/2016gl068999
Nixon, F. C., Chand, S., Thorsnes, T., and Bjarnadóttir, L. R. (2019). A modified gas hydrate-geomorphological model for a new discovery of enigmatic craters and seabed mounds in the Central Barents Sea, Norway. Geo-Marine Lett. 39, 191–203. doi:10.1007/s00367-019-00567-1
Orange, D. L., Yun, J., Maher, N., Barry, J., and Greene, G. (2002). Tracking California seafloor seeps with bathymetry, backscatter and ROVs. Cont. Shelf Res. 22 (16), 2273–2290. doi:10.1016/s0278-4343(02)00054-7
Ottesen, D., Dowdeswell, J. A., and Rise, L. (2005). Submarine landforms and the reconstruction of fast-flowing ice streams within a large Quaternary ice sheet: the 2500-km-long Norwegian-Svalbard margin (57°–80°N). GSA Bull. 117 (7-8), 1033–1050. doi:10.1130/b25577.1
Panieri, G., Ambrose, W., Astrom, E., Carroll, M. L., Fornair, D., George, S. J., et al. (2015). CAGE 15-2 Cruise Report: gas hydrate deposits and methane seepages offshore western Svalbard and Storfjordrenna: biogeochemical and biological investigations. CAGE – Centre Arct. Gas Hydrate, Environ. Clim. Rep. Ser. 3. doi:10.7557/cage.6932
Panieri, G., Bünz, S., Fornari, D. J., Escartin, J., Serov, P., Jansson, P., et al. (2017). An integrated view of the methane system in the pockmarks at Vestnesa Ridge, 79°N. Mar. Geol. 390, 282–300. doi:10.1016/j.margeo.2017.06.006
Paull, C. K., Normark, W. R., Ussler, W., Careass, D. W., and Keaten, R. (2008a). Association among active seafloor deformation, mound formation, and gas hydrate growth and accumulation within the seafloor of the Santa Monica Basin, offshore California. Mar. Geol. 250, 258–275. doi:10.1016/j.margeo.2008.01.011
Paull, C. K., Ussler, W., Holbrook, W. S., Hill, T. M., Keaten, R., Mienert, J., et al. (2008b). Origin of pockmarks and chimney structures on the flanks of the Storegga Slide, offshore Norway. Geo Mar. Lett. 28, 43–51. doi:10.1007/s00367-007-0088-9
Rabouille, C., Olu, K., Baudin, F., Khripounoff, A., Dennielou, B., Arnaud-Haond, S., et al. (2017). The Congolobe project, a multidisciplinary study of Congo deep-sea fan lobe complex: overview of methods, strategies, observations and sampling. Deep Sea Res. Part II Top. Stud. Oceanogr. 142, 7–24. doi:10.1016/j.dsr2.2016.05.006
Rebesco, M., Laberg, J. S., Pedrosa, M. T., Camerlenghi, A., Lucchi, R. G., Zgur, F., et al. (2014). Onset and growth of trough-mouth fans on the north-western Barents Sea margin – implications for the evolution of the Barents Sea/svalbard ice sheet. Quat. Sci. Rev. 92, 227–234. doi:10.1016/j.quascirev.2013.08.015
Riis, F., Berg, K., Cartwright, J., Eidvin, T., and Hansch, K. (2005). Formation of large crater-like evacuation structures in ooze sediments in the Norwegian Sea. Possible implications for the development of the Storegga Slide. Mar. Petroleum Geol. 22, 257–273. doi:10.1016/j.marpetgeo.2004.10.023
Rise, L., Ottesen, D., Longva, O., Solheim, A., Andersen, E. S., and Ayers, S. (2006). The Sklinnadjupet slide and its relation to the Elsterian glaciation on the mid-Norwegian margin. Mar. Petroleum Geol. 23 (5), 569–583. doi:10.1016/j.marpetgeo.2006.05.005
Roalkvam, I., Dahle, H., Chen, Y., Jørgensen, S. L., Haflidason, H., and Steen, I. H. (2012). Fine-scale community structure analysis of ANME in Nyegga sediments with high and low methane flux. Front. Microbiol. 3, 216. doi:10.3389/fmicb.2012.00216
Sahling, H., Römer, M., Pape, T., Bergès, B., dos Santos Fereirra, C., Boelmann, J., et al. (2014). Gas emissions at the continental margin west of Svalbard: mapping, sampling, and quantification. Biogeosciences 11, 6029–6046. doi:10.5194/bg-11-6029-2014
Schulze, A., and Halanych, K. (2003). Siboglinid evolution shaped by habitat preference and sulfide tolerance. Hydrobiologia 496, 199–205. doi:10.1023/a:1026192715095
Sen, A., Andersen, L. W., Kjeldsen, K. U., Michel, L. N., Hong, W. L., Choquet, M., et al. (2023). The plylogeography and ecology of Oligobrachia frenulate species suggest a generalist chemosynthesis-based fauna in the arctic. Heliyon 9 (3), e14232. doi:10.1016/j.heliyon.2023.e14232
Sen, A., Dennielou, B., Tourolle, J., Arnaubec, A., Rabouille, C., and Olu, K. (2017). Fauna and habitat types driven by turbidity currents in the lobe complex of the Congo deep-sea fan. Deep Sea Res. Part II Top. Stud. Oceanogr. 142 (142), 167–179. doi:10.1016/j.dsr2.2017.05.009
Sen, A., Duperron, S., Hourdez, S., Piquet, B., Léger, N., Gebruk, A., et al. (2018). Cryptic frenulates are the dominant chemosymbiotrophic fauna at Arctic and high latitude Atlantic cold seeps. PLoS ONE 13 (12), e0209273. doi:10.1371/journal.pone.0209273
Serov, P., Vadakkepuliyambatta, S., Mienert, J., Patton, H., Portnov, A., Silyakova, A., et al. (2017). Postglacial response of Arctic Ocean gas hydrates to climatic amelioration. Earth, Atmos. Planetar Sci. 114 (24), 6215–6220. doi:10.1073/pnas.1619288114
Solheim, A., Berg, K., Forsberg, C. F., and Bryn, P. (2005). The Storegga Slide complex: repetitive large scale sliding with similar cause and development. Mar. Petroleum Geol. 22 (1-2), 97–107.
Somoza, L., Díaz-del-Río, V., León, M., Ivanov, R., Fernández-Puga, M. C., Gardner, J. M., et al. (2003). Seabed morphology and hydrocarbon seepage in the Gulf of Cádiz mud volcano area: acoustic imagery, multibeam and ultra-high resolution seismic data. Mar. Geol. 195 (1-4), 153–176. doi:10.1016/s0025-3227(02)00686-2
Suess, E. (2014). Marine cold seeps and their manifestations: geological control, biogeochemical criteria and environmental conditions. Int. J. Earth Sci. Geol. Rundsch 103, 1889–1916. doi:10.1007/s00531-014-1010-0
Talukder, A. R. (2012). Review of submarine cold seep plumbing systems: leakage to seepage and venting. Terra nova. 24, 255–272. doi:10.1111/j.1365-3121.2012.01066.x
Thorsnes, T., Chand, S., Bellec, V., Nixon, F. C., Brunstad, H., Lepland, A., et al. (2023). Gas seeps in Norwegian waters – distribution and mechanisms. Nor. J. Geol. 103, 202309. doi:10.17850/njg103-2-4
Thorsnes, T., Chand, S., Brunstad, H., Lepland, A., and Lågstad, P. (2019). Strategy for detection and high-resolution characterization of authigenic carbonate cold seep habitats using ships and autonomous underwater vehicles on glacially influenced terrain. Front. Mar. Sci. 6. doi:10.3389/fmars.2019.00708
Vadakkepuliyambatta, S., Skeie, R. B., Myhre, G., Dalsøren, S. B., Silyakova, A., Schmidbauer, N., et al. (2017). Climatic impact of Arcitc ocean methane hydrate dissociation in the 21st century. Eart Syst. Dyn. Discuss. doi:10.5194/esd-2017-110
Vogt, P. R., Crane, K., Pfirman, S., Sundvor, E., Cherkis, N., Fleming, H., et al. (1991). SeaMarc II sidescan sonar imagery and swatch bathymetry in the Nordic Basin. EOS 72, 486.
Vogt, P. R., Crane, K., Sundvor, E., Max, M. D., and Pfirman, S. L. (1994). Methane generated (questionable) pockmarks on young, thickly sedimented oceanic-crust in the Arctic—Vestnesa-Ridge. Fram Strait. Geol. 22, 255–258. doi:10.1130/0091-7613(1994)022<0255:mgpoyt>2.3.co;2
Vogt, P. R., Gardner, J., Crane, K., Sundvor, E., Bowles, F., and Cherkashev, G. (1999). Ground-truthing 11- to 12-kHz side-scan sonar imagery in the norwegia-Greenland sea: Part I: pockmarks on the Vestnesa Ridge and storegga slide margin. Geo-Marine Lett. 19, 97–110. doi:10.1007/s003670050098
Vorren, T. O., and Laberg, J. S. (1997). Trough mouth fans – palaeoclimate and ice-sheet monitors. Quat. Sci. Rev. 16, 865–881. doi:10.1016/s0277-3791(97)00003-6
Waage, M., Portnov, A., Serov, P., Bünz, S., Waghorn, K. A., Vadakkepuliyambatta, S., et al. (2019). Geological controls on fluid flow and gas hydrate pingo development on the Barents Sea margin. Geochem. Geophys. Geosystems 20, 630–650. doi:10.1029/2018gc007930
Westbrook, G. K., Thatcher, K. E., Rohling, E. J., Piotrowski, A. M., Pälike, H., Osborne, A. H., et al. (2009). Escape of methane gas from the seabed along the West Spitsbergen continental margin. Geophys. Res. Lett. 36, L15608. doi:10.1029/2009gl039191
Keywords: cold seeps, Barents Sea, Svalbard margin, continental slope, Storfjorden trough mouth fan
Citation: Bellec VK, Chand S, Knies J, Bjarnadóttir LR, Lepland A, Sen A and Thorsnes T (2024) New cold seep sites on the continental slope southwest to Svalbard. Front. Earth Sci. 12:1328357. doi: 10.3389/feart.2024.1328357
Received: 26 October 2023; Accepted: 08 March 2024;
Published: 09 April 2024.
Edited by:
Dongliang Luo, Chinese Academy of Sciences (CAS), ChinaReviewed by:
Marcelo Ketzer, Linnaeus University, SwedenJiapeng Jin, Pilot National Laboratory for Marine Science and Technology, China
Jinxiu Yang, China University of Petroleum, China
Copyright © 2024 Bellec, Chand, Knies, Bjarnadóttir, Lepland, Sen and Thorsnes. This is an open-access article distributed under the terms of the Creative Commons Attribution License (CC BY). The use, distribution or reproduction in other forums is permitted, provided the original author(s) and the copyright owner(s) are credited and that the original publication in this journal is cited, in accordance with accepted academic practice. No use, distribution or reproduction is permitted which does not comply with these terms.
*Correspondence: V. K. Bellec, valerie.bellec@ngu.no