Large-scale drivers of the exceptionally low winter Antarctic sea ice extent in 2023
 Monica Ionita1,2*
- 1Alfred Wegner Institute Helmholtz Center for Polar and Marine Research, Bremerhaven, Germany
- 2Forest Biometrics Laboratory—Faculty of Forestry, Stefan cel Mare University of Suceava, Suceava, Romania
The year 2023 marked a turning point for the Antarctic region as the Southern Hemisphere experienced a significant reduction in its sea ice extent, with a record-breaking sea ice minimum in July 2023 of approximately 2.4 million square kilometers below the long-term average. This study highlights the drivers behind this exceptional event by combining observational, satellite, and reanalysis data, with a special focus on the large-scale atmospheric circulation. Throughout the year, the Antarctic Sea ice extent broke record after record, ranking as the lowest sea ice on record from January to October, except for March and April. The exceptionally low sea ice extent from May to August was mainly driven by the prevalence of a zonal wave number 3 pattern, characterized by alternating surface high- and low-pressure systems, which favored the advection of heat and moisture, especially over the Ross Sea (RS), Weddell Sea (WS), and Indian Ocean (IO). The anomalous large-scale circulation was accompanied by record-high sea surface and subsurface temperatures over the regions with reduced sea ice extent. In addition to the air and ocean temperature, record-breaking heat, moisture, and sensible heat fluxes have been observed, especially over the WS, RS, and IO, which further amplified the reduction in the sea ice extent over these areas. Notably, over the Weddell Sea, we observed air temperature anomalies reaching up to 8°C and sea surface temperature anomalies of up to 3°C from May to July. Similar temperature anomalies were recorded over the Ross Sea, particularly in July and August. A change point analysis indicates that a regime shift in the Antarctic Sea ice, as well as in the average mean air temperature and (sub)surface ocean temperature over the Weddell Sea, started around 2015. The low sea ice extent in Antarctica in 2023 was a stark reminder of the ongoing changes in the polar regions. Thus, understanding the underlying mechanisms of these extreme events provides crucial insights into the changing dynamics of Antarctic Sea ice and its broader climatic significance.
1 Introduction
The year 2023 has set a new record in terms of the frequency and magnitude of extreme events, with the summer of 2023 (i.e., June-July-August) being the warmest on record globally, with an average temperature of 16.8°C (approximately 0.66°C above average) (Copernicus, 2023). Floods in China, Greece, Spain, and Libya, along with extreme drought in South America, have led to enormous loss of lives and unprecedented monetary losses (Munich, 2023). This year witnessed numerous temperature records, with the economic toll of extreme weather events ranging from 0.1% of the GDP in France to 1.3% in China (Allianz, 2023). The increasing frequency and severity of these occurrences directly impact a wide spectrum of industries. For instance, “back of the envelope” estimations by Allianz indicate that the recent global heatwaves in 2023 have resulted in an approximately 0.6% loss of GDP (Allianz, 2023). This economic impact, coupled with the growing loss of human life, as a consequence of the aforementioned extreme events, across the United States, Europe, and China, serves as a stark reminder that nations and industries must grapple with the realities of climate change. For example, at the time of writing this paper, casualties due to floods in Libya surpassed 10.000 people (World Meteorological Organisation, 2023).
In addition to floods, droughts, and heat waves, which mainly occurred in the Northern Hemisphere, the year 2023 also marked a turning point for the Antarctic region, as the Southern Hemisphere experienced a significant reduction in its sea ice extent (SIE), sending shockwaves through the scientific community and raising pressing questions about the implications of this remarkable event (Purich and Doddridge, 2023). Often regarded as a frozen wilderness at the southernmost tip of our planet, Antarctica has long been a critical component of the Earth’s climate system and a barometer of global environmental change (Stammerjohn et al., 2012; Rintoul, 2018). Antarctica’s sea-ice extent has historically served as a critical indicator of the health and stability of polar ecosystems, as it plays a vital role in regulating the global climate patterns. Moreover, it provides essential habitats for a wide array of marine life, from microscopic organisms to charismatic megafauna-like seals, penguins, and whales (Hobbs et al., 2016). The remarkable decline of Antarctic sea ice, which began in 2022 (Fretwell et al., 2023), has persisted throughout the year, extending up to December 2023 (Figure 1). This alarming trend, exhibiting a gradual decrease over the past several years (e.g., 2016) (Turner et al., 2017; Suryawanshi et al., 2023), reached a critical juncture in 2023 with the sea ice extent plummeting to unprecedented depths, raising concerns among scientists and policymakers worldwide (Purich and Doddridge, 2023). From January to October 2023, the Antarctic Sea ice extent consistently surpassed historical lows, with only March and April registering slightly higher values (second and third lowest SIE values on record, respectively) (Figure 1). This alarming decline, coinciding with the onset of the Antarctic melting season, suggests a trajectory of continued ice loss and underscores the urgency of addressing the underlying climate change drivers.
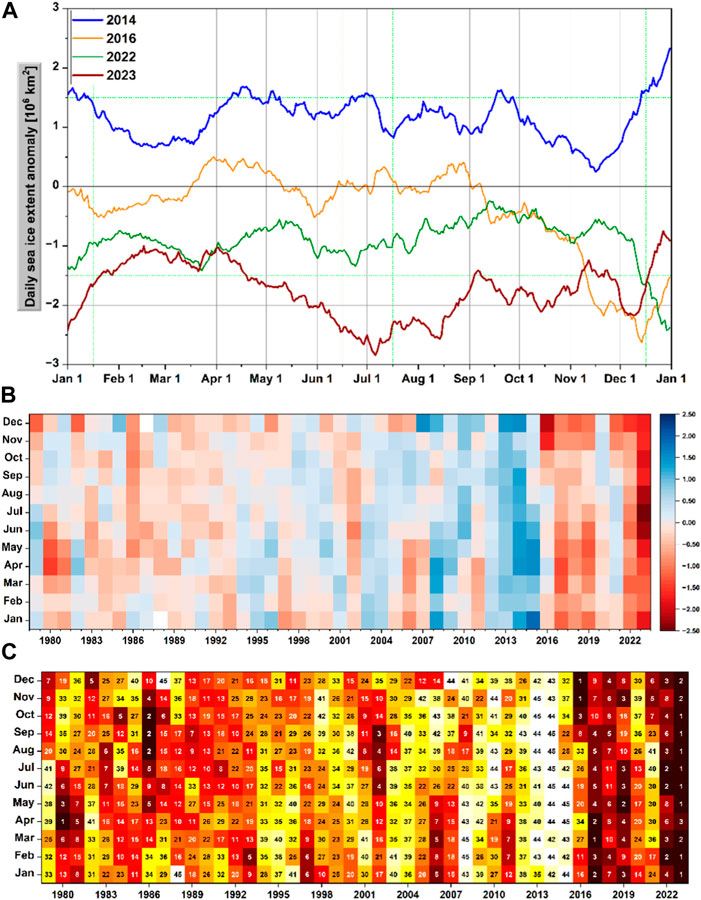
FIGURE 1. (A) Daily sea ice extent anomaly for the years 2014 (blue line), 2016 (orange line), 2022 (green line) and 2023 (red line); (B) Monthly Sea ice extent anomaly over the period 1979–2023. Red indicated negative anomalies and blue shading indicates positive sea ice extent anomalies and (C) ranking of the monthly sea ice extent over the period November 1978–August 2023. Dark red indicates the months with record low sea ice extent. In (A) and (B) the anomalies were computed relatively to the climatological period 1981–2010. Units: (A) and (B) [106km2].
Overall, several key factors can contribute to the variability and trends of Antarctic Sea ice, such as warming oceans, changes in ocean circulation, meltwater from ice shelves, local winds, cloud cover, ozone hole, and well-known teleconnection patterns such as the El Niño Southern Oscillation (ENSO), the Southern Annular Mode (SAM) and/or the prevailing large-scale atmospheric circulation (Bintanja et al., 2013; Raphael et al., 2016; Ionita et al., 2018; Holland et al., 2019; Vaideanu et al., 2023; Wang et al., 2023), among others. For example (Turner et al., 2017; Ionita et al., 2018), showed that the exceptionally low sea ice extent in 2016 was driven by the prevailing large-scale atmospheric circulation (e.g., in November 2016, SAM has been in its most negative state since 1968) and by intense transport of heat and water vapor from the adjacent regions towards the Antarctic continent. In their study (Nicolas et al., 2017), showed that the unusually low extent of Antarctic sea ice in 2016 and the extensive summer melt were favored by the strong El Niño event taking place at that time (Stuecker et al., 2017). showed that a combination of tropical forcing and internal atmospheric variability contributed to the unprecedented sea-ice decline in 2016. The aforementioned studies indicate that the extremely low sea ice extent observed in 2016 was driven by a complex interaction between the ocean and the atmosphere, but there was no clear indication of which factor contributed to the event (e.g., ocean warming, Southern Annular Mode, El Niño-Southern Oscillation).
With respect to the extremely low sea ice extent observed in 2023, a recent paper (Purich and Doddridge, 2023) showed that the unprecedented decline in the Antarctic Sea ice in the first 6 months of the year was mainly driven by subsurface warming of the Southern Ocean, pushing the Antarctic sea ice into a new low-extent state. While the (sub)surface warming of the Southern Ocean plays a crucial role in driving the variability and trend of the Antarctic Sea Ice, the prevailing large-scale atmospheric circulation also plays a crucial role in modulating the sea ice extent (Raphael et al., 2016; Ionita et al., 2018; Turner et al., 2022), either concurrently with the changes in the water temperature or with a delay of several months (Holland et al., 2018; Yadav et al., 2022). Thus, here we examine the development and large-scale drivers of the unprecedented low sea ice extent in 2023, using daily and monthly satellite-derived SIE data as well as monthly reanalysis products (i.e., ERA5 data (Hersbach et al., 2020)) to characterize the atmospheric circulation. We have to clearly state that a more in-depth analysis of the effect of ocean circulation on the recent sea ice decline is beyond the scope of this study. Thus, the objectives of the paper are as follows: a) to characterize the temporal and spatial extent of the 2023 unprecedented low sea ice extent from May until August, using both daily and monthly data; b) to analyze the key drivers of this particular event, with a special focus on the prevailing large-scale atmospheric circulation and the roles played by moisture and heat transport towards the Antarctic continent and c) to place the 2023 persistent sea ice loss extreme events in a long-term perspective. The paper is structured as follows. Section 2 provides a short and general description of the data used in this study. The main results of our analysis are presented in Section 3, and the discussion and the concluding remarks are presented in Section 4 and Section 5, respectively.
2 Data and methods
Daily and monthly sea ice extent data for the Antarctic region from 1979 to 2023 were retrieved from the National Snow and Ice Data Center ftp server (NSIDC) (ftp:///pub/DATASETS/NOAA/G02135/south/) (Meier et al., 2017). The sea ice extent (SIE) is defined as the total area of all satellite pixels where the sea ice concentration equals or exceeds 15%. In the current study, we examined the anomalies of the daily and monthly SIE both at the hemispheric level and for five separate sectors (Figure 1): the Ross Sea (RS) (160°E−130°W), the Weddell Sea (WS) (60°W–20°E), the Amundsen-Bellingshausen Sea (ABS) (130°W–60°W), the Indian Ocean (IO) (20°E−90°E), and the Western Pacific Ocean (WPO) (90°E−160°E).
For the large-scale atmospheric circulation, we used the daily and monthly sea level pressure (SLP), the 2 m mean air temperature (T2m), the meridional wind at 500 mb (V500), surface sensible heat flux (SHF), the zonal (U) and meridional (V) winds at 10 m, the vertical integral of water vapor (IVT), the total column of water vapor (TCWV), the vertical integral of eastward water vapor flux (QU), the vertical integral of northward water vapor flux (QV), the vertical integral of eastward heat flux (HU), and the vertical integral of northward heat flux (HV) from the European Center for Medium-range Weather Forecasts (ECMWF) ERA5 reanalysis fields (Hersbach et al., 2020). ERA5 is the fifth generation of the ECMWF global atmospheric reanalysis and is produced by the Copernicus Climate Change Service (C3S), which provides hourly estimates of a large number of atmospheric, land, and oceanic climate variables. The data covers the Earth on a 30 km grid and resolves the atmosphere using 137 levels from the surface up to a height of 80 km. It is continuously updated in real time from 1 January 1940, to the present. ERA5 is the most reliable reanalysis dataset for this region (Tetzner et al., 2019; Zhu et al., 2021), despite some inherent biases. Daily and monthly sea surface temperature gridded data were extracted from the NOAA 1/4° Daily Optimum Interpolation Sea Surface Temperature (OISST) (Huang et al., 2021). We used the Global Ocean Heat and Salt Content from NOAA (Levitus et al., 2012). The gridded fields and time series were calculated using in situ temperature and salinity data from the World Ocean Database and covers the period from 1955 to the present and has a seasonal temporal resolution [i.e., only seasonally averaged values are provided, namely: DJF (December-January-February), MAM (March-April-May), JJA (June-July-August) and SON (September-October-November)]. All anomalies used in this study were computed relative to the climatological period of 1981–2010. The methodology used to detect (non)significant changes in the temporal evolution of the sea ice extent time series and the 2 m mean air temperature is performed using the “changepoint” R package (Killick et al., 2022). The “changepoint” R package employs both frequentist (like Binary Segmentation, Piecewise Exponentially Likelihood Testing) and non-parametric approaches (e.g., detection of single change points in the mean or variance of a time series using a penalized likelihood approach), catering to different data types and assumptions. The choice of method depends on the specific characteristics of the data, the desired level of flexibility, and the type of changepoint detection problem. For the current study we used the intercept-only changes which estimate changes in mean and variance.
To analyze the potential mechanisms behind the regional sea ice variability, we examined the anomalous atmospheric circulation patterns (e.g., SLP, T2m, HV, and IVT) for the years when the regional sea ice extent was below −0.75 standard deviation over Weddell Sea and Ross Sea. This threshold was chosen as a compromise between the strength of large-scale anomalies associated with low sea ice and the number of years satisfying this criterion. Composite analysis is a commonly employed technique for comprehending physical mechanisms and constructing statistical prediction models (von Storch and Zwiers, 1999). The statistical significance of these composite maps was determined using a standard t-test at the 95% confidence level.
The stationarity of the relationship between the regional sea ice extent and large—scale atmospheric drivers (i.e., SLP, T2m, HV, and IVT) was tested using the stability map methodology (Ionita et al., 2018; Ionita et al., 2019). The basic idea of this methodology is to identify regions with stable teleconnections (the correlation does not change over time) between the sea ice extent averaged over specific regions (i.e., Ross Sea and Weddell Sea) and large-scale atmospheric gridded data. In this respect, we correlated the regional SIE with SLP, T2m, HV, and IVT over a 21-years moving window. The correlation is considered to be stable for those grid points where the sea ice index and the gridded fields are significantly correlated at≥80% significance levels for≥80% of the 21-years moving windows. The results remained qualitatively the same when the length of the moving window varies between 15 and 25 years. The statistical significance was determined using a standard t-test. This methodology has been successfully tested to predict the extent of Arctic sea ice in September (Ionita et al., 2019) and to identify stable predictors for paleoclimatology-related studies (Nagavciuc et al., 2020; Nagavciuc et al., 2022). A more detailed description of the stability-map approach can be found in (Ionita et al., 2008).
3 Results
3.1 Daily and monthly Antarctic sea ice extent
The year 2023 was characterized by negative SIE anomalies from January to December, especially over RS and WS. The daily evolution of the sea ice extent (SIE) anomalies throughout the austral winter of 2023 indicates some striking features. In May 2023, most of the negative SIE anomalies at the circumpolar Antarctic level were driven mainly by the daily SIE anomalies over the WS (Supplementary Figure S1). In June 2023, all the analyzed regions were characterized by daily negative SIE anomalies, especially in the RS and IO. The situation became very dramatic in July 2023, when the daily sea ice extent anomalies recorded negative values for all analyzed regions (Supplementary Figure S1), especially WS and RS (in the second part of July). At the hemispheric level, the lowest daily and monthly SIE anomalies were recorded at the beginning of July, 2023. Remarkably, on the sixth of July 2023, the daily SIE anomaly reached an unprecedented value of −2.78 million square kilometers (Figure 1A), while at monthly time scales, the SIE in July 2023 had a record-breaking value of −2.33 million square kilometers (Figures 1B,C). The extremely low SIE values over the Southern Hemisphere were driven by the low sea ice extent in the IO, RS, and WS (Supplementary Figure S1A). In August 2023, the extreme daily SIE anomalies continued to be at record low levels, with a SIE anomaly below −2.57 million square kilometers occurring in the middle of the month. From January to September 2023, all regions except ABS were characterized by negative daily SIE anomalies, with the lowest one in WS, especially from May until the end of July (Supplementary Figure S1A). The Antarctic Sea ice reached 17.16 million km2 on the 7 September, 2023, which is the lowest maximum extent ever observed in winter. This event was −880.000 km2 below the previous record from 18th of September, 1986. Most of the extreme SIE anomalies in August 2023 are due to WS and RS.
At monthly timescales, except for March 2023 (ranked as 2nd), April 2023 (ranked as the 3rd), November 2023 (ranked as the 2nd) and December 2023 (ranked as the 2nd), the SIE was ranked the lowest over the observational record (Figure 1C). The SIE was particularly low in WS, ranking as the lowest sea ice extent on records from April to November 2023 (Supplementary Figure S1B). For example, the average sea ice extent in June was approximately 1.1 million square kilometers less than the previous low recorded in 2022, and more than 2.3 million square kilometers below the long-term mean spanning the period 1981–2010. In July, the average sea ice extent was more than 2.4 million square kilometers below the long-term mean, while in August this pattern continued and the average sea ice extent was more than 2.2 million square kilometers below the long-term mean. On average, WS contributes approximately 40% of the SH sea ice extent (Supplementary Figure S2); thus, an extremely low SIE over this region in 2023 had a significant impact on hemispheric sea ice development.
Looking at the spatial pattern of the sea ice extent and the sea surface temperature from May to August 2023, some particular features emerge. From May to August 2023, a negative SIE of up to 60% was recorded in the RS, IO, and WS. The only exception was the ABS region, where positive SIE anomalies were observed (Figure 2—left column). The regions characterized by negative SIE anomalies are identical with the regions where positive SST anomalies of up to 3°C prevailed during the same period. In line with the SIE anomalies, negative SST anomalies were recorded over the ABS region, particularly in May, June, and August (Figure 2—right panel).
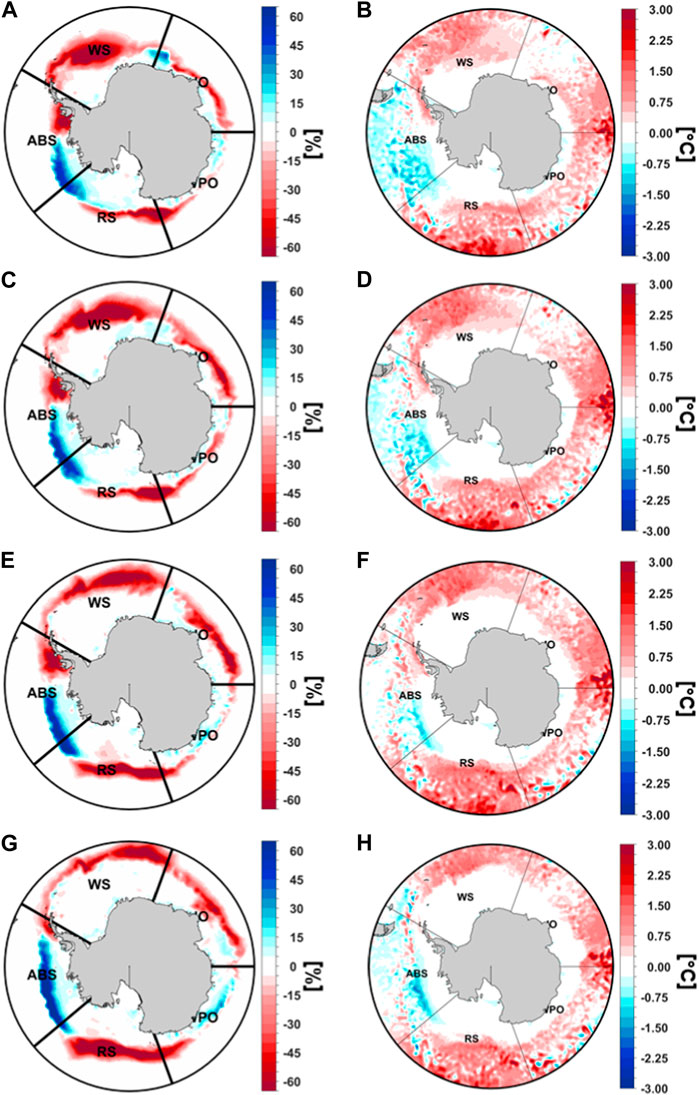
FIGURE 2. Sea ice extent anomalies (left column) and sea surface temperature (right column) in 2023 for: (A) and (B) May, (C) and (D) June, (E) and (F) July and (G) and (H) August. The anomalies are computed relative to the period 1981–2010. IO: Indian Ocean, PO: western Pacific Ocean; WS: Weddell Sea; RS: Ross Sea and ABS: Amundsen-Bellingshausen Sea. Units: SIE [%] and SST [°C].
3.2 Climatological features of the austral winter 2023
In May 2023, the prevailing large-scale atmospheric circulation featured positive SLP anomalies over the RS, flanked by negative SLP anomalies over the ABS and WPO (Figure 3A). This SLP pattern was associated with negative air temperature anomalies of up to −6°C over ABS, and positive air temperature anomalies of up to 8°C, over RS and WS (Figure 3B). The wave-like structure of the SLP anomalies allowed the advection of warm (Figure 4A) and moist air (Figure 4B), particularly over the RS, IO, and parts of the WS. The areas where intrusions of warm and humid air occurred were also the regions where the lowest sea ice extent was observed (Figure 2). In June 2023, the large-scale atmospheric circulation was similar to that in May 2023, with positive SLP anomalies over RS, flanked by negative SLP anomalies over ABS and the western part of the WPO, while positive SLP anomalies over WS and IO (Figure 3C). The SIE anomalies (Figure 2C) in June were reflected in the structure of the large-scale atmospheric circulation and the mean air temperature anomalies (Figure 3D), with the lowest SIE extent anomalies over WR, IO, and RS, where extreme high-temperature anomalies (−8°C in the WS and −6°C in RS) were observed. Again, this wave-like SLP pattern favored the advection of warm (Figure 4C) and moist air (Figure 4D) towards the coastal areas and the Antarctic continent, with the most affected regions being RS, WS, and IO.
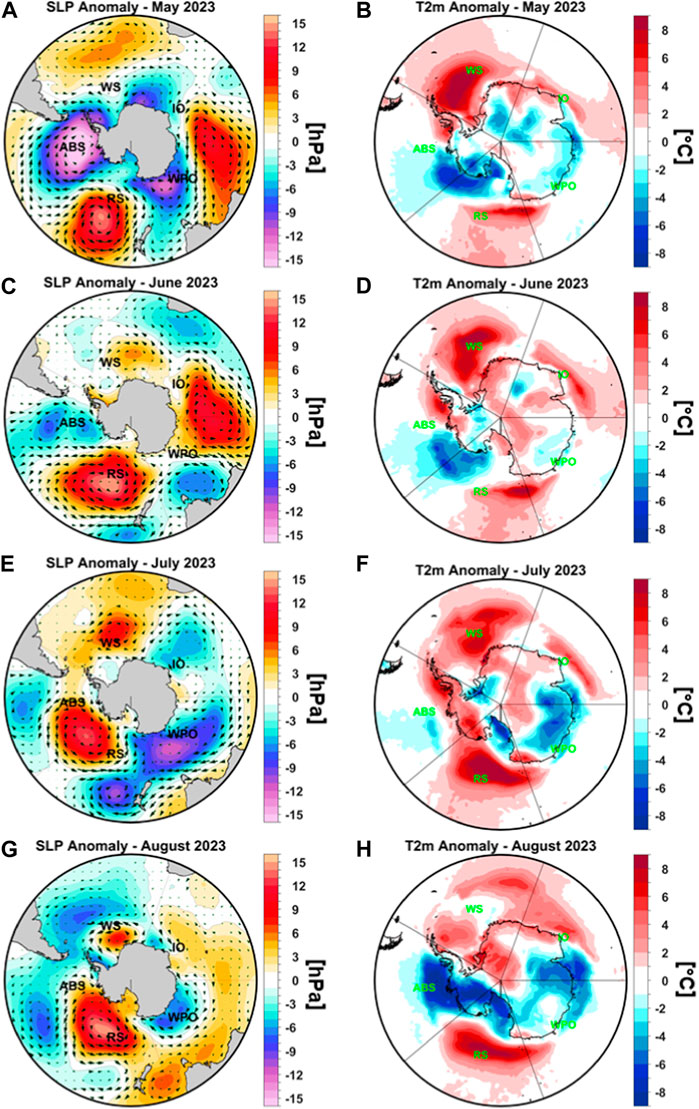
FIGURE 3. Sea level pressure (SLP) anomalies and the associated wind vectors (A,C,E, and G) and 2 m air temperature (T2m) anomalies (B,D,F, and H) from May until August 2023. The anomalies are computed relative to the reference period 1981–2010. Units: SLP [hPa] and T2m [°C].
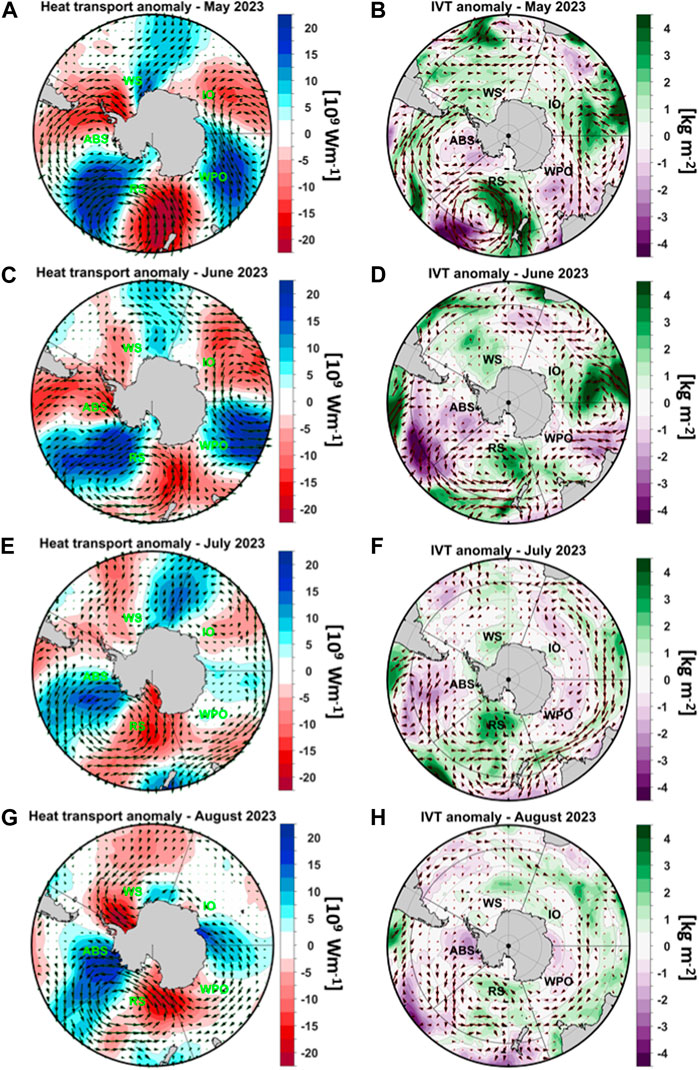
FIGURE 4. The vertical integral of northward heat flux (shaded areas) and the vertically integrated heat transport (vectors) (A,C,E, and G) and the vertical integral of water vapor anomalies (IWV, shaded areas) and the vertically integrated water vapor transport (WVT, vectors) (B,D,F, and H) from May until August 2023. The anomalies are computed relative to the reference period 1981–2010. In (A,C,E, and G) positive anomalies indicate northward advection and negative anomalies indicate southward advection. Units: northward heat flux [109 Wm-1] and IVT [kg m-2].
In July 2023, the positive SLP anomalies over RS persisted, but they shifted towards ABS, whereas over WPO, negative SLP anomalies were observed (Figure 3E). In addition, positive SLP anomalies were recorded over the WS. Compared with May and June 2023, the air temperature anomalies were much higher in magnitude, especially over the RS (i.e., up to 10°C). Negative but weak air temperature anomalies were recorded over the ABS and the eastern Antarctic Peninsula (Figure 3F), leading to the advection of warm (Figure 4E) and moist air (Figure 4F), especially over RS and WS. These warm and moist air intrusions led to rapid melting of the sea ice, and in July 2023 the lowest on record daily and monthly sea ice extent was observed (i.e., daily: −2.84 million square kilometers on the sixth of July 2023 and monthly: −2.33 million square kilometers). In August 2023, the large-scale atmospheric circulation was similar, to some extent, to that observed in July 2023, and it was characterized by positive SLP and air temperature anomalies over RS and WS (Figures 3G,H) and negative SLP and T2m anomalies over ABS and small regions over WPO. The spatial structure of the SLP anomalies led to the advection of warm and moist air over RS and WS (Figures 4G,H), thus leading to additional stress on sea ice development by hindering sea ice formation. Overall, the prevailing large-scale atmospheric circulation during the austral winter was characterized by a wavier flow, with positive and negative SLP anomalies altering, indicating the prevalence of a zonal wave number of 3. This particular SLP structure, in the form of zonal wave number 3, was also associated with the extremely low sea ice extent and enhanced warm and moist air intrusions towards the Antarctic peninsula in 2016 (Turner et al., 2017;Ionita et al., 2018).
Sea ice formation commences when ocean surface temperatures dip below freezing. Once established, further ice growth ensues through heat loss at the ice-ocean interface via conductive heat transfer or by the accumulation of snowfall on the ice surface. The interplay of these mechanisms dictates that sea ice formation is contingent upon both ocean surface temperature (SST) and surface air temperature (SAT), which together govern the magnitude and direction of energy flux between the ocean and the atmosphere. To gain a comprehensive understanding of the “direction” (i.e., from the atmosphere to the ocean or vice versa) of heat transfer, we also examined anomalies in sensible heat flux (SHF), a metric that quantifies the net transfer of energy between the surface and the atmosphere. Surface sensible heat flux anomalies from May to August 2023 (Supplementary Figure S3), which serve as an indicator of heat transfer between the Earth’s surface and the atmosphere, demonstrate that over regions with positive mean air temperature anomalies, particularly the Ross and Weddell Seas, the transfer of heat was done from the atmosphere to the ocean (e.g., positive SH anomalies in Supplementary Figure S3). Overall, the mean air temperature over RS and WS was −3 times higher than the corresponding SST anomalies over these regions. Positive SH anomalies over WS and RS prevailed from May to August 2023 (Supplementary Figure S3), and the enhanced heat fluxes exchange from the atmosphere to the ocean led to an increase in the SSTs, thus hindering the expansion of the sea ice.
3.3 Long-term context of the 2023 event
The extremeness of the persistent 2023 ice loss event was analyzed using ranking maps (Ionita et al., 2017; Bakke et al., 2020) for the sea ice extent, sea surface temperature, the 2 m mean air temperature, surface sensible heat flux and the total column of water vapor, from May to August 2023 (Figure 5). A comprehensive analysis of sea ice extent (SIE), air temperature (T2m), sea surface temperature (SST), and sensible heat flux (SHF) data from 1979 to 2023 reveals that 2023 exhibited exceptionally low SIE and warmth across the Weddell Sea (WS), Ross Sea (RS), and Indian Ocean (IO). Specifically, May 2023 registered the lowest SIE across various regions within the WS, RS, and IO, ranking among the top five lowest SIE years in an extended band within the WS (Figure 5A). These regions of reduced SIE also exhibited notable warmth, both at the ocean surface (SST) and at 2 m in the atmosphere (T2m), and experienced record-breaking wetness (Figures 5B,C,E). The analysis of T2m indicates that May 2023 was the warmest on record over expansive areas encompassing most of the WS, portions of the IO, and large parts of the Ross Sea. Similar findings emerged when examining the SST field (Figure 5B). Additionally, May 2023 emerged as the month with the strongest sensible heat flux from the atmosphere to the ocean over the RS and a small section of the WS and IO (Figure 5D). The spatial patterns of SIE minima in June 2023 (Figure 5F) and the warmest/wettest regions were largely consistent with those observed in May 2023 (Figures 5G,J). Similar to the patterns observed in May 2023, June 2023 witnessed a widespread expanse of exceptionally warm regions, with the RS, IO, and WS standing out as the warmest locations on record (Figure 5G). In July, the regions exhibiting record-breaking low SIE extended further than in May and June 2023, primarily centered on the central RS, central IO, and central WS (Figure 5K). These regions of record-low SIE coincided with the warmest SSTs, encompassing the entire southern hemisphere between −50°S and −70°S, with the exception of the WPO and ABS regions (Figure 5L). In terms of 2 m mean air temperature, the warmest regions on record were observed over the WS and portions of the RS (Figure 5M). August 2023 marked the month with the lowest SIE on record over the central RS and smaller areas within the WS and IO (Figure 5J). Moreover, both the sensible heat flux and the total column of water vapor over the RS reached record-breaking values (Figures 5N, O). The sea surface temperature in August 2023 was the warmest on record across the WS, IO, and RS, albeit with spatial extents smaller than those observed in June and July 2023 (Figure 5K). The same also holds true for the 2 m mean air temperature (Figure 5E), with the warmest regions focused over the WS and parts of the IO, as well as the central RS. Overall, the rank map analysis from May to August 2023 shows record-breaking low sea ice extent and high temperatures, with the most affected regions being the RS, WS, and IO. Compared to the 2016 event (Ionita et al., 2018), the record-breaking anomalies in 2023 are more spatially extended, especially over RS and WS, and the extremely low SIE and positive temperature anomalies persist throughout the entire analyzed period.
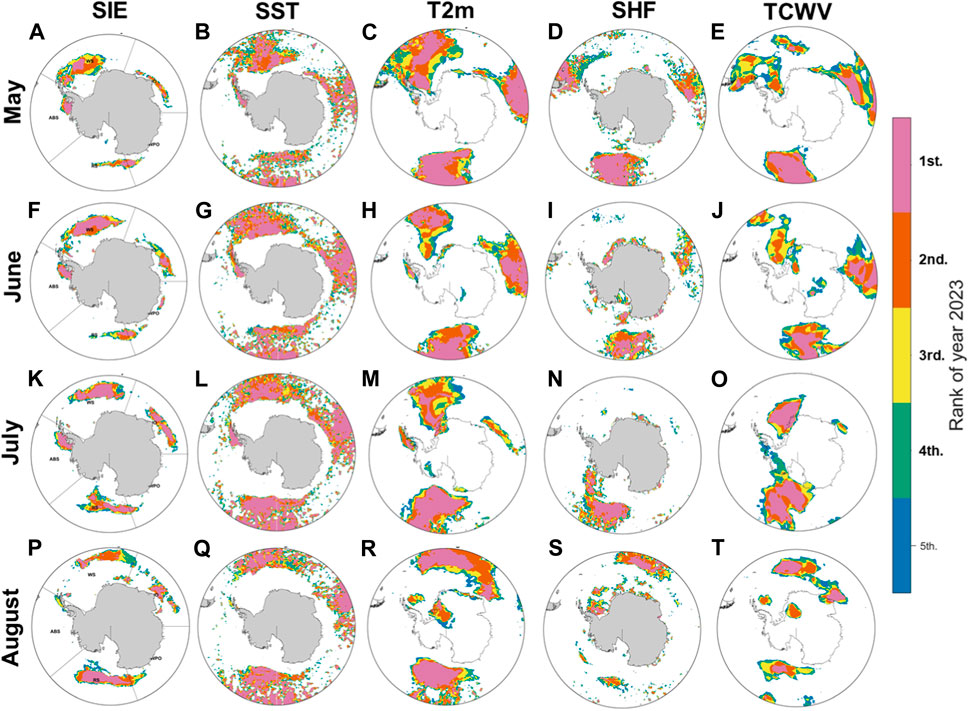
FIGURE 5. Ranking of 2023 (i.e., from May to August) monthly sea ice extent [SIE–(A, F, K, and P), “1” means lowest SIE over the analyzed period], monthly sea surface temperature [SST–(B, G, L, and Q), “1” means the warmest month over the analyzed period], monthly 2 m air temperature [T2m–(C, H, M, and R, “1” means the warmest month over the analyzed period]; monthly surface sensible heat flux [SHF–(D, I, N, and S), positive values mean downward fluxes] and the total column of water vapor [TCWV–(E, J, O, and T)]. The analyzed period is 1979–2023. Rankings below five appear white.
To assess the anomalous nature of the large-scale atmospheric drivers relative to other years/months with low sea ice extent, we calculated the monthly anomalies for sea level pressure (SLP) and heat and moisture transport for 2023 compared to previous low SIE years/months (see Table 1 for the years considered in this analysis). As evident from Figure 6, the most pronounced SLP and heat and moisture transport anomalies (in terms of magnitude) occurred over the Amundsen-Bellingshausen Seas (ABS) and Ross Sea (RS). Unlike other extreme low SIE years, a distinctive dipole-like pattern emerged in May and June 2023, characterized by negative SLP anomalies over the ABS and positive SLP anomalies over the RS. This configuration facilitated the advection of heat and moisture from the ocean towards the Antarctic continent, particularly over the Ross Sea (Figures 6 – second and last rows). Simultaneously, cold air advection from the continents was directed towards the ABS, which exhibited positive SIE anomalies. In June and August, the intensity of the Amundsen Sea Low weakened, allowing for the establishment of a large anticyclonic circulation extending from the RS to the ABS. This restructuring in atmospheric circulation further amplified the advection of heat and moisture across the entire RS (Figure 6—last two rows). Overall, compared to previous low SIE years, the anomalies in the large-scale atmospheric circulation in 2023 were concentrated specifically over the ABS and RS, coinciding with the record low sea ice extent anomalies observed over the RS throughout 2023. These findings/differences compared to other extreme years emphasize the profound influence of anomalous atmospheric circulation patterns and the spatial location of high and lows on the sea ice variability in the Southern Ocean.

TABLE 1. Years considered in the anomaly maps in Figure 6. The threshold for defining the low SIE is 0.75 standard deviation.
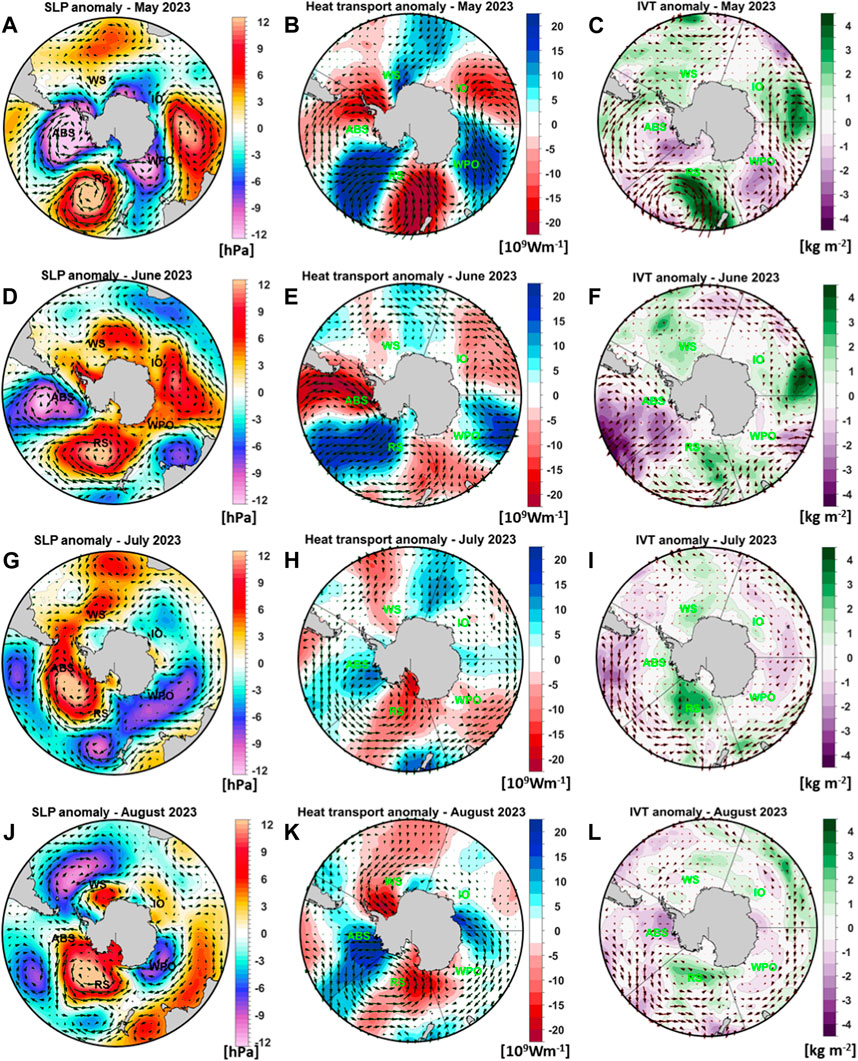
FIGURE 6. First column: Sea level pressure (SLP) anomalies and the associated wind vectors (A,D,G, J,G) from May until August 2023 relative the other extreme low SIE years/months (see Table 1 for more detail); middle column: as in the first column but for the vertical integral of northward heat flux (shaded areas) and the vertically integrated heat transport (vectors) (B,E,H, and K) and right column: as in the first column but for the vertical integral of water vapor anomalies (IWV, shaded areas) and the vertically integrated water vapor transport (WVT, vectors) (C,F,I, and L). In (B,E,H, and K) positive anomalies indicate northward advection and negative anomalies indicate southward advection.
3.4 The influence of the zonal wave 3 on the development of the sea ice extent in winter 2023
Previous studies have demonstrated that Antarctic sea ice development is significantly influenced by zonal asymmetries, including the zonal wave 1 (ZW1), the zonal wave 3 (ZW3), the Pacific-South American pattern (PSA), and the Amundsen Low, which are embedded within the zonal atmospheric circulation (Mo and Higgins, 1998; Raphael, 2004; Raphael et al., 2016; Holland et al., 2018; Goyal et al., 2022; Turner et al., 2022). While all of these patterns have been linked to sea ice variability in the Southern Hemisphere, ZW3 has been found to have a particularly strong impact on Antarctic sea ice extent (SIE), particularly during years of extreme sea ice conditions (low or high) (Raphael, 2004; Turner et al., 2017; Ionita et al., 2018; Goyal et al., 2022). ZW3 has preferred regions of meridional flow, allowing it to influence the sea ice development around Antarctica both dynamically and thermodynamically through the advection and transport of warm and cold air (Raphael, 2004). In this study, we analyze the state of the asymmetric circulation between May and August 2023 using a new zonal wave 3 index (Goyal et al., 2022), which incorporates both the amplitude and phase of ZW3. Figure 7 depicts the amplitude (Figure 7A) and phase (Figure 7B) of the monthly ZW3 index from 1979 to 2023. As can be observed in Figure 7A, the magnitude of ZW3 is exceptionally high during years of extreme low sea ice extent, such as 2016 and 2023 (i.e., above 2 standard deviations). The 2023 ZW3 index averaged from May to August was 2.16, the second strongest value recorded over the period 1979–2023. Figure 8 (left column) displays the meridional wind anomalies at 500 mb between May and August 2023, while Figure 8 (middle column) shows the differences in 500 mb meridional wind anomalies between 2023 and 2016. We focus on the V500 anomalies, since the meridional wind at 500 mb was used to compute the phase and magnitude of the ZW3 index (Goyal et al., 2022). The most pronounced meridional wind anomalies are observed in the Ross and Weddell Seas (RS and WS), coinciding with the observed record low sea ice extent over these regions in 2023. The gradient between negative and positive 500 mb meridional wind anomalies, associated with the zonally asymmetric flow, is linked to heat and moisture advection towards the sea ice edge (see Figure 3). Areas with negative sea ice anomalies (Figure 2, right panel) tend to align with southward wind anomalies, while areas with positive sea ice anomalies align with northward wind anomalies.
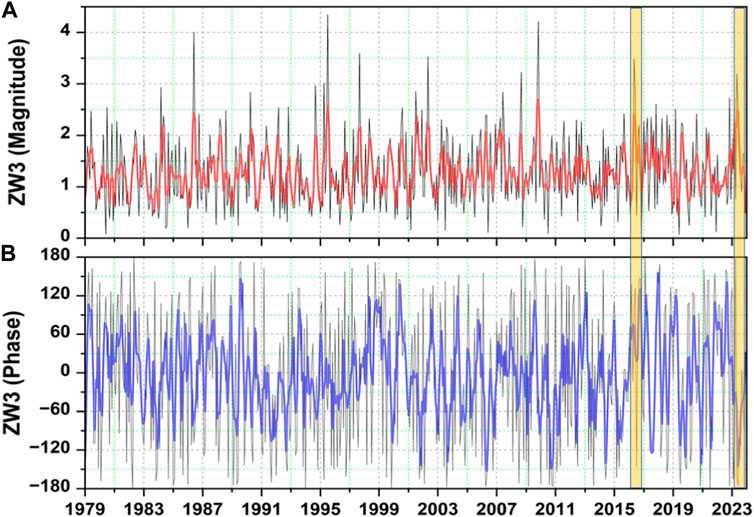
FIGURE 7. (A) The monthly ZW3 index magnitude (black line) and the 3-month running mean (red line) and (B) the ZW3 index phase (gray line) and the 3-month running mean (blue line). Analyzed period: 1979–2023. The magnitude and phase of ZW3 index has been computed flowing the methodology of (Goyal et al., 2022).
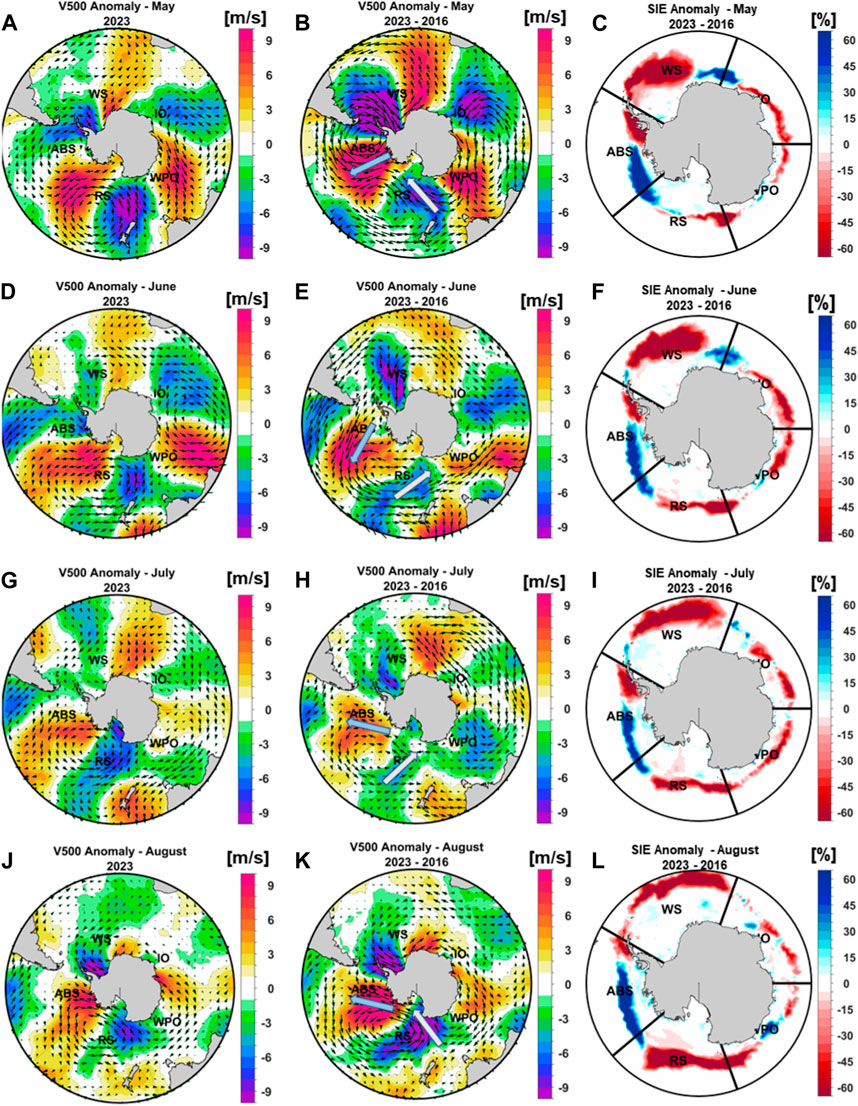
FIGURE 8. First column (A, D, G, and J): 500-hPa meridional wind (V500, shaded colors) anomaly for the period May to August 2023; Second column (B, E, H, and K): the difference in the 500-hPa meridional wind anomaly between 2023 and 2016 from May until August and Third column (C, F, I, and L): the difference in the sea ice extent between 2023 and 2016 from May until August. In the first and second column the black arrows indicate the direction of the wind at 500 mb level.
The meridional wind at 500 mb is significantly stronger in 2023 compared to 2016, particularly over the Amundsen-Bellingshausen Seas (ABS) and the RS and WS regions, where positive (negative) SIE anomalies were observed between May and August 2023 relative to 2016 (Figure 8, right column). In 2016, a persistent positive ZW3 index from May to August contributed to low sea ice extent over the ABS and Indian Ocean (IO), in addition to the RS and WS (Ionita et al., 2018). While the magnitudes of the ZW3 index in 2016 and 2023 are similar (Figure 7A), there is a distinct shift in the phase of ZW3 between these two events (Figure 7B). The V500 anomalies in 2016 resemble a negative phase of ZW3, while the V500 anomalies in winter 2023 resemble a positive phase of ZW3 (Figure 7B; Figure 8). Not only the wind magnitude, but also the direction significantly influences the sea ice formation (Hobbs et al., 2016). The dynamic relationship between wind direction and sea ice formation, with respect both to climatology and the 2016 event, is evident especially in May and June 2023 (Figure 7). The regions characterized by sea ice loss (e.g., RS, WS and IO) coincide with anomalously strong northerly winds, while the regions characterized by sea ice gain (e.g., ABS) coincide with strong southerly winds. These finding are consistent with the recent study by Goyal et al. (2022), which suggests that the phase of ZW3 and the magnitudes of its action centers are crucial factors driving SIE variability.
3.5 Long term relationship between regional Antarctic sea ice and large-scale atmospheric circulation
As shown in Section 3.2 and Section 3.4, from May until August 2023, the large-scale atmospheric circulation was characterized by the prevalence of typical patterns (e.g., zonal wave number 3), which favored the advection of warm and moist air towards the coastal areas of the Antarctic Peninsula, especially over the RS, WS, and IO regions. Overall, different processes driven by large-scale atmospheric circulation can lead to sea ice melting (e.g., winds influence the development of sea ice through the advection of heat, moisture, and/or mechanical transport). Because most of the contribution to the hemispheric sea ice extent comes from the WS and RS (Supplementary Figure S2), we will examine the large-scale atmospheric circulation associated with the low sea ice extent for these two regions over the period 1979–2023. The analysis is focused on the austral winter, and low sea ice extent was defined as the month/year when the regional SIE time series was lower than −0.75 standard deviation.
The low sea ice extent in May over RS is associated with positive SLP anomalies over RS and the western part of ABS (Figure 9—first column), which favored the advection of warm and moist air towards the RS, leading to air temperature anomalies of −3°C over the entire RS. In June, low SIE values over the RS are associated with a wave-like SLP pattern, characterized by positive SLP anomalies over the RS and ABS, flanked by negative SLP anomalies over the eastern RS and WPO and positive SLP anomalies over the IO (Figure 9—second column). The positive SLP anomalies over ABS and over the RS, indicative of a weakened Amundsen Sea Low, are also associated with temperature anomalies of up to 3°C over the RS and advection of warm and moist air, especially over the central RS. The warm and moist air advection can melt the sea ice, especially at the edge, while the surface winds associated with the SLP anomalies over the RS can push the sea ice towards the continent. In July, the low SIE over RS is associated with similar SLP and air temperature anomalies as in the case of June (Figure 9—third column). Again, the positive SLP anomalies over the RS flanked by negative SLP anomalies over the WPO and ABS favor the advection of warm and moist air towards the central RS. In August, the large-scale atmospheric circulation associated with low SIE has a different spatial structure featuring negative SLP anomalies in the south Pacific and positive SLP anomalies over RS, ABS, and IO (Figure 9—fourth column). Positive (negative) SLP anomalies over RS (Antarctic Peninsula) are associated with low SIE over RS, as well as with positive (negative) air temperature anomalies and the advection of warm and moist air from the lower latitudes towards RS. The dipole-like structure between the positive SLP anomalies over the RS and ABS and negative SLP anomalies over the eastern Peninsula pushes the sea ice towards the continent.
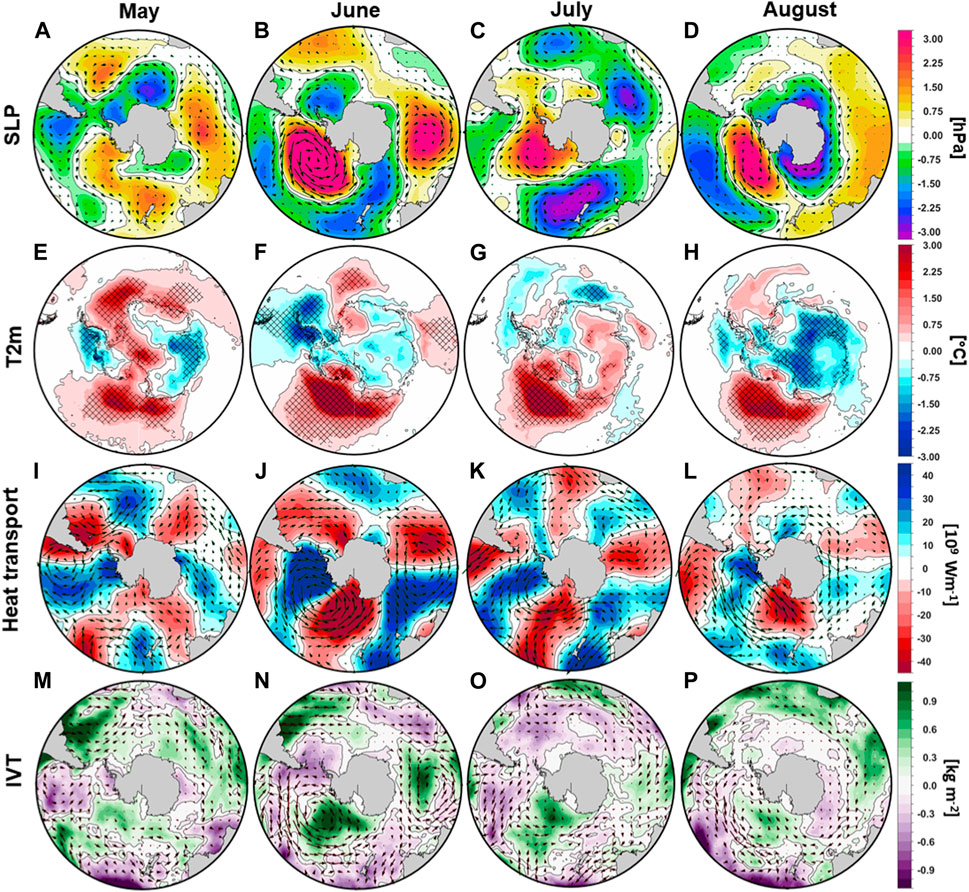
FIGURE 9. Composite large-scale circulation anomalies for the years with regional sea ice extent anomalies over the Ross Sea (RS) < −0.75 standard deviation. First raw (A, B, C, and D): Sea level pressure (SLP) anomalies associated with low sea ice extent over the RS from May until August; Second raw (E, F, G, and H): the same as in the first raw but for the 2 m mean air temperature; Third row (I, J, K, and L): as in the first row but for the vertical integral of northward heat flux (shaded areas) and the vertically integrated heat transport (vectors) and Fourth row (M, N, O, and P): as in the first but for the vertical integral of water vapor anomalies (IWV, shaded areas) and the vertically integrated water vapor transport (WVT, vectors). Units: SLP [hPa]; T2m [°C]; northward heat flux [109 Wm-1] and IVT [kg m-2].
While the composite map anomalies consider only the months with low SIE and the length of the SIE is rather short (i.e., −44 years), we also computed the stability maps between the SIE over RS and WS and gridded fields of SLP, mean air temperature, HV, and IVT. The aim of the stability map analysis is to determine whether there are any preferred regions in which the relationship between the regional SIE and atmospheric circulation variables remains stable over time. A similar methodology was previously used to analyze the relationship between the Arctic and Antarctic sea ice extent and large-scale drivers (Ionita et al., 2018; Ionita et al., 2019). In the case of the Ross Sea, the most important regions contributing to SIE variability, both in terms of SLP and T2m, are situated over the ABS (for SLP) and RS (for t2m) (Figures 10A,B). The correlation between the regional RS sea ice extent and SLP and T2m remained stable over time from May (Figure 10—left column) until July (Figure 10—third column). It is also worth mentioning that the previous months of SLP/T2m over ABS and RS showed significant and stable correlations with SIE over RS. In the case of the meridional component of the heat transport, the most important regions for the variability of the regional SIE over RS are the ABS and RS regions, but the correlation is significant mainly for the in-phase case from May to July. For August, the northward heat transport contributes mainly at a lag of 1-month, with the heat transport leading the sea ice extent (Figures 10—fourth column). In the case of IVT, most of the contribution comes from RS, with an in-phase relationship in June and July and 1-month lag for the SIE in August. Overall, the stability map analysis indicates that in the case of SLP and T2m, the contribution to the regional SIE over RS is important, especially from June to August, both in phase and with a 1-month lag (with the large-scale drivers leading the regional SIE development), with ABS and RS acting as the most important driving regions of sea ice extent variability.
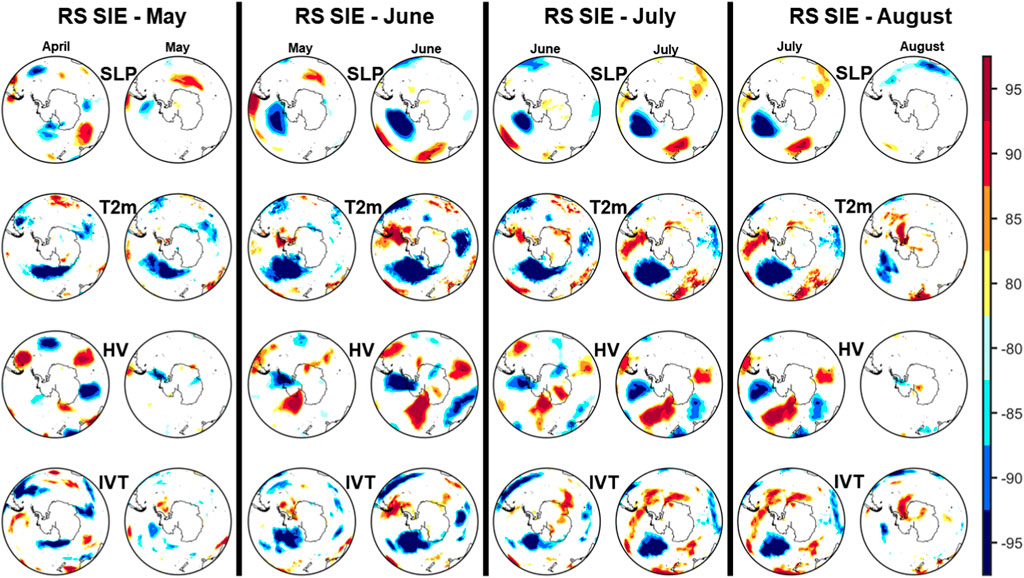
FIGURE 10. The stability maps between the monthly RS sea ice extent and SLP, T2m, HV and IVT from May until August for 1-month lag (i.e., the large-scale drivers leading the sea ice extent time series) and in-phase. The regions where the correlation is positive and stable are represented as dark red (95% significance level), red (90% significance level), orange (85% significance level), and yellow (80% significance level) and the regions where the correlation between the regional SIE index and the large-scale gridded data is stable and negative are represented as dark blue (95% significance level), blue (90% significance level), green (85% significance level), and light green (80% significance level) on the stability maps.
In the case of WS, the large-scale drivers of the regional SIE feature different spatial patterns compared to those of RS (Figure 11). In May and June (Figure 11—first and second columns), low SIE over the WS is associated with a Rossby-wave-like pattern in the SLP spatial structure, characterized by negative SLP anomalies over the Amundsen Sea, positive SLP anomalies over the WS and IO, negative SLP anomalies over the western WPO and eastern RS, and positive SLP anomalies over the central RS. This pattern occurs in connection with positive air temperature anomalies over RS and WS and negative air temperature anomalies over ABS and the eastern part of the Antarctic continent. The Rossby-wave like structure of the SLP anomalies favors the advection of heat and moisture over the WS and eastern RS, which in turn leads to reduced sea ice extent over these regions. In July (Figures 11—third column), the reduced SIE over the WS is associated with negative SLP anomalies over the Bellingshausen Sea extending over the RS and WPO and positive but weak SLP anomalies over the WS and IO. The dipole-like structure between the Bellingshausen Sea (negative SLP anomalies) and WS (positive SLP anomalies) favors the advection of heat (i.e., temperature anomalies of up to 3°C) and moisture from lower latitudes, which in turn can enhance surface melting and contribute to an overall reduction in sea ice extent. In August (Figures 11—fourth column), the reduced regional SIE over WS is driven by negative SLP anomalies over ABS and western WS and eastern RS and a center of positive SLP anomalies over the WPO and IO. These SLP anomalies are corroborated with positive temperature anomalies of up to 3°C over WS and over Droning Maud Land, flanked by negative temperature anomalies over ABS and WPO and over Marie Byrd Land and Victoria Land. As in the case of previous months, low SIE over WS, in August, is also influenced by the advection of heat and moisture from the lower latitudes, which can act to enhance sea ice melting, especially over the region situated on the SLP gradient, in this case the Weddell Sea.
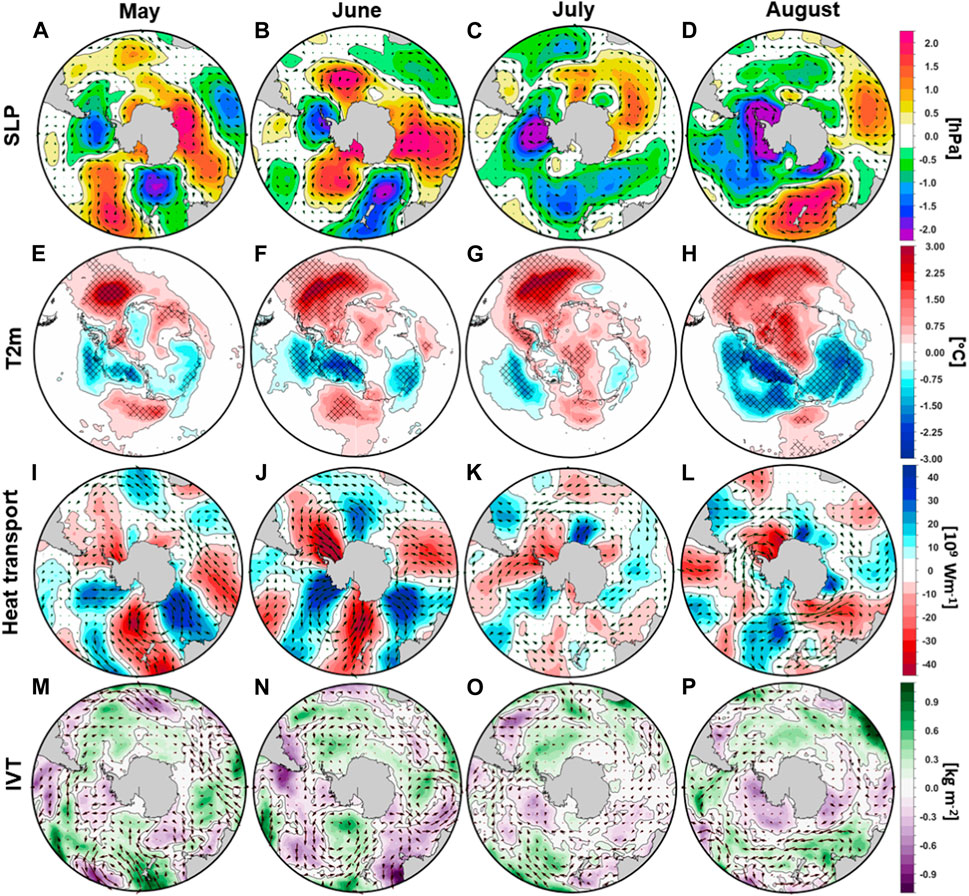
FIGURE 11. Composite large-scale circulation anomalies for the years with regional sea ice extent anomalies over the Weddell Sea (WS) < −0.75 standard deviation. First raw (A, B, C, and D): Sea level pressure (SLP) anomalies associated with low sea ice extent over the WS from May until August; Second raw (E, F, G, and H): the same as in the first raw but for the 2 m mean air temperature; Third row (I, J, K, and L): as in the first row but for the vertical integral of northward heat flux (shaded areas) and the vertically integrated heat transport (vectors) and Fourth row (M, N, O, and P): as in the first but for the vertical integral of water vapor anomalies (IWV, shaded areas) and the vertically integrated water vapor transport (WVT, vectors). Units: SLP [hPa]; T2m [°C]; northward heat flux [109 Wm-1] and IVT [kg m-2].
With regard to the strength of the relationship between the SIE over the WS and the large-scale drivers (Figure 12), the stability maps indicate that the most stable relationship is observed with the mean air temperature over the Bellingshausen Sea (positive and stable correlation) and over the WS (negative and stable correlations) (Figure 12—second row). The relationship between the WS sea ice extent and the mean air temperature is stable and significant both in-phase as well as at 1-month lag (i.e., with temperature leading the SIE). For the other variables (i.e., SLP, HV, and IVT), stable and significant correlations were found mainly in August for IVT, in the form of a dipole-like structure between ABS and WS, while positive and stable correlations with SLP were found over the Bellingshausen Sea.
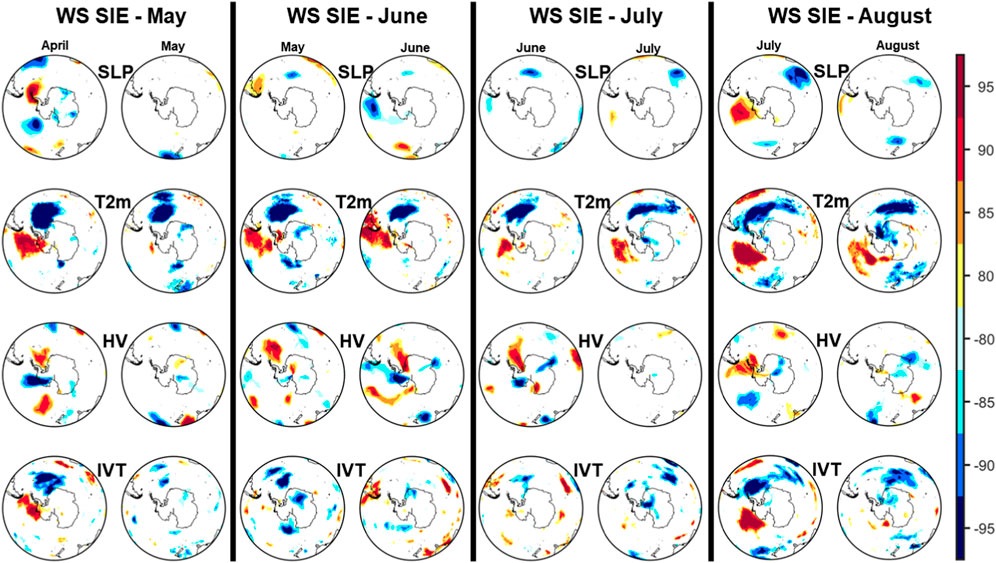
FIGURE 12. The stability maps between the monthly WS sea ice extent and SLP, T2m, HV and IVT from May until August for 1-month lag (i.e., the large-scale drivers leading the sea ice extent time series) and in-phase. The regions where the correlation is positive and stable are represented as dark red (95% significance level), red (90% significance level), orange (85% significance level), and yellow (80% significance level) and the regions where the correlation between the regional SIE index and the large-scale gridded data is stable and negative are represented as dark blue (95% significance level), blue (90% significance level), green (85% significance level), and light green (80% significance level) on the stability maps.
Based on the relationship between the regional SIE and mean air temperature identified using the stability map analysis (Figure 10; Figure 12), we defined two air temperature indices averaged over the regions where the correlation remained stable and significant over the analyzed period, namely: (175°W–110°W, 75°S–45°S) and (45°W–25°W, 75°S–40°S) as indicators for the temperature variability and change for the RS and WS, respectively. The monthly temperature anomaly over the RS is correlated with the hemispheric sea ice extent at r = −0.29 (p<0.05), and the smoothed time series (i.e., loess smoothing) was correlated at r = −0.41 (p<0.01). While the monthly hemispheric sea-ice extent time series shows a regime shift around 2015, such a regime shift is not visible in the temperature time series averaged over the RS (Figure 13A). The difference in the hemispheric sea ice extent between (1979–2014) and (2015–2023) is approximately −0.5 106km2 (Figure 15A), which is statistically significant (p<0.001, based on a two-sample Wilcoxon rank test). The regionally averaged temperature time series over RS is also significantly correlated with the regional SIE time series over RS (r = −0.54 (p<0.01), while for the smoothed time series, the correlation coefficient had a value of r = −0.76 (p<0.01) (Figure 13B). In contrast to the hemispheric sea ice extent time series, the regional SIE over RS does not capture a change point throughout the analyzed period, indicating that the changes and the observed decline in the hemispheric SIE observed over the last few years are driven by the variability of SIE over other regions. For the RS, there is a change of −0.2°C for the mean air temperature and −0.16 106km2 for the RS sea ice extent between the two analyzed periods (i.e., (1979–2014) and (2015–2023)), but these changes are not statistically significant (Figures 15B,C).
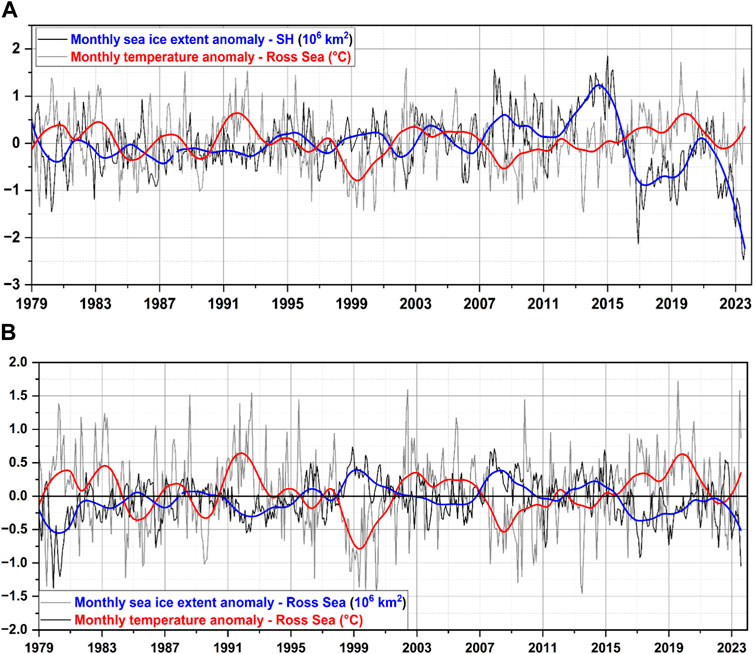
FIGURE 13. (A) The temporal evolution of the monthly sea ice extent at hemispheric level (black line) and the temporal evolution of the monthly mean temperature anomalies averaged over the Ross Sea (grey line) and their corresponding low-pass filter (i.e., loess) (blue line for SIE and red line for T2m) and (B) The temporal evolution of the monthly sea ice extent (black line) and the monthly mean temperature anomalies averaged over the Ross Sea (grey line) and their corresponding low-pass filter (i.e., loess) (blue line for SIE and red line for T2M).
The monthly temperature anomaly over WS is correlated with the hemispheric SIE at r = −0.30 (p<0.05) for the raw time series, while for the smoothed time series, the correlation is r = −0.56 (p<0.01) (Figure 14A). The regionally averaged temperature over WS also shows a regime shift, towards higher temperature around 2015, at the same time when a regime shift towards lower sea ice extent was captured for the hemispheric sea ice extent. The temperature change over the WS between the two analyzed periods was −0.43°C (p<0.001), which is more than two times higher than that over the RS (Figure 15D). At the regional level, the raw time series of the mean air temperature anomaly averaged over the WS was significantly correlated with the regional SIE over the WS (r = −0.54, p<0.01), while for the smoothed time series, the correlation increased to r = −0.75 (p<0.01) (Figure 14B). In line with the hemispheric sea ice extent time series and the regional average temperature time series over the WS, the regional sea ice extent time series of the WS also shows a change point around 2015. Thus, the observed decline in the hemispheric sea-ice extent can be partly explained by the observed decline in the WS sea-ice extent and the increase in the mean air temperature over this region. This is in line with the fact that the WS sea ice extent contributed the most (i.e., between 35% and 45%) to the overall hemispheric sea ice extent variability (Supplementary Figure S2).
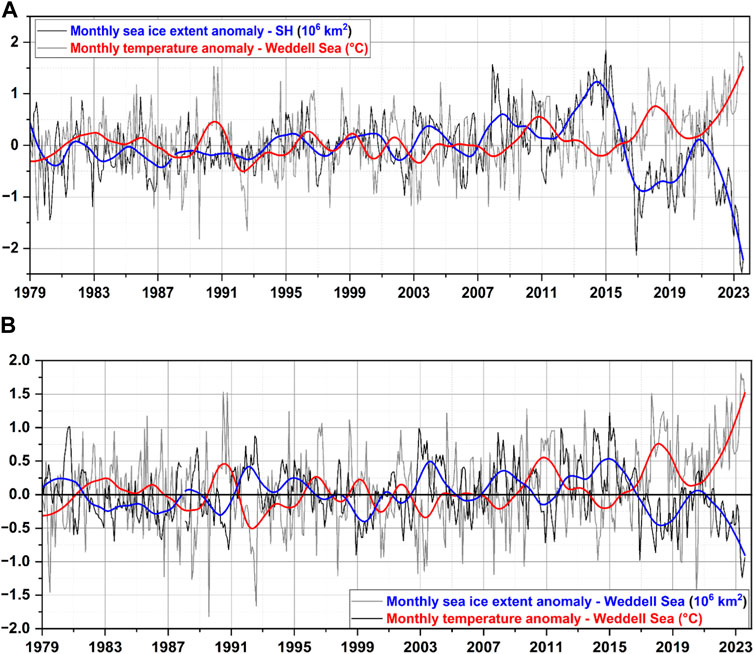
FIGURE 14. (A) The temporal evolution of the monthly sea ice extent at hemispheric level (black line) and the temporal evolution of the monthly mean temperature anomalies averaged over the Weddell Sea (grey line) and their corresponding low-pass filter (i.e., loess) (blue line for SIE and red line for T2m) and (B) The temporal evolution of the monthly sea ice extent (black line) and the monthly mean temperature anomalies averaged over the Weddell Sea (grey line) and their corresponding low-pass filter (i.e., loess) (blue line for SIE and red line for T2M).
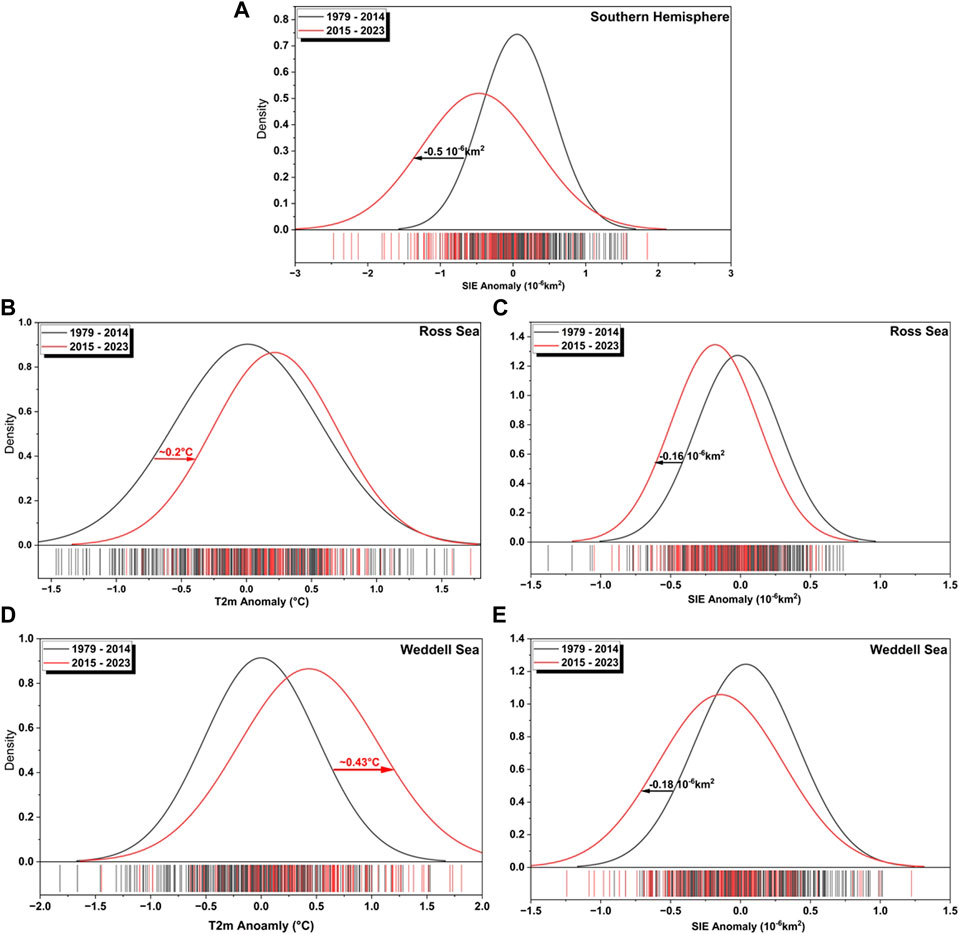
FIGURE 15. The probability density function for the hemispheric and regional sea ice extent and the regionally averaged mean air temperature over two different periods: 1979–2014 and 2015–2023, respectively. (A) The monthly hemispheric sea ice extent (SH); (B) The monthly regionally average mean air temperature over the Ross Sea; (C) The monthly regional sea ice extent averaged over the Ross Sea; (D) The monthly regionally average mean air temperature over the Weddell Sea and (E) The monthly regional sea ice extent averaged over the Weddell Sea; The statistical significance of the differences between the two analyzed periods has been tested based on the Wilcoxon rank test. The bars indicated the monthly anomalies for each variable. Each bar indicates a value, and the color indicates to which period the value belongs (i.e., 1979–2014 or 2015–2023). It can be observed that more red bars are observed towards the positive (negative) part of the x-axis for the mean air temperature (SIE).
4 Discussion
In stark contrast to Arctic sea ice, the Antarctic sea ice, as observed by satellite measurements over the past 4 decades, displayed a different pattern. Contrary to the Arctic’s decreasing trend, Antarctic sea ice demonstrated a continuous increase until 2015, (Parkinson, 2019; Eayrs et al., 2021; Suryawanshi et al., 2023), marking a notable divergence in polar ice behaviors. While the upward trend in Antarctic sea ice until 2015 was relatively modest, it presented some difficulty when trying to contextualize it within the broader framework of global warming. However, in March 2017, the Antarctic sea ice abruptly declined to 2 million square kilometers, which was 27% below the average annual minimum, raising questions about the significance of the earlier increasing trend (Comiso et al., 2017). The observed behavior of Antarctic sea ice can be partly attributed to natural climate fluctuations, as discussed by (Meehl et al., 2016; Li et al., 2021), which are linked to various factors and drivers, including atmospheric temperature or wind stress (Liu et al., 2004; Holland et al., 2012), precipitation (Liu and Curry, 2010), ocean temperature (Li et al., 2021), and feedback mechanisms within the atmosphere or ocean (Stammerjohn et al., 2012). However, recent research suggests that long-term influences on Antarctic sea ice may originate from the tropical Atlantic and tropical Pacific (Li et al., 2015; Li et al., 2021), further complicating our understanding of this complex phenomenon.
In the current study, we focused mainly on the influence of large-scale atmospheric circulation on the recent decline in the sea ice extent in the Antarctic region. On short to medium timescales, ranging from days to months, sea ice formation and movement are primarily dictated by atmospheric conditions, expanding during cold air periods, and being shaped by prevailing winds (Hobbs et al., 2016). In contrast, for long-term variations and changes in sea ice, the underlying ocean conditions play a pivotal role in influencing sea ice behavior. We also focused part of the study on the variability and drivers of the low sea ice years in the Weddell Sea and Ross Sea, because these two regions contribute the most to the overall sea ice variability and change in the Southern Hemisphere.
The mean sea-level pressure pattern for May and June 2023 also resembles a strong Pacific South America pattern (PSA), which represents a teleconnection pattern to the tropical regions. The strong convection in the Indo-Pacific regions generates a Rossby-wave-like pattern that propagates poleward, bringing heat and moisture from the tropics towards the Antarctic continent (Mo and Higgins, 1998; Irving and Simmonds, 2016). The PSA pattern tends to be strong during La Niña conditions, which have prevailed over the last few years in the Pacific Basin, and could partially explain the low sea ice conditions from 2016 onwards. Nevertheless, on intraseasonal timescales PSA is not directly related to ENSO or SAM (Kohyama and Hartmann, 2016) and even though El Niño-like condition prevailed in 2023, the sea surface temperature was extremely high over the West Pacific and the maritime continent, in May and June 2023, which could have acted as a convection source and triggered the development of a PSA-like pattern (Mo and Higgins, 1998).
In addition to the zonal wave 3 pattern, the variability of the sea ice extent over the Southern Hemisphere can be attributed to other climate modes of variability, such as ENSO, SAM, ASL, and the Pacific South American teleconnection pattern, as well as to oceanic drives such as ice drift, ocean currents, and surface and subsurface ocean temperatures (Hobbs et al., 2016). In contrast to the 2016 event (Turner et al., 2017; Ionita et al., 2018), when SAM was considered one of the main drivers of the extremely low sea ice extent in that year, in 2023 SAM did not show any extreme behavior (e.g., in terms of magnitude), being in its positive phase in January, February, May, and August and in its negative phase in March, April, June, and July. The 2022 sea ice minimum has been attributed to a combination of La Niña conditions and a positive SAM, which in turn strengthened the ASL (Turner et al., 2022). Thus, the drivers of the 2016 and 2022 extreme events are rather different when compared to the record minimum in 2023, considering that SAM has been oscillating between the positive and negative phases from January to August 2023, without any exceptional magnitude, and instead of La Niña conditions, such as in 2022, the current absolute sea ice minimum has occurred under El Niño-like conditions and a strong PSA pattern. These differences indicate that the current changes observed in the variability of the sea-ice extent over the Southern Hemisphere are driven by complex factors, and they differ from one event to another.
In a recent study, (Purich and Doddridge, 2023), showed that ocean warming over the last 7 years has pushed Antarctic sea ice into a new low-extent state. Although the influence of the ocean circulation is beyond the scope of the current paper, in line with the study by (Purich and Doddridge, 2023) we also examined the variability and changes in subsurface temperature in the upper 100 m over each of the five analyzed regions (Supplementary Figure S4). The most striking feature of this analysis is that over the WS and WPO, there has been an increase in the subsurface ocean temperature since 2015, and the smoothed data show the same variability as the observed sea ice extent and the mean air temperature over the WS (Supplementary Figure S5). For the other analyzed regions (i.e., ABS, IO, and RS) no significant changes have occurred over the past years (Supplementary Figure S4). The season with the lowest sea ice extent in the WS, as a function of subsurface temperature, occurred mainly after 2015, with the summer of 2023 (June-July-August) as the season with the lowest sea ice extent on record and the highest subsurface temperature (Supplementary Figure S6). Thus, the combined effect of increasing mean air temperature and the prevalence of zonal wave number 3 corroborated with a significant increase in the subsurface ocean temperature, might be the leading cause of the regime shift observed in Antarctic sea ice since 2016. One has to mention that the significant increase in subsurface ocean temperatures and a concurrent decline in the sea ice extent in the Antarctic region can also influence the mean air temperature. Nevertheless, without model experiments it is difficult to quantify the exact contribution of the large-scale atmospheric and the ocean circulation to the recent sea ice decline and the increased temperature over the Antarctic region. Despite the advancements in climate modeling, accurately determining the relative contributions of the large-scale atmospheric circulation and the ocean dynamics to the recent decline in Antarctic Sea ice remains a challenging task. This complexity stems from the intricate interactions between these two systems, which influence sea ice formation and melt through a multitude of mechanisms.
In this study, we focused only on the prevailing large-scale atmospheric circulation associated with low sea ice conditions from May until August 2023, as well as on the large-scale drivers associated with low sea ice conditions in the Weddell and Ross Seas over the period 1979–2023. To obtain a full picture of the current observed changes over the Antarctic region and their driving factors, specially designed model experiments are needed (e.g., simulations that isolate the effects of natural variability by holding greenhouse gas concentrations constant and focusing on the dynamic response of sea ice to changes in atmospheric circulation patterns or simulations with finer grid spacing to capture finer-scale variability in sea ice distribution, thickness, and melt rates, enabling a more detailed assessment of localized processes) (Roach et al., 2020), which are beyond the scope of this study.
5 Conclusions
Based on the analysis presented in the previous sections, the following main conclusions can be drawn:
➢ The total Antarctic SIE reached a record low level throughout 2023 in response to the prevalence of negative sea ice anomalies over the last few years in most sectors of the continent, except ABS. The highest contribution to the 2023 low sea ice came from the Weddell Sea, and the sea ice extent over this region was ranked as the lowest sea ice extent on records from April to October 2023. Similar results have been reported by (Zhang et al., 2022) who showed that the persistent sea ice decline over the period 2016–2021 mainly occurred in the Weddell Sea, which is a region that is also sparsely covered by Argo observations compared to other regions in the Southern Hemisphere, thus potentially hindering a proper analysis of the influence of the subsurface ocean temperature on sea ice variability.
➢ The zonal wave number 3 (ZW3) pattern, characterized by a wave-like pattern of alternating low- and high-pressure anomalies, had a significant impact on sea ice development. ZW3 is associated with a reduced sea ice extent due to the increased advection of warm and moist air from lower latitudes towards the pole. In 2023, the ZW3 pattern was particularly strong in May and June, which contributed to the record low sea ice extent. ZW3 has previously been associated with a reduced sea ice extent due to the increased advection of warm and moist air from lower latitudes towards the pole (Ionita et al., 2018; Eayrs et al., 2021). Over the areas situated on the gradient between the positive and negative SLP centers (i.e., RS and WS), the temperature anomalies reached values of up to ∼8°, and the heat and moisture transport from the low latitudes towards the Antarctic continent intensified.
➢ From a long-term perspective the hemispheric SIE, in 2023, was ranked the lowest over the observational record, except in March, April, November and December. The situation in 2023 was exceptional over large parts of the Southern Hemisphere, with the 2 m mean air temperature, sea surface temperature, sensible surface heat flux, moisture content and the sea ice extent reaching unprecedented levels, especially over RS and WS.
Overall, from a climatic point of view, 2023 stands as a pivotal moment in our understanding of Earth’s polar regions and the intricate interplay between climate change and its consequences. As different studies continue to unravel the complex web of factors contributing to the recent decline in Antarctic sea ice extent (Parkinson, 2019; Purich and Doddridge, 2023; Suryawanshi et al., 2023), it is imperative that policymakers and society as a whole take heed of these developments, recognizing the urgent need for collective action to mitigate the drivers of climate change and protect the fragile ecosystems of polar regions. The events of 2023 serve as a stark reminder of the profound and far-reaching impacts of climate change on the planet’s most remote and pristine regions.
Data availability statement
The data that support the findings of this study are available from the corresponding author upon reasonable request. No data were produced during this study. All datasets used are available online and referred throughout the article.
Author contributions
MI: Conceptualization, Data curation, Formal Analysis, Funding acquisition, Investigation, Project administration, Resources, Software, Supervision, Validation, Visualization, Writing–original draft.
Funding
The author(s) declare that no financial support was received for the research, authorship, and/or publication of this article.
Acknowledgments
MI was supported by the Helmholtz Association through the joint program “Changing Earth-Sustaining our Future” (PoF IV) program of the AWI and by the Helmholtz Climate Initiative “REKLIM”.
Conflict of interest
The author declares that the research was conducted in the absence of any commercial or financial relationships that could be construed as a potential conflict of interest.
The author declared that they were an editorial board member of Frontiers, at the time of submission. This had no impact on the peer review process and the final decision.
Publisher’s note
All claims expressed in this article are solely those of the authors and do not necessarily represent those of their affiliated organizations, or those of the publisher, the editors and the reviewers. Any product that may be evaluated in this article, or claim that may be made by its manufacturer, is not guaranteed or endorsed by the publisher.
Supplementary material
The Supplementary Material for this article can be found online at: https://www.frontiersin.org/articles/10.3389/feart.2024.1333706/full#supplementary-material
References
Allianz (2023). Global boiling: heatwave may have cost 0.6pp of GDPNo Title. Available at: https://www.allianz.com/en/economic_research/publications/specials_fmo/global-heatwave-implications.html.
Bakke, S. J., Ionita, M., and Tallaksen, L. M. (2020). The 2018 northern European hydrological drought and its drivers in a historical perspective. Hydrol. Earth Syst. Sci. 24, 1–44. doi:10.5194/hess-2020-239
Bintanja, R., van Oldenborgh, G. J., Drijfhout, S. S., Wouters, B., and Katsman, C. A. (2013). Important role for ocean warming and increased ice-shelf melt in Antarctic sea-ice expansion. Nat. Geosci. 6, 376–379. doi:10.1038/ngeo1767
Comiso, J. C., Gersten, R. A., Stock, L. V., Turner, J., Perez, G. J., and Cho, K. (2017). Positive trend in the Antarctic Sea Ice cover and associated changes in surface temperature. J. Clim. 30, 2251–2267. doi:10.1175/JCLI-D-16-0408.1
Copernicus (2023). Summer 2023: the hottest on record. Available at: https://climate.copernicus.eu/summer-2023-hottest-record.
Eayrs, C., Li, X., Raphael, M. N., and Holland, D. M. (2021). Rapid decline in Antarctic sea ice in recent years hints at future change. Nat. Geosci. 14, 460–464. doi:10.1038/s41561-021-00768-3
Fretwell, P. T., Boutet, A., and Ratcliffe, N. (2023). Record low 2022 Antarctic sea ice led to catastrophic breeding failure of emperor penguins. Commun. Earth Environ. 4, 273. doi:10.1038/s43247-023-00927-x
Goyal, R., Jucker, M., Gupta, A. S., and England, M. H. (2022). A new zonal wave-3 index for the southern hemisphere. J. Clim. 35, 5137–5149. doi:10.1175/JCLI-D-21-0927.1
Hersbach, H., Bell, B., Berrisford, P., Hirahara, S., Horányi, A., Muñoz-Sabater, J., et al. (2020). The ERA5 global reanalysis. Q. J. R. Meteorol. Soc. 146, 1999–2049. doi:10.1002/qj.3803
Hobbs, W. R., Massom, R., Stammerjohn, S., Reid, P., Williams, G., and Meier, W. (2016). A review of recent changes in Southern Ocean sea ice, their drivers and forcings. Glob. Planet. Change 143, 228–250. doi:10.1016/j.gloplacha.2016.06.008
Holland, M. M., Landrum, L., Raphael, M. N., and Kwok, R. (2018). The regional, seasonal, and lagged influence of the Amundsen Sea Low on Antarctic Sea Ice. Geophys. Res. Lett. 45, 11,227. doi:10.1029/2018GL080140
Holland, P. R., Bracegirdle, T. J., Dutrieux, P., Jenkins, A., and Steig, E. J. (2019). West Antarctic ice loss influenced by internal climate variability and anthropogenic forcing. Nat. Geosci. 12, 718–724. doi:10.1038/s41561-019-0420-9
Holland, P. R., Kwok, R., Liu, J., Curry, J. A., and Martinson, D. G. (2012). Wind-driven trends in Antarctic sea-ice drift. Nat. Geosci. 5, 872–875. doi:10.1038/ngeo1627
Huang, B., Liu, C., Banzon, V., Freeman, E., Graham, G., Hankins, B., et al. (2021). Improvements of the daily Optimum interpolation Sea Surface temperature (DOISST) version 2.1. J. Clim. 34, 2923–2939. doi:10.1175/JCLI-D-20-0166.1
Ionita, M., Grosfeld, K., Scholz, P., Treffeisen, R., and Lohmann, G. (2019). September Arctic sea ice minimum prediction – a skillful new statistical approach. Earth Syst. Dyn. 10, 189–203. doi:10.5194/esd-10-189-2019
Ionita, M., Lohmann, G., and Rimbu, N. (2008). Prediction of spring Elbe discharge Based on stable teleconnections with winter global temperature and precipitation. J. Clim. 21, 6215–6226. doi:10.1175/2008JCLI2248.1
Ionita, M., Scholz, P., Grosfeld, K., and Treffeisen, R. (2018). Moisture transport and Antarctic sea ice: austral spring 2016 event. Earth Syst. Dyn. 9, 939–954. doi:10.5194/esd-9-939-2018
Ionita, M., Tallaksen, L. M., Kingston, D. G., Stagge, J. H., Laaha, G., Lanen, H. A. J. V., et al. (2017). The European 2015 drought from a climatological perspective. Hydrol. Earth Syst. Sci. 21, 1397–1419. doi:10.5194/hess-21-1397-2017
Irving, D., and Simmonds, I. (2016). A new method for identifying the pacific–south American pattern and its influence on regional climate variability. J. Clim. 29, 6109–6125. doi:10.1175/JCLI-D-15-0843.1
Killick, R., Haynes, K., and Eckley, I. A. (2022). changepoint. R package version 2.2.4. Available at: https://cran.r-project.org/web/packages/changepoint/index.html.
Kohyama, T., and Hartmann, D. L. (2016). Antarctic Sea ice response to weather and climate modes of variability. J. Clim. 29, 721–741. doi:10.1175/JCLI-D-15-0301.1
Levitus, S., Antonov, J. I., Boyer, T. P., Baranova, O. K., Garcia, H. E., Locarnini, R. A., et al. (2012). World ocean heat content and thermosteric sea level change (0–2000 m). Geophys. Res. Lett. 39, 1955–2010. doi:10.1029/2012GL051106
Li, X., Cai, W., Meehl, G. A., Chen, D., Yuan, X., Raphael, M., et al. (2021). Tropical teleconnection impacts on Antarctic climate changes. Nat. Rev. Earth Environ. 2, 680–698. doi:10.1038/s43017-021-00204-5
Li, X., Gerber, E. P., Holland, D. M., and Yoo, C. (2015). A Rossby wave bridge from the tropical atlantic to west Antarctica. J. Clim. 28, 2256–2273. doi:10.1175/JCLI-D-14-00450.1
Liu, J., and Curry, J. A. (2010). Accelerated warming of the Southern Ocean and its impacts on the hydrological cycle and sea ice. Proc. Natl. Acad. Sci. 107, 14987–14992. doi:10.1073/pnas.1003336107
Liu, J., Curry, J. A., and Martinson, D. G. (2004). Interpretation of recent Antarctic sea ice variability. Geophys. Res. Lett. 31. doi:10.1029/2003GL018732
Meehl, G. A., Arblaster, J. M., Bitz, C. M., Chung, C. T. Y., and Teng, H. (2016). Antarctic sea-ice expansion between 2000 and 2014 driven by tropical Pacific decadal climate variability. Nat. Geosci. 9, 590–595. doi:10.1038/ngeo2751
Meier, W. N., Fretterer, F., Savoie, M., Mallory, S., Duerr, R., and Stroeve, J. (2017). NOAA/NSIDC climate data record of passive microwave Sea Ice concentration. Boulder, Colorado USA: NSIDC Natl. Snow Ice Data Cent. Version 3.
Mo, K. C., and Higgins, R. W. (1998). The pacific–south American modes and tropical convection during the southern hemisphere winter. Mon. Weather Rev. 126, 1581–1596. doi:10.1175/1520-0493(1998)126<1581:TPSAMA>2.0.CO;2
Munich, R. E. (2023). Earthquakes, thunderstorms, floods: natural disaster figures for the first half of 2023. Available at: https://www.munichre.com/en/company/media-relations/media-information-and-corporate-news/media-information/2023/natural-disaster-figures-first-half-2023.html.
Nagavciuc, V., Ionita, M., Kern, Z., McCarroll, D., and Popa, I. (2022). A ∼700 years perspective on the 21st century drying in the eastern part of Europe based on δ18O in tree ring cellulose. Commun. Earth Environ. 3, 277. doi:10.1038/s43247-022-00605-4
Nagavciuc, V., Kern, Z., Ionita, M., Hartl, C., Konter, O., Esper, J., et al. (2020). Climate signals in carbon and oxygen isotope ratios of Pinus cembra tree-ring cellulose from the Călimani Mountains, Romania. Int. J. Climatol. 40, 2539–2556. doi:10.1002/joc.6349
Nicolas, J. P., Vogelmann, A. M., Scott, R. C., Wilson, A. B., Cadeddu, M. P., Bromwich, D. H., et al. (2017). January 2016 extensive summer melt in West Antarctica favoured by strong El Niño. Nat. Commun. 8, 15799. doi:10.1038/ncomms15799
Parkinson, C. L. (2019). A 40-y record reveals gradual Antarctic sea ice increases followed by decreases at rates far exceeding the rates seen in the Arctic. Proc. Natl. Acad. Sci. 116, 14414–14423. doi:10.1073/pnas.1906556116
Purich, A., and Doddridge, E. W. (2023). Record low Antarctic sea ice coverage indicates a new sea ice state. Commun. Earth Environ. 4, 314. doi:10.1038/s43247-023-00961-9
Raphael, M. N. (2004). A zonal wave 3 index for the Southern Hemisphere. Geophys. Res. Lett. 31. doi:10.1029/2004gl020365
Raphael, M. N., Marshall, G. J., Turner, J., Fogt, R. L., Schneider, D., Dixon, D. A., et al. (2016). The Amundsen Sea Low: variability, change, and impact on antarctic climate. Bull. Am. Meteorol. Soc. 97, 111–121. doi:10.1175/BAMS-D-14-00018.1
Rintoul, S. R. (2018). The global influence of localized dynamics in the Southern Ocean. Nature 558, 209–218. doi:10.1038/s41586-018-0182-3
Roach, L. A., Dörr, J., Holmes, C. R., Massonnet, F., Blockley, E. W., Notz, D., et al. (2020). Antarctic Sea ice area in CMIP6. Geophys. Res. Lett. 47, e2019GL086729. doi:10.1029/2019GL086729
Stammerjohn, S., Massom, R., Rind, D., and Martinson, D. (2012). Regions of rapid sea ice change: an inter-hemispheric seasonal comparison. Geophys. Res. Lett. 39. doi:10.1029/2012GL050874
Stuecker, M. F., Bitz, C. M., and Armour, K. C. (2017). Conditions leading to the unprecedented low Antarctic sea ice extent during the 2016 austral spring season. Geophys. Res. Lett. 44, 9008–9019. doi:10.1002/2017GL074691
Suryawanshi, K., Jena, B., Bajish, C. C., and Anilkumar, N. (2023). Recent decline in Antarctic Sea Ice cover from 2016 to 2022: insights from satellite observations, Argo floats, and model reanalysis. Tellus A Dyn. Meteorol. Oceanogr. 75. doi:10.16993/tellusa.3222
Tetzner, D., Thomas, E., and Allen, C. (2019). A validation of ERA5 reanalysis data in the southern antarctic peninsula—ellsworth land region, and its implications for ice core studies. Geosciences 9, 289. doi:10.3390/geosciences9070289
Turner, J., Holmes, C., Caton Harrison, T., Phillips, T., Jena, B., Reeves-Francois, T., et al. (2022). Record low Antarctic Sea Ice cover in february 2022. Geophys. Res. Lett. 49, e2022GL098904. doi:10.1029/2022GL098904
Turner, J., Phillips, T., Marshall, G. J., Hosking, J. S., Pope, J. O., Bracegirdle, T. J., et al. (2017). Unprecedented springtime retreat of Antarctic sea ice in 2016. Geophys. Res. Lett. 44, 6868–6875. doi:10.1002/2017GL073656
Vaideanu, P., Stepanek, C., Dima, M., Schrepfer, J., Matos, F., Ionita, M., et al. (2023). Large-scale sea ice–Surface temperature variability linked to Atlantic meridional overturning circulation. PLoS One 18, e0290437. doi:10.1371/journal.pone.0290437
von Storch, H., and Zwiers, F. W. (1999). Statistical analysis in climate research. Cambridge: Cambridge University Press. doi:10.1017/cbo9780511612336
Wang, S., Liu, J., Cheng, X., Yang, D., Kerzenmacher, T., Li, X., et al. (2023). Contribution of the deepened Amundsen sea low to the record low Antarctic sea ice extent in February 2022. Environ. Res. Lett. 18, 054002. doi:10.1088/1748-9326/acc9d6
World Meteorological Organisation (2023). Libya floods. Available at: https://public.wmo.int/en/media/news/libya-floods-show-need-multi-hazard-early-warnings-unified-response-0.
Yadav, J., Kumar, A., and Mohan, R. (2022). Atmospheric precursors to the Antarctic sea ice record low in February 2022. Environ. Res. Commun. 4, 121005. doi:10.1088/2515-7620/aca5f2
Zhang, L., Delworth, T. L., Yang, X., Zeng, F., Lu, F., Morioka, Y., et al. (2022). The relative role of the subsurface Southern Ocean in driving negative Antarctic Sea ice extent anomalies in 2016–2021. Commun. Earth Environ. 3, 302. doi:10.1038/s43247-022-00624-1
Keywords: Antarctic sea ice, zonal wave number 3, change point, heat advection, sea surface temperature
Citation: Ionita M (2024) Large-scale drivers of the exceptionally low winter Antarctic sea ice extent in 2023. Front. Earth Sci. 12:1333706. doi: 10.3389/feart.2024.1333706
Received: 10 November 2023; Accepted: 24 January 2024;
Published: 23 February 2024.
Edited by:
Markus Michael Frey, British Antarctic Survey (BAS), United KingdomReviewed by:
Thomas Ballinger, University of Alaska Fairbanks, United StatesThomas Caton Harrison, British Antarctic Survey (BAS), United Kingdom
Copyright © 2024 Ionita. This is an open-access article distributed under the terms of the Creative Commons Attribution License (CC BY). The use, distribution or reproduction in other forums is permitted, provided the original author(s) and the copyright owner(s) are credited and that the original publication in this journal is cited, in accordance with accepted academic practice. No use, distribution or reproduction is permitted which does not comply with these terms.
*Correspondence: Monica Ionita, Monica.Ionita@awi.de