Time series subsidence evaluation using NSBAS InSAR: a case study of twin megacities (Rawalpindi and Islamabad) in Pakistan
 Waqar Ali Zafar1,2*
  Farhan Javed2 Rizwan Ahmed1 Muhammad Ali Shah2
  Mahmood Ahmad3,4
  Muhammad Younis Khan5,6
  Gamil M. S. Abdullah7,8 Daud Khan9
  Taoufik Najeh10*
  Yaser Gamil11
- 1DNE, Pakistan Institute of Engineering and Applied Sciences, Islamabad, Pakistan
- 2Centre for Earthquake Studies, National Centre for Physics, Islamabad, Pakistan
- 3Department of Civil Engineering, University of Engineering and Technology Peshawar (Bannu Campus), Bannu, Pakistan
- 4Institute of Energy Infrastructure, Universiti Tenaga Nasional, Kajang, Malaysia
- 5National Centre of Excellence in Geology, University of Peshawar, Peshawar, Pakistan
- 6Department of Earth Sciences, College of Science, Sultan Qaboos University, Muscat, Oman
- 7Department of Civil Engineering, College of Engineering, Najran University, Najran, Saudi Arabia
- 8Science and Engineering Research Center, Najran University, Najran, Saudi Arabia
- 9Department of Transport Systems, Traffic Engineering and Logistics, Faculty of Transport and Aviation Engineering, Silesian University of Technology, Katowice, Poland
- 10Operation, Maintenance and Acoustics, Department of Civil, Environmental and Natural Resources Engineering, Lulea University of Technology, Lulea, Sweden
- 11Department of Civil Engineering, School of Engineering, Monash University Malaysia, Subang Jaya, Malaysia
Ground deformation associated with natural and anthropogenic activities can be damaging for infrastructure and can cause enormous economic loss, particularly in developing countries which lack measuring instruments. Remote sensing techniques like interferometric synthetic aperture radar (InSAR) can thus play an important role in investigating deformation and mitigating geohazards. Rawalpindi and Islamabad are twin cities in Pakistan with a population of approximately 5.4 million, along with important government and private entities of national and international interest. In this study, we evaluate rapid paced subsidence in this area using a modified small baseline subset technique with Sentinel-1A imagery acquired between 2015 and 2022. Our results show that approximately 50 mm/year subsidence occurs in the older city of Rawalpindi, the most populated zone. We observed that subsidence in the area is controlled by the buried splays of the Main Boundary Thrust, one of the most destructive active faults in the recent past. We suggest that such rapid subsidence is most probably due to aggressive subsurface water extraction. It has been found that, despite provision of alternate water supplies by the district government, a very alarming number of tube wells are being operated in the area to extract ground water. Over 2017–2021, field data showed that near-surface aquifers up to 50–60 m deep are exhausted, and most of the tube wells are currently extracting water from depths of approximately 150–160 m. The dropping water level is proportional to the increasing number of tube wells. Lying downstream of tributaries originating from the Margalla and Murree hills, this area has a good monsoon season, and its topography supports recharge of the aquifers. However, rapid subsidence indicates a deficit between water extraction and recharge, partly due to the limitations inherent in shale and the low porosity near the surface lithology exposed in the area. Other factors amplifying the impacts are fast urbanization, uncontrolled population growth, and non-cultivation of precipitation in the area.
1 Introduction
Ground subsidence is a major factor causing strong geohazards (Figueroa-Miranda et al., 2018; Khorrami et al., 2020; Motagh et al., 2008; Rosi et al., 2016; ul Haq et al., 2021). As well as calamities like earthquakes and tsunamis, ground subsidence can contribute to much economic and human loss. Different natural and anthropogenic components drive ground subsidence (Riel et al., 2018; Cho et al., 2019; Khorrami et al., 2020). Other than natural phenomena, anthropogenic activities like subway construction, excavation, aquifer disturbance, mining, and aggressive exploitation of ground water are the principal sources of ground subsidence (Figueroa-Miranda et al., 2018; Khorrami et al., 2020; ul Haq et al., 2021; Cho et al., 2019; Riel et al., 2018). Due to unbalanced development in developing countries, more and more people tend to migrate to large cities. This leads to high population density and resource overconsumption in megacities.
Ground water as a basic need is currently one of the most exploited natural resources. Much research has reported dramatic land deformation due to overextraction of fluids and increased urbanization over the last decade. Some of the areas studied include large cities in the Pearl River Delta (Ng et al., 2018) and Taiwan (Fernandez et al., 2018) in China, Mashhad in Iran (Khorrami et al., 2020), Mexico City (Figueroa-Miranda et al., 2018), Italy (Teatini et al., 2006), Spain (Fernandez et al., 2018), and Brazil (Fernandez et al., 2018).
Conventional ground-based methods for subsidence measurement are limited by their poor spatial resolution. In contrast, observation from space has higher-density data collection in a short time and is economical. Interferometric synthetic aperture radar (InSAR) has advantages of significant accuracy, wide coverage to produce large aerial data sets, and signal data for ground subsidence investigations (Xu et al., 2006; Wang et al., 2012; Rosi et al., 2016; de Luna et al., 2017; Zheng et al., 2017; Ng et al., 2018). The new small baselines subset (NSBAS) has been widely applied to monitor geohazards such as creep rates caused by seismic events, landslides, subsidence due to water extraction, underground excavation, and other anthropogenic activities (López-Quiroz et al., 2009; Doin et al., 2011). This technique allows the estimation of time-dependent deformation, irrespective of data acquisition gaps during the study period (López-Quiroz et al., 2009; Doin et al., 2011). Using Sentinel-1 data, this technique has also been applied to ground subsidence in Beijing (Gao et al., 2016; Yang et al., 2018), London (Milillo et al., 2018), Spain (Fernandez et al., 2018), coastal areas of Africa (Khan et al., 2021), and Algeria (Beladam et al., 2019).
Khan et al., 2022 applied PS-InSAR to the Rawalpindi–Islamabad region; in comparison to our findings, they used a shorter time-span of data (Jan. 2019 to June 2021) and found a higher subsidence of approximately 90 mm/year without considering atmospheric noise removal or resolving deformation along the satellite’s line of sight (LOS) to vertical and horizontal components. In this study, we investigate ground subsidence from 2015 to 2022 using the NSBAS technique (López-Quiroz et al., 2009; Doin et al., 2011) with Sentinel-1 data from ascending and descending orbits over the twin cities of Rawalpindi and Islamabad (Figure 1), taking into account atmospheric noise removal and resolving the LOS deformation to horizontal and vertical components. Rawalpindi and Islamabad have seen a huge population influx over the last decade. This unplanned and uncontrolled influx automatically demands the increased exploitation of natural resources. Consequently, the near-surface aquifer of approximately 60 m depth has been exhausted and the city government is currently operating about 600 tube wells for water supply (Water and Sanitation Agency (WASA), Rawalpindi: https://wasarwp.punjab.gov.pk/ ,accessed on 18 September 2023). Some of these tube-wells operate at a depth of 137–180 m. An overall estimate has shown that about 80% of the urban population also operates 3.0–3.5 cm diameter small tube wells in homes without any regulation and planning. All of these factors, along with urbanization, are leading to ground subsidence in the area. Before comparing ground subsidence with tube wells and urbanization, we applied the Generic Atmospheric Correction Online Service (GACOS) to correct the interferograms to reduce atmospheric noise. Time-series deformation maps from 2015–2022 were measured and compared with annual precipitation rates. We were thus able to decompose the InSAR LOS into horizontal and vertical components. Since Rawalpindi and Islamabad are located very close to Main Boundary Thrust (MBT), we also analyzed the impact of active faults such as splays of the MBT on the subsidence. Our findings will help address uncontrolled anthropogenic activity and its implications.
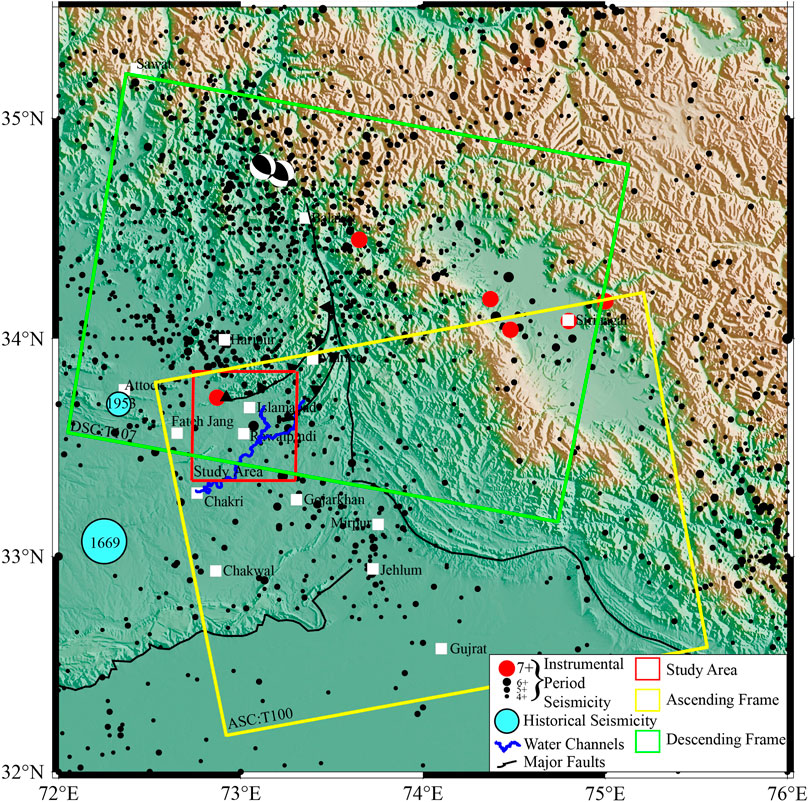
FIGURE 1. Generalized topographic and tectonic map of the study area along with major features and seismicity in the area mentioned in the legend.
2 Geological setting
The red rectangle in Figure 1 comprises twin cities of Rawalpindi and Islamabad, located at the foothills of Margalla hills and close to the MBT. Seismicity in the area is indicated with dots. Historical seismic events from a composite catalog of the Pakistan Meteorological Department, USGS, and IRIS are shown in light blue. The events from the instrumental period (1976–2021) are shown as dots with red and black color. Dot size varies with magnitude. Fault plane solutions (FPS) from the Kashmir earthquake (Mw 7.2 October 2005) are adopted from the Global Centroid-Moment-Tensor webpage. The major structures of the Jhelum Fault and Salt Range Thrust (SRT) are indicated by black lines. The Korang and Soan ephemeral to perennial streams are indicated by blue lines. However, these are just those parts of the streams that have recharging effects in the study area. Two thrust splays of the MBT extending outside the study area are indicated by black thrust lines.
The geology of the study area is controlled by convergence of the Indian and Eurasian plates (Kazmi and January 1997; Williams et al., 1999; Sheikh et al., 2008). The temporal span of the collision of these plates extends to ∼20 million years (Kazmi and January 1997). Most of the topographic and morphological changes in this area have been caused by this tectonic activity (Kazmi and January 1997). Furthermore, the splays of the MBT are not well-exposed in the densely populated area, but the surface signature toward the north (Sathiakumar et al., 2020) is shown in Figure 1.
Geologically, the area of the twin cities can be divided into three main units. The gigantic range of the Margalla Hills lies in the north containing Jurassic to Eocene shales with limestones of Murree and Kamlial to leigh conglomerates exposed in the area (SM, 1977; Williams et al., 1999; Sheikh et al., 2008). To the south of the Margalla hills lies the piedmont belt of terraces and plains that is underlain by truncated folds in sandstone and shales of the Rawalpindi group. The important morphological feature of the Soan River flows in most parts along the axis of the Soan syncline (Williams et al., 1999; Sheikh et al., 2008). In the current study area, it flows to the south of Rawalpindi city and intersects it in some places (Figure 1). This is the main recharging source for water aquifers in the study area.
3 Dataset and methodology
We employed the SBAS to the study area for temporal spanning for 2015–2022. However, some of the study area’s data are missing, as shown in the network image for both orbital directions (Figure 2).
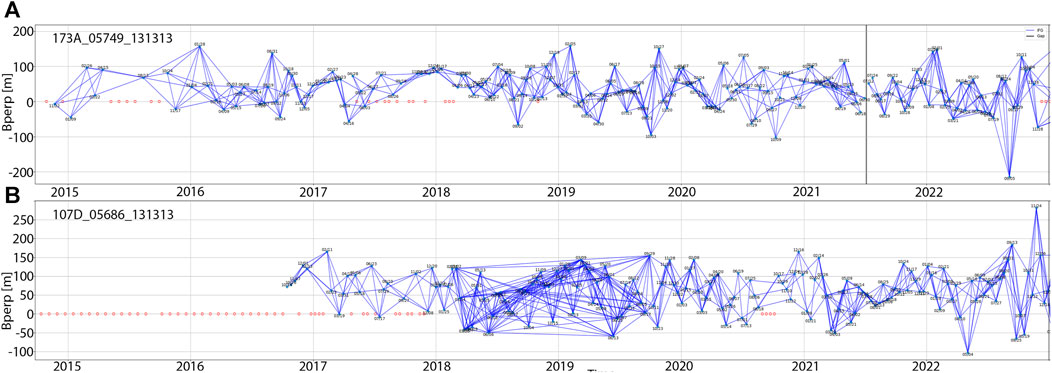
FIGURE 2. Temporally distributed interferogram pairs for ascending (173A) and descending (107D) tracks in upper (A) and lower (B) panels, respectively. Blue lines represent interferogram pairs. The abscissa axis marks the time in the year of acquisition, whereas the ordinate shows the perpendicular baseline for each interferogram. Network figure acquired from https://comet.nerc.ac.uk/COMET-LiCS-portal. The gray vertical line shows the acquisition gap, and the red dots represent days for which figures are not available for processing.
We used a Sentinel-1A ascending orbit dataset of 223 images and descending dataset of 147 images, comprising 633 ascending and 522 descending interferograms (acquired from the https://comet.nerc.ac.uk/COMET-LiCS-portal, last accessed 2006–2023) to calculate the deformation in the study area. Interferograms were generated using Gamma code. The selected dataset pairs were characterized by a spatial baseline of −200 m to 200 m for the ascending track and −100m to 300 m for the descending track. The temporal distribution of interferograms for the whole study period against a spatial baseline is shown in Figure 2. The upper section shows the interferogram network for the ascending track T: 173 (LiCSAR Frame ID: 173A_05749_131,313), while the lower one is for the descending track T: 107 (LiCSAR Frame ID: 107D_05686_131,313). For all the processing stacks, the ascending orbit master image was 20,160,912, while the master image for the descending orbit selected by LicSBAS code was 20,160,908. The ascending interferograms are available from 2015 to 2022 with a gap from 06-30-2021 to 07-12-2021, and descending interferograms are available from 2017 to 2022.
The LicSBAS code (Morishita et al., 2020; Morishita, 2021) was used for temporal analysis using coherence and unwrapped interferograms. It employs the SNAPHU algorithm to automatically unwrap the data (Chen and Zebker, 2002). We masked all pixels with a coherence of 0.2 before employing time-series analysis to minimize the impact of unwrapping errors. We kept the unwrapped coverage at less than 0.5 and the cutoff threshold for coherence to 0.06. After unwrapping the interferograms, resampling and geocoding was performed using a 30-m digital elevation model (DEM) provided by SRTM. LicSBAS uses NSBAS (modified small baseline technique) and has the advantage of removing weak coherent interferograms through its loop closure algorithm (Ghorbani et al., 2022). Unlike the traditional technique, this technique allows jumping the gap in the interferograms network (Ghorbani et al., 2022). The entire interferometric network was then inverted using the least-squares method for incremental displacements between the acquisition dates to estimate the displacement value of every pixel over the twin cities. Before estimating the rate map, interferograms were corrected for atmospheric noise by utilizing the Generic Atmospheric Correction Online Service (GACOS) (Morishita, 2021). A generalized processing flowchart for this study is presented in Figure 3. Additionally, spatial filtering of 2 km (low-pass filtering) and temporal baseline variation of 47 days (high-pass filtering) employing a Gaussian filter kernel (Chen and Zebker, 2002; Zafar et al., 2023) were used to differentiate the noise from the temporal displacement variations. To eliminate the linear tendency in output time series, bilinear de-ramping was applied. In the end, the effect of topography error was removed from the final LOS velocity field.
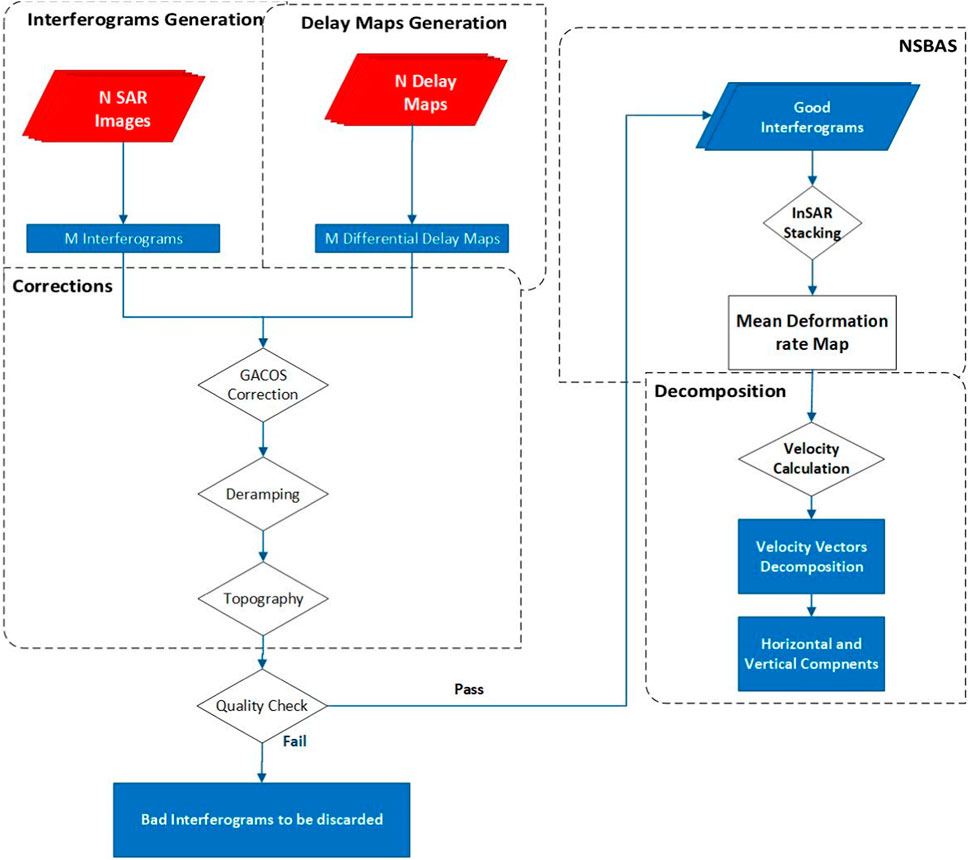
FIGURE 3. Flowchart of the processing technique employed in the study.
4 Results
Subsidence in the area is shown in Figure 4A, in which the most serious region has an average subsidence rate of approximately 50 mm/year. As mentioned in Figure 4A, two regions have remarkable subsiding rates. Furthermore, during each individual year, the subsidence rate is also computed from both ascending and descending orbits (Figures 5, 6). However, we did not include the 2015–2016 dataset in the computation of the average subsidence rate due to limited overlap of the 2015–2016 frames with the 2017–2022 frames in the descending track. Knowing the geometries of the ascending and descending tracks, we computed the horizontal and vertical deformation components (Figure 7). The temporal movement along LOS for 2015–2022 for both regions is shown in Figures 8 and 9, respectively. The estimated error, computed from the cumulative displacement employing the percentile bootstrap method, in the subsidence rate varies from 1 to 5 mm/yr (Figure 4B), which provides confidence in the estimated subsidence rate. The subsections below give separate quantitative discussion of subsidence and possible sources.
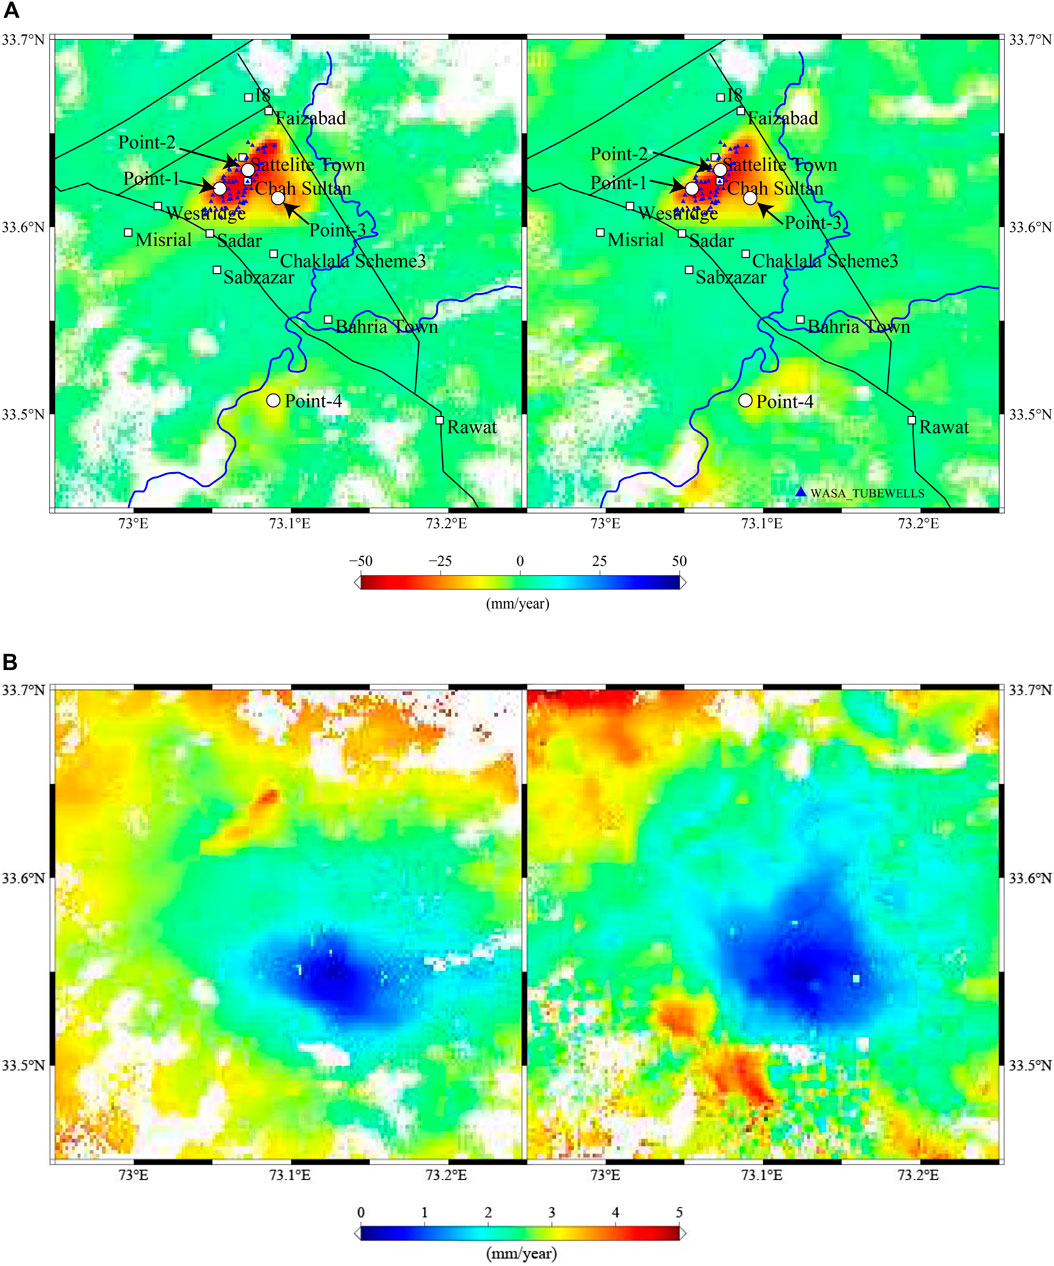
FIGURE 4. (A) LOS deformation rate in the study area from ascending and descending cycles using the SBAS technique. Blue triangles represent operating hydrological tube wells in the area. In order to keep the image clear, only a selected number of operational wells is plotted here. White filled circles in the image show points where temporal subsidence was further evaluated and is shown graphically in Figures 8, 9. (B) Sigma error in the deformation rate, as estimated by SBAS. Left and right of the figure show standard deviation for ascending and descending orbital directions, respectively. The estimated error value is in the range of 0–5 mm/year.
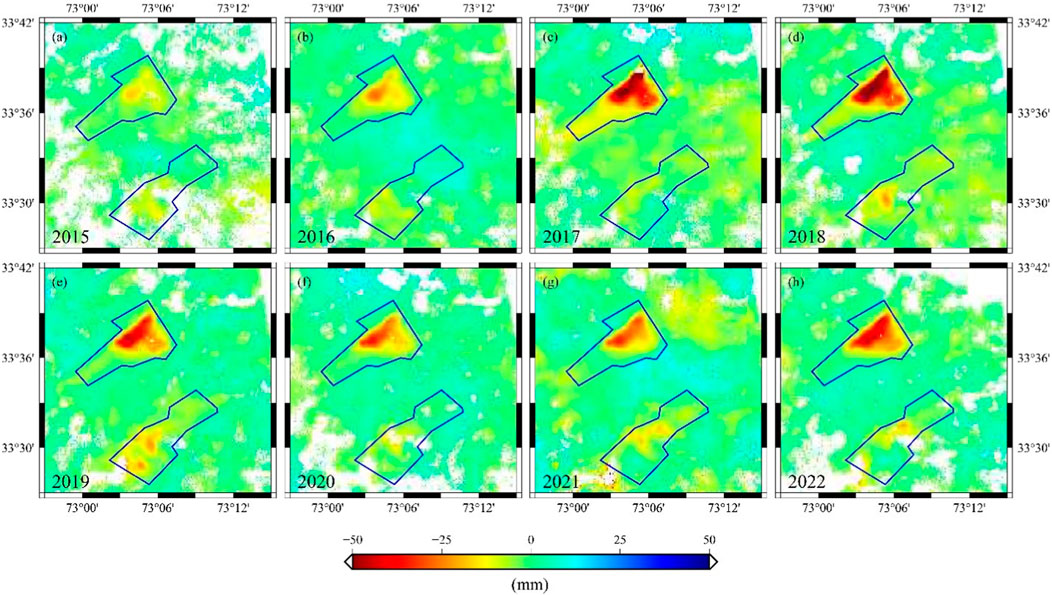
FIGURE 5. (A–H) figures show the LOS deformation propagation rate from 2015 to 2022 as computed from SBAS from the ascending orbit data.
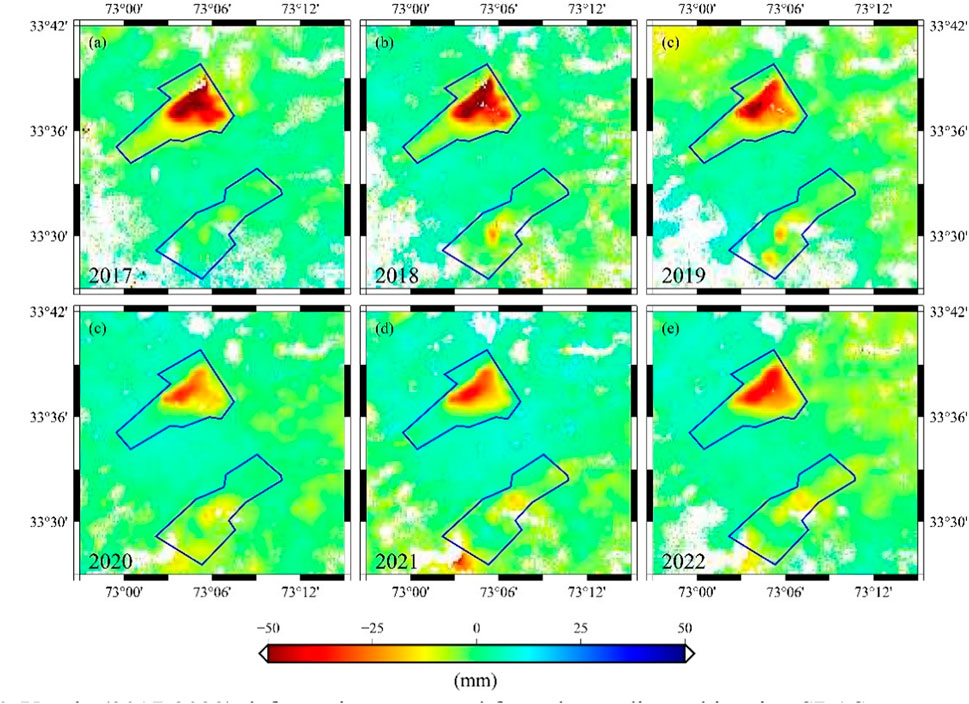
FIGURE 6. (A–E) figures show the yearly deformation rate for the period from 2017-2022 computed from descending orbit data.
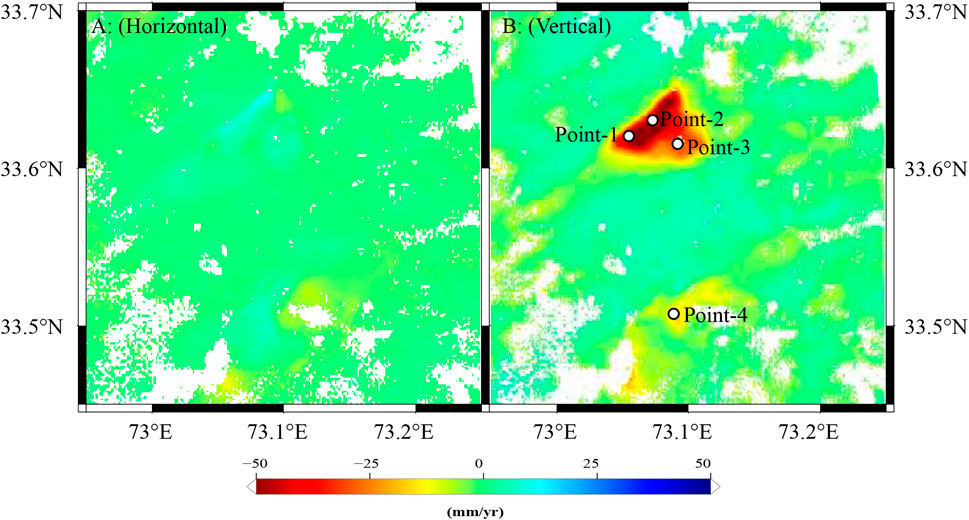
FIGURE 7. LOS deformation decomposed to (A) horizontal and (B) vertical components. Pattern of movement in (B) shows the phenomenon of subsidence as a major deformation source. White filled circles in the image show points where temporal subsidence was further evaluated, shown graphically in Figures 8, 9.
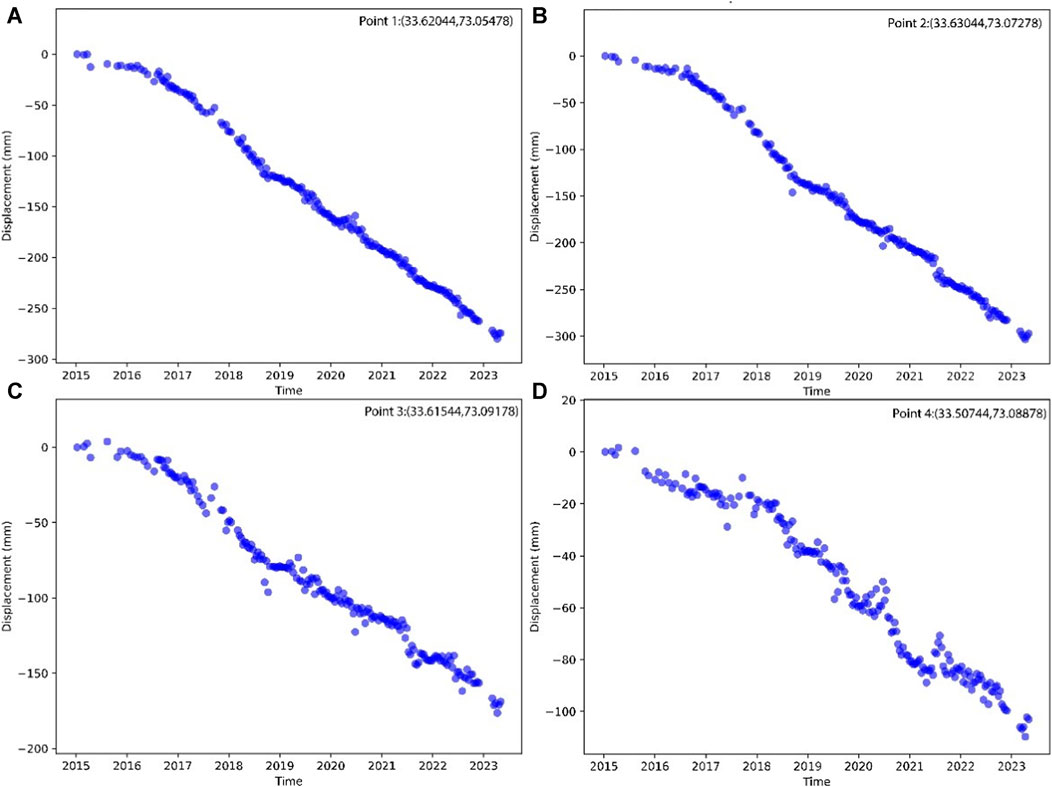
FIGURE 8. Annual temporal rate of subsidence from ascending orbit at points 1 to 4 mentioned in Figures 4, 7 is shown here as (A–D).
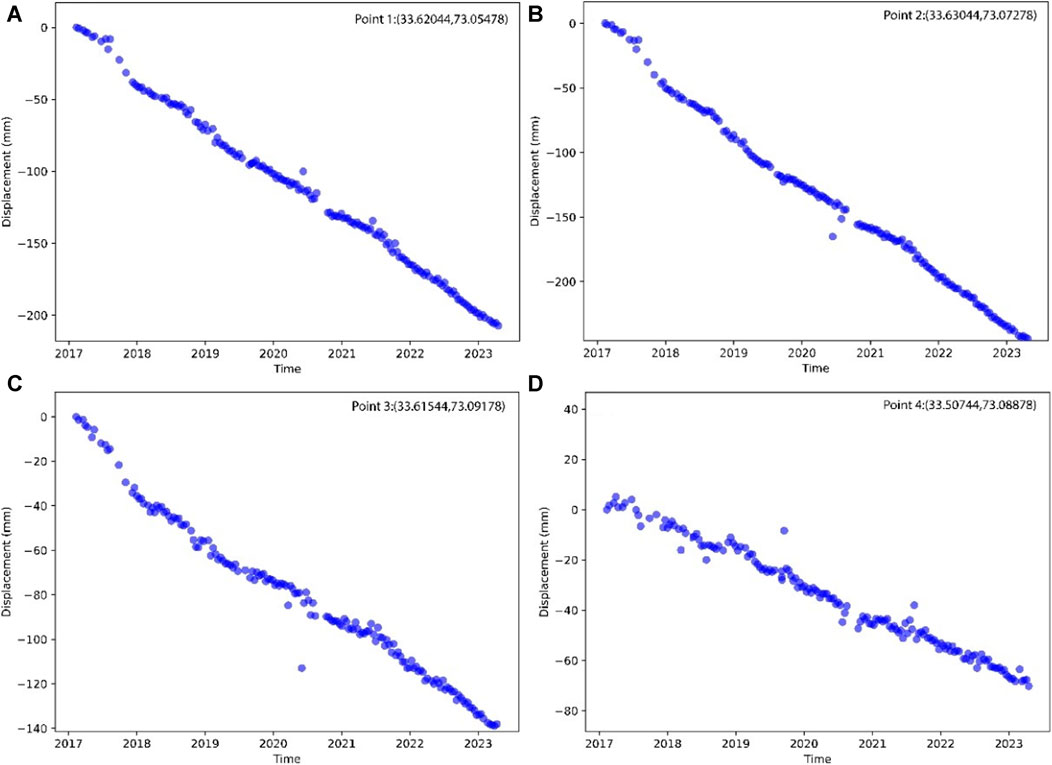
FIGURE 9. Annual temporal rate of subsidence from descending orbit at points 1 to 4 mentioned in Figures 4, 7 is shown here as (A–D).
4.1 InSAR-based subsidence rate
Figure 4A shows the annual rate of subsidence in the study region using the NSBAS technique. The older regions of the Rawalpindi city show the maximum subsidence rate of approximately 50 mm/year. Both tracks show reasonably comparable results of subsidence. It is noted that the subsidence rate is the same on both the ascending and descending tracks, despite different viewing geometries.
It is evident from Figures 4A and 5 that the areas of Satellite Town, Chah Sultan, Sadar, and all areas having maximum operational tube-wells of WASA (blue triangles) show the highest rate of subsidence. However, areas at flanges like Faizabad, Misrial, and Westridge show relatively lower subsidence (−30 to −15 mm/year). The subsidence rate is more than 50 mm/yr for 2017–2019 but decreases for 2015–2016 and 2020–2021 (Figures 5 and 6). However, the subsidence rate again increases in 2022 (Figures 5 and 6).
In order to adopt a more practical approach toward the demarcation of reasons and patterns of subsidence, a decomposition of the LOS vector in horizontal and vertical components was also carried out (Figure 7), following the previous methodology (Chen and Khan, 2010; Lindsey and Fialko, 2013; Watson et al., 2022; Zafar et al., 2023). This methodology is in general described by the following relationship:
where
The decomposition gives almost negligible deformation in the horizontal direction whereas a strong localized signature is highlighted in the vertical component. This strengthens the idea of the existence of splay faults, showing the sharp transition subsidence along the fault. Additionally, another estimation technique was conducted by finding the subsidence at four particular points within the study area. The geographic locations of these evaluated points are shown within the graphical description of subsidence through both ascending and descending orbits in Figures 8 and 9.
4.2 Water extraction
It was observed that around 495 tube wells with an average 10 cm outlet delivery are being operated 6–7 h per day in the study area. Figure 4A shows the selected operational tube wells as blue triangles. During investigation, it was found that most of the tube wells in this area were being operated from the near-surface aquifer at approximately 60-m depth until 2010 (Abbas et al., 2012). However, in order to meet the requirements of the increased population, aggressive water pumping has almost depleted this aquifer and most currently operational tube wells are pumping water from 130–150 m deep. It was observed from the available dataset that there were only 39 operational tube wells in the study area in 1998, whereas this number grew to 278 in 2007 (Abbas et al., 2012); in 2021, WASA authorities verified 495 tube wells in the area.
4.2.1 Tube wells vs. water level
Figure 10 shows the increase in tube wells drilled from 1980 to 2021, causing a dramatic drop in the water level from 14 m to 150 m in the same period of well drilling. The dataset source for the number of tube wells for 1980–2007 was taken from Abbas et al. (2012), whereas the dataset for the next period was observed and collected from the field and relevant authorities. The water-level-drop data were taken from ul Haq et al. (2021) for 1990–2017 and, for the next period, from the field and relevant departments. These data show that a depletion of near-surface patchy aquifers of approximately 40–50 m from 1990 to 2017 and subsequent excessive water extraction from the next level aquifer at approximately 130–150 m as being the main sources of rapid subsidence in the study area.
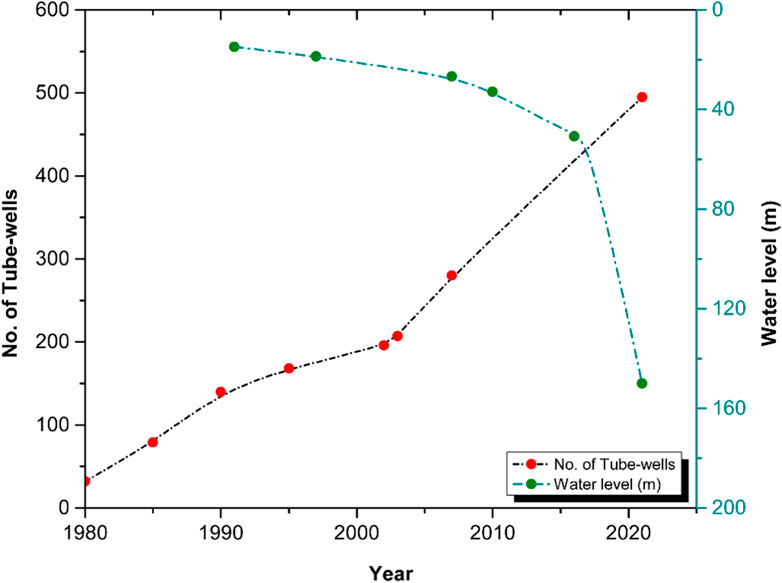
FIGURE 10. Temporal increase in drilled tube wells and decrease in the water table. Dataset for the number of tube wells until 2007 adopted from Abbas et al. whereas the number for 2021 was confirmed from WASA office. Water table dataset for selected tube wells for 1990–2017 adopted from ul Haq et al. (2021) and the water table level for 2021 taken from field observations.
4.2.2 Recharging of aquifers
An imbalance between recharge and extraction from acquirers is the main reason for increasing subsurface strata compaction. This compaction leads to rapid subsidence that can be disastrous for structures. Other than the above sources of extraction and their impacts, it is very important for recharging sources to be considered. The following prominent sources of recharge exist in the area of investigation.
The study area experiences a consistent pattern of natural precipitation throughout the year. However, July and August are the wettest months, occasionally witnessing heavy rainfall events. While this source has the potential to contribute significantly to aquifer recharge, precipitation often takes the form of flash floods. Unfortunately, these intense bursts of water tend to bypass recharging and flow directly downstream, having a minimal impact on subsurface water levels. Ultimately, this water flows into the Indus River without enriching local groundwater reserves. Figure 11 shows the average annual rainfall for 2009–2022 and the annual subsidence rate from ascending and descending tracks. It is notable that, during the last few years, some of the heavy rains, like 180 mm, have occurred in the area but that the overwhelming shale lithology causes very low percolation. However, tube well operation remains continuous for water supply, and this imbalance also impacts subsidence.
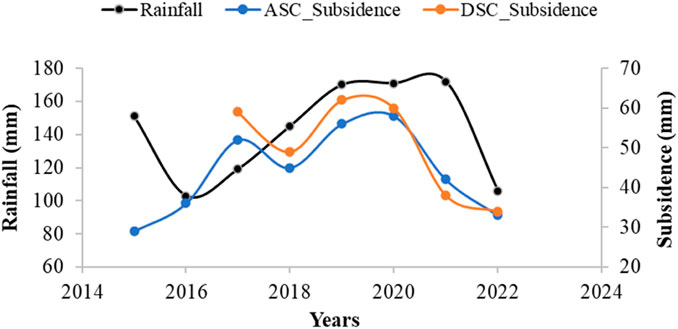
FIGURE 11. Annual average precipitation in the study area along with the subsidence observed in both tracks; dataset source for precipitation is https://www.worldweatheronline.com/rawalpindi-weather-averages/punjab/pk.aspx.
Perennial to intermittent streams in the area is a second possible recharging source for subsurface aquifers. These streams are carriers of the water from the Simly and Rawal dams. Other tributaries flow down from Margalla and carriers of water from snowfall and precipitation in the Murree hill station upstream of the study area. Some subsurface fractures and weak zones are also possible sources of aquifer recharge in the study area. The third main stream that can recharge some areas of Rawalpindi is the Nullah Lai. However, this carries approximately 0.545 million m3/day of waste water from the twin cities (Abbas et al., 2012). This source is polluting near-surface resources and poses dangerous health hazards to the population using this source.
5 Discussion
Most tube wells of the water and sanitation authority have operated in this region since 1987 (ul Haq et al., 2021; Abbas et al., 2012.). The effects of water pumps operated by individuals in the area also cannot be ignored. The study area has had an annual 2.52% growth population according to census data. In 1998, the Rawalpindi district had a total population of 3.4 million that jumped to 5.4 million in 2017 (https://www.pbs.gov.pk/content/final-results-census-2017). This growing urbanization requires over-exploitation of water resources. The factors that contribute to a higher rate of subsidence are low recharge, higher pumping extraction, and urbanization. Climatic change causing lower precipitation, imbalance of recharge and extraction, deepening of the subsurface water aquifers, and, most importantly, non-capture of rainwater are the main reasons why water extraction is causing rapid ground subsidence in different parts of the world.
However, it has been observed that, while some areas of the cities are as populated as the older ones and have very many tube wells, they have relatively lower subsidence. Real-time tracking and ground observations in the study area have shown that these areas are basically being recharged from the main water reservoir in the area—the Rawal Dam and some subsurface fractures. Moreover, these areas’ lower subsidence can be attributed to managed and controlled water extraction and alternate supply systems. The Islamabad zone shows very little or negligible subsidence because its inhabitants are constantly supplied with water from the Rawal and Khanpur dams to meet their requirements.
For areas of the highest subsidence in the Rawalpindi region (Figure 3), a detailed investigation has been carried out to identify the possible reasons. Geological investigation has revealed that there are very low chances of structural disturbance leading to subsidence. Due to the collision of the Indian and Eurasian plates, uplift is occurring at the MBT right next to the study area (Kazmi and January 1997). However, subsidence in the area is caused by local phenomena such as aggressive subsurface water extraction.
A comparison of each year’s individual rainfall from the recorded dataset is presented in Figure 11, with the annual subsidence rates presented in Figures 4 and 5, showing a weak correlation. The correlation coefficients between rainfall and subsidence observed in the ascending and descending cycles are 0.48 and 0.35, respectively. It is clearly observable that years with high precipitation exhibit high subsidence. This correlation strengthens the argument that subsidence is anthropogenic in nature rather a result of tectonic phenomena and environmental impacts. The sharp truncation of subsidence on the northern side of the study area reveals the existence of a blind fault. A thorough inspection of the area was conducted in order to determine the existence of the fault, but there was no obvious evidence of a fault and no previous studies had mentioned it. However, the structural facts of the area favor the existence of a blind thrust fault. As seen in Figure 1, two thrust splays of the MBT clearly pass from the study region at approximately 8–10 km apart, bounding the main subsidence zone from upper and lower ends. Moreover, the detailed topographic map shows existence of many other faults merging with the MBT along the same NE–SW orientation in which the subsidence truncation occurs. The existence of buried faults supports the argument that this truncation is mainly due to the extension of a splay fault in the subsurface.
Compared to rapid subsidence from fluid extraction in Las Vegas, United States (Bell et al., 2002); Mexico City (Poland and Ireland, 1988), New Orleans, United States (Dixon et al., 2006); and Mashhad (Khorrami et al., 2020), Rawalpindi in Pakistan shows an alarming rate of deformation. This pattern of subsidence resulting from uncontrolled and unregulated subsurface water extraction can lead to devastating future consequences in urban areas in terms of infrastructure damage due to water level variations. Although infrastructure damage is repairable, the devastation in terms of water aquifer depletion is both economically and environmentally alarming.
After close observation, it can be concluded that the over-pumping of subsurface water, low recharge due to the flash-flood nature of rains, low porosity of shale causing reduced percolation, and, most importantly, unregulated and uncontrolled population growth are the main causes of rapid subsidence. An alarming growth of population and increased drilling for new tube wells at a faster pace every year are the principal contributing factors to subsidence.
Remedial transportation of surface water to affected areas has had some positive consequences in reducing the subsidence rate. For example, in Santa Clara Valley, water was transported from the Sierra Nevada Mountains (Schmidt and Bürgmann, 2003). Likewise, reliance on surface water from the California Aqueduct helped reduce the 10 m rate of subsidence in areas of San Joaquin Valley (Ireland et al., 1984). These experiments in different areas suggest that subsidence in Rawalpindi can be halted or at least reduced to negligible levels if dependence on subsurface aquifers is reduced by alternate supply systems. Small dam construction in the upstream direction of the cities and, most importantly, rainwater cultivation can also help reduce the effects of the over-exploitation of subsurface aquifers.
6 Conclusion
In this work, we used both ascending and descending Sentinel-1A datasets to study continuous ground subsidence. We applied the NSABS technique to determine subsidence, and we compared our results with tectonic activity in the region and field observations. We found that aggressive water extraction from the near-surface zone at 60–150 m causes rapid subsidence of approximately 50 mm/year. Detailed investigations revealed about 495 tube wells currently operating at approximately 100–150 m depth for more than 5 h per day. Despite having a good monsoon season and continuous downstream water flow from the Murree–Margalla hills, the area faces a continuous drop in subsurface water levels. The local lithology of the near-surface strata and the existence of buried faults are found to be the main reasons for the lower recharge occurring in this study area. Shale and the conglomeratic nature of the near-surface strata cause weak or lower recharge due to lower porosity, despite reasonable precipitation during the study period. Other factors involved include the waste or non-cultivation of rainwater in the area. The only known and planned water reservoirs near the study area are Simly and Rawal dams. These reservoirs store rainwater upstream and provide limited recharge due to the limitation posed by percolation in shale. Therefore, the process of extracting water from the subsurface must be carefully controlled and scaled back, even though it cannot meet the needs of the population. Dependence should be shifted toward the responsible use of water resources, and there should be better cultivation of rainwater at a domestic level. Further research is needed to evaluate the mechanics of the buried splay faults and their relation to subsidence in the region.
Data availability statement
The raw data supporting the conclusions of this article will be made available by the authors, without undue reservation.
Author contributions
WZ: conceptualization and writing–original draft. FJ: methodology, software, and writing–review and editing. RA: project administration, supervision, and writing–review and editing. MS: resources, supervision, and writing–review and editing. MA: investigation, validation, and writing–review and editing. MK: data curation, formal Analysis, and writing–review and editing. GA: conceptualization, investigation, software, and writing–review and editing. DK: data curation, formal analysis, methodology, and writing–review and editing. TN: funding acquisition, project administration, resources, and writing–review and editing. YG: investigation, resources, validation, visualization, and writing–review and editing.
Funding
The author(s) declare that financial support was received for the research, authorship, and/or publication of this article. This work is funded and supported by the Deanship of Scientific Research under the supervision of the Science and Engineering research Center at Najran University under the Research Centers funding program, grant code (NU/RCP/SERC/12/2).
Acknowledgments
The authors are thankful to Deanship of Scientific Research under the supervision of the Science and Engineering research Center at Najran University under the Research Centers funding program grant code (NU/RCP/SERC/12/2). The authors would like to pay special gratitude to ACRE Lab DNE, PIEAS, Centre for Earthquake Studies and National Centre for Physics, Islamabad, Pakistan, for providing computational facilities to accomplish the research. The authors are also thankful to ESA for making the Sentinel 1A data available in the public domain for research purposes.
Conflict of interest
The authors declare that the research was conducted in the absence of any commercial or financial relationships that could be construed as a potential conflict of interest.
Publisher’s note
All claims expressed in this article are solely those of the authors and do not necessarily represent those of their affiliated organizations or those of the publisher, the editors, and the reviewers. Any product that may be evaluated in this article, or claim that may be made by its manufacturer, is not guaranteed or endorsed by the publisher.
References
Abbas, I., Kiyani, S. G., Ahsan, M. S., Akram, H., and Iqbal, J. (2012) Spatio-temporal analysis of water table within Rawalpindi municipal jurisdiction. Tech. Rep. Inst. Geogr. Inf. Syst. Sch. Civ. Environ. Eng. NUST.
Beladam, O., Balz, T., Mohamadi, B., and Abdalhak, M. (2019). Using ps-insar with sentinel-1 images for deformation monitoring in northeast Algeria. Geosciences 9 (7), 315. doi:10.3390/geosciences9070315
Bell, J. W., Amelung, F., Ramelli, A. R., and Blewitt, G. (2002). Land subsidence in Las Vegas, Nevada, 1935–2000: new geodetic data show evolution, revised spatial patterns, and reduced rates. Environ. Eng. Geosci. 8 (3), 155–174. doi:10.2113/8.3.155
Chen, C. W., and Zebker, H. A. (2002). Phase unwrapping for large SAR interferograms: statistical segmentation and generalized network models. IEEE Trans. Geoscience remote Sens. 40 (8), 1709–1719. doi:10.1109/tgrs.2002.802453
Chen, L., and Khan, S. D. (2010). InSAR observation of the strike-slip faults in the northwest Himalayan frontal thrust system. Comput. Geosci. 6 (5), 731–736. doi:10.1130/ges00518.1
Cho, Y. K., Leite, F., Behzadan, A., and Wang, C. (2019). “Computing in civil engineering 2019: data, sensing, and analytics,” in ASCE international conference on computing in civil engineering 2019 (America: American Society of Civil Engineers Reston).
de Luna, R. M. R., Garnés, S. J. d. A., Cabral, J. J. d. S. P., and dos Santos, S. M. (2017). Groundwater overexploitation and soil subsidence monitoring on Recife plain (Brazil). Nat. Hazards 86, 1363–1376. doi:10.1007/s11069-017-2749-y
Dixon, T. H., Amelung, F., Ferretti, A., Novali, F., Rocca, F., Dokka, R., et al. (2006). Subsidence and flooding in new Orleans. Nat. Commun. 441 (7093), 587–588. doi:10.1038/441587a
Doin, M.-P., et al. (2011). “Presentation of the small baseline NSBAS processing chain on a case example: the Etna deformation monitoring from 2003 to 2010 using Envisat data,” in Proceedings of the fringe symposium (Frascati, Italy: ESA), 3434–3437.
Fernandez, J., Prieto, J. F., Escayo, J., Camacho, A. G., Luzón, F., Tiampo, K. F., et al. (2018). Modeling the two-and three-dimensional displacement field in Lorca, Spain, subsidence and the global implications. Sci. Rep. 8 (1), 14782. doi:10.1038/s41598-018-33128-0
Figueroa-Miranda, S., Tuxpan-Vargas, J., Ramos-Leal, J. A., Hernández-Madrigal, V. M., and Villaseñor-Reyes, C. I. (2018). Land subsidence by groundwater over-exploitation from aquifers in tectonic valleys of Central Mexico: a review. Eng. Geol. 246, 91–106. doi:10.1016/j.enggeo.2018.09.023
Gao, M., Gong, H., Chen, B., Zhou, C., Chen, W., Liang, Y., et al. (2016). InSAR time-series investigation of long-term ground displacement at Beijing Capital International Airport, China. J. Tectonophys. 691, 271–281. doi:10.1016/j.tecto.2016.10.016
Ghorbani, Z., Khosravi, A., Maghsoudi, Y., Mojtahedi, F. F., Javadnia, E., and Nazari, A. (2022). Use of InSAR data for measuring land subsidence induced by groundwater withdrawal and climate change in Ardabil Plain, Iran. Sci. Rep. 12 (1), 13998. doi:10.1038/s41598-022-17438-y
Ireland, R. L., Poland, J. F., and Riley, F. S. (1984). Land subsidence in the san Joaquin valley, California, as of 1980. U. S. Gov. Print. Off.
Kazmi, A. H., and Jan, M. Q. (1997). Geology and tectonics of Pakistan. Karachi: Graphic Publishers.
Khan, J., Ren, X., Hussain, M. A., and Jan, M. Q. (2022). Monitoring land subsidence using PS-InSAR technique in Rawalpindi and islamabad, Pakistan. Remote Sens. 14 (15), 3722. doi:10.3390/rs14153722
Khan, R., Li, H., Afzal, Z., Basir, M., Arif, M., and Hassan, W. (2021). Monitoring subsidence in urban area by PSInSAR: a case study of Abbottabad City, Northern Pakistan. Remote Sens. 13 (9), 1651. doi:10.3390/rs13091651
Khorrami, M., Abrishami, S., Maghsoudi, Y., Alizadeh, B., and Perissin, D. (2020). Extreme subsidence in a populated city (Mashhad) detected by PSInSAR considering groundwater withdrawal and geotechnical properties. Sci. Rep. 10 (1), 11357. doi:10.1038/s41598-020-67989-1
Lindsey, E., and Fialko, Y. (2013). Geodetic slip rates in the southern San Andreas Fault system: effects of elastic heterogeneity and fault geometry. J. Geophys. Res. Solid Earth 118 (2), 689–697. doi:10.1029/2012jb009358
López-Quiroz, P., Doin, M.-P., Tupin, F., Briole, P., and Nicolas, J.-M. (2009). Time series analysis of Mexico City subsidence constrained by radar interferometry. J J. Appl. Geophys. 69 (1), 1–15. doi:10.1016/j.jappgeo.2009.02.006
Milillo, P., Giardina, G., DeJong, M. J., Perissin, D., and Milillo, G. (2018). Multi-temporal InSAR structural damage assessment: the London crossrail case study. Remote Sens. Environ. 10 (2), 287. doi:10.3390/rs10020287
Morishita, Y. (2021). Nationwide urban ground deformation monitoring in Japan using Sentinel-1 LiCSAR products and LiCSBAS. Prog. Earth Planet. Sci. 8 (1), 6–23. doi:10.1186/s40645-020-00402-7
Morishita, Y., Lazecky, M., Wright, T. J., Weiss, J. R., Elliott, J. R., and Hooper, A. (2020). LiCSBAS: an open-source InSAR time series analysis package integrated with the LiCSAR automated Sentinel-1 InSAR processor. Remote Sens. 12 (3), 424. doi:10.3390/rs12030424
Motagh, M., Walter, T. R., Sharifi, M. A., Fielding, E., Schenk, A., Anderssohn, J., et al. (2008). Land subsidence in Iran caused by widespread water reservoir overexploitation. Geophys. Res. Lett. 35 (16). doi:10.1029/2008gl033814
Ng, A. H.-M., Wang, H., Dai, Y., Pagli, C., Chen, W., Ge, L., et al. (2018). InSAR reveals land deformation at Guangzhou and Foshan, China between 2011 and 2017 with COSMO-SkyMed data. Remote Sens. 10 (6), 813. doi:10.3390/rs10060813
Poland, J. F., and Ireland, R. (1988). Land subsidence in the Santa Clara Valley, California, as of 1982. Dep. Interior, U. S. Geol. Surv.
Riel, B., Simons, M., Ponti, D., Agram, P., and Jolivet, R. (2018). Quantifying ground deformation in the Los Angeles and Santa Ana Coastal Basins due to groundwater withdrawal. Water Resour. Res. 54 (5), 3557–3582. doi:10.1029/2017wr021978
Rosi, A., Tofani, V., Agostini, A., Tanteri, L., Tacconi Stefanelli, C., Catani, F., et al. (2016). Subsidence mapping at regional scale using persistent scatters interferometry (PSI): the case of Tuscany region (Italy). Int. J. Appl. earth observation Geoinformation 52, 328–337. doi:10.1016/j.jag.2016.07.003
Sathiakumar, S., Barbot, S., and Hubbard, J. (2020). Earthquake cycles in fault-bend folds. J. Geophys. Res. Solid Earth 125 (8). doi:10.1029/2019jb018557
Schmidt, D. A., and Bürgmann, R. (2003). Time-dependent land uplift and subsidence in the Santa Clara valley, California, from a large interferometric synthetic aperture radar data set. J. Geophys. Res. Solid Earth 108. doi:10.1029/2002jb002267
Sheikh, I. M., Pasha, M. K., Williams, V. S., Raza, S. Q., and Khan, K. S. (2008). “Environmental geology of the Islamabad-Rawalpindi area, northern Pakistan,” in Regional studies of the potwar-plateau area (China: Northern Pakistan), 2078.
Teatini, P., Ferronato, M., Gambolati, G., and Gonella, M. (2006). Groundwater pumping and land subsidence in the Emilia-Romagna coastland, Italy: modeling the past occurrence and the future trend. Water Resour. Res. 42 (1). doi:10.1029/2005wr004242
ul Haq, F., Naeem, U. A., Gabriel, H. F., Khan, N. M., Ahmad, I., Ur Rehman, H., et al. (2021). Impact of urbanization on groundwater levels in Rawalpindi City, Pakistan. Pure Appl. Geophys. 178, 491–500. doi:10.1007/s00024-021-02660-y
Wang, H., Wright, T. J., Yu, Y., Lin, H., Jiang, L., et al. (2012). InSAR reveals coastal subsidence in the Pearl River Delta, China. Geophys. J. Int. 191 (3), 1119–1128. doi:10.1111/j.1365-246x.2012.05687.x
Watson, A. R., Elliott, J. R., and Walters, R. (2022). Interseismic strain accumulation across the main recent fault, SW Iran, from Sentinel-1 Insar Observations. J. Geophys. Res. Solid Earth 127 (2), e2021JB022674. doi:10.1029/2021jb022674
Williams, V. S., Pasha, M. K., and Sheikh, I. M. (1999). Geologic map of the Islamabad-Rawalpindi area, Punjab, northern Pakistan. USA: U.S. Geological Survey.
Xu, C., Wang, H., Ge, L., Yonezawa, C., and Cheng, P. (2006). InSAR tropospheric delay mitigation by GPS observations: a case study in Tokyo area. J. Atmos. Solar-Terrestrial Phys. 68 (6), 629–638. doi:10.1016/j.jastp.2005.11.010
Yang, Q., Ke, Y., Zhang, D., Chen, B., Gong, H., Lv, M., et al. (2018). Multi-scale analysis of the relationship between land subsidence and buildings: a case study in an eastern Beijing Urban Area using the PS-InSAR technique. Remote Sens. 10 (7), 1006. doi:10.3390/rs10071006
Zafar, W. A., Javed, F., Ahmed, R., Ehsan, M., Abdelrahman, K., Fnais, M. S., et al. (2023). Mechanics of the Kalabagh Fault, northwest Himalayan fold and thrust belt (convergence zone of India and Eurasia), using SAR interferometry and CFS. Front. Earth Sci. 11, 1231408. doi:10.3389/feart.2023.1231408
Keywords: ground subsidence, subsurface water level, buried faults, InSAR, NSBAS
Citation: Zafar WA, Javed F, Ahmed R, Shah MA, Ahmad M, Khan MY, Abdullah GMS, Khan D, Najeh T and Gamil Y (2024) Time series subsidence evaluation using NSBAS InSAR: a case study of twin megacities (Rawalpindi and Islamabad) in Pakistan. Front. Earth Sci. 12:1336530. doi: 10.3389/feart.2024.1336530
Received: 10 November 2023; Accepted: 30 January 2024;
Published: 23 February 2024.
Edited by:
Alex Hay-Man Ng, Guangdong University of Technology, ChinaReviewed by:
Marcin Kulawiak, Gdansk University of Technology, PolandYunjia Wang, China University of Mining and Technology, China
Copyright © 2024 Zafar, Javed, Ahmed, Shah, Ahmad, Khan, Abdullah, Khan, Najeh and Gamil. This is an open-access article distributed under the terms of the Creative Commons Attribution License (CC BY). The use, distribution or reproduction in other forums is permitted, provided the original author(s) and the copyright owner(s) are credited and that the original publication in this journal is cited, in accordance with accepted academic practice. No use, distribution or reproduction is permitted which does not comply with these terms.
*Correspondence: Waqar Ali Zafar, waqaraliravian@gmail.com; Taoufik Najeh, taoufik.najeh@ltu.se