Study on the impact of physical characteristics of soil-rock composite medium on its relative permittivity based on laboratory experiments
 Ning An1*
  Quan Wang1 Yangzhou Feng1 Yulong Qin1 Linke Huang1 Yongqiang Tian1 Fuping Zhang1 Zihui Zhao1 Jun Chen1
  Changrui Yao2,3
- 1State Grid East Inner Mongolia Electric Power Company Limited, Hohhot, China
- 2Chongqing Research Institute, Harbin Institute of Technology, Chongqing, China
- 3School of Civil Engineering, Harbin Institute of Technology, Harbin, Heilongjiang, China
The permittivity of soil-rock composite media is crucial for interpreting data originating from geophysical surveys such as ground-penetrating radar (GPR) imaging. At present, relevant theoretical research on the correlation analysis between the electrical and physical parameters of soil-rock composite media has not yet resulted in a complete reference system. This makes it difficult to characterize soil-rock composite media using the electromagnetic characteristic parameters of rock and soil media. In this study, the indoor electromagnetic testing method was used to extract electrical parameters such as the relative permittivity of soil-rock composite, and the influence of water content, density, soil-rock ratio, and other factors on the electrical parameters of soil-rock composite medium was analyzed. Furthermore, an artificial neural network prediction model was established, and the accuracy of the model was evaluated. The results showed that the relative permittivity tends to decrease with an increase in saturation when the moisture content of the mixture is high. The rock has a lower permittivity value than the surrounding soil particles. When the rock content increases, the average permittivity and conductive permittivity of the composite medium decreases. The main factors affecting the electrical properties of soil-rock composite media (in order of their influence, from most to least) are water content, compaction degree, and soil-rock ratio. These results provide a reliable reference for field geophysical exploration.
1 Introduction
Geological disasters (such as landslides and collapses) that often occur in shallow surface layers will have a negative impact on engineering facilities. Soil-rock composite medium is the main solid material affected by geological disasters and mostly consists of small soil particles and large rock fragments. Due to the difference in the mesoscopic composition scale of this type of rock and soil medium, there are considerable differences in the performance of corresponding macro-properties, such as mechanical properties, permeability features, and resistivity characteristics.
Currently, ground-penetrating radar (GPR) is extensively utilized to detect the distribution, formation shape, and thickness of soil and rock mixtures (Fisher et al., 2011; Chen et al., 2023). Its application is increasingly common for earth embankments, subgrade tunnels, and geological explorations, and it has contributed to progress in engineering construction and geological surveys, enhanced the overall understanding of underground conditions, and made project executions more efficient and accurate. The electromagnetic properties of soil-rock composite media, such as resistivity and permittivity, are crucial for interpreting data originating from geophysical surveys such as GPR and resistivity imaging (Luo et al., 2019; Fu, 2021).
Experimental works on the study of permittivity by many research scholars have shown that the relationship between soil property and dielectric constant is greatly affected by soil physical parameters such as water content, density and soil-rock ratio. Archie (1942) studied the effectiveness of resistivity logging for determining reservoir characteristics and found that the detection effect depends on the resistivity measurement accuracy, the detailed data of the relationship between resistivity and formation, and the conductivity information of formation waters. They proposed a specific equation for estimating resistivity that could be used effectively under certain conditions. Topp et al. (1980) employed a time domain reflectometer (TDR) to examine the dependency of the relative permittivity on volumetric water content, bulk density, temperature, and soluble salt content. They established an empirical relationship between the apparent relative permittivity and the volumetric water content that accurately estimates the water content of various granular materials and soil types under different conditions. Olhoeft (1981) analyzed the role of the electrical properties of rocks in various geological applications, including mineral exploration and crustal exploration, based on frequency, temperature, water content, and other variables. Several experimental techniques were employed to understand the underlying mechanism. Abu-Hassanein et al. (1996) investigated the impact of resistivity compression in compacted clay and found that it was only related to the initial saturation and exponential properties, and that its relationship with water conductivity varied in different soils. Larger liquid limit, plasticity index, fine powder, or clay content resulted in smaller resistivity. Guo et al. (2003) analyzed the common factors affecting the engineering properties and resistivity of soil mass, studied the relationship between the particle size, water content, saturation, density, and resistivity of different types of soil through laboratory experiments, and discussed the relationship between compressibility, cohesion, elastic modulus, and resistivity of clay. They also obtained a series of relationship curves and fitting formulas and explained their meanings. Liu et al. (2004) used an improved Miller soil box to investigate the indoor resistivity of soil samples. They found that the main factors affecting soil resistivity are water content, pore water conductivity, saturation, and soil type. They established a model based on the Archie formula, and successfully detected underground targets using resistivity imaging of this model. Cha (2007) took typical structural unsaturated soils such as Hefei expansive soil and Xi’an loess as research objects, and conducted a comprehensive study on resistivity testing technology and its application in quantitative analysis of soil structure. Their research results demonstrated that the resistivity technique can effectively reflect the changes in soil water content and saturation, and can be utilized to identify the structural characteristics of unsaturated soil. Zhu et al. (2011) studied the empirical relationship between soil dielectric properties and soil water content of four typical soil types in China. They found that the Topp equation had a large prediction error for some soil types, while the Herkelrath equation provided a better prediction for all soil types and performed well in predicting the water content of two rice soils. Parkhomenko (2012) analyzed the influence degree of state parameters of rock mass on electrical indexes of rock mass based on a large number of rock resistivity tests. Bery and Saad (2012) examined cohesive sandy soils to establish empirical correlations between resistivity and geotechnical parameters such as effective cohesion, internal friction angle, porosity, saturation, water content, and the Atterberg limit. Their research provided an effective tool for understanding the fluid behavior and electrical properties of medium-grained cohesive sandy soil. Siddiqui and Osman (2013) discussed the correlation between resistivity and various soil properties through field investigation and indoor measurement, and found that resistivity was significantly correlated with water content, friction angle, and plasticity index, while it was weakly correlated with cohesion, unit weight, and effective size of soil. Wang (2013) systematically investigated the resistivity characteristics of multiphase soil-rock composite media through model tests and theoretical analysis.
Theoretical approaches show by researchers that there is a complex nonlinear relationship between dielectric constant and physical properties of soil-rock mixed medium. Zhou et al. (2015) studied the influence of pore fluid composition and temperature on soil resistivity, and found that when the water content was constant, the decrease in soil porosity led to a decrease in resistivity. Their results showed that pore fluid composition and temperature affect soil resistivity. Gao (2016) examined the relationship between the relative permittivity of yellow loess and the amplitude of GPR reflection through laboratory experiments, analysis, numerical simulation, and field experiments, and proposed a rapid nondestructive testing method for evaluating loess grouting quality. Through the experimental measurement and theoretical analysis of soil relative permittivity and volumetric water content, Liao et al. (2016) acquired the applicable range and limitations of different relative permittivity models, and established a simplified relative permittivity model to further investigate the effect of water content on soil engineering properties. They also put forward an evaluation index for the liquid plastic limit of loess based on the relative permittivity. Chu et al. (2017) found that the expansion rate of expansive soil increases with the increase of initial resistivity and decreases with the increase of overlying load. Their results also indicated that the resistivity parameter can be used to predict the swelling property of expansive soil. Zhang (2017) investigated the physical, mechanical, and electrical properties of kaolin with different water contents and particle sizes, and reported that both water content and particle size affect the dry density, porosity, and electrical properties of clay, and there is a correlation relationship between mechanical parameters and electrical parameters. Bery and Ismail (2018) studied the actual relationship between soil resistivity, water content, and porosity in tropical soils on Penang Island. Their proposed empirical correlation laid a foundation for future research on the electrical properties of tropical soils. Zhang et al. (2018) conducted resistivity piezoelectric cone penetration tests at six sites in Jiangsu Province to examine the correlation between resistivity and soil parameters, including pore fluid salt content, clay content, sensitivity, plasticity index, unit weight, and water content, to understand the mechanism controlling resistivity change.
Application of NN in the field of detecting electrical characteristics have been conducted by Alsharari et al. (2020) show that the ANN model provided the most accurate prediction. Some practical guidelines and examples were provided by these scholars for designing and testing nonlinear relationships in engineering intelligent systems and applications. Duan et al. (2021) analyzed the influence of water and salt on the conductivity of loess, and reported that there is an exponential relationship between the resistivity of loess and the water content. They also found that with the increase in the water content, the resistivity of loess decreases substantially. The study provided a theoretical basis for the prediction of moisture and salinity and a valuable reference for the field application of resistivity observation technology. Xu et al. (2023) performed a forward correlation analysis for large-particle size soil-rock mixed fillers.
In general, there has been extensive research on the electrical properties of soil and rock mass, including model tests and theoretical analysis. However, the influence of the soil-rock ratio is seldom considered, and there is a significant lack of further investigation in laboratory tests. By bridging the gap between electrical and physical properties of soil-rock composites, this study sets a new benchmark for predictive accuracy in geophysical explorations, and the results are poised to revolutionize the understanding of subsurface conditions, offering a substantial leap forward in geological survey accuracy and safety in engineering constructions.
This manuscript presents the experimental results when the influence of coupling effects of multiple factors (moisture content, density, and the soil-rock ratio) on the electrical parameters of the soil-rock composite medium were analyzed. Furthermore, it describes and discusses the results of a prediction model of resistivity and the relative permittivity of soil-rock mixture was built based on a multilayer perceptron (MLP) algorithm. The prediction accuracy was also evaluated.
2 Materials and methods
2.1 Experiment scheme
According to the standard of geotechnical test method, gravel with appropriate particle size was selected and the soil retrieved from the site was treated to prepare the soil-rock mixture for the test. In the study, 5 mm is generally defined as the size boundary between coarse and fine particles in a soil-rock mixture, treating particles smaller than 5 mm in diameter as soil and those larger than 5 mm as rock blocks. Based on the Standard of Geotechnical Test Method (GB/T50123-2019) (GB National Standard, 2019), the maximum particle size of the composite medium shall not exceed 1/8 of the diameter and 1/4 of the height of the sample. The boundary was chosen based on prior empirical evidence and theoretical models that suggest its relevance and impact on the study’s results.
Physical properties of the soil-rock medium component, including key parameters such as dry density, water content and soil-rock ratio. These parameters are crucial for understanding soil mechanical behaviour and water transport, thus strongly influence the relative permittivity of soil-rock medium component (Duan et al., 2021). The relative permittivity of samples with different water contents and dry densities was tested under different rock contents. The specific test scheme was as follows: ① The dry densities were 1.15, 1.20, 1.25, 1.30, 1.35, and 1.40 g/cm3, respectively. ② The mass water content around the optimal water content was 19%, 22%, 25%, 28%, 31%, and 34%, respectively. ③ The rock content was 0%, 30%, 40%, and 50%, respectively. The pure soil medium sample without rock material was used as the soil control. ④ The soil column samples were made according to the above water content and dry density, and the relative permittivity was measured under different rock contents.
2.2 Experiment procedure
According to the test scheme designed in the above section, relevant soil tests were conducted in line with the Standard for Soil Test Methods (GB/T50123-2019). Specific test steps were as follows:
① The soil material required for sample preparation was screened, dried at 105°C in an electric bellows for 24 h, packaged and cooled in a sealed bag, and the dry soil mass corresponding to different dry densities was weighed by the same volume mass method;
② To ensure the quality of the prepared soil sample, 1 kg of soil was evenly distributed in the dry soil tray. The soil was evenly mixed and kneaded during each water spray humidification step to prevent the formation of large soil clumps within the sample. After the water content configuration was completed, the soil sample was sealed in a plastic bag and stored in a cool place for 24 h to ensure the uniform distribution of moisture.
③ Soil column samples with a diameter of 100 mm and height of 40 mm were prepared by compaction test.
④ The prepared test samples were sealed with plastic wrap and placed in an incubator for 12 h, and then the capacitance of the soil-rock mixed samples was measured using a VC4092E LCR digital bridge.
⑤ After the test, the samples were dried to measure the actual water content compared to the water content of the pre-designed soil column, and the average mass water content was converted into volumetric water content.
2.3 Experiment principle
The parallel plate capacitance method was employed to measure the capacitance of the sample, and then the formula was utilized to convert it to obtain the relative permittivity of the sample as following.
where εr is the relative permittivity;
To ensure the accuracy of the results and enhance the test data’s precision, an improved parallel plate capacitance testing device was designed. The sample size was the soil sample with a diameter of 100 mm and a height of 20 mm. Considering the diameter of rock, the specimens of soil-rock mixture are uniformly prepared to a thickness of 20mm, ensuring a consistent interaction volume for the electrical field.
An improved parallel plate electrode device was used to measure the relative dielectric constant of soil samples. The relative dielectric constant is obtained by measuring the capacitance of soil samples with parallel plate capacitance method. The test principle and device are shown in Figure 1 respectively. VC4092E LCR digital bridge is connected with parallel plate electrode wire. The 100 mm diameter copper electrode is in close contact with the top and bottom of the sample and applies the same pressure. The capacitance of the sample was tested with the same frequency and voltage, and the test photos are shown in Figure 2.

FIGURE 1. Test principle and device. (A) Principle of parallel plate capacitance measurement (B) Improved capacitance test device.

FIGURE 2. Electrical test with parallel plate capacitance method. (A) Reconstructed sample (B) Soil-rock composite sample (C) VC4092E LCR digital bridge (D) Parallel plate electrode device.
3 Analysis of results
3.1 Analysis of the correlation between water content and the relative permittivity
To compare the influence law of water content of soil and rock body on the relative permittivity, the above relevant test data are displayed in Figure 3. It can be observed that the relative permittivity or permittivity is positively correlated with the dry density of soil-rock composite media. For a material with a bulk density of 1.50 g/cm³, permittivity increases from approximately 8 to just under 20 as water content rises from 4% to 12%. Similar trends are observed for the other densities, with the 1.80 g/cm³ density material exhibiting the highest permittivity across all water content levels, reaching a value near 24 at 12% water content. The slopes of the curves suggest that permittivity is more sensitive to changes in water content at higher bulk densities. Keeping the water content constant, an increase in dry density indicates a higher rate of pore water filling. The higher filling rate induces an obvious polarization effect in the medium, and the water molecules respond to the arrangement of the external electric field. With the increase of the degree of polarization, the relative permittivity of the medium increases, which enhances the ability to store potential energy. Under the condition of fixed water content, the relative permittivity of soil-rock mixed medium can be slightly improved by increasing the compacting degree. Our results revealed that the change of compactness had little impact on the change of the relative permittivity. On the contrary, there was a more obvious positive correlation between the water content and relative permittivity. When the water content increased, the relative permittivity of soil samples increased significantly. This is mainly because the increase of water will change the dielectric property of the soil, increase the polarization effect, and cause an obvious increase in the relative permittivity.

FIGURE 3. Effect of water content on dielectric constant: (A) Water content–dielectric curve of pure soil medium, (B) Water content–dry density–dielectric constant relation of pure soil medium, (C) Water content–dielectric curve of medium with 30% stone content, (D) Water content–dry density–dielectric constant relationship at 30% stone content, (E) Water content–dielectric curve of medium with 40% stone content, (F) Water content–dry density–dielectric constant relationship at 40% stone content, (G) Water content–dielectric curve of medium with 50% stone content and (H) Water content–dry density–dielectric constant relationship at 50% stone content.
The relationship between volume moisture content and dielectric constant of soil-rock mixture is shown in Figure 4. As the water content increases from approximately 4%–24%, a corresponding rise in conductivity is observed for all densities, with higher densities displaying generally higher conductivity values, suggesting that both water content and soil density significantly influence soil electrical conductivity. Under the condition of constant water content, the relative permittivity of the soil-rock mixture increases with the increase of dry density. However, this effect is small and does not contribute substantially to the overall electrical characteristics of the medium. More important is the relationship between the volumetric water content and the relative permittivity. The increase in the volumetric water content leads to an increase in the relative permittivity of the sample. Our results indicated that the water content played a more important role in the dielectric properties of the medium, mostly because it increased the polarization and thus improved the relative permittivity.

FIGURE 4. Effect of volumetric water content on the relative permittivity: (A) Volumetric water content-dielectric curve of pure soil medium, (B) Volumetric water content-dry density-relative permittivity relationship of pure soil medium, (C) Volumetric water content-dielectric curve of medium with 30% rock content, (D) Volumetric water content-dry density-relative permittivity relationship at 30% rock content, (E) Volumetric water content-dielectric curve of medium with 40% rock content, (F) Volumetric water content-dry density-relative permittivity relationship at 40% rock content, (G) Volumetric water content-dielectric curve of medium with 50% rock content, and (H) Volumetric water content-dry density-relative permittivity relationship at 50% rock content.
3.2 Analysis of the correlation between the dry density and relative permittivity
Dry density and compaction of soil particles have important effects on dielectric properties. The spacing between soil particles changes with the increase of dry density, which affects the polarization of the surface electric field. The relationship between the relative permittivity and dry density under different water contents is shown in Figures 5, 6. It can be noticed that under the same water content, the relative permittivity changes more obviously with dry density, and the relative permittivity is proportional to the dry density and increases with the dry density.

FIGURE 5. Influence of water content on the relative permittivity: (A) Dry density-dielectric curve of pure soil media, (B) Dry density-water content-relative permittivity relationship of pure soil medium, (C) Dry density-dielectric curve of medium with 30% rock content, (D) Dry density-water content-relative permittivity relationship at 30% rock content, (E) Dry density-dielectric curve of medium with 40% rock content, (F) Dry density-water content-relative permittivity relationship at 40% rock content, (G) Dry density-dielectric curve of medium with 50% rock content, and (H) Dry density-water content-relative permittivity relationship at 50% rock content.
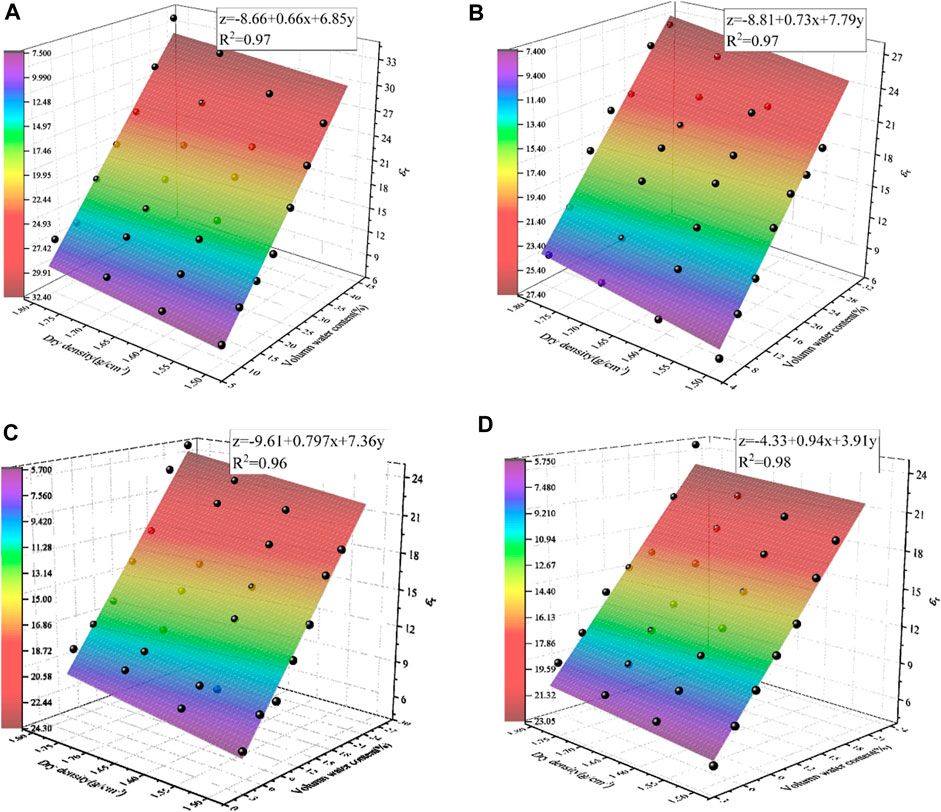
FIGURE 6. Volumetric water content-dry density-relative permittivity relationship of soil-rock composite: (A) Pure soil medium, (B) The earth to rock ratio is 7:3, (C) The earth to rock ratio is 6:4, and (D) The earth to rock ratio is 5:5.
Owing to the strong water absorption of soil in soil-rock mixed medium, when the dry density is small, the medium will get larger pores and a smaller relative permittivity. The contact area between soil particles increased with the increase of dry density, but the water content remained unchanged, and the water film thickness and relative permittivity increased uniformly. When the pore water is affected by the increase in water content, the relative permittivity increases gradually at the same dry density.
In Figure 6A, it is depicted that conductivity increases with both dry density and water content, as described by the fitted equation z = −8.81 + 0.73x + 7.79 years, with x representing dry density and y representing water content. The high coefficient of determination, R2 = 0.97, indicates a strong correlation between these variables and the model’s predictive capability. The other subplots have shown the same pattern. It was found that the relative permittivity of soil-rock composite media increases with increasing compactness when the water content remains unchanged. This increase can be attributed to the higher pore water filling rate, the increase of dissolved ion concentration, and the increase of polarization charge generated by the unit volume of soil and rock body, which together enhance the polarization effect. The permittivity of soil-rock composite media is positively correlated with the degree of compactness. When the water content remains constant, the increase in compactness will lead to a small increase in the permittivity. However, the relative permittivity shows a substantial, almost linear increase as the water content increases. This relationship changes considerably at low water content levels, where an increase in compactness results in only a small change to the relative permittivity. However, these changes become more pronounced as moisture increases and free water becomes the dominant factor. It is worth mentioning that once water content exceeds a certain threshold, further increases in moisture do not greatly affect soil saturation.
The variation of dry density plays an important role in the polarization effect of soil-rock mixed media samples. The increase in dry density indicates that the structure of soil-rock composite media is dense, which is caused by the decrease in pore ratio, and the polarization effect in the soil matrix significantly increases in this case. The interaction between the distribution and properties of water in soil-rock mixtures is intricately related to the properties of clay particles. The decrease of the clay particle size increases the specific surface area of the soil, leading to an increased degree of water adsorption to the clay particles. This process eventually forms a layer of bonded water that impedes the conduction of electricity. Besides, smaller soil particles inherently give rise to larger pore spaces. At constant volume, these soil-rock mixtures exhibit a larger proportion of pore space. The increased porosity, combined with the reduced free water volume, inhibits the continuity of water in these pores and impedes the ability of the soil-rock mixture to conduct current.
3.3 Analysis of the impact of soil-rock ratio on the relative permittivity
To compare and investigate the change rule of the influence of water content of soil-rock mixed medium on the relative permittivity under different rock contents, relevant test data are exhibited in Figure 7. The data points for each saturation level follow a nonlinear trajectory, with conductivity escalating more steeply beyond the 15% water content threshold, suggesting an accelerated interaction between water content and conductivity at higher moisture levels.

FIGURE 7. Influence of different rock content ratios on water content-relative permittivity relationship: (A) The dry density is 1.5 g cm−3, (B) The dry density is 1.6 g cm−3, (C) The dry density is 1.7 g cm−3, and (D) The dry density is 1.8 g cm−3.
The law of the relative permittivity changing with rock content in the above figure is not obvious, because the relative permittivity increases with the increase of soil saturation, and there is a positive correlation between the two. However, since saturation is jointly affected by soil water content and porosity, rock content not only affects the average relative permittivity of the composite medium but also influences the porosity and water content of the soil-rock mixture, which in turn affects the relative permittivity. The effect of water content and saturation on the relative permittivity of the sample is more significant than that of rock content.
As can be seen from Figure 8A, the regression equation z = −0.41 + 0.76x–0.08 years, with x representing water content and y representing saturation percentage, quantifies this relationship. The plane shows that conductivity generally increases with water content. However, the negative coefficient for saturation indicates a slight decrease in conductivity with increasing saturation, a trend captured by a high coefficient of determination, R2 = 0.95, signifying a strong fit to the data. The other subplots have shown the same pattern that volumetric water content of the soil-rock mixture has a significant impact on its relative permittivity. When the water content is low, the resistivity will increase as the relative permittivity increases. When the water content is high, the relative permittivity tends to decrease with the increase of saturation. Rock content affects the relative permittivity of the composite medium. With the increase in rock content, the relative permittivity of the composite medium tends to decrease because the rock in the soil body has a smaller relative permittivity value than the surrounding soil particles. Thus, when the rock content increases, the average relative permittivity of the soil-rock composite medium decreases, leading to a decrease in the relative permittivity. However, the influence of rock content on the relative permittivity is far less significant than that of water content.
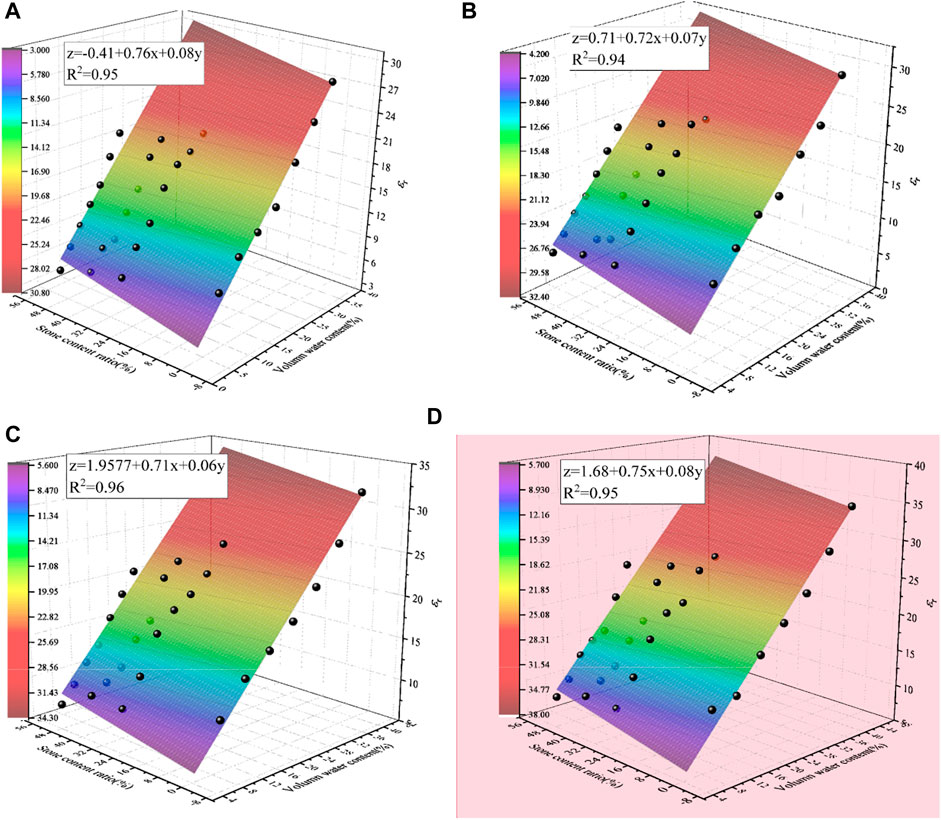
FIGURE 8. Curves of volumetric water content and the relative permittivity of medium with different soil-rock ratios: (A) The dry density is 1.5 g cm−3, (B) The dry density is 1.6 g cm−3, (C) The dry density is 1.7 g cm−3, and (D) The dry density is 1.8 g cm−3.
3.4 Analysis of electromagnetic parameter of soil-rock composite medium
The permittivity of soil-rock composite media depends on many factors, including the structure and composition of the soil and rock, and the properties of the water present in the soil. In the case that the chemical composition, temperature, and pore water composition of soil and rock are known, the relative permittivity of soil-rock composite media is primarily determined by saturation, compacting degree, and water content. The complex interaction between these factors can promote the change of electrical parameters of soil-rock composite media. At the same time, it is essential to study these multiple factors comprehensively to accurately understand and predict the change law of underground electrical parameters.
Considering the change in water content, dry density, and rock content, the change of the relative permittivity of the soil-rock mixed medium is displayed in Figure 9. Considering the change in water content, dry density, and rock content, the change of the relative permittivity of the soil-rock mixed medium is displayed in Figure 9. The data points suggest that as water content and dry density increase, the soil conductivity also tends to increase, with the highest conductivity values observed at the greatest density and water content levels. This pattern is dispersed throughout the volume of the plot, indicating variability in conductivity with changes in soil properties. The main factor of the relative permittivity of the soil-rock mixture is water content. Like the relationship between rock content and resistivity, water content also has a substantial effect on the relative permittivity of a mixture. When the water content is high, the relative permittivity tends to increase, and when the water content is low, the relative permittivity tends to decrease. This is because the relative permittivity value of water is much larger than that of rock or soil, so when the water content is high, the overall relative permittivity of the mixture can be greatly enhanced.
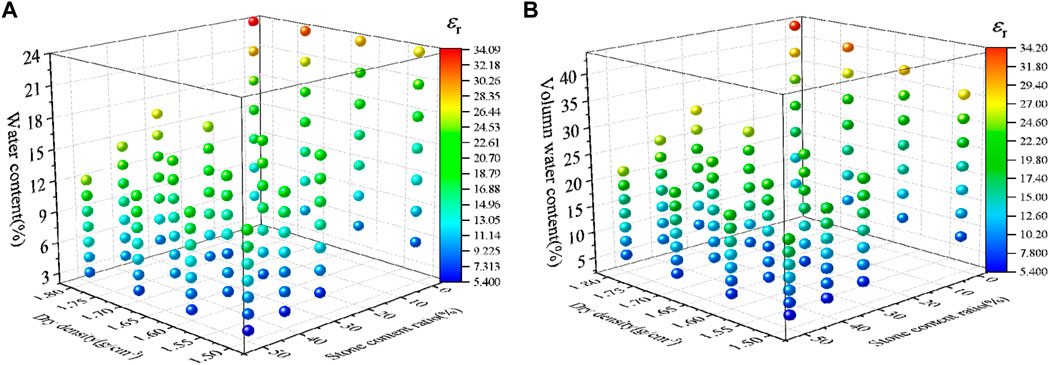
FIGURE 9. Influence of water content, dry density, and rock content on the relative permittivity: (A) Gravimetric (Mass) water content and (B) Volumetric water content.
Considering the change in water content, dry density, and rock content, the change of the relative permittivity of the soil-rock mixed medium is displayed in Figure 9. The data points suggest that as water content and dry density increase, the soil conductivity also tends to increase, with the highest conductivity values observed at the greatest density and water content levels. This pattern is dispersed throughout the volume of the plot, indicating variability in conductivity with changes in soil properties. The main factor of the relative permittivity of the soil-rock mixture is water content. Like the relationship between rock content and resistivity, water content also has a substantial effect on the relative permittivity of a mixture. When the water content is high, the relative permittivity tends to increase, and when the water content is low, the relative permittivity tends to decrease. This is because the relative permittivity value of water is much larger than that of rock or soil, so when the water content is high, the overall relative permittivity of the mixture can be greatly enhanced.
The content of rock in the mixture affects the relative permittivity of the composite medium. The relative permittivity of the soil-rock mixture tends to decrease with the increase in rock content. This is chiefly because the rocks in the mixture have a smaller relative permittivity value than the surrounding soil particles. Hence, when the rock content increases, the average relative permittivity of the composite medium decreases, causing a decrease in the relative permittivity. However, the influence of rock content on the relative permittivity is far less significant than that of water content.
In general, the rock content in the soil-rock mixture has a complex impact on the relative permittivity of the composite medium. By understanding these factors and their interactions, accurate models can be developed to predict the permittivity of soil-rock mixtures with different rock contents. This is critical for a range of applications including geophysical prospecting and soil moisture measurements.
3.5 Resistivity and permittivity model of soil-rock composite medium
Traditional methods of estimating resistivity and permittivity usually involve invasive techniques, complex data processing, and time-consuming laboratory measurements, which all have low feasibility and are not cost-effective. Existing methods of predicting resistivity and permittivity fall roughly into two categories: empirical and computational. Empirical methods rely on laboratory measurements, field observations, and established relationships to estimate the properties of materials. Examples of empirical methods include the use of Archie’s law to predict electrical resistivity and dielectric mixing models to estimate relative permittivity. Although these methods can provide reasonable estimates, they may be limited by the availability of representative samples, assumptions, and applicability to specific geological settings. Computational methods involve numerical simulations, inversion algorithms, and data-driven techniques to estimate resistivity and permittivity. Examples of computational methods include finite-difference time-domain (FDTD) modeling, full waveform inversion (FWI), and various optimization algorithms. These methods can provide more accurate predictions and detailed subsurface models, but their calculations can be costly, are sensitive to initial conditions, and require expertise to implement and interpret.
Neural networks provide an effective alternative for predicting electrical resistivity and the relative permittivity. Neural networks are capable of learning complex patterns and nonlinear relationships between input and output variables. They have been broadly applied to a variety of regression and classification tasks in different fields, with remarkable success in learning from large data sets and providing accurate predictions. Neural networks reduce computing time, improve scalability, and provide the capability to generalize to new, invisible data.
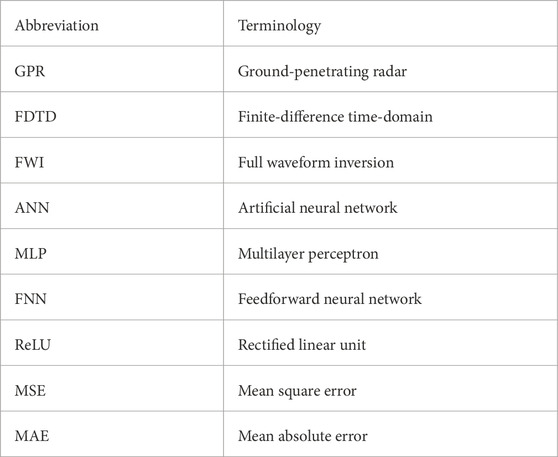
The neural network model selected in this study is called a feedforward neural network (FNN) or multilayer perceptron (MLP). It is the basic architecture widely used in the field of artificial neural networks. For the resistivity prediction problem, we selected an FNN with three fully connected hidden layers. The first hidden layer contained 16 neurons, the second hidden layer contained 8 neurons, and the last output layer contained 1 neuron. The neural network structure is shown in Figure 10. The activation function for the hidden layer was the rectified linear unit (ReLU) function, while the output layer used linear activation functions. The motivation for selecting an FNN with multiple hidden layers and ReLU activation functions was their ability to model nonlinear relationships between input features and output targets. The abbreviations that appear in this article are summarized in Appendix A.

FIGURE 10. Neural network structure model.
Before inputting data into the neural network, a standardized scaling technique was applied using the StandardScaler function in the scikit-learn library to normalize data. The purpose of normalization was to ensure that each input feature had a similar range and to enhance the training speed and performance of the neural network. Output goals were also standardized to ensure consistency between input and output data. Then the data were split into the following three groups: training set, verification set, and test set. The training set contained 80% of the data, while the verification set and the test set each contained 10% of the data. Splitting was performed randomly using the train_test_split function in the scikit-learn library. The purpose of data splitting was to evaluate the performance of the neural network on unknown data and to prevent over-fitting during training.
The optimization algorithm utilized during the training was the Adam optimizer, which is an adaptive learning rate optimization algorithm, very suitable for problems with large data sets and many parameters. Mean square error (MSE) was chosen as the loss function of the model because it is commonly used for regression problems. The mean absolute error (MAE) was selected as the evaluation index to evaluate the model performance. Relative permittivity prediction was trained on models of 100 epochs with a batch size of 16. The analysis of the training process is exhibited in Figure 11. The selection of superparameters (hyperparameters) was based on empirical tests, which aimed to achieve the best performance without over-fitting.
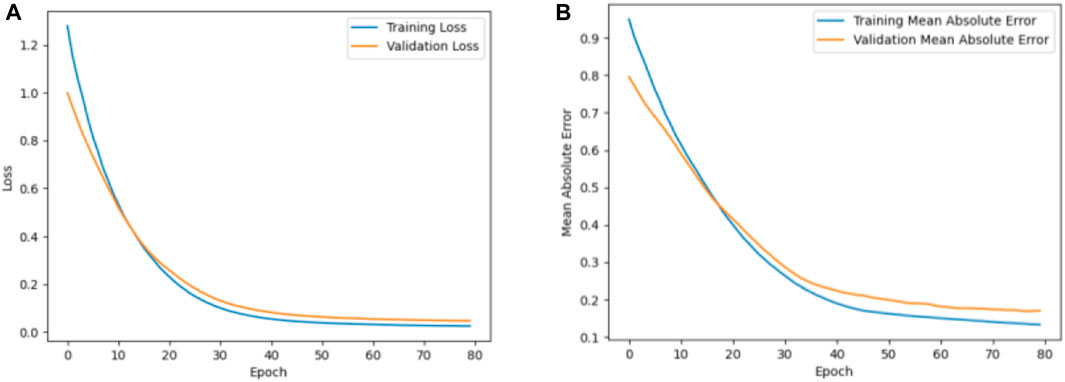
FIGURE 11. Training process of relative permittivity prediction model: (A) Loss function, and (B) MAE.
To visualize the prediction accuracy of the model, the predicted and actual values of the training set and test set are presented in Figure 12, by which the predicted and the true values of the relative permittivity can be compared.

FIGURE 12. Comparison between the predicted and actual relative permittivity.
The advantages of the neural network method include its capability to capture complex nonlinear relationships between input features and target attributes. Compared with the traditional empirical relationship and other methods, it has excellent performance. However, there are also some weaknesses and limitations. A large and diverse data set is required to effectively train neural networks. Without sufficient training data, the model may be prone to overfitting, or it may not generalize well to new situations. Furthermore, our model relied on a specific set of input characteristics, which may not be applicable to all GPR data sets or geological settings.
The quality and representativeness of the input data may affect model performance and generalization. For example, biases or inaccuracies in training data sets may limit the model’s ability to accurately predict relative permittivity values in other settings. The computational requirements of training and deploying neural network models are also a problem, especially in real-time or resource-constrained applications. Adapting the model to different geological environments using transfer learning or domain adaptation techniques can help us better generalize the model to different geological environments and GPR data sets. This enhances its applicability to a variety of applications and environments.
4 Conclusion
In this study, a series of lab tests were carried out to figure out the relative dielectric constant of the soil-rock mixture, which is commonly encountered in practical engineering applications of GPR. Basic parameters such as the water content, dry density, and soil-rock ratio were selected to design the electrical characteristic test for soil-rock composite media, and the correlation between them was analyzed.
(1) The volumetric water content of the soil-rock mixture has a substantial impact on the relative permittivity. When the water content is high, the relative permittivity tends to decrease with an increase in saturation. The rock has a lower permittivity value than the surrounding soil particles. When the rock content increases, the average permittivity and the conductive permittivity of the composite medium decrease. However, the influence of rock content on the permittivity is far less significant than that of the water content.
(2) When the compositional makeup of soil-rock particles remained constant, the primary factors that modulated the electrical characteristics of the soil-rock composite medium were identified as water content, compactness, and soil-rock ratio. The degree of influence, from most to least significant, was as follows: water content > compactness > soil-rock ratio.
(3) A prediction model of the relative permittivity of the soil-rock composite medium was built based on a neural network that predicts the relative permittivity of the corresponding soil-rock mixed medium based on the water content, dry density, and soil-rock ratio.
Data availability statement
The original contributions presented in the study are included in the article/supplementary material, further inquiries can be directed to the corresponding author.
Author contributions
NA: Conceptualization, Writing–original draft. QW: Data curation, Writing–review and editing. YF: Formal Analysis, Writing–review and editing. YQ: Formal Analysis, Writing–review and editing. LH: Investigation, Writing–review and editing. YT: Project administration, Resources, Writing–review and editing. FZ: Methodology, Project administration, Writing–review and editing. ZZ: Investigation, Methodology, Writing–review and editing. JC: Software, Supervision, Writing–review and editing. CY: Supervision, Validation, Visualization, Writing–review and editing.
Funding
The author(s) declare financial support was received for the research, authorship, and/or publication of this article. This work was supported by Enterprise Authorized Project supported by State Grid Gansu Power Company Longnan Power Supply Company (SGGSLN00JSGC2310476), the Chongqing Technology Innovation and Application Development Special Key Project of Chongqing Science and Technology Bureau (CSTB2022TIAD-KPX0125), the Chongqing Natural Science Foundation Project of Chongqing Science and Technology Bureau (CSTB2023NSCQ-MSX0980, CSTB2023NSCQ-MSX0082), the Research and Development Project of the Ministry of Housing and Urban-Rural Development (Grant Nos. 2022-K-086 and 2022-K-040), the Chongqing Construction Science and Technology Project of Chongqing Housing and Urban-Rural Development Commission (City Science Character 2022 No. 1-1 and 2023 No. 5-6). The funder was not involved in the study design, collection, analysis, interpretation of data, the writing of this article, or the decision to submit it for publication.
Conflict of interest
Authors NA, QW, YF, YQ, LH, YT, FZ, ZZ, and JC were employed by State Grid East Inner Mongolia Electric Power Company Limited.
The remaining author declares that the research was conducted in the absence of any commercial or financial relationships that could be construed as a potential conflict of interest.
Publisher’s note
All claims expressed in this article are solely those of the authors and do not necessarily represent those of their affiliated organizations, or those of the publisher, the editors and the reviewers. Any product that may be evaluated in this article, or claim that may be made by its manufacturer, is not guaranteed or endorsed by the publisher.
References
Abu-Hassanein, Z. S., Benson, C. H., and Blotz, L. R. (1996). Electrical resistivity of compacted clays. J. Geotechnical Eng. 122 (5), 397–406. doi:10.1061/(asce)0733-9410(1996)122:5(397)
Alsharari, B., Olenko, A., and Abuel-Naga, H. (2020). Modeling of electrical resistivity of soil based on geotechnical properties. Expert Syst. Appl. 141, 112966. doi:10.1016/j.eswa.2019.112966
Archie, G. E. (1942). The electrical resistivity log as an aid in determining some reservoir characteristics. Trans. AIME 146 (01), 54–62. doi:10.2118/942054-g
Bery, A. A., and Ismail, N. E. H. (2018). Empirical correlation between electrical resistivity and engineering properties of soils. Soil Mech. Found. Eng. 54, 425–429. doi:10.1007/s11204-018-9491-7
Bery, A. A., and Saad, R. (2012). Tropical clayey sand soil’s behaviour analysis and its empirical correlations via geophysics electrical resistivity method and engineering soil characterizations. Int. J. Geosciences 3 (1), 111–116. doi:10.4236/ijg.2012.31013
Cha, P. (2007). Resistivity characteristics and application of structural unsaturated soils. Dhaka, Bangladesh: Southeast University.
Chen, S., Wang, K., and Zhao, M. (2023). Research progress on genesis and resistivity characteristics of soil-rock mixtures. J. Chongqing Jiaot. Univ. Nat. Sci. Ed. 41 (12), 112–119.
Chu, Y., Cha, F., Liu, S., Cai, G., and Kou, B. (2017). Evaluation of swelling properties of expansive soils based on resistivity method (in Chinese). Rock and Soil Mechanics 38 (1), 157–164.
Duan, Z., Yan, X., Sun, Q., Tan, X., and Dong, C. (2021). Effects of water content and salt content on electrical resistivity of loess. Environ. Earth Sci. 80, 469–515. doi:10.1007/s12665-021-09769-2
Fisher, T. G., Jol, H. M., and Smith, D. G. (2011). Ground-penetrating radar used to assess aggregate in catastrophic flood deposits, northeast Alberta, Canada. Can. Geotechnical J. 32 (5), 871–879. doi:10.1139/t95-083
Fu, Y. (2021). Soil-rock-mixture big particle size fillers of GPR forward modeling and signal analysis. Beijing, China: Beijing jiaotong university. doi:10.26944/.dc.nki.Gbfju.2021.001222
Gao, Lv (2016). Study on dielectric Parameter Characteristics of loess Fill and forward modeling and interpretation of geological radar echoes. Xi 'an, China: Xi 'an University of Technology.
GB National Standard (2019). Standard for geotechnical test methods. GB/T 50123-2019. China: GB National Standard.
Guo, X., Liu, T., Jia, Y., and Huang, X. (2003). Experimental study on the relationship between engineering mechanical properties and resistivity of soil (in Chinese). Prog. Geophys. 18 (1), 151–155.
Liao, H., Sun, J., Zan, Y., Zhu, Q., and Gu, F. (2016). Study on dielectric constant model of soil and its application in engineering (in Chinese). Chin. J. Geotechnical Eng. 38 (S2), 36–41.
Liu, G., Wang, Z., and Huang, J. (2004). Study on resistivity characteristics of soil and its engineering application. Chin. J. Geotechnical Eng. 26 (1), 83–87.
Luo, G., Cao, Y., Bai, Z., Kuang, X., Wang, S., and Song, L. (2019). Representation and inversion of reconstructed soil volumetric water content in loess open pit mining area. J. Ecol. Rural. Environ. 35 (4), 529–537. doi:10.19741/j.issn.1673-4831.2018.0506
Olhoeft, G. R. (1981). “Electrical properties of rocks,” in Physical properties of rocks and minerals (New York, NY, United States: McGraw-Hill), 257–297.
Parkhomenko, E. I. (2012). Electrical properties of rocks. Berlin, Germany: Springer Science & Business Media.
Siddiqui, F. I., and Osman, S. (2013). Simple and multiple regression models for relationship between electrical resistivity and various soil properties for soil characterization. Environ. Earth Sci. 70 (1), 259–267. doi:10.1007/s12665-012-2122-0
Topp, G. C., Davis, J. L., and Annan, Aa P. (1980). Electromagnetic determination of soil water content: measurements in coaxial transmission lines. Water Resour. Res. 16 (3), 574–582. doi:10.1029/wr016i003p00574
Wang, K. (2013). Theoretical and Applied research on Resistivity Characteristics of multiphase soil-rock composite media. Chongqing, China: Chongqing Jiaotong University.
Xu, X., Wang, H., Qu, X., Cai, B., and Peng, G. (2023). Study on the dielectric properties and dielectric constant model of laterite. Front. Earth Sci. 10, 1035692. doi:10.3389/feart.2022.1035692
Zhang, Q. (2017). Experimental study on effects of water content and particle size on electrical and mechanical properties of kaolin. Taiyuan, China: Taiyuan University of Technology.
Zhang, T., Liu, S., and Cai, G. (2018). Correlations between electrical resistivity and basic engineering property parameters for marine clays in Jiangsu, China. J. Appl. Geophys. 159, 640–648. doi:10.1016/j.jappgeo.2018.10.012
Zhou, M., Wang, J., Cai, L., Fan, Y., and Zheng, Z. (2015). Laboratory investigations on factors affecting soil electrical resistivity and the measurement. IEEE Trans. Industry Appl. 51 (6), 5358–5365. doi:10.1109/tia.2015.2465931
Zhu, A., Ji, L., Zhang, J., Xin, X., and Liu, J. (2011). Empirical study on the relationship between dielectric constant and volumetric water content of different soil types (in Chinese). Acta Pedol. Sin. 02, 263–268.
Appendix A
Keywords: ground penetrating radar, soil-rock composite medium, dielectric constant, laboratory test, artificial neural network
Citation: An N, Wang Q, Feng Y, Qin Y, Huang L, Tian Y, Zhang F, Zhao Z, Chen J and Yao C (2024) Study on the impact of physical characteristics of soil-rock composite medium on its relative permittivity based on laboratory experiments. Front. Earth Sci. 12:1342003. doi: 10.3389/feart.2024.1342003
Received: 21 November 2023; Accepted: 15 January 2024;
Published: 05 February 2024.
Edited by:
Xianwei Zhang, Chinese Academy of Sciences (CAS), ChinaReviewed by:
Peng Li, East China University of Technology, ChinaQionglin Li, Southwest Jiaotong University, China
Jun Luo, Institute of Mechanics (CAS), China
Copyright © 2024 An, Wang, Feng, Qin, Huang, Tian, Zhang, Zhao, Chen and Yao. This is an open-access article distributed under the terms of the Creative Commons Attribution License (CC BY). The use, distribution or reproduction in other forums is permitted, provided the original author(s) and the copyright owner(s) are credited and that the original publication in this journal is cited, in accordance with accepted academic practice. No use, distribution or reproduction is permitted which does not comply with these terms.
*Correspondence: Ning An, anning_gssgcc@126.com