Identifying earthquake swarms at Mt. Ruapehu, New Zealand: a machine learning approach
 Sam Mitchinson
 Jessica H. Johnson
 Ben Milner2
 - 1School of Environmental Sciences, University of East Anglia, Norwich, United Kingdom
- 2School of Computing Sciences, University of East Anglia, Norwich, United Kingdom
Mt. Ruapehu is an active andesitic stratovolcano, consisting of several peaks with the summit plateau at 2,797 m, making it the tallest active volcano in New Zealand. The extent of the volcano spreads 40 km across with a series of complex faults encompassing almost the entire base of the volcano. A series of earthquakes occurring 20 km west of the summit of Mt. Ruapehu, near the small town of Erua, which preceded the 1995/1996 major volcanic eruption sequence has been proposed as a medium-term precursor for eruptions at Mt. Ruapehu. We use unsupervised machine learning clustering algorithms HDBSCAN and DBSCAN to define anomalous earthquake swarms in the region and determine whether the Erua swarm was unique by identifying key characteristics in space, time and magnitude distribution. HDBSCAN found six spatial cluster zones to the west of Mt. Ruapehu, which have temporal seismic bursts of activity between 1994 and 2023. DBSCAN identified the seismic swarm that preceded the 1995/1996 major eruption, along with one other similar cluster in the same region, which did not coincide with any documented magmatic unrest, suggesting distal seismic swarms at Mt. Ruapehu may not serve as a reliable eruption precursor when observed in isolation. We instead found that earthquake swarms are relatively common at Mt. Ruapehu and the temporal evolution of the earthquake clusters west of Mt. Ruapehu share similar characteristics to seismic swarms identified in other settings related to fluid migration, typical of fault-valve models.
1 Introduction
The ability to accurately forecast when volcanic eruptions will occur is of great importance in the field of volcanology. Ground deformation and volcanic seismicity are some of the most reliable precursory signals for forecasting volcanic eruptions, particularly after long periods of repose (Kilburn, 2018). Even subtle changes in the stress experienced by active volcanoes can lead to volcanic earthquakes and, sometimes, eruptions (De La Cruz-Reyna et al., 2010). In a period between 1994 and 1995, a series of earthquakes occurred near the small town of Erua some 20 km from the summit of the active stratovolcano Mt. Ruapehu (Hurst and McGinty, 1999), which forms part of the Tongariro Centre, at the most southwestern point of the The Taupo Volcanic Zone (TVZ) in New Zealand, North Island (Figure 1). Months later, the 1995/1996 major volcanic eruption sequence began (Bryan and Sherburn, 1999). Petrological studies of the erupted materials have suggested a magma mixing event, which coincides temporally with increased seismicity prior to the eruption (Hurst et al., 2018). The timing and depth of the earthquakes suggest a process of fresh magma being fed into the magma reservoir from a deeper source, 5 months prior to the eruption (Kilgour et al., 2014). It was hypothesised that the influx of magma created a change in stress loading in the neighbouring rock, resulting in the observed earthquake swarm (Hurst et al., 2018), meaning the earthquake swarm may have been a precursor to the volcanic eruption. This led to the suggestion that earthquake swarms at distal faults could serve as useful mid-term forecasts at Mt. Ruapehu (Kilgour et al., 2014; Hurst et al., 2018). Earthquake swarms at distal faults and their relationship with volcanic eruptions may indeed be of scientific relevance (White and McCausland, 2016). For example, in Indonesia, a seismic swarm detected
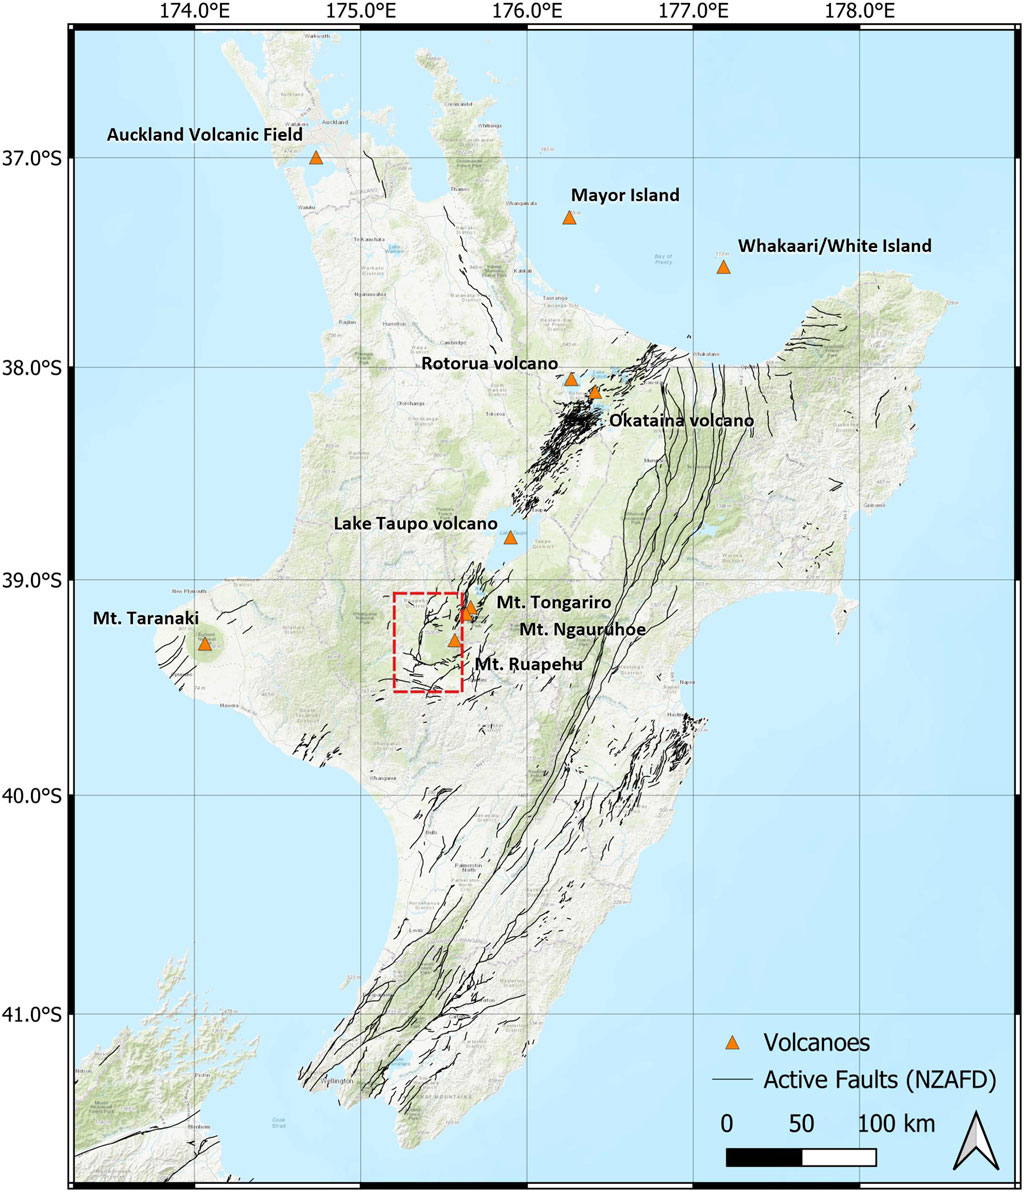
FIGURE 1. Map of New Zealand, North Island with active volcanoes and active fault lines (Langridge et al., 2016). The TVZ runs through the middle of the North Island with Mt. Ruapehu the southwest limit and Whakaari (White Island) the northeast limit. The study area is outlined in the region west of Mt. Ruapehu.
The timely identification of seismic signals have lead to the formation of many successful eruption forecasts in history (McNutt, 2002). Earthquakes in volcanic settings can be the result of different processes. As magma moves below the surface it may exert strain on the brittle surrounding rock causing it to fracture, which is detected as earthquakes (Hill et al., 2002). Similarly, an injection of magma into a crack will cause stress on the neighbouring rock and result in a seismic signal (Chouet and Matoza, 2013). Conversely, tectonic earthquakes causing stress changes may promote the movement of fluids towards the surface (Seropian et al., 2021). The frequency of earthquake occurrences has been shown to increase exponentially when rock is deformed at a constant strain rate (Kilburn, 2012, 2018). These episodes of sudden increases in the number of earthquakes in a region are referred to as earthquake swarms and are often associated with volcanic activity (Chouet and Matoza, 2013; White and McCausland, 2016; Pesicek et al., 2018). “Swarm-like” earthquake sequences have been described in the literature as having the following characteristics: 1) earthquakes occur in close proximal space to each other, compared to the more uniform background seismicity, 2) earthquake events occur relatively close together in time at a more frequent rate than the background seismicity, and 3) the largest and second-largest earthquakes usually have a similar magnitude with a maximum difference of around ΔM 0.5, and tend to not follow a typical mainshock-aftershock sequence (Gudmundsson, 2020). Swarm-like sequences also tend to have the largest event occurring during the middle of the sequence (Vidale and Shearer, 2006). This somewhat subjective description of how earthquake swarms are defined can be detrimental for how they can be used for forecasting eruptions. For example, studies have shown that the duration of swarms that result in volcanic activity can vary significantly (McNutt, 2005), making eruption forecasting difficult. Moreover, in many cases, a sudden increase in earthquake activity, even for highly active volcanoes, has not resulted in a volcanic eruption (Ramis et al., 2018; Gudmundsson, 2020). To enhance the precision and consistency of earthquake swarms in volcanic eruption forecasts, it would be advantageous to develop a more objective and statistically-driven methodology for identifying various types of earthquake sequences. Utilising unsupervised clustering algorithms enables the impartial identification of spatio-temporal anomalies in the earthquake catalogue, and their relevance to documented historical eruptions, ultimately allowing us to confirm whether the Eura swarm (e.g., Hurst and McGinty, 1999; Hurst et al., 2018) represents a unique and distinguishable signal.
2 Mount Ruapehu
Mt. Ruapehu is an active andestic stratovolcano, consisting of several peaks with the summit plateau at 2,797 m, making it the tallest active volcano in New Zealand. The extent of the volcano spreads 40 km across from the Raurimo fault to the west and the Rangipo fault to the east (Conway et al., 2016) (Figure 2). The oldest dated eruptive material dates to c.200 ka, although there are parts of the lava formation and clasts which may date back even further (Gamble et al., 2003). Historical eruptive composition is mainly made up of andesites stored from depths of 5–10 km (Leonard et al., 2021), though there is evidence of composition ranging from basaltic andesite to dacite (53–66 wt.% silica) throughout the eruptive history of Mt. Ruapehu (Gamble et al., 2003). The active magma reservoir is coupled with a hydrothermal system (Christenson and Wood, 1993), which feeds radiation and volatile-rich gases into a crater lake at the summit containing c.9x106 m3 of acid-rich water (Manville et al., 2007). The hydrothermal system frequently produces phreatic eruptions, which often lack any precursory warning (Houghton et al., 1987), and can cause the water in the lake to burst its banks causing lahars (e.g., Manville et al., 2007; Schaefer et al., 2018). Other frequently erupted material includes tephra, with sizes ranging from ashfall to clasts and blocks, and block lava flows that have historically flowed from the summit and three flank vents (Houghton et al., 1987).
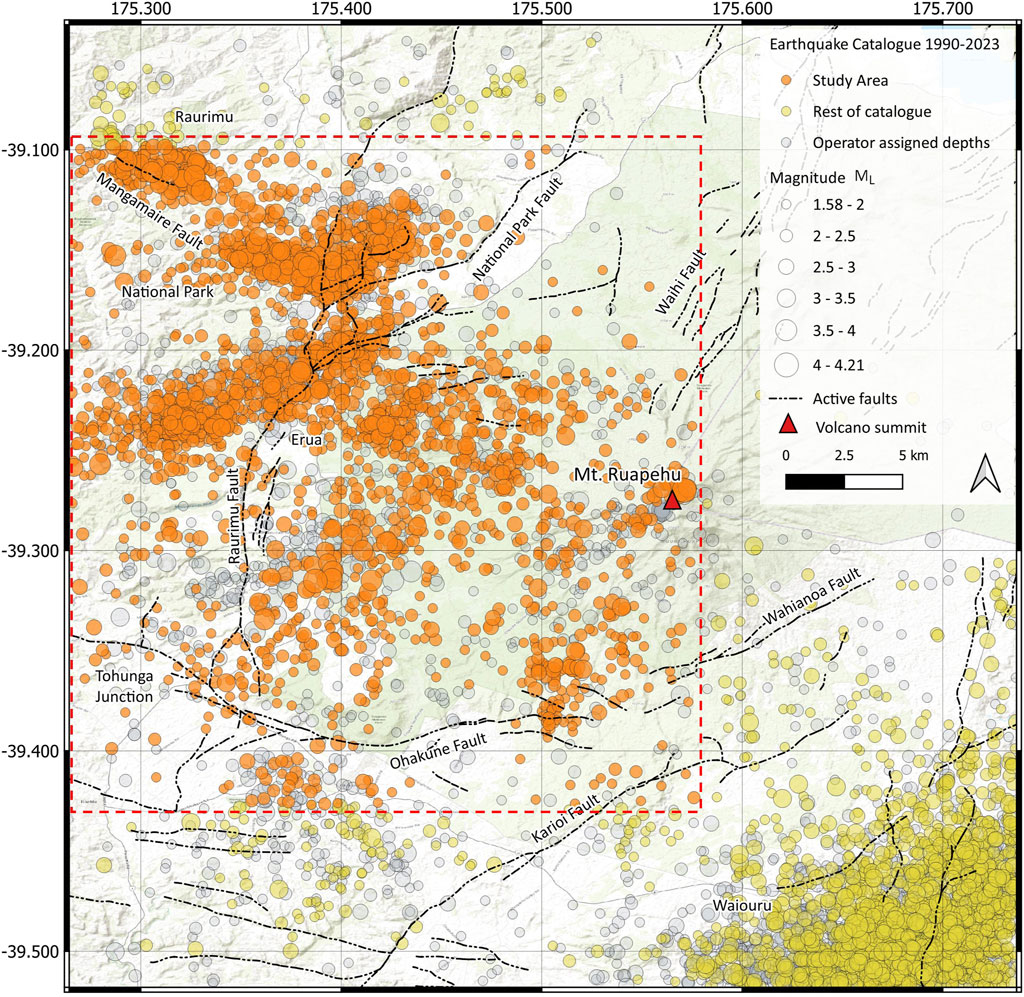
FIGURE 2. Map of the Ruapehu seismic region, including the study region outlined in a red box, showing the distribution of earthquake locations and magnitude between 1990 and 2023 at Mt. Ruapehu, with non-operator and operator assigned earthquakes. It is argued that the distribution of earthquakes are similar for both data sets, and that the removal of operator assigned earthquakes does not reduce the information of the catalogue. The boundary of the study area was selected to contain the seismically active region to the northwest of the summit, which has been analysed in previous studies at Mt. Ruapehu and associated with the 1995/1996 eruption sequence (e.g., Hurst and McGinty, 1999; Sherburn et al., 1999; Hurst et al., 2018).
2.1 Eruption history
The current period of volcanic activity has been ongoing for the last 2 ka., described as periodic low-volume (
2.2 Regional seismic activity
Mt. Ruapehu hosts its own tectonic setting, with faults circumscribing almost the entire base of the volcano some 20 km from the summit (Leonard et al., 2021). Shallow seismicity (
To the southeast, approximately 20 km from the summit, is a band of near-constant seismicity along the Rangipo (Desert Road) Fault, near the town of Waiouru (Hayes, 2004) (Figure 2). Average b-values have been calculated at 1.06 at mid-crust depths ranging from 11 to 21 km implying a tectonic origin (Hayes, 2004). The b-value describes the relationship between large and small earthquakes in a catalogue, commonly used to describe the nature of the seismic activity of a region (Gudmundsson, 2020). Increased seismic activity was detected prior to the 1995 major eruption and once again in 2000/2001, with b-values sustaining high levels through the 1995/1996 eruption sequence reaching 1.71 in 2000 (Hayes, 2004). Although the earthquake cluster seems connected to volcanic episodes at Mt. Ruapehu, it is unlikely to be of volcanic origin itself and instead may be associated with regional stress changes following the 1995 major eruption (Hayes, 2004).
The seismicity to the west of Mt. Ruapehu is mainly concentrated northwest of the summit at the north extent of the Raurimu fault near National Park. There is also another distinct band of seismicity, which can be observed near Erua (Figure 2). Earthquake locations then become more uniformly distributed to the west and southwest towards Horopito and the Tohunga Junction. The cluster of earthquakes near Erua has been defined as precursory signal to the 1995/1996 major eruption sequence (Hurst and McGinty, 1999; Hurst et al., 2018). Studies by White and McCausland (2016) and Meyer et al. (2021) have developed methods, originating from McGarr (1976), for estimating the intrusive volume of magma intrusions from tectonic earthquake sequences at distal faults to suggest they might be suitable mid-term eruption forecasts. Hurst et al. (2018) argues the petrological timescale of erupted materials coincides with the seismicity near Erua, before the 1995 eruptions, suggesting that the seismic signal was an indicator of magma movement. Other studies have also suggested that the 1995 Erua swarm was not of tectonic origin, but a signal of stress changes associated with fluid movement within the volcanic system (e.g., Hayes, 2004). This may not be limited temporally to the 1995/1996 eruption, and may instead be an ongoing signal typical of pore-fluid pressure triggered by fluid movement in the mid-crust (e.g., Keats et al., 2011). However, a lack of observed seismic rate increase prior to the 2006 and 2007 eruptions makes eruption forecasts using this seismic signal uncertain. For the swarm near Erua to be considered a reliable forecasting signal (e.g., Hurst et al., 2018), it must be unique to the months preceding volcanic eruptions at Mt. Ruapehu, and should be absent during periods of volcanic inactivity (e.g., Ardid et al., 2022).
3 Data and methods
In this research, we classified spatio-temporal earthquake sequences in the GeoNet earthquake catalogue using a combination of density-based clustering algorithms. The magnitude distributions were analysed to see if the earthquake sequences exhibit typical mainshock-aftershock (MS-AS) or swarm-like characteristics. MS-AS sequences typically have a dominant initial event, called the mainshock, followed by a subsequent Omori-type (Omori, 1895) aftershock decay (Petersen and Pankow, 2023). It has been shown that analysis of the temporal evolution of earthquake sequences coupled with their associated cumulative seismic moment can be useful for differentiating between different types of seismic activity (Vidale et al., 2006; Lanza et al., 2022).
3.1 Earthquake catalogue
The earthquake catalogue for the Mt. Ruapehu region was downloaded for a period from 1990 to 2023, containing 28,522 earthquakes at shallow depths (
Approximately half of the earthquakes in the catalogue (14,587) were assigned depths of 0, 5, or 12 km by an internal operator. These approximations for the hypocentre of the earthquake may be necessary when there are fewer seismic stations available to make a measurement, or when there is uncertainty in the velocity model used. Keeping earthquakes with locations biased to the assigned depth would be detrimental to the unsupervised machine learning approach we adopt and were therefore removed from the catalogue. Although this is a large proportion of the earthquakes in the catalogue, we argue that these earthquakes generally fit the underlying geographical trend of the seismicity of the region, and do not add any significant information to the overall catalogue (Figure 2). Therefore, the operator assigned events were removed from the catalogue for the purpose of this research.
The final data processing step was to assess the magnitude of completeness (Mc) of the catalogue with operator assigned earthquakes removed. This was done by estimating the point of maximum curvature for the cumulative and non-cumulative frequency magnitude distribution (FMD) (Pavlenko and Zavyalov, 2022). Using the Maximum Curvature (MAXC) method (Wiemer, 2000), bin sizes of ΔML 0.1 were evaluated to find the best fit Mc value, which was calculated as 1.6 with a b-value of 1.04 ± 0.02. Finally, the earthquake catalogue was filtered to contain only earthquake events ≥Mc, totalling 2,795 individual events.
3.2 Detecting spatial anomalies
Density-based clustering algorithms are effective at analysing noisy data sets and can handle irregular cluster shapes, making them a good method for analysing the clustering and zoning of earthquakes (Scitovski, 2018). Clustering algorithms, such as DBSCAN (density-based clustering algorithms with noise) (Ester et al., 1996) have been effectively used to identify and classify seismic swarms in earthquake catalogues (e.g., Petersen and Pankow, 2023). Where the methodology described in Petersen and Pankow (2023) begins with identifying temporal clusters in the catalogue before spatial analysis, this study aims to identify spatial clusters prior to the temporal cluster analysis using density-based clustering algorithms. The seismic activity in the months prior to the 1995 eruption was confined to a distinctive cluster Hurst and McGinty (1999), therefore we attempt to observe whether this kind of seismic signal is unique in specific regions (e.g., Hurst et al., 2018) prior to volcanic eruptions or whether it repeats during periods of volcanic quiescence.
Hierarchical density-based clustering algorithms with noise (HDBSCAN) (Campello et al., 2013) is an unsupervised machine learning clustering algorithm that is particularly useful at identifying clusters of varying shape and densities within a noisy data set. HDBSCAN begins by computing the density of data points based on their proximity to neighbouring points using a similar methodology as the popular density-based algorithm DBSCAN (Ester et al., 1996). DBSCAN begins by selecting a random point in the data set (x) and, using Euclidean distance, calculates whether there are enough points in its neighbourhood to begin building a cluster, this is labelled a core point. Once a core point has been satisfied, the cluster is expanded to detect all core points which are directly-reachable in the latitude, longitude and depth dimensions. Once all of the core points for a cluster have been assigned, the algorithm adds the non-core border points to the cluster. The border points cannot be used to connect any other points to extend the cluster, even if another non-core point is within the distance threshold of the border point. Data points which fall outside the threshold defined by the input parameters are labelled as outliers and given the value −1. These steps are processed sequentially, meaning a non-core point which is within the distance threshold (ɛ) of two or more separate clusters will be assigned to the cluster which was calculated first (Figure 3).
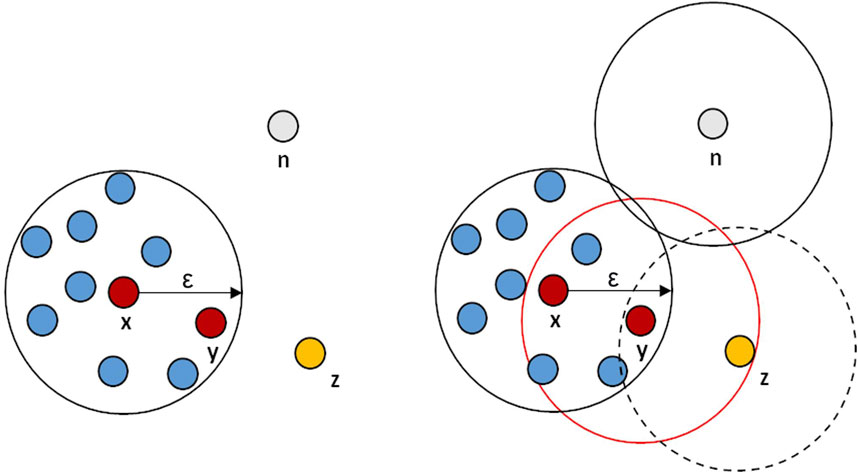
FIGURE 3. Illustration of a density-based clustering algorithm. Point x is a randomly selected starting point within the data set. The minimum number of points which define a cluster is 10, within a distance ɛ. Point y is directly density-reachable and is also a core point. Point z is density connected to point y, however is not reachable for any other points. Therefore, z becomes a border point and signifies the end of the cluster. Data point n is unreachable from any other data point and is therefore not part of the cluster and labelled as an outlier or noise.
HDBSCAN builds upon the DBSCAN algorithm by allowing the computation of clusters with varying ɛ distance, which is effective for grouping clusters with a range of densities. This is achieved by using the concept of mutual reachability distance (MRD), where the influence of multiple points are considered in relation to their local neighbourhood density, defined as:
Where d(a, b) is the original distance metric between points a and b. HDBSCAN then constructs a minimum spanning tree (MST) from the MRD values, which is designed to highlight the strongest connections between points. The hierarchical part of the algorithm begins by using a single-linkage approach to repeatedly merge clusters close in density, ensuring that the merged cluster is associated with the cluster having the highest minimum density of the two. As more clusters are merged, the algorithm constructs a condensed tree that captures the hierarchy of cluster merges based on density. Each level of the tree represents a different level of minimum density required for a cluster to exist. This allows for a range of cluster sizes and shapes to be detected. The stability of a cluster is measured by how often it appears across different density levels in the condensed tree. Clusters that are more stable (i.e., they persist across multiple levels) are considered more significant. The final clustering result is obtained by selecting the clusters with the highest stability, while noise points and outliers are also accounted for. This allows HDBSCAN to automatically determine the total optimal number of clusters and handle clusters of varying densities.
Where HDBSCAN inherently selects the optimal number of clusters and corresponding distance between points, the algorithm requires a domain knowledge for the minimum number of samples per cluster, i.e., the minimum number of earthquake events for a cluster, (min_cluster_size). The min_cluster_size parameter determines the size of clusters calculated in the data set and impacts the total number of noise values (Starczewski et al., 2020) and has a default value of 5 data points per cluster. Although there are no constraints as to the number of earthquake events that make up a swarm, we can assume the earthquake signals we are attempting to identify contain greater than 5 events per cluster. In order to select the optimal number of points per cluster, one can run a range of min_cluster_size values through the clustering algorithm and test each result against a fitness function in a method known as Tournament Selection (TS) (e.g., Karami and Johansson, 2014). The best-fit min_cluster_size candidate based on the score of the fitness function is then selected for the clustering algorithm. Although there is no silver bullet fitness function for evaluating clustering algorithms, the Silhouette Coefficient θ (Rousseeuw, 1987) is a simple analytical method that can be used to find the optimal number of clusters for a variety of different clustering algorithms (e.g., Wang et al., 2017; Angmo et al., 2021) and does not require any prior training to produce results (Shutaywi and Kachouie, 2021). The Silhouette Coefficient θ is available in Scikit-learn and begins by comparing the distances of each sample to its own cluster and the neighbouring cluster, with scores ranging from −1 to 1:
Where a is the average distance of sample point i within a to other point within cluster a and b is the distance of sample point i to its nearest cluster. The function then calculates the mean Silhouette Coefficient over all cluster to return a single score for all clusters:
where n is the number of samples and θ(i) is the Silhouette Coefficient for the i-th sample. A score of 1 would be achieved for two perfectly distinguished clusters at infinite distance from each other. A score of zero means that clusters are insignificant and the distance between them is not significant. The Silhouette Coefficient evaluated the goodness of fit for min_cluster_size 5–40 where the optimal number of samples in a cluster was 31 with a score of 0.19. We found that the cluster size did not change much for min_cluster_size 30–40. However, the signal near Erua was most prominent for min_cluster_size 30–32 and the Silhouette Coefficient reduces as sample size
3.3 Detecting temporal anomalies
DBSCAN was used to identify temporal clusters in the time series for each of the regions classified using HDBSCAN. Temporal anomalies represent periods when the number of events within the HDBSCAN cluster region is unusually high, which is a proxy for earthquake sequences such as mainshock-aftershock (MS-AS), foreshock-mainshock aftershock (FS-MS-AS) or swarm sequences. The date and time of each event was converted to numeric using matplotlib’s date2num() with the epoch set to “1990-01-01T00:00:00,” where “1990-01-02T00:00:00” = 1. The DBSCAN method requires two input parameters, the minimum distance between points (ɛ), and the minimum number of points (MinPts) accepted to assign a cluster. The distance metric ɛ selected is then based on the number of days, converted to numeric time. To identify temporal anomalies, we employ a rolling average window for a 30 days time period and calculate the number of events in each window, which is stepped forward in daily increments. The z-score is then calculated for each rolling average and the inverse cumulative distribution function (PPF) of the standard normal distribution is calculated to define the anomaly threshold. This threshold corresponds to a 99% confidence interval and can be interpreted as the number of events above which rolling averages are considered anomalous, or the earthquake rate above usual background levels, which is considered anomalous. We found that the number of events considered anomalous within a 30-day window was 25 events. Using a 30-day window allows for a sufficient number of data points within each window, whilst facilitating the identification of longer-term patterns, which represents the nature of earthquake swarms. 25 events within a 30-day window also generally corresponds to the earthquake counts to the west of Mt. Ruapehu preceding the 1995/1996 eruption sequence (Hurst and McGinty, 1999; Sherburn et al., 1999; Hurst et al., 2018). The selected DBSCAN parameters are then applied to each of the geospatial clusters identified using HDBSCAN.
Using an unsupervised machine learning clustering approach, such as DBSCAN, is advantageous as it has the ability to identify moments in the time series where there may be anomalously high numbers of earthquakes over a period of time, without prior domain knowledge of earthquake sequences, and it also removes the need to set absolute boundaries on the length of time for each sequence. Meaning one can automatically capture earthquake sequences over a range of time-frames without bias, providing the minimum threshold set by the z-score is achieved.
3.4 Cumulative moment
Evaluating the seismic energy associated with geospatial and temporal anomalies is an effective method for gaining a deeper understanding of the underlying characteristics and mechanisms at play. It is noteworthy that the seismic energy release is intrinsically linked to the magnitude of the earthquake event (McGarr, 1976). Methods for determining the earthquake local magnitude ML can vary depending on the geology of the region and seismic network administration (Bormann and Di Giacomo, 2011). When performing seismic hazard assessments, it is convenient to convert local magnitude estimates to be consistent with moment magnitude Mw calculations (Rhoades et al., 2021), which is widely considered the best estimation tool for calculating earthquake magnitude (Ristau, 2009). In New Zealand, the relationship between ML and Mw for shallow earthquakes (i.e.,
Seismic moment M0 gives information regarding the total energy release of an earthquake and is proportional to the moment magnitude Mw defined as:
Where M0 is in N m (Nm) and 9.0 is an empirical calculation of the shear stress of the crust. The cumulative seismic moment of earthquake sequences has been identified as a tool for volcanic eruption forecasting (e.g., Thelen et al., 2010; White and McCausland, 2016; Meyer et al., 2021). These kinds of approaches represent a significant step towards statistically quantifying key volcanic processes, including swarm-like earthquake sequences, departing from conventional descriptive measures and providing a more data-driven foundation for volcanic eruption forecasting.
4 Results
We can observe that the region to the west of Mt. Ruapehu has maintained seismic activity through the 33 years catalogue with low magnitude earthquakes typically in the range of 1.58–4.21 ML. Using density-based clustering algorithms for the spatial and temporal analysis of the earthquake catalogue, we were able to identify six earthquake regions (clusters) where a number of earthquakes all occur in close proximity to each other, from 1990 to 2023. DBSCAN discovered seven earthquake sequences within the HDBSCAN clusters, where there were periods of seismicity which exceeded the threshold of 25 events for a 30-day rolling window. Two of the clusters have repeating periods of increased earthquake rate discovered using DBSCAN. Some cluster regions have clear temporal “bursts” of activity lasting from a few days to many weeks, yet remain relatively inactive for the majority of the 33-year period, and other regions have almost constant seismic activity with occasional small bursts. This section begins by presenting the geospatial anomalies detected using HDBSCAN, followed by the temporal and cumulative magnitude time series results.
4.1 Geospatial anomalies - HDBSCAN
The HDBSCAN algorithm took 0.05 s to run for the earthquake catalogue containing 2,795 events, identifying six distinct earthquake regions (clusters), for a cluster size minimum of 32 samples per cluster, amounting 63% of earthquakes in the catalogue. The clusters [C0, C1, C2, C3, C4, C5] exhibited various characteristics, including geographical distribution, density, and shape (Figure 4). The algorithm performed well at grouping a variety of cluster densities and shapes, and was also effective at discerning between boundaries of high levels of seismic activity, particularly between C5 and C1 (Figure 4). The location of earthquakes is spread non-uniformly across the study area west of Mt. Ruapehu, with occasional regions of geospatial density, particularly
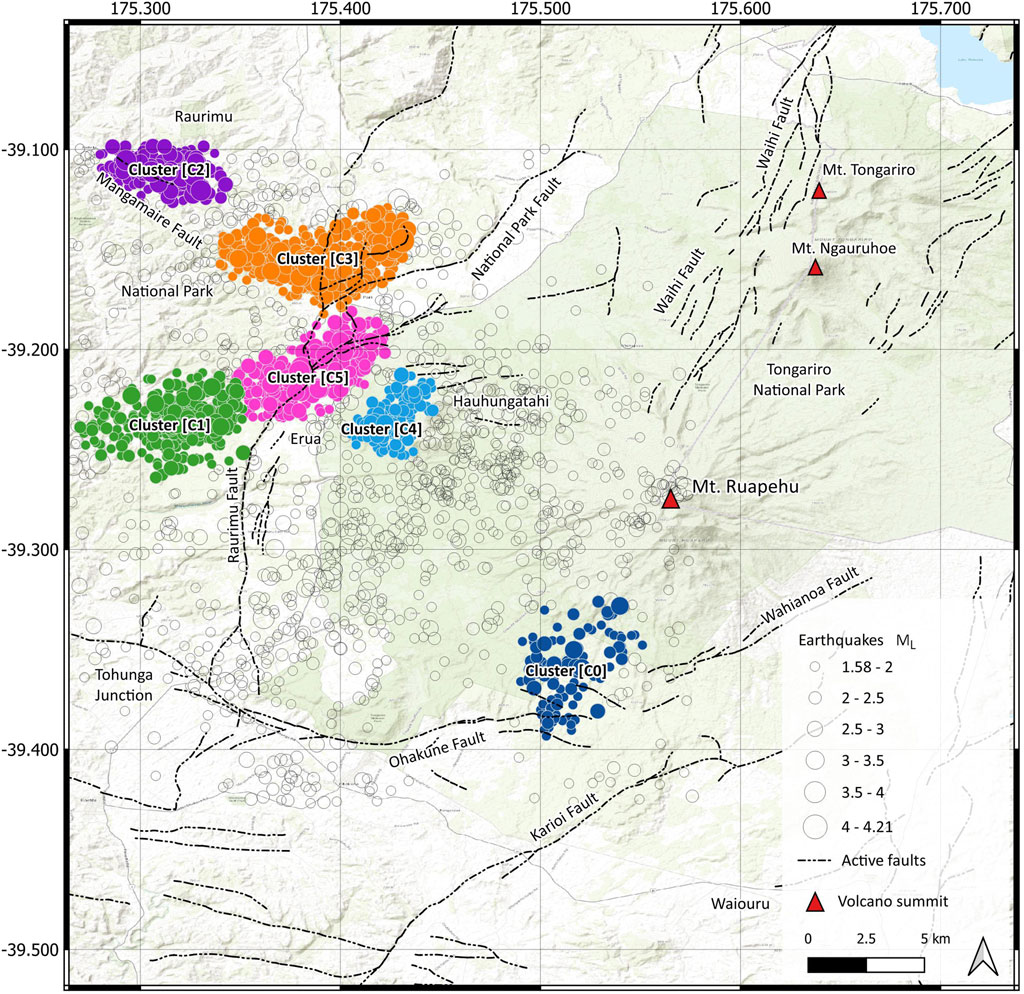
FIGURE 4. A map of Ruapehu volcano and Tonagariro National Park to the northeast, with the study region earthquake epicenter events. Six clusters were detected using HDBSCAN clustering and the noise data points achieving no cluster are labelled as the background seismicity. More information on the earthquake characteristics for each cluster can be seen in Table 1.
Cluster C0 (blue) in Figure 4 is a comparatively low-density cluster, located 5–10 km south of the summit on the eastern limit of the Ohakune Fault, which runs west towards the Tohunga Junction. It contained the fewest number of earthquakes (113 events), with typical magnitudes ranging from 1.75 to 2.16, at depths typically ranging from 14 to 17 km. C1 (green) and C5 (pink) sit in a trajectory orientated approximately 40° northeast, with C1 earthquakes occurring away from the Raurimu Fault at a greater depth, on average between 14.7 and 18.1 km, compared to C5, which typically occur within the range of 11.2–14.6 km below the surface. There is a distinct difference in the magnitude of earthquakes, with significantly more ML
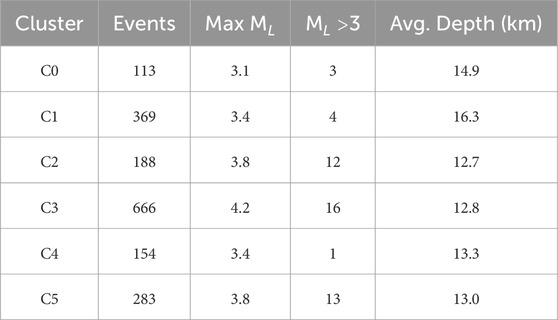
TABLE 1. Clusters identified in the earthquake catalogue using HDBSCAN (minimum samples=31).
4.2 Temporal anomalies - DBSCAN
DBSCAN took
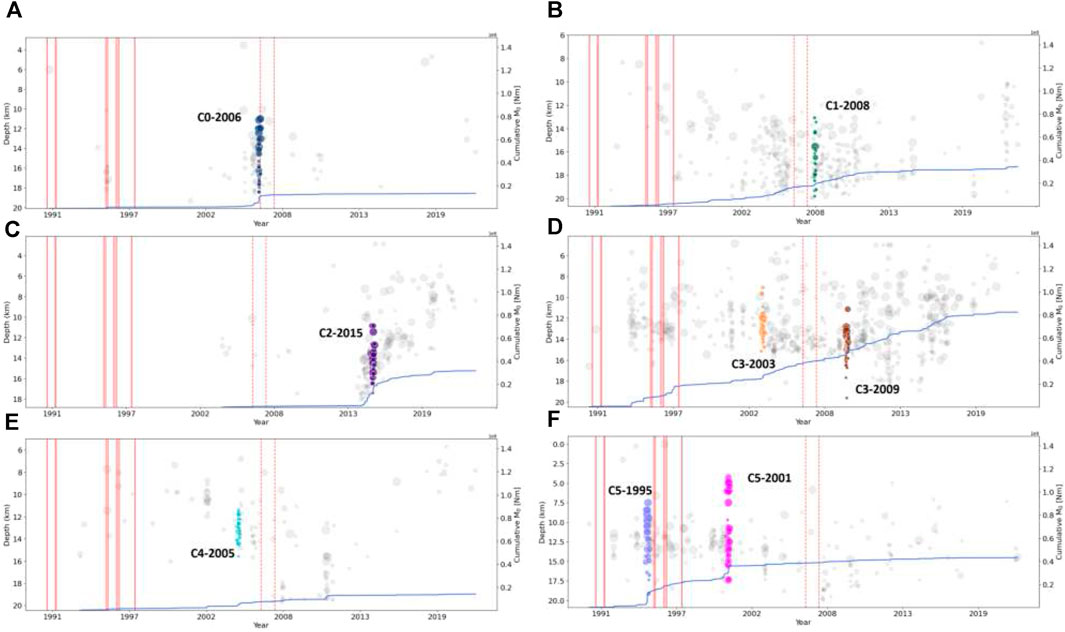
FIGURE 5. Time series scatter plot of earthquake epicenter events with depths shown on the y-axis and magnitudes with data point size for each HBDSCAN cluster. Eight clusters detected using DBSCAN, were determined by ε distance of 30 days for a minimum of 25 events, and represent moments in time where the earthquake rate is abnormally high. Activity in C0 (A) increased above the threshold in 2006, C1 (B) in 2008, C2 (C) in 2015, C3 (D) had a burst in 2003 and 2009, C4 (E) in 2005, and finally two sequences occurred in 1995 and 2001 C5 (F). Magmatic eruptions are labelled as vertical red lines. Two small (VEI∼1) eruptions were recorded in 1991 and 1992 before the major 1995/1996 eruption sequence (VEI∼3), along with another small eruption in 1997. Two phreatic eruptions in 2006 and 2007 are labelled with a dotted red line. The cumulative moment magnitude represented by the blue line is an estimation for the amount of energy released in the study region through time.
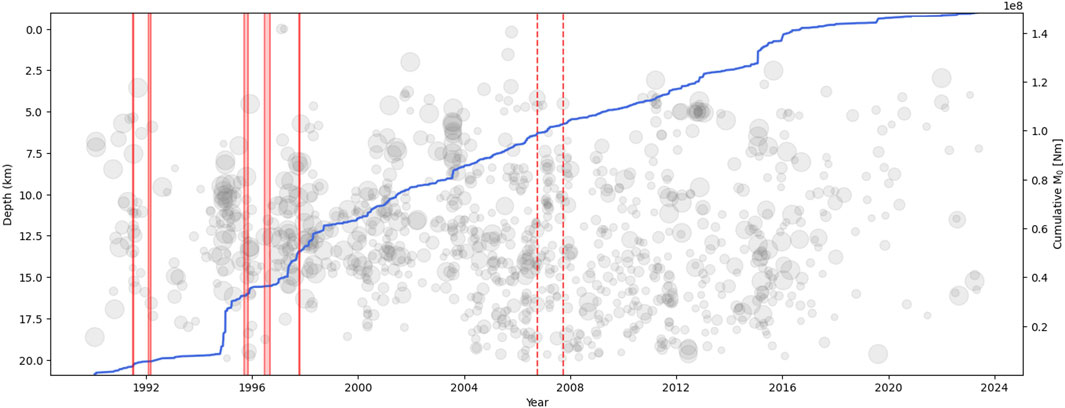
FIGURE 6. Time series scatter plot of background seismicity of the full study area excluding the HDBSCAN clusters, with the cumulative earthquake moment of the region. Earthquake epicenter events with depths shown on the y-axis and magnitudes shown as the size of the data point. Documented eruption periods are labelled using vertical red lines.
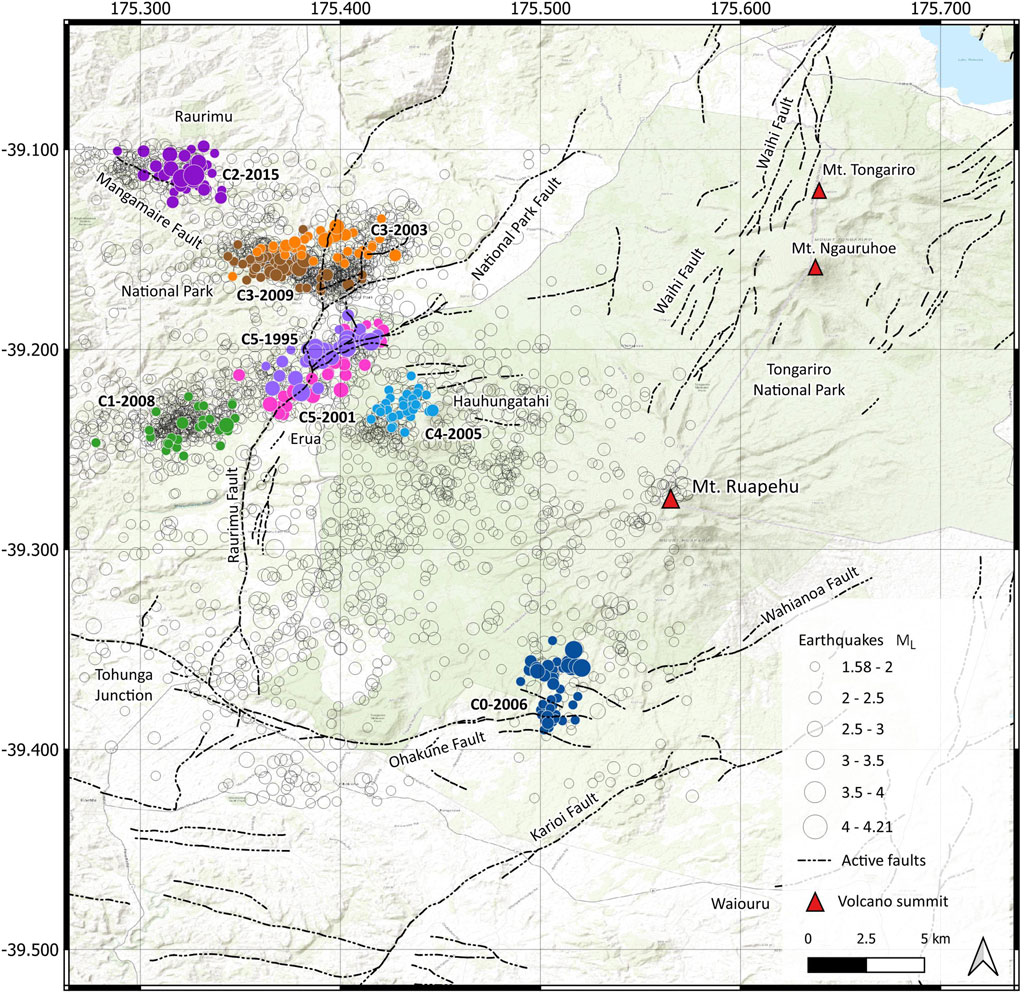
FIGURE 7. Geospatial representation of eight earthquake sequences, with background seismicity, identified at Mt. Ruapehu the 1990–2023 GeoNet earthquake catalogue using DBSCAN (Figures 5, 6).
C0-2006 is situated in a typically inactive region and had a significant increase in earthquake rate in 2006, where 71 events occurred. Activity peaked between 23 August–2 September 2006, with 40 events. On 28 August, a total of 16 events occurred in a single day. The earthquake rate in this period is correlated with a sudden increase in cumulative seismic moment. DBSCAN automatically highlighted a period between 23 August–8 October 2006 as an anomalous earthquake sequence, containing a total of 45 events, with an average magnitude of 2.04 ML and two events ML
The time series for the C1 region shows near constant earthquake activity, with an increase of activity between 2004 and 2012, also corresponding to an increase in cumulative seismic moment during the same time frame, before flattening out again. Within the period 2004–2012, when the cumulative seismic rate increases, DBSCAN identified one period (C1-2008) where the earthquake rate surpassed the background seismicity threshold. The sequence consisted of 27 small magnitude earthquakes ranging from 1.59 to 2.53 ML, lasting 48 days from 6 April 2008–24 May 2008 at a rate of 0.56 earthquakes per day.
There was no seismicity recorded in the C2 region before 2004, perhaps due to a limitation of seismic apparatus available. Since 2014, the seismicity has increased in the region significantly, with 92.6% of total events in the cluster region occurring after July 2014 with a relatively deep source and getting shallower through time. C2-2015 had an average earthquake rate of 0.44 per day, which was deemed higher than the threshold by DBSCAN from 2 July 2015–8 October 2015. During this period, three earthquakes ML
The C3 time series is characterised as near-constant earthquake activity at relatively shallow depths of
The small, dense cluster located in proximity to Hauhungatahi (C4), had three time periods where there was a sequence of earthquakes and small increases in cumulative seismic moment. The first sequence occurred in 2002 at shallow depths from 8 to 12 km and was not identified by DBSCAN. The second sequence (C4-2005), which was identified by DBSCAN due to an increase in earthquake rate of 0.45 events per day over 76 days, began in January 2005 and consisted of 34 relatively small events at depths of 13 km on average. There was a third sequence, similar to the events in 2002, originating from deeper sources (15–19 km), which began with a 3.42 ML earthquake before following a typical mainshock-aftershock pattern.
C5 is contained to the Raurimu fault in close proximity to the town of Erua. Although earthquake activity can be observed throughout the time series, the majority of events have occurred before 2004 within C5-1995 and C5-2001, with epicentres located in a narrow band between 10 and 15 km depth. The two earthquake sequences highlighted by DBSCAN had anomalous earthquake rates, consistent with sudden increases in cumulative seismic moment. C5-1995 and C5-2001 are similar in geographical orientation, average depths, earthquake rate, and maximum magnitude. However, there were more events ML
The slow increase of cumulative seismic moment across the entire region is coupled with occasional rapid increases (Figure 6), particularly leading up to the 1995 eruption. We have labelled this earthquake activity as background seismicity, due to the fact that earthquakes occurred in regions with no geospatial relationship. The largest increase in cumulative seismic moment began in 1995, driven by the first earthquake sequence C5-1995, before the onset of the 1995 major eruption and waned during the main eruption sequence before increasing again before and during the small eruption in 1997. There were also smaller increases in 2003/2004, which occur due to C3-2003, and slightly larger increase in 2015/2016 which coincides C2-2015.
5 Discussion
Using the temporal anomaly results obtained using DBSCAN, and the seismic moments of the earthquake sequences, we have assessed the statistical similarities between sequences and their implications for the 1995 Erua swarm (Hurst and McGinty, 1999; Hurst et al., 2018). An unsupervised algorithm with no a priori domain knowledge of the system has identified six regions to the west of Mt. Ruapehu where earthquake activity tends to be concentrated more than in other areas. Earthquake sequences occurring in distinct clusters are regularly observed at volcanoes and are often indicative of where stress changes are concentrated during the natural dynamics of the volcanic system (McNutt and Roman, 2015). Seismic activity to the west of Mt. Ruapehu rapidly increased in the year prior to the 1995 major eruption, yet during the eruption we observe no elevated seismic activity, which is consistent with Hurst et al. (2018). There was a return to high levels of seismic activity during a short period in 1997, immediately following the end of the 1995/1996 eruption sequence, which may indicate a response in stress changes following the eruption, due to magma movement, or pressure changes at the summit (Hayes, 2004). After 2001, the region west of Mt. Ruapehu maintained a near constant rate of seismicity, which is consistent with the absence of major volcanic activity during this time. Occasional small spikes in seismic moment have no correlation to the small eruptions which occurred in 2006 and 2007. A larger increase in regional seismic activity occurred during 2015/2016, which correlates with C2-2015 (Figure 5C).
The timing of earthquake sequences detected using DBSCAN are unique to each region, and do not last longer than 100 days. Notably, 75% of the earthquake sequences detected by DBSCAN showed no clear correlation with recorded volcanic events. However, the earthquake sequences within C0-2006 and C5-1995, demonstrated temporal proximity to the 2006 phreatic eruption and the 1995 major eruption (Figure 5F). We deem temporal proximity to be within 6 months, given the history of earthquake swarms relating to eruptions at Mt. Ruapehu (e.g., Hurst et al., 2018). Indeed, C5-1995 (Figure 5F), is the same signal interpreted to be a precursor for the 1995 major eruption by Hurst and McGinty (1999); Hurst et al. (2018).
Cumulative seismic moment with time show similarities between clusters. Broadly, we can group sequence types into the following categorical descriptions, 1) swarm-like sequences yielding a relatively small cumulative seismic moments through time, e.g., C3-2003 and C3-2009, 2) swarms with longer run-up time, maintaining a high seismic rate and a larger cumulative seismic moment, e.g., C2-2015 and C5-1995, 3) Complex sequences with MS-AS events followed immediately by a swarm-like sequence, e.g., C0-2006 and C5-1995, 4) a narrow band of magnitudes typically ≤ Δ0.5 ML with no significant energy release, e.g., C1-2008 and C4-2005.
B-values were estimated for each temporal cluster, with values ranging from 0.88 to 2.97. An estimation of the b-value in volcanic regions can be a useful indicator for monitoring periods of unrest (e.g., Farías et al., 2023) as they can provide additional information about whether seismicity is of tectonic or volcanic origin (Lanza et al., 2022). In regions with high b-values, there are proportionally more smaller earthquakes than large earthquakes (Gudmundsson, 2020). Naturally, therefore one tends to see higher b-values in volcanic regions than tectonic. However, although it is common to observe high b-values in volcanic areas, b-values have be found to be skewed to larger values particularly for small catalogues (Geffers et al., 2022). This might be the case for the temporal clusters at Mt. Ruapehu, where we can see in general, those sequences with fewer events, tend to have high b-values (1.51–2.97) with the exception of C5-1995, which had proportionally more earthquakes
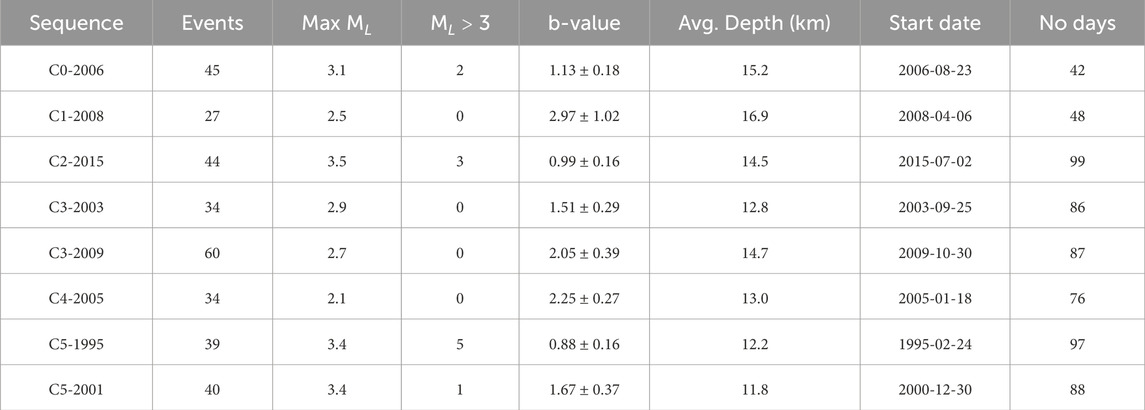
TABLE 2. High density earthquake sequences identified in the time series using DBSCAN for each HDBSCAN cluster (DBSCAN ɛ: number of days=30, minimum events=25). The DBSCAN cluster is denoted as a temporal sequence, labelled consecutively in the time series.
5.1 The C0 cluster
The earthquake events occurring within C0-2006, situated along the eastern boundary of the Ohakune Fault on the southernmost region of the research domain, coincided closely in time with the phreatic eruption of October 2006. This synchronicity may hold significance due to the surprising nature of the eruption, which seemingly erupted without any warning signs of imminent volcanic activity (Jolly et al., 2010). A cursory examination of the earthquake catalog through visual analysis might not yield any apparent indicators of abnormal seismic activity in this area. Hence, the identification of the earthquake sequence from HDBSCAN and the temporal sequence from DBSCAN, was as an unforeseen revelation. C0-2006 was indicative of a complex sequence, exhibiting both MS-AS and swarm behaviour in a short period of time (Figure 8). The largest event (3.1 ML) on 26 August 2006 was followed by two successively smaller events following a typical mainshock-aftershock sequence. On 28 August 2006, 16 individual events were recorded with the largest and second largest magnitude of 3.03 ML and 2.9 ML. The characteristics of the differences in magnitude and the cumulative seismic moment over a short period of time coupled with a b-value of 1.13, suggests this earthquake sequence is of swarm origin and may be the result of an intrusion of fluids into a dike at shallow depths, which interacted with the hydrothermal system and the crater lake. The sudden intrusion of magma into a crack near the surface may have triggered a rapid expansion and steam driven eruption without necessarily raising the crater temperature.
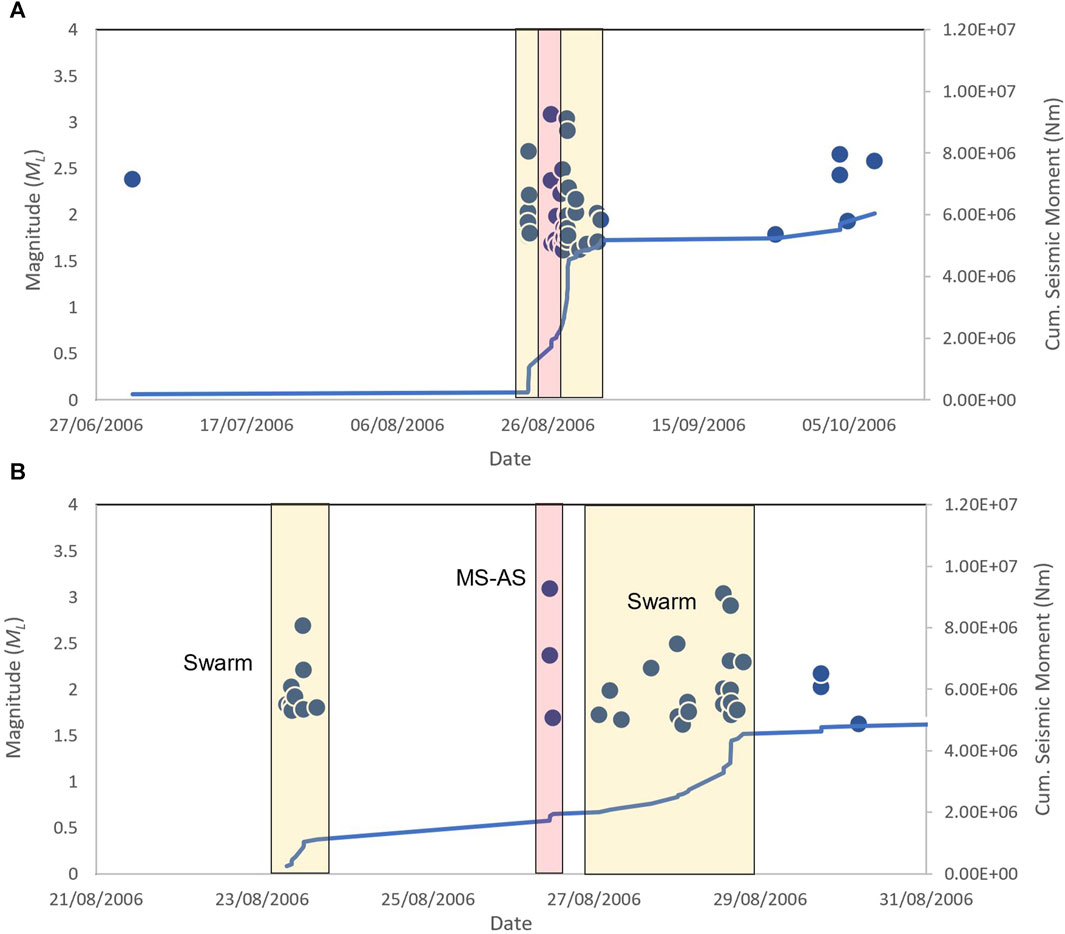
FIGURE 8. Total cumulative M0 of earthquake events in C0-2006 for the temporal cluster detected by DBSCAN (A) and a zoom into the sequence (B), showing the small swarm, highlighted yellow, before the MS-AS event preceding the main swarm, which is highlighted in red. The first event in (A) is not part of the DBSCAN sequence and is only included to assist with the visual. The events after the main swarm were detected by DBSCAN.
5.2 The C1 cluster
This cluster of earthquakes is the only set which occurs entirely away from a mapped fault source. C1-2008 is situated
5.3 The C2 cluster
C2-2015, on the northwest extent of the study area, may be an artifact of the timing of the station deployment. The earthquake rate increases to the threshold defined in DBSCAN, to a peak activity from 24 August 2015, where there was an increase in magnitude to the 3.31 ML event on 26 August. The C2-2015 distribution of events is located away from the fault with a b-value of 0.99 (Figure 7). The temporal evolution of C2-2015 develops from a series of earthquakes with a narrow magnitude band, to a gradual increase in magnitude and rate, with the largest event occurring in the middle of the sequence (Figure 9). Extrapolating from the C2-2015 sequence, there is clear evidence of average earthquake source depths from deep to shallow (Figure 5C), which could be evidence of fluid migration through the mid-crust (Yoshida and Hasegawa, 2018; Yoshida et al., 2023).

FIGURE 9. Total cumulative M0 of earthquake events in Cluster 2 for the temporal cluster detected by DBSCAN. The distribution of events is suggestive of a swarm-like sequence.
5.4 The C3 cluster
The C3 cluster is the most seismically active region in the study area. The near-constant rates with occasional bursts is similar to the seismicity described by Hayes (2004) to the southeast at Waiouru, which is outside of our study area. The first and second temporal bursts in C3-2003 and C3-2009 occur on different trajectories across the National Park fault, yet are similar in geographical extent (Figure 7). C3-2003 and C3-2009 exhibit similar swarm-like behavior (Figure 10), with high b-values of 1.51 and 2.05 respectively. We observe multiple temporal bursts in seismicity, which did not reach the threshold set for DBSCAN, and a lower threshold would certainly yield more swarm events. The temporal evolution of the C3 cluster has similar characteristics to swarm bursts discussed by Petersen and Pankow (2023). Here the variable inter-event bursts are related to variability in fluid migration in a fault-valve model (Sibson, 1992). For C3, changes in pressure from fluids below the surface, coupled with precipitation from the hydrothermal system at Mt. Ruapehu (Christenson and Wood, 1993), can cause the fault to open and close, leading to unpredictable variation in inter-event times (Petersen and Pankow, 2023). The fluid-driven source is supported by relatively high b-values for the region. Further sensitivity analysis into the time series for C3 might offer more insight into the processes we see in this region; however that is beyond the scope of this paper.
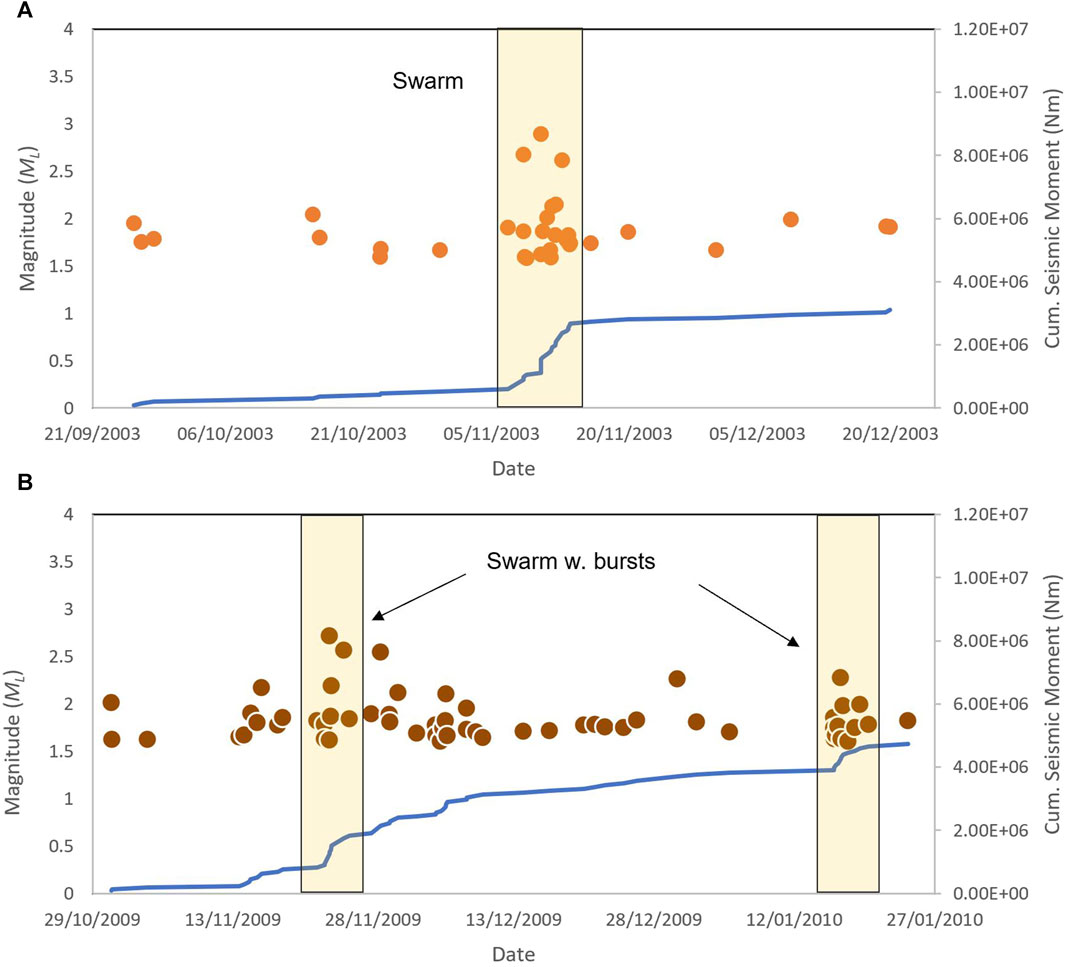
FIGURE 10. Total cumulative M0 of earthquake events for C3-2003 (A) and C3-2009 (B) for the temporal cluster detected by DBSCAN. The swarm bursts in C3-2009 last between 3 and 4 days and are separated by 53 days.
5.5 The C4 cluster
C4-2005 was detected in close proximity to the extinct volcano, Hauhungatahi (Cameron et al., 2010), which is made up of
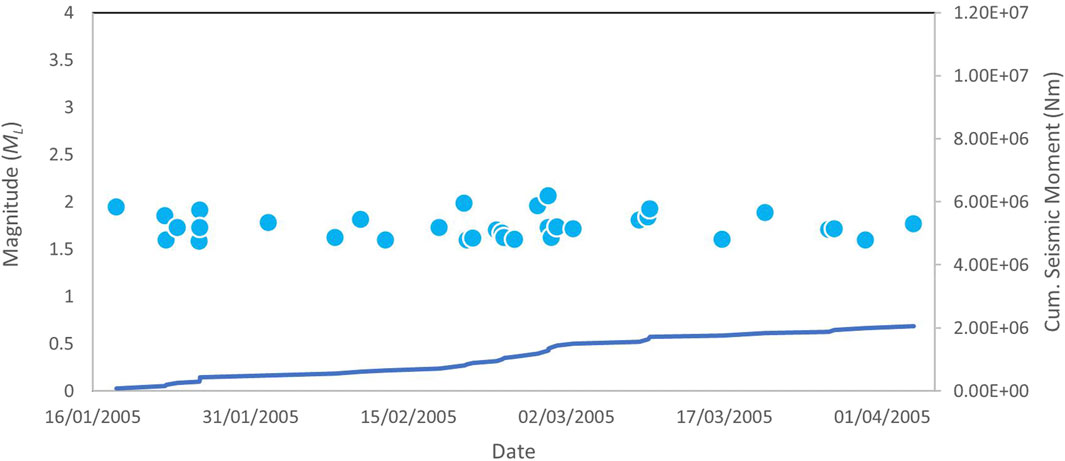
FIGURE 11. Total cumulative M0 of earthquake events in C4-2005 for the temporal cluster detected by DBSCAN.
5.6 The C5 cluster
C5, situated along the northern extent of the Raurimu fault, close to the small town of Erua, is a region with earthquake activity which is often referred to in the literature as a precursor to the major 1995 eruption (Hurst and Vandemeulebrouck, 1996; Hurst and McGinty, 1999; Hurst et al., 2018). Although, the cluster is in the orientation, and in close proximity to the Raurimu fault, seismicity is thought to have not originated from the fault (Keats et al., 2011). The first earthquake sequence, C5-1995, began in January 1995 and ended at the end of July 1995. There were two bursts of activity, a small MS-AS sequence occurred mid-March, before the main burst of activity which began early April. The April burst had 16 individual earthquake events with 2 ML
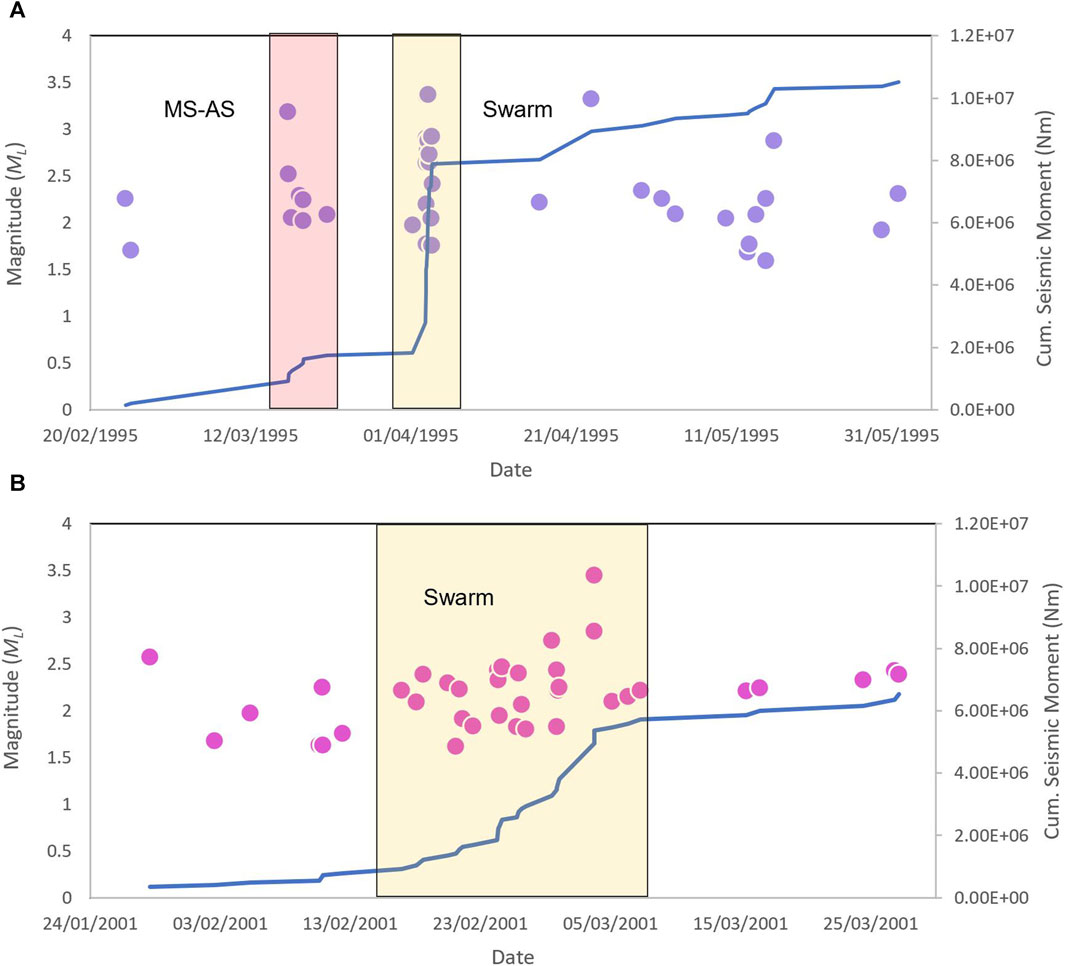
FIGURE 12. Total cumulative M0 of earthquake events in C5-1995 (A) occurred in April 1995 with a maximum magnitude event ML 3.4 and C5-2001 (B) occurred February/March 2001 with a maximum event also ML 3.4.
The second burst of activity (C5-2001), which began in January 2001, had a similar orientation, geographical extent and total number of events as the 1995 sequence, however did not precede any kind of volcanic activity. C5-2001 had a different temporal evolution to the 1995 sequence, with a buildup of seismic activity preceding the largest event on 3 March 2001, and smaller events following (Figure 12B). The largest event occurring around the middle phase of the temporal evolution is a key characteristic of swarm-like behaviour associated with volcano-tectonic events (Jones, 2005; Pesicek et al., 2018). The difference between the largest two events, 3.45 ± 0.23 and 2.85 ± 0.23, is 0.60 ± 0.46, and perhaps is on the boundary of swarm-like magnitude differences. The b-value of the swarm is calculated as 1.67 which is typical for swarm behaviour driven by volcano-tectonic processes (Gudmundsson, 2020).
5.7 Should C5-2001 have preceded an eruption?
The cumulative seismic moment of an earthquake sequence is a proxy for the total amount of energy released and provides insights into the mechanisms driving the seismicity in the region. If there is a lack of pressure or insufficient volume, magma may not have enough energy to overcome stress barriers and can become arrested (Caricchi et al., 2021), which may provide a reason for why there was not an eruption following the earthquake swarm in 2001.
5.7.1 Intrusion volume estimates
Earthquake swarms occurring in proximity to a volcano may be a proxy for magma movement or a change in reservoir pressurisation (Ebmeier et al., 2016). The ability to make real-time forecasts based volcano-tectonic earthquake swarms remains a key challenge in volcano monitoring (Roman and Power, 2011; White and McCausland, 2016). Experimental evidence from water injections in deep wells, showed that total seismic moment (ΣM0) is proportional to a cumulative change in intrusive volume (McGarr, 1976). White and McCausland (2016) translated these properties to infer that the volume (V m3) of a magmatic intrusion should be proportional to the ΣM0 (Nm) equivalent of a volcano-tectonic earthquake swarm:
Using this equation, we calculated the intruded volume of magma for the C5-1995 sequence as 0.0012 km3 for a log10 cumulative moment of 7.02 Nm. C5-2001 had an estimated intruded volume of 0.00085 km3 for a log10 cumulative moment of 6.81 Nm. A study by Meyer et al. (2021) approximated that seismic moment release should be proportionally larger for swarms that eventually lead to an eruption, which is not the case for C5-1995 and C5-2001. However, the study also stated that uncertainties in the measurements would be too large to make meaningful forecasts. Furthermore, when applied to known magmatic intrusions, it was found that the main controlling factor on the seismic energy release was the background seismicity values for that region, rather than the extent of the dike (Pedersen et al., 2007).
To summarise, a vertically and laterally interconnected system with periodic feeding from a deeper source and magma mixing during migration from intrusion to the chamber is a process suggested in other volcanic arc settings and has been linked to distal earthquake swarms in the months preceding eruptions (e.g., Albino et al., 2019). Studies concerning the plumbing system models at Mt. Ruapehu support the hypothesis described by Hurst et al. (2018), that laterally interconnected intrusions could be feeding a small, shallow reservoir (Kilgour et al., 2013). This may exert pressure on the surrounding rocks causing earthquake swarms at considerable distances from the summit. This implies that an earthquake swarm in the Erua region in April 1995 could indeed be interpreted as a precursory warning sign for the 1995 eruption. In the pursuit of identifying viable volcanic eruption precursors for eruption forecasting using machine learning, Ardid et al. (2022) suggested precursory signals should correlate across multiple eruptions and be absent from non-eruptive repose periods. However, the Erua sequence which preceded the 1995 major eruption is either absent, or not documented, prior to the other magmatic eruptions and the 2006 and 2007 phreatic eruptions, which is consistent with Keats et al. (2011). We can also say with confidence that swarm-like activity has occurred in the same region suggested to be an eruption precursor (Hurst et al., 2018) on more than one occasion, during period of non-eruptive activity, with the later 2001 (C5-2001) swarm not preceding an eruption. As for the uniqueness of the 1995 Erua swarm, C5-1995 and C5-2001 share similarities in number of events, magnitudes and geometry of the sequence with the Raurimu fault. However, it could be argued the temporal evolution of the C5-2001 sequence perhaps exhibits more swarm-like behaviour. We have seen evidence of other seismic sequences that have reoccurred in the seismically active west region of Mt. Ruapehu, which have no correlation to documented volcanic activity. Therefore, it is impractical to rely on such earthquake sequences for meaningful eruption forecasts at Mt. Ruapehu.
6 Summary
This study has successfully employed simple unsupervised machine learning clustering algorithms to detect earthquake sequences at Mt. Ruapehu, without a priori knowledge of the system. One of the key motivations for this research was to understand whether the swarm near Erua, which preceded the 1995 major eruption, is a unique signal and one which can be used for mid-term forecasting at Mt. Ruapehu. For this to be true, it should satisfy forecasting constraints, where a signal must be present before an event, but not during periods of no volcanic activity (e.g., Kilburn, 2018; Ardid et al., 2022). Given the evidence in Cluster 5 of a second swarm that did not precede an volcanic activity in 2001, we cannot conclude, based on earthquake swarm characteristics alone, that the Erua swarm is a viable forecasting method at Mt. Ruapehu. We have also discovered evidence for other earthquake sequences, which look similar to the signal detected prior to the 1995 major eruption at Erua during periods of inactivity. We also believe that widening the study area would yield even more earthquake sequences and that these signals are fairly common in the region. Therefore, we have shown that the earthquake swarm near the town of Erua (e.g., Hurst and McGinty, 1999; Hurst et al., 2018) is not a unique signal at Mt. Ruapehu.
6.1 Thoughts going forward
The results of this study have significant implications for understanding the seismic behavior the west of Mt. Ruapehu. By employing density-based clustering algorithms, we have gained a more comprehensive perspective on the spatial and temporal patterns of earthquake activity. Spatial and temporal clustering has shown promise as a quick and effective way of detecting earthquake swarms, particularly within noisy data sets. Retrospective analysis of earthquake catalogues containing many thousands of events can be filtered into high-density regions using a couple of lines of code to call the HDBSCAN algorithm without the necessity of prior domain knowledge. These regions can then be analysed for temporal bursts in seismic activity by using DBSCAN, using the ɛ distance function to calculate distance as time. This is useful for detecting swarms; however it requires the statistical calculation of minimum events for a given time window, which can vary for different systems. Furthermore, the parameter selection for the HDBSCAN can be very sensitive, producing very different results for different minimum cluster size parameters. However, the ability to automatically identify spikes in earthquake rate over different periods of time revealed interesting results, which were less sensitive to the initial parameters, and correlated well with the cumulative seismic rate. Further research could explore including magnitude to the temporal analysis to distinguish between swarm-like and MS-AS sequences. This may help focus on further refining our understanding of the relationships between seismic clusters, volcanic processes, and eruption precursors. Additionally, the application of advanced machine learning may provide deeper insights into the complex interplay between seismicity and volcanic activity in the Mt. Ruapehu region.
Data availability statement
Publicly available datasets were analyzed in this study. This data can be found here: https://quakesearch.geonet.org.nz/.
Author contributions
SM: Writing–original draft. JJ: Conceptualization, Supervision, Writing–review and editing. BM: Methodology, Validation, Writing–review and editing, Supervision. JL: Methodology, Validation, Writing–review and editing, Supervision.
Funding
The author(s) declare financial support was received for the research, authorship, and/or publication of this article. The authors would like to express their gratitude to ARIES and NERC for the financial support provided for this research; grant number NE/S007334/1.
Acknowledgments
The authors would like to thank GeoNet for the open source data which supported the analysis in this research.
Conflict of interest
The authors declare that the research was conducted in the absence of any commercial or financial relationships that could be construed as a potential conflict of interest.
Publisher’s note
All claims expressed in this article are solely those of the authors and do not necessarily represent those of their affiliated organizations, or those of the publisher, the editors and the reviewers. Any product that may be evaluated in this article, or claim that may be made by its manufacturer, is not guaranteed or endorsed by the publisher.
Supplementary material
The Supplementary Material for this article can be found online at: https://www.frontiersin.org/articles/10.3389/feart.2024.1343874/full#supplementary-material
References
Albino, F., Biggs, J., and Syahbana, D. K. (2019). Dyke intrusion between neighbouring arc volcanoes responsible for 2017 pre-eruptive seismic swarm at Agung. Nat. Commun. 10, 748. doi:10.1038/s41467-019-08564-9
Angmo, R., Aggarwal, N., Mangat, V., Lal, A., and Kaur, S. (2021). An improved clustering approach for identifying significant locations from spatio-temporal data. Wirel. Personal. Commun. 121, 985–1009. doi:10.1007/s11277-021-08668-w
Ardid, A., Dempsey, D., Caudron, C., and Cronin, S. (2022). Seismic precursors to the Whakaari 2019 phreatic eruption are transferable to other eruptions and volcanoes. Nat. Commun. 13, 2002. doi:10.1038/s41467-022-29681-y
Bormann, P., and Di Giacomo, D. (2011). The moment magnitude Mw and the energy magnitude Me: common roots and differences. J. Seismol. 15, 411–427. doi:10.1007/s10950-010-9219-2
Bryan, C., and Sherburn, S. (1999). Seismicity associated with the 1995–1996 eruptions of Ruapehu volcano, New Zealand: narrative and insights into physical processes. J. Volcanol. Geotherm. Res. 90, 1–18. doi:10.1016/S0377-0273(99)00016-5
Cameron, E., Gamble, J., Price, R., Smith, I., McIntosh, W., and Gardner, M. (2010). The petrology, geochronology and geochemistry of Hauhungatahi volcano, S.W. Taupo Volcanic Zone. J. Volcanol. Geotherm. Res. 190, 179–191. doi:10.1016/j.jvolgeores.2009.07.002
Campello, R. J. G. B., Moulavi, D., and Sander, J. (2013). “Density-based clustering based on hierarchical density estimates,” in Advances in knowledge discovery and data mining. Editors D. Hutchison, T. Kanade, J. Kittler, J. M. Kleinberg, F. Mattern, J. C. Mitchellet al. (Berlin, Heidelberg: Springer Berlin Heidelberg), 7819, 160–172. doi:10.1007/978-3-642-37456-2_14
Caricchi, L., Townsend, M., Rivalta, E., and Namiki, A. (2021). The build-up and triggers of volcanic eruptions. Nat. Rev. Earth Environ. 2, 458–476. doi:10.1038/s43017-021-00174-8
Carniel, R., Jolly, A. D., and Barbui, L. (2013). Analysis of phreatic events at Ruapehu volcano, New Zealand using a new SOM approach. J. Volcanol. Geotherm. Res. 254, 69–79. doi:10.1016/j.jvolgeores.2012.12.026
Carrivick, J. L., Manville, V., and Cronin, S. J. (2008). A fluid dynamics approach to modelling the 18th March 2007 lahar at Mt. Ruapehu, New Zealand. Bull. Volcanol. 71, 153–169. doi:10.1007/s00445-008-0213-2
Chouet, B. A., and Matoza, R. S. (2013). A multi-decadal view of seismic methods for detecting precursors of magma movement and eruption. J. Volcanol. Geotherm. Res. 252, 108–175. doi:10.1016/j.jvolgeores.2012.11.013
Christenson, B. W., and Wood, C. P. (1993). Evolution of a vent-hosted hydrothermal system beneath Ruapehu crater lake, New Zealand. Bull. Volcanol. 55, 547–565. doi:10.1007/BF00301808
Conway, C. E., Leonard, G. S., Townsend, D. B., Calvert, A. T., Wilson, C. J., Gamble, J. A., et al. (2016). A high-resolution 40Ar/39Ar lava chronology and edifice construction history for Ruapehu volcano, New Zealand. J. Volcanol. Geotherm. Res. 327, 152–179. doi:10.1016/j.jvolgeores.2016.07.006
De La Cruz-Reyna, S., Tárraga, M., Ortiz, R., and Martínez-Bringas, A. (2010). Tectonic earthquakes triggering volcanic seismicity and eruptions. Case studies at Tungurahua and Popocatépetl volcanoes. J. Volcanol. Geotherm. Res. 193, 37–48. doi:10.1016/j.jvolgeores.2010.03.005
Ebmeier, S. K., Elliott, J. R., Nocquet, J.-M., Biggs, J., Mothes, P., Jarrín, P., et al. (2016). Shallow earthquake inhibits unrest near Chiles–Cerro Negro volcanoes, Ecuador–Colombian border. Earth Planet. Sci. Lett. 450, 283–291. doi:10.1016/j.epsl.2016.06.046
Ester, M., Kriegel, H.-P., Sander, J., and Xu, X. (1996). “A density-based algorithm for discovering clusters in large spatial databases with noise,” in Proceedings of the Second International Conference on Knowledge Discovery and Data Mining, Portland, Oregon, August 2-4, 1996, 226–231.
Farías, C., Lazo, J., Basualto, D., Saavedra, M., Muñoz-Quiroz, F., Zúñiga-Urrea, L., et al. (2023). One decade of b-value variations from volcano-tectonic seismicity as an early indicator of episodes of crisis in a volcano: the case of Copahue, Southern Andes. Front. Earth Sci. 11, 1181177. doi:10.3389/feart.2023.1181177
Gamble, J. A., Price, R. C., Smith, I. E., McIntosh, W. C., and Dunbar, N. W. (2003). 40Ar/39Ar geochronology of magmatic activity, magma flux and hazards at Ruapehu volcano, Taupo Volcanic Zone, New Zealand. J. Volcanol. Geotherm. Res. 120, 271–287. doi:10.1016/S0377-0273(02)00407-9
Geffers, G.-M., Main, I. G., and Naylor, M. (2022). Biases in estimating b -values from small earthquake catalogues: how high are high b -values? Geophys. J. Int. 229, 1840–1855. doi:10.1093/gji/ggac028
Gudmundsson, A. (2020). Volcanotectonics: understanding the structure, deformation and dynamics of volcanoes. 1 edn. Cambridge: Cambridge University Press. doi:10.1017/9781139176217
Hayes, G., Reyners, M., and Stuart, G. (2004). The Waiouru, New Zealand, earthquake swarm: persistent mid crustal activity near an active volcano. Geophys. Res. Lett. 31, L19613. doi:10.1029/2004GL020709
Hill, D. P., Pollitz, F., and Newhall, C. (2002). Earthquake–Volcano interactions. Phys. Today 55, 41–47. doi:10.1063/1.1535006
Houghton, B. F., Latter, J. H., and Hackett, W. R. (1987). Volcanic hazard assessment for Ruapehu composite volcano, taupo volcanic zone, New Zealand. Bull. Volcanol. 49, 737–751. doi:10.1007/BF01079825
Hurst, A., and McGinty, P. (1999). Earthquake swarms to the west of Mt Ruapehu preceding its 1995 eruption. J. Volcanol. Geotherm. Res. 90, 19–28. doi:10.1016/S0377-0273(99)00019-0
Hurst, A. W., and Vandemeulebrouck, J. (1996). Acoustic noise and temperature monitoring of the crater lake of mount Ruapehu volcano. J. Volcanol. Geotherm. Res. 71, 45–51. doi:10.1016/0377-0273(95)00060-7
Hurst, T., Kilgour, G., and Hamling, I. (2018). Magmatic triggering of earthquakes on distal faults as a potential medium-term warning signal from Ruapehu Volcano. Geophys. Res. Lett. 45. doi:10.1029/2018GL080677
Johnston, D. M., Houghton, B., Neall, V., Ronan, K., and Paton, D. (2000). Impacts of the 1945 and 1995-1996 Ruapehu eruptions, New Zealand: an example of increasing societal vulnerability. Geol. Soc. Am. Bull. 112, 720–726. doi:10.1130/0016-7606(2000)112<0720:iotare>2.3.co;2
Jolly, A. D., Sherburn, S., Jousset, P., and Kilgour, G. (2010). Eruption source processes derived from seismic and acoustic observations of the 25 September 2007 Ruapehu eruption—north Island, New Zealand. J. Volcanol. Geotherm. Res. 191, 33–45. doi:10.1016/j.jvolgeores.2010.01.009
Jones, J. (2005). Mount Hood earthquake activity: volcanic or tectonic origins? Bull. Seismol. Soc. Am. 95, 818–832. doi:10.1785/0120040019
Karami, A., and Johansson, R. (2014). Choosing DBSCAN parameters automatically using differential evolution. Int. J. Comput. Appl. 91, 1–11. doi:10.5120/15890-5059
Keats, B. S., Johnson, J. H., and Savage, M. K. (2011). The Erua earthquake cluster and seismic anisotropy in the Ruapehu region, New Zealand: the Erua earthquake cluster. Geophys. Res. Lett. 38. doi:10.1029/2011GL049014
Kilburn, C. (2012). Precursory deformation and fracture before brittle rock failure and potential application to volcanic unrest: precursors to brittle rock failure. J. Geophys. Res. Solid Earth 117. doi:10.1029/2011JB008703
Kilburn, C. R. J. (2018). Forecasting volcanic eruptions: beyond the failure forecast method. Front. Earth Sci. 6. doi:10.3389/feart.2018.00133
Kilgour, G., Blundy, J., Cashman, K., and Mader, H. M. (2013). Small volume andesite magmas and melt–mush interactions at Ruapehu, New Zealand: evidence from melt inclusions. Contributions Mineralogy Petrology 166, 371–392. doi:10.1007/s00410-013-0880-7
Kilgour, G., Manville, V., Pasqua, F. D., Graettinger, A., Hodgson, K., and Jolly, G. (2010). The 25 September 2007 eruption of Mount Ruapehu, New Zealand: directed ballistics, surtseyan jets, and ice-slurry lahars. J. Volcanol. Geotherm. Res. 191, 1–14. doi:10.1016/j.jvolgeores.2009.10.015
Kilgour, G., Saunders, K., Blundy, J., Cashman, K., Scott, B., and Miller, C. (2014). Timescales of magmatic processes at Ruapehu volcano from diffusion chronometry and their comparison to monitoring data. J. Volcanol. Geotherm. Res. 288, 62–75. doi:10.1016/j.jvolgeores.2014.09.010
Langridge, R., Ries, W., Litchfield, N., Villamor, P., Van Dissen, R., Barrell, D., et al. (2016). The New Zealand active faults database. N. Z. J. Geol. Geophys. 59, 86–96. doi:10.1080/00288306.2015.1112818
Lanza, F., Roman, D. C., Power, J. A., Thurber, C. H., and Hudson, T. (2022). Complex magmatic-tectonic interactions during the 2020 Makushin Volcano, Alaska, earthquake swarm. Earth Planet. Sci. Lett. 587, 117538. doi:10.1016/j.epsl.2022.117538
Leonard, G. S., Cole, R. P., Christenson, B. W., Conway, C. E., Cronin, S. J., Gamble, J. A., et al. (2021). Ruapehu and Tongariro stratovolcanoes: a review of current understanding. N. Z. J. Geol. Geophys. 64, 389–420. doi:10.1080/00288306.2021.1909080
Manville, V., Hodgson, K. A., and Nairn, I. A. (2007). A review of break-out floods from volcanogenic lakes in New Zealand. N. Z. J. Geol. Geophys. 50, 131–150. doi:10.1080/00288300709509826
McGarr, A. (1976). Seismic moments and volume changes. J. Geophys. Res. 81, 1487–1494. doi:10.1029/JB081i008p01487
McNutt, S. R. (2002). “25 - volcano seismology and monitoring for eruptions,” in International Geophysics. Editors W. H. K. Lee, H. Kanamori, P. C. Jennings, and C. Kisslinger (Cambridge, Massachusetts, United States: Academic Press). Part A. 383–cp1. doi:10.1016/S0074-6142(02)80228-5
McNutt, S. R. (2005). Volcanic seismology. Annu. Rev. Earth Planet. Sci. 33, 461–491. doi:10.1146/annurev.earth.33.092203.122459
McNutt, S. R., and Roman, D. C. (2015). “Volcanic seismicity,” in The encyclopedia of volcanoes (Amsterdam, Netherlands: Elsevier), 1011–1034. doi:10.1016/B978-0-12-385938-9.00059-6
Meyer, K., Biggs, J., and Aspinall, W. (2021). A Bayesian reassessment of the relationship between seismic moment and magmatic intrusion volume during volcanic unrest. J. Volcanol. Geotherm. Res. 419, 107375. doi:10.1016/j.jvolgeores.2021.107375
Nakagawa, M., Wada, K., Thordarson, T., Wood, C. P., and Gamble, J. A. (1999). Petrologic investigations of the 1995 and 1996 eruptions of Ruapehu volcano, New Zealand: formation of discrete and small magma pockets and their intermittent discharge. Bull. Volcanol. 61, 15–31. doi:10.1007/s004450050259
Pavlenko, V. A., and Zavyalov, A. D. (2022). Comparative analysis of the methods for estimating the magnitude of completeness of earthquake catalogs. Izvestiya, Phys. Solid Earth 58, 89–105. doi:10.1134/S1069351322010062
Pedersen, R., Sigmundsson, F., and Einarsson, P. (2007). Controlling factors on earthquake swarms associated with magmatic intrusions; Constraints from Iceland. J. Volcanol. Geotherm. Res. 162, 73–80. doi:10.1016/j.jvolgeores.2006.12.010
Pesicek, J. D., Wellik, J. J., Prejean, S. G., and Ogburn, S. E. (2018). Prevalence of seismic rate anomalies preceding volcanic eruptions in Alaska. Front. Earth Sci. 6, 100. doi:10.3389/feart.2018.00100
Petersen, G. M., and Pankow, K. L. (2023). Small-magnitude seismic swarms in Central Utah (US): interactions of regional tectonics, local structures and hydrothermal systems. Geochem. Geophys. Geosystems 24, e2023GC010867. doi:10.1029/2023GC010867
Ramis, R., Garcia, A., Marrero, J., De La Cruz-Reyna, S., Carniel, R., and Vila, J. (2018). Volcanic and volcano-tectonic activity forecasting: a review on seismic approaches. Ann. Geophys. 61, 9. doi:10.4401/ag-7655
Rhoades, D. A., Christophersen, A., Bourguignon, S., Ristau, J., and Salichon, J. (2021). A depth-dependent local magnitude scale for New Zealand earthquakes consistent with moment magnitude. Bull. Seismol. Soc. Am. 111, 1056–1066. doi:10.1785/0120200252
Ristau, J. (2009). Comparison of magnitude estimates for New Zealand earthquakes: moment magnitude, local Magnitude, and teleseismic body-wave magnitude. Bull. Seismol. Soc. Am. 99, 1841–1852. doi:10.1785/0120080237
Roberts, N. S., Bell, A. F., and Main, I. G. (2015). Are volcanic seismic b -values high, and if so when? J. Volcanol. Geotherm. Res. 308, 127–141. doi:10.1016/j.jvolgeores.2015.10.021
Roman, D. C., and Power, J. A. (2011). Mechanism of the 1996–97 non-eruptive volcano-tectonic earthquake swarm at Iliamna Volcano, Alaska. Bull. Volcanol. 73, 143–153. doi:10.1007/s00445-010-0439-7
Rousseeuw, P. J. (1987). Silhouettes: a graphical aid to the interpretation and validation of cluster analysis. J. Comput. Appl. Math. 20, 53–65. doi:10.1016/0377-0427(87)90125-7
Schaefer, L. N., Kennedy, B. M., Villeneuve, M. C., Cook, S. C., Jolly, A. D., Keys, H. J., et al. (2018). Stability assessment of the Crater Lake/Te Wai-ā-moe overflow channel at Mt. Ruapehu (New Zealand), and implications for volcanic lake break-out triggers. J. Volcanol. Geotherm. Res. 358, 31–44. doi:10.1016/j.jvolgeores.2018.06.011
Scitovski, S. (2018). A density-based clustering algorithm for earthquake zoning. Comput. Geosciences 110, 90–95. doi:10.1016/j.cageo.2017.08.014
Seropian, G., Kennedy, B. M., Walter, T. R., Ichihara, M., and Jolly, A. D. (2021). A review framework of how earthquakes trigger volcanic eruptions. Nat. Commun. 12, 1004–1013. doi:10.1038/s41467-021-21166-8
Sherburn, S., Bryan, C., Hurst, A., Latter, J., and Scott, B. (1999). Seismicity of Ruapehu volcano, New Zealand, 1971–1996: a review. J. Volcanol. Geotherm. Res. 88, 255–278. doi:10.1016/S0377-0273(99)00014-1
Shutaywi, M., and Kachouie, N. N. (2021). Silhouette analysis for performance evaluation in machine learning with applications to clustering. Entropy 23, 759. doi:10.3390/e23060759
Sibson, R. (1992). Implications of fault-valve behaviour for rupture nucleation and recurrence. Tectonophysics 211, 283–293. doi:10.1016/0040-1951(92)90065-E
Starczewski, A., Goetzen, P., and Er, M. J. (2020). A new method for automatic determining of the DBSCAN parameters. J. Artif. Intell. Soft Comput. Res. 10, 209–221. doi:10.2478/jaiscr-2020-0014
Thelen, W. A., Malone, S. D., and West, M. E. (2010). Repose time and cumulative moment magnitude: a new tool for forecasting eruptions? REPOSE TIME. Geophys. Res. Lett. 37. doi:10.1029/2010GL044194
Vidale, J. E., Boyle, K. L., and Shearer, P. M. (2006). Crustal earthquake bursts in California and Japan: their patterns and relation to volcanoes. Geophys. Res. Lett. 33, L20313. doi:10.1029/2006GL027723
Vidale, J. E., and Shearer, P. M. (2006). A survey of 71 earthquake bursts across southern California: exploring the role of pore fluid pressure fluctuations and aseismic slip as drivers. J. Geophys. Res. Solid Earth 111, 2005JB004034. doi:10.1029/2005JB004034
Wang, F., Franco-Penya, H.-H., Kelleher, J. D., Pugh, J., and Ross, R. (2017). “An analysis of the application of simplified silhouette to the evaluation of k-means clustering validity,” in Machine learning and data mining in pattern recognition. Editor P. Perner (Cham: Springer International Publishing), 291–305. Lecture Notes in Computer Science. doi:10.1007/978-3-319-62416-7_21
White, R., and McCausland, W. (2016). Volcano-tectonic earthquakes: a new tool for estimating intrusive volumes and forecasting eruptions. J. Volcanol. Geotherm. Res. 309, 139–155. doi:10.1016/j.jvolgeores.2015.10.020
Wiemer, S. (2000). Minimum magnitude of completeness in earthquake catalogs: examples from Alaska, the western United States, and Japan. Bull. Seismol. Soc. Am. 90, 859–869. doi:10.1785/0119990114
Yarce, J., Sheehan, A. F., Nakai, J. S., Schwartz, S. Y., Mochizuki, K., Savage, M. K., et al. (2019). Seismicity at the northern hikurangi margin, New Zealand, and investigation of the potential spatial and temporal relationships with a shallow slow slip event. J. Geophys. Res. Solid Earth 124, 4751–4766. doi:10.1029/2018JB017211
Yoshida, K., and Hasegawa, A. (2018). Hypocenter migration and seismicity pattern change in the yamagata-fukushima border, NE Japan, caused by fluid movement and pore pressure variation. J. Geophys. Res. Solid Earth 123, 5000–5017. doi:10.1029/2018JB015468
Yoshida, K., Uno, M., Matsuzawa, T., Yukutake, Y., Mukuhira, Y., Sato, H., et al. (2023). Upward earthquake swarm migration in the northeastern noto peninsula, Japan, initiated from a deep ring-shaped cluster: possibility of fluid leakage from a hidden magma system. J. Geophys. Res. Solid Earth 128, e2022JB026047. doi:10.1029/2022JB026047
Keywords: HDBSCAN, DBSCAN, Ruapehu volcano, unsupervised learning, machine learning, time series, earthquake sequence
Citation: Mitchinson S, Johnson JH, Milner B and Lines J (2024) Identifying earthquake swarms at Mt. Ruapehu, New Zealand: a machine learning approach. Front. Earth Sci. 12:1343874. doi: 10.3389/feart.2024.1343874
Received: 24 November 2023; Accepted: 16 February 2024;
Published: 04 March 2024.
Edited by:
Silvia Scarpetta, University of Salerno, ItalyReviewed by:
Angelo De Santis, National Institute of Geophysics and Volcanology (INGV), ItalyMelody Whitehead, Massey University, New Zealand
Copyright © 2024 Mitchinson, Johnson, Milner and Lines. This is an open-access article distributed under the terms of the Creative Commons Attribution License (CC BY). The use, distribution or reproduction in other forums is permitted, provided the original author(s) and the copyright owner(s) are credited and that the original publication in this journal is cited, in accordance with accepted academic practice. No use, distribution or reproduction is permitted which does not comply with these terms.
*Correspondence: Sam Mitchinson, s.mitchinson@uea.ac.uk