Variability in geochemical weathering indices in loess over the last full glacial cycle at Karamaidan, central Asia (Tajikistan)
 Andrea Aquino1,2*
  Giancarlo Scardia3
  Charlotte Prud’homme4
  Aditi K. Dave1,5
  Marco Lezzerini2 Alexandra Engström Johansson6 Laurent Marquer7
  Nosir Safaraliev8 Tobias Lauer1
  Kathryn E. Fitzsimmons1,6
- 1Department of Geosciences, Universität Tübingen, Tübingen, Germany
- 2Department of Earth Sciences, University of Pisa, Pisa, Italy
- 3Instituto de Geociências e Ciências Exatas, Universidade Estadual Paulista (UNESP), Rio Claro, Brazil
- 4Centre de Recherches Pétrographiques et Géochimiques, Centre National de la Recherche Scientifique (CNRS), Université de Lorraine, Nancy, France
- 5Interdisciplinary Research Institute for Bionanosciences, Babes-Bolyai University, Cluj-Napoca, Romania
- 6Research Group for Terrestrial Palaeoclimates, Max Planck Institute for Chemistry, Mainz, Germany
- 7Department of Botany, University of Innsbruck, Innsbruck, Austria
- 8Faculty of Geology, Tajik National University, Dushanbe, Tajikistan
This study presents the first quantitative assessment of weathering conditions in the Tajikistan depression throughout the last full glacial cycle. We employed geochemical and magnetic susceptibility analyses to investigate various weathering indices (WIs), with the CPA and FENG indices identified as the most suitable for this region. Our results confirm the formation of a robust pedocomplex, PS2, during the OIS5 interglacial phase, while primary loess deposition occurred during the interstadials. The presence of a weak paleosol, PS1, suggests that OIS3 was not significantly pronounced, and sediment transport and deposition continued during this period. Furthermore, we assessed the effectiveness of various climatic transfer functions, including some recently developed specifically for Chinese loess. These transfer functions have also shown promising applicability to the loess of Central Asia, producing realistic climate trends that are, however, still to be taken with caution. The MAT and mean annual precipitation generated with these functions show for the last interglacial period about 13°C and 665 mm, thus higher temperatures and lower precipitation than the current conditions of 10.8°C and 730 mm. These results indicate a significant increase (c. 15%) in both temperature and precipitation compared to the stadial periods.
1 Introduction
Loess is most commonly defined as homogeneous silty sediment deposited by aeolian transport (Pécsi, 1990). The primary fine-grained source material for loess may be produced by a range of processes relating to geographical context (Nemecz et al., 2000), including grinding by glaciers (Smalley, 1966), tectonic activity (Smalley and Derbyshire, 1990; Smalley, 1995) and wind abrasion in deserts (Smalley and Vita-Finzi, 1968; Smalley and Krinsley, 1978). Increasing evidence suggests that most aeolian loess is transported over relatively short distances (Smalley et al., 2009; Stevens et al., 2010; Li et al., 2018), although long-range atmospheric dust nevertheless may represent a substantial component (Stuut et al., 2009). Loess sediments are overwhelmingly, although not exclusively distributed within the semi-arid to sub-humid zones of the planet (Taylor et al., 1983; Liu, 1985; Kukla, 1987; Tsoar and Pye, 1987; Smalley et al., 2011; Fitzsimmons, 2017; Lehmkuhl et al., 2021), where wind dominates sediment transport. Some of the thickest loess deposits, such as those on the Chinese Loess Plateau (CLP) and in the Central Asian piedmonts, occur in semi-arid to sub-humid regions downstream and downwind of high altitude glaciated areas (Fitzsimmons, 2017; Schaetzl et al., 2018). In the case of glacially derived loess, the most commonly accepted hypothesis is that the silty sediment is produced in larger quantities during cold climate phases associated with glacial expansion, while during milder interglacials and interstadials, accumulation decreases and deposits are overprinted by pedogenesis (Liu and Chang, 1964; Sun et al., 2006; Fitzsimmons et al., 2012; 2018). According to this model, loess-paleosol sequences reflects Pleistocene climatic variability (Heller and Liu, 1982; Liu, 1985; Kukla, 1987; Kukla and An, 1989; Rutter et al., 1991; Porter and An, 1995; Derbyshire et al., 1997). Where accumulation is largely continuous, loess deposits therefore represent some of the most important terrestrial archives of Quaternary climate change (An et al., 1990; Catt, 1991; Catt et al., 2000; Porter, 2001).
The thick piedmont loess deposits of Central Asia represent the most widespread and complete sedimentary archives for the Quaternary period for that region (Forster and Heller, 1994; Dodonov and Baiguzina, 1995; Ding et al., 2002; Dodonov et al., 2006; Yang et al., 2006; Fitzsimmons et al., 2018; Tian et al., 2021), yet remain some of the least well studied. The Central Asian loess extends along an east-west transect along the piedmonts between the Asian high mountains to the south, and the desert basins to the north (Schaetzl et al., 2018). These deposits vary in thickness and age along the piedmonts (Prud’homme et al., 2021; Dave et al., 2023a). The thickest and longest loess deposits are located at the western end of the Central Asian piedmont, in Tajikistan, where loess up to 200 m thick has accumulated since the early Pleistocene (from 2.5 to 2.0 Ma), comparable to deposits on the Chinese Loess Plateau (Dodonov, 1991; 2007; Forster and Heller, 1994; Dodonov and Baiguzina, 1995; Shackleton, 1995; Machalett et al., 2008). These long aeolian sequences are significant by virtue of the fact that Central Asia lies in a critical location for understanding global climate systems; it falls within the transition zone between the Indian and Asian monsoons to the south (Dettman et al., 2001; Cheng et al., 2016; Zhang, 2021), the mid-latitude westerly fronts (Vandenberghe et al., 2006), and northerly winds associated with the latitudinal migration of the polar jet stream associated with the Siberian high pressure system (Lydolph, 1977; Fitzsimmons et al., 2020). The air masses associated with these climatic subsystems are responsible for the transport and deposition of large quantities of aeolian sediment made available by glacial and fluvial erosion of the Asian high mountains, transported by rivers onto the piedmonts and the basins (Obruchev, 1945; Dodonov and Baiguzina, 1995). This link between the Central Asian loess, hydrology and climate circulation as a key record for understanding long-term northern hemisphere atmospheric dynamics has recently been highlighted (Caves et al., 2016; Prud’homme et al., 2021). In this context, the geochemical and physical characteristics of loess sediments therefore have the potential to reflect the intensity and interaction of major climate systems, so elucidating large-scale terrestrial-atmospheric linkages.
The geochemical composition of sediments, including the abundance of major and minor elements, can provide insights into the extent of regional weathering that has occurred subsequent to deposition.
However, it is important to note that distinguishing between pre- and post-depositional weathering solely based on bulk geochemistry (i.e., weathering) is challenging. These can be quantified using element ratios or weathering indices (WIs), and have been explored in silicaceous sediments (Parker, 1970; Kronberg and Nesbitt, 1981; Nesbitt and Young, 1982; Fedo et al., 1995), including loess-paleosol deposits (Feng, 1997; Buggle et al., 2011a; Liang et al., 2013; Wang et al., 2013; 2023; Schatz, 2014; Újvári et al., 2014; Schatz et al., 2015). Over the years, numerous WIs have been developed, with the aim of determining the mechanisms of weathering phenomena (Kronberg and Nesbitt, 1981; Nesbitt and Young, 1982; Harnois, 1988; Maynard, 1993; Fedo et al., 1995; Feng, 1997; Cullers, 2000; Sheldon et al., 2002; Darmody et al., 2005; Yang et al., 2006; Buggle et al., 2011a; Gallagher and Sheldon, 2013). WIs make use of distinct elements and ratios (Buggle et al., 2011b; Schatz et al., 2015; Wang et al., 2023) and can be used for a variety of purposes, including differentiation of palaeosol vs. primary loess subunits (e.g., Schatz et al., 2015), and to quantify the intensity of post-depositional weathering associated with climatic variability (Sheldon and Tabor, 2009; Schatz et al., 2015; Wang et al., 2023). WIs have also been incorporated into transfer functions to derive climate parameters such as precipitation and temperature (Sheldon et al., 2002; Gallagher and Sheldon, 2013). Whilst WIs have been used to reconstruct quantitative palaeoclimate parameters for loess deposits in Europe (Schatz et al., 2015) and China (Wang et al., 2013; 2023), it is unclear to what degree WI-derived transfer functions yield accurate and meaningful values (Újvári, 2014). This argument is based on the use by transfer functions of calibration datasets which bear no climatic, geographical or chemical relation to the loess for which the parameters are calculated (Wang et al., 2013; Schatz et al., 2015), since chemical weathering processes are often strongly dependent on local climate, geology, and ecology. A more recent study by Wang et al. (2023) developed a new set of transfer functions based on weathering parameters from loess and surrounding regions in China and promise potentially more meaningful algorithms.
In this study we investigate the geochemical composition of and degree of weathering in a Central Asian loess-paleosol sequence (LPS) and investigate these characteristics for their potential as paleoenvironmental indicators. The loess of the Tajik basin at the western end of the Asian high mountains is relatively poorly studied (Dodonov, 1991; 2007; Forster and Heller, 1994; Bronger et al., 1995; Dodonov and Baiguzina, 1995; Ding et al., 2002; Dodonov et al., 2006), and few studies make use of geochemical techniques (Li et al., 2016; Li et al., 2019; Wang et al., 2016; Tian et al., 2021). Our study site at Karamaidan exceeds 100 m thickness (Shackleton, 1995; Forster and Heller, 1997); here we focus on the uppermost 16 m which spans the last full glacial cycle, a period that can be reliably dated using luminescence. In this study, we characterize the major and minor element geochemistry at high resolution, calculate a range of WIs and characterize the nature of weathering through time. Finally, we calculate quantitative climatic parameters based on published transfer functions previously applied to loess (Schatz et al., 2015; Wang et al., 2023) and discuss to what extent the values derived–are applicable and meaningful for palaeoclimate reconstruction at Karamaidan.
2 Materials and methods
2.1 Karamaidan locality and sampling
The Karamaidan loess section (Figure 1) is located at the northern edge of the Tajik depression, c. 40 km east of the Tajik capital Dushanbe, at the foothills of the Zarafshan mountain range, between the Tianshan range to the north and the Pamir Mountains to the east. The region is characterized by a mild temperate continental climate, with an average annual temperature of 10.8°C, peaking at 23.1°C in July, and the lowest average monthly temperature of −1.7°C in January (Fick and Hijmans, 2017). The region receives 730 mm of annual precipitation, which overwhelmingly falls in the spring months.
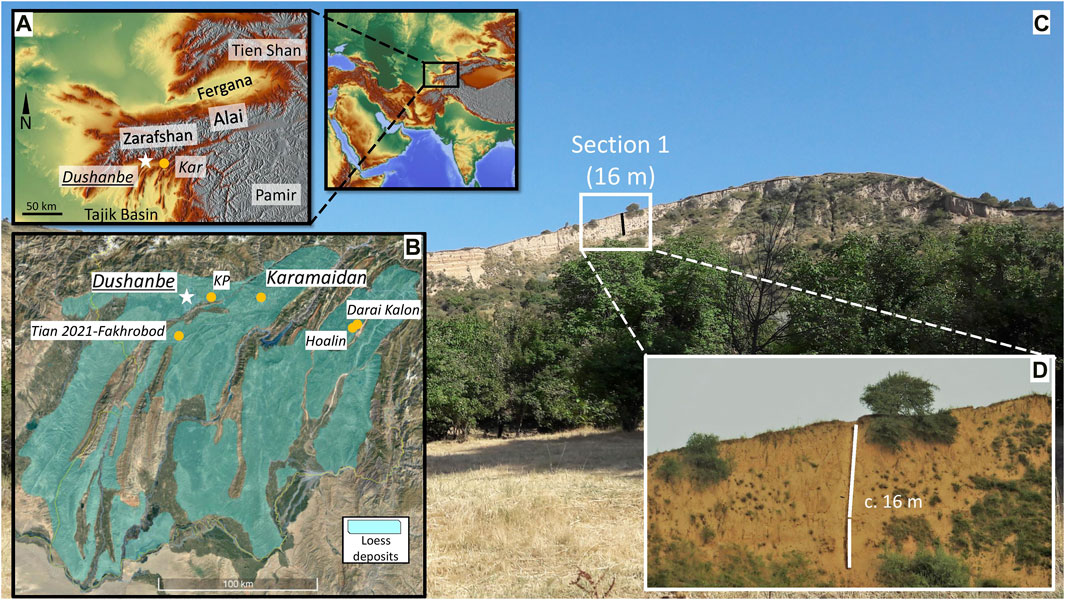
FIGURE 1. (A) Location of the Karamaidan locality (yellowish-orange dot) in the context of the western Central Asian Mountain ranges Zarafshan, Alai, Tien Shan and Pamir. (B) Location of the Karamaidan locality at the northern margins of the Tajik Basin with respect to the distribution of loess deposits in the basin. (C) Overview of the main Karamaidan exposure, showing the location of Section 1, which forms the focus of this study. (D) The Section 1 outcrop pictured in detail. Base topographic map from OpenStreetMap, and satellite image from Google Earth.
The Karamaidan site is a >100 m-thick loess-paleosol package that preserves semi-continuous accumulation of sediment since at least the Brunhes-Matuyama boundary (Forster and Heller, 1994; 1997; Zhou et al., 1995). The current profile was exposed by mass slumping detached by earthquakes in 1930 and 1943 (Gorshkov, 1935; 1949; Kuhtikova, 1966). The value of the site as a loess-paleosol sequence (LPS) has been known since Soviet times (Dodonov, 1991); subsequent studies described the pedo- and magneto-stratigraphy (Dodonov, 1991; Forster and Heller, 1994; Bronger et al., 1995; Shackleton, 1995; Bronger, 2003). More recently, variability in trapped-charge characteristics of quartz from the sequence was investigated as potential indicators of shifts in sediment source down the sequence (Dave et al., 2022). As yet, however, there have been no studies of the chemical composition or weathering intensity of the Karamaidan sequence; absolute dating of the sequence to confirm the proposed correlation with Quaternary glacial-interglacial cycles (Shackleton, 1995) is likewise lacking.
In this study, we examine the uppermost 16 m of the Karamaidan LPS. This subsection spans the near-surface Holocene to modern soil, primary loess intersected by a weak soil, and a well-developed soil at the base, which has been interpreted based on magnetostratigraphic correlation to span the last full glacial cycle from oxygen isotope stages (OIS) 1–5 (Forster and Heller, 1994). We focus on this subsection since it covers the greatest variability in geochemical weathering intensities possible in the smallest possible depth range, and this time period can be more reliably dated directly using luminescence techniques.
Since the profile is exposed as a cliff-face, sampling took place by abseil. Stratigraphic and sampling depths were continuously checked with respect to a datum fixed at the top of the profile. The profile was excavated back to avoid sampling of sediment washed down or blown onto the surface. Tools used for sampling were cleaned before the collection of each sample to avoid cross-contamination. We undertook continuous sampling at 10 cm resolution, starting at 0.80 m depth to avoid recent reworking. We collected c. 300 g of bulk material in airtight plastic bags for multiple analyses, 153 bulk samples in total. We collected samples for laboratory analysis of magnetic susceptibility at 10 cm intervals in 8 cm3 plastic cubes from 0.8–16 m depth. Sampling for luminescence dating was undertaken in duplicate at 1 m intervals using stainless steel light-proof tubes (4 cm diameter, 10 cm length); an additional c. 300 g was collected from surrounding the sample tubes for dose-rate analysis.
We subsampled the bulk sediment samples in the laboratory for the X-ray fluorescence (XRF) elemental and loss on ignition (LOI) analyses. We took approximately 10 g of material from each bulk sample bag, taking precaution to avoid cross-contamination between samples by cleaning work surfaces with demineralized water and then isopropyl alcohol, covering the work surface with aluminum foil heated to 100 °C overnight, and using nitrile gloves and sterilized spatulas.
2.2 Magnetic susceptibility
Magnetic susceptibility (MS) measurements are widely used in loess-palaeosol studies to assess pedogenesis, weathering intensity, sediment sources, and rainfall, making it a valuable tool for reconstructing environmental and paleoclimatic changes (e.g., Banerjee et al., 1981; Maher, 1986; Kukla et al., 1988; Maher and Thompson, 1995; Dearing, 1999; Antoine et al., 2001; Balsam et al., 2011). Mechanisms and paths by which soils show MS enhancement are related to enrichment of fine-grained ferrimagnetic and paramagnetic minerals by a wide range of pedogenic processes. At Karamaidan Forster and Heller (1997) specifically documented that MS susceptibility enhancement along the loess-paleosols profile is controlled in a linear fashion by the increasing amount of ferrimagnetic minerals and clay mineral content (paramagnetic phase), indicating that MS is a reliable proxy for weathering in our study.
We measured the magnetic susceptibility of the Karamaidan sediments both in situ and in the laboratory. In the field, we used a Bartington MS3 meter combined with an MS2K field sensor and Trimble Nomad minicomputer. The Bartington probe was positioned directly on the cleaned profile every 5 cm down profile. We compensated for thermally induced drift due to environmental temperature variations by calibrating each measurement individually to air temperature. In the laboratory, we measured the volume-specific, low-frequency magnetic susceptibility at the Laboratory of Paleomagnetism of Universidade Estadual Paulista (UNESPmag, Rio Claro, Brazil) using a Bartington MS3 meter equipped with a MS2B sensor set at 4.6 kHz.
2.3 Sediment geochemistry
Samples for XRF chemical analysis were first air-dried at 40 °C and then homogenized by sieving and splitting. We then ground the samples in a planetary ball mill in agate jars at the Max Planck Institute for Chemistry (Mainz, Germany).
XRF analyses were performed at the Institute of Geosciences, Johannes Gutenberg University (Mainz, Germany). XRF analysis was undertaken using a MagiXPro spectrometer from Philips and Panalytical, containing an Rh tube as X-ray source with a maximum power of 4 kW (60 kV, 126 mA). We prepared glass beads for XRF measurement by diluting the sample with Li-tetraborate (Spectromelt A10, Merck) dry flux at a ratio of 1:13 (0.4000 g ± 0.0050 g sample and 5.2000 g ± 0.0050 g dry flux). The flux had previously been dried at 450°C for 2 h and placed in a desiccator for cooling. The samples were mixed and homogenized in porcelain crucibles with a glass stirring rod, then poured into platinum crucibles using the resonance properties of porcelain to minimize material loss. We then melted the samples at approximately 1,050°C with an automatic Vulcan fan burner (HD Elektronik und Elektrotechnik GmbH) and poured the melt into platinum molds to form glass beads. Element concentrations are expressed as a weight percentage (wt%) of the respective oxides and were recalculated on a volatile-free basis. From our geochemical data (Supplementary Material SM-1), generated as element oxides (wt%), we calculated the 12 WIs (Table 1).339457720088
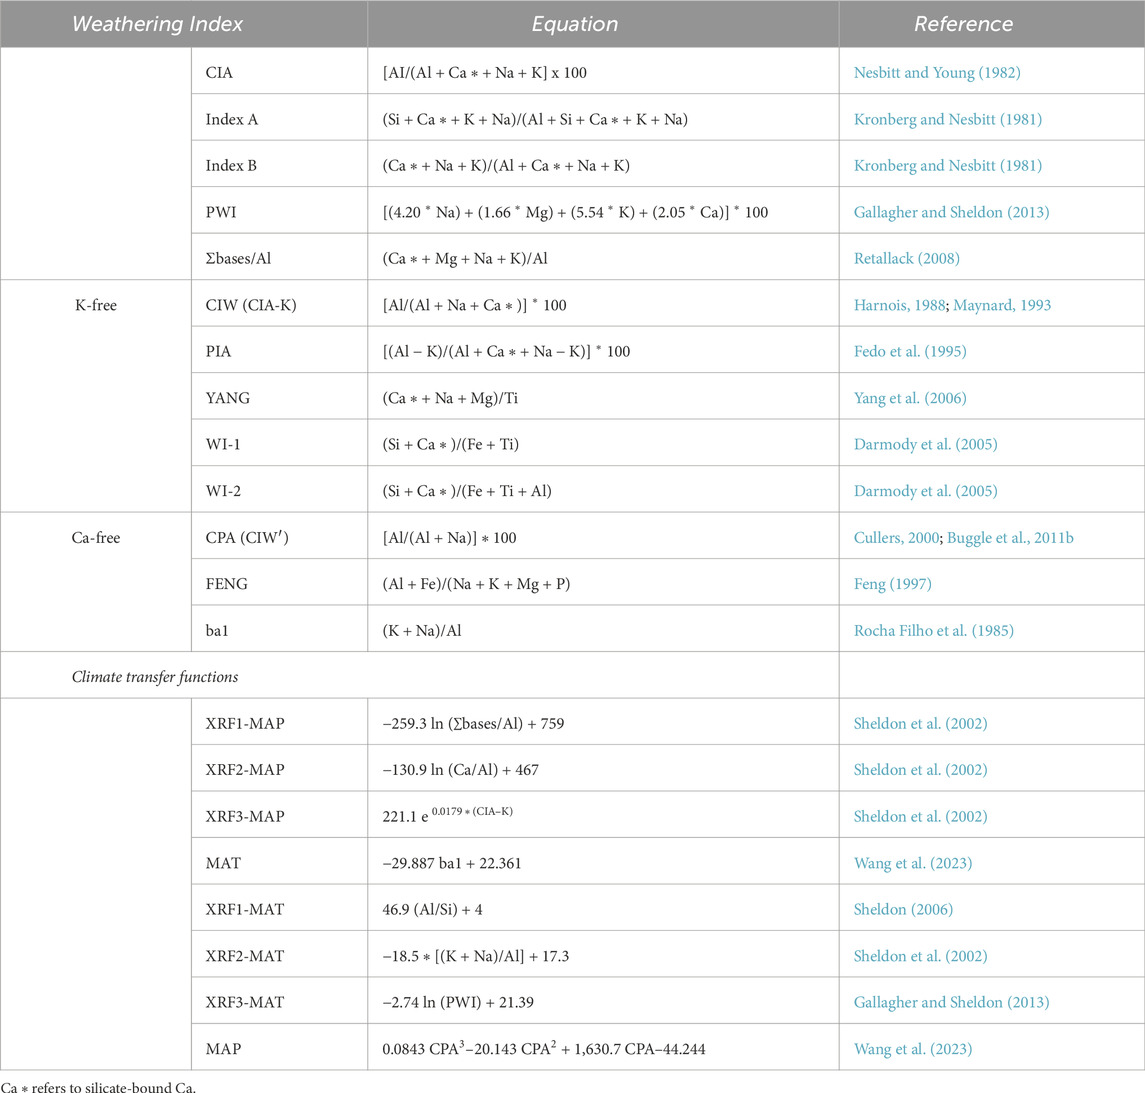
TABLE 1. Summary of the weathering indices and empirical climate transfer functions selected for calculation in this study.
We determined the LOI in the same laboratory as the XRF analyses, heating approximately 0.5–1.0 g of subsample in a muffle furnace at 1,000 °C ± 20 °C for 3 h. Sample mass was precisely measured to 4th decimal places before and after heating.
At the LABECA (Cultural and Environmental Heritage Laboratory) of the University of Pisa, we determined the CaCO3 content by CO2 measurement using the gasometric method (Leone et al., 1988), from which we calculated calcite-bound CaO (CaO calcite) and silicate-bound “corrected CaO” (CaO*).
2.4 Luminescence dating
Samples were prepared for luminescence dating under red-light conditions at the Institute of Geosciences, Johannes Gutenberg University, Mainz (Germany). Due to the lack of sufficient >63 µm size grains, we prepared fine-grained (4–11 µm) quartz from all 12 samples. We treated the <63 µm sieved sediment fraction with 10% HCl and 10% H2O2 to remove carbonates and organics respectively, after which we washed the samples with 0.1 N sodium oxalate to remove clays. Each successive chemical pre-treatment step was followed by multiple washing with deionized water. The fine-grained (4–11 µm) size fraction was settled out using Stokes Law. We then etched the 4–11 µm polymineral fraction with 37% hexafluorosilicic acid for 7 days, followed by a wash with 10% HCl, to obtain the fine-grained quartz fraction. This material was then suspended in water and placed onto 10 mm diameter stainless steel cups to obtain a uniform layer of fine-grained quartz for measurement of equivalent dose.
Equivalent-dose (De) measurements on fine-grained quartz were made at the Max Planck Institute for Chemistry (Mainz) on an automated Risø TL-DA-20 reader with 90Sr/90Y beta source (Thomsen et al., 2006) and EMI 9235QA photomultiplier tube. We undertook optically stimulated luminescence (OSL) dating of fine-grained quartz on 20-24 aliquots for all samples using the Double-Single aliquot regenerative (DSAR) protocol (Banerjee et al., 2001; Jain et al., 2005; Supplementary Table SM-2). All pIR290 De-measurements were conducted on a Riso TL/OSL DA-20 automated reader at the Max Planck Institute for Evolutionary Anthropology (Leipzig). The feldspar-signal stimulation was delivered with IR light-emitting diodes transmitting at 870 nm (145 mW/cm2) and a Schott BG-39 and Corning 7-59 filter combination was used to detect in the blue-violet wavelength region. For beta-irradiation a calibrated 90Sr/90Y beta source with a dose-rate of ∼0.12 Gy/s was used. We describe the measurement protocols in more detail and provide data from the preliminary tests and quality controls of the DSAR protocol in the Supplementary Material SM-2).
Studies on the saturation behavior of fine-grained quartz suggest that this grain-size fraction does not saturate at high doses under laboratory conditions, and therefore tends to underestimate the true depositional age of samples beyond c. 60 ka (Timar-Gabor et al., 2017; Dave et al., 2023a). Therefore, for such samples we additionally measured the De for fine-grained polymineral aliquots using the elevated temperature post-Infrared-Infrared-Stimulated-Luminescence (pIRIR) signal, to circumvent the issue of anomalous fading (Thiel et al., 2011). Additional information on these measurements are provided in the Supplementary Material.
We evaluated the dose rates for the fine-grained quartz and polymineral samples from radionuclide concentrations of U, Th and 4 K, determined using high resolution germanium gamma spectrometry performed at the Felsenkeller, VKTA in Dresden, Germany, converted into beta and gamma dose rates using published rates (Guérin et al., 2011). Dose-rate attenuation by moisture was assumed to be 10% ± 5% for all samples following published average water content values for Central Asian loess (Fitzsimmons et al., 2017; 2018; Dave et al., 2023a). An alpha efficiency value of 0.038 ± 0.002 for fine-grained quartz and 0.086 ± 0.004 for polymineral fine grains was used for all dose rate calculations (Rees-Jones, 1995). The cosmic-ray dose rate contribution was calculated from published formulae (Prescott and Hutton, 1994). A detailed account of the luminescence dating protocols can be found in the Supplementary Material SM-2.
3 Results
The Karamaidan stratigraphic sequence and magnetic susceptibility (Section 3.1), elemental geochemistry (Section 3.2) and luminescence chronology (Section 3.4) results are summarized in Figure 2.
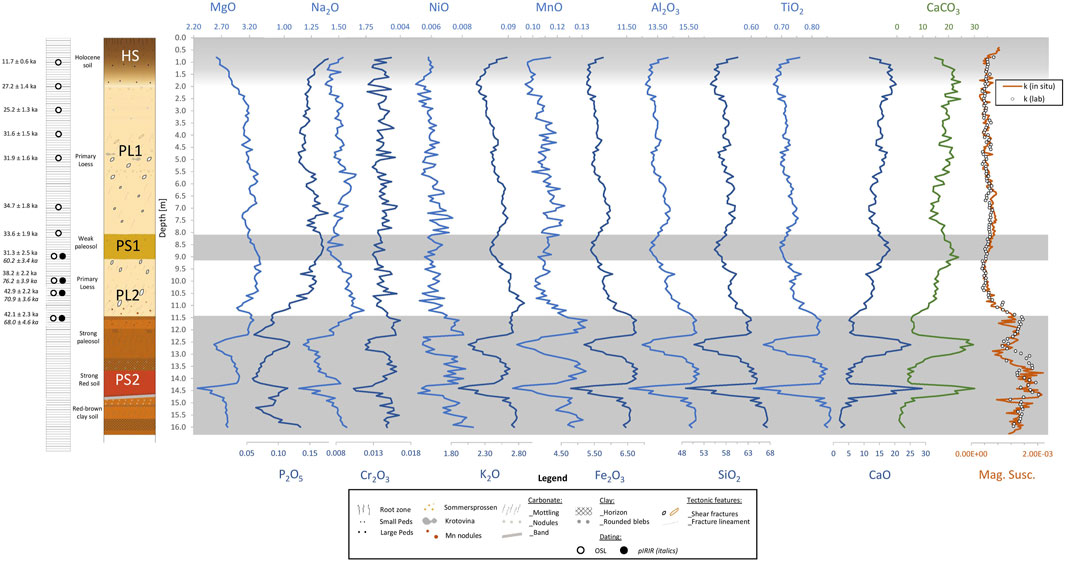
FIGURE 2. Overview of the Karamaidan Section 1 profile data. The stratigraphic log, oxide geochemistry curves (percentage), and magnetic susceptibility are shown relative to depth; luminescence ages (quartz OSL in black circles/plain text; polymineral pIRIR in black dots/italics) are provided on the left.
The stratigraphy of the Karamaidan section can be divided into five major units (Figure 2). The uppermost unit (Holocene Soil, HS; includes the modern soil) is 1.95 m thick and consists of greyish bioturbated loess. From 1.95 to 8.00 m depth, we observe a beige-yellow primary loess unit (PL1) containing carbonate mottling and sub-millimeter air bubbles indicative of relatively high accumulation rates. This unit also contains krotovina at 4.80–4.85 m and 5.10 m depth, as well as frequent shear fractures in the depth range 4.90–5.85 m; the latter may indicate seismic activity at the time of deposition. From 8.00 to 9.15 m we observe a weakly developed palaeosol (PS1), identifiable through a distinct color change due to the enrichment of Fe-oxides and pedogenic carbonate nodules (1–2 mm in diameter). The presence of sub-millimeter air bubbles throughout this weak soil suggests it to have undergone pedogenesis while the sediments were rapidly accumulating. The fourth unit (PL2) spans the 9.15–11.45 m depth interval and is a primary loess with minor carbonate mottling. A well-developed paleosol complex (PS2) occurs below 11.45 m depth and is characterized by a marked change in coloration, extensive carbonate mottling, and generally finer grained sediment, possibly including clay. We observe a strongly rubified subhorizon within PS2 from 13.75–14.75 m depth.
3.1 Magnetic susceptibility
Our magnetic susceptibility (k) results are illustrated in Figure 2. In situ measurements, which were made at 5 cm resolution, are shown as a solid red-brown line. Lab-measured k values, measured at 10 cm resolution, are provided as white dots. We observe substantial overlap of field and lab-derived k-values in the upper part of the profile and a divergence in values below 11.45 m in pedocomplex PS2. Laboratory values are slightly higher than field measurements, particularly in the depth range 12.90–13.60 m. The increase in k-values measured in the field is inversely correlated with carbonate content. Since the in situ measurements were made at higher resolution, all subsequent reference to magnetic susceptibility values derives from this dataset.
We observe a slight decrease in k-values in the HS down to PL1 at 2.0 m. This likely reflects an increase in recent oxidation and weathering which increases magnetic susceptibility; values decrease into the zone of calcareous enrichment below 80 cm depth. Magnetic susceptibility remains relatively constant within PL1 down to 11.45 m; we observe no appreciable change in k-values within the weakly developed paleosol PS1. We notice a decreasing trend of carbonate content within the sediments from 1.30 m down to 7.50 m, which is not reflected by k values. Magnetic susceptibility intensifies approximately 50 cm above the strong palaeosol contact as observed by eye at 11.45 m, which corresponds to a carbonate-poor layer. Susceptibility then decreases down to c. 13.00 m to k-values like those of primary loess. K-values increase from 13.0 to 13.75 m and likely correlate with the clay enrichment observed at this depth. Magnetic susceptibility remains high down to 14.70 m, with peak k-values occurring at the same depth as clayey horizons at 14.70 and 15.10 m. Below 14.70 m, k-values decrease to intermediate values, corresponding, according to field observations, to a horizon containing less clay and iron oxides than the one immediately above it.
3.2 Elemental geochemistry
Volatile components such as water and carbon dioxide are found in Karamaidan loess sediments in the form of carbonates, organic matter, and hydrated mineralogical phases (e.g., clays). The presence of calcium carbonate is particularly interesting when studying the weathering of loess since it is typically enriched within the lower “C” horizons of semi-arid palaeosols (Sprafke and Obreht, 2016). In this study, we measure element oxides (XRF), LOI and CaCO3 (gasometry) and from these we calculate CaO (calcite-bound), and CaO* (silicate-bound) stoichiometrically. Table 2 summarizes these results (see SM-1 for the complete dataset).
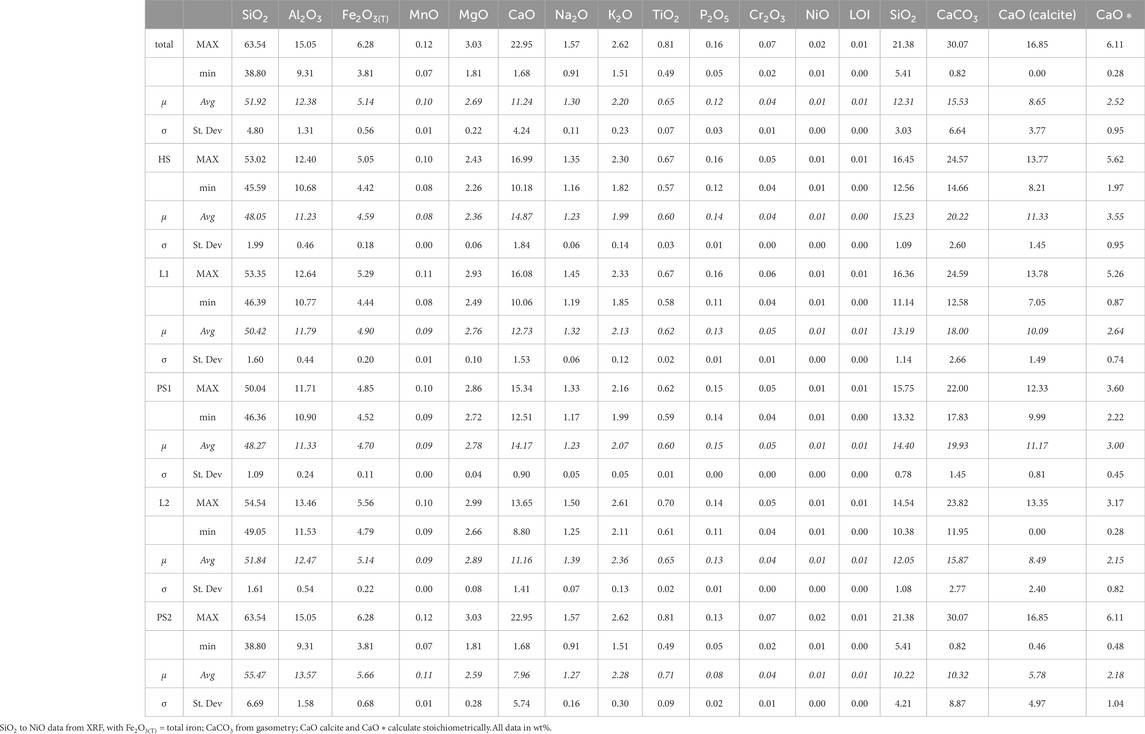
TABLE 2. Overview of the geochemical data generated from the XRF, LOI and gasometric analyses.
Our measurements of LOI indicate an average value (μ) of 12.31 ± 3.03 wt%. The highest LOI values, reaching up to 21.38 wt%, are found within the PS2 pedocomplex at a depth of 12.20–13.40 m. We also observe LOI values up to 16.45 wt% in the transitional area between HS and PL1, spanning approximately 0.80–2.50 m. The maximum LOI values decrease in the following order: PS2>HS>PL1>PS1>PL2. Conversely, the lowest LOI values are found in PS2 (5.41 wt%) and increase in the following order: PS2<PL2<PL1<HS<PS1. This highlights the variability of LOI within the pedocomplex PS2 (see Figure 3).
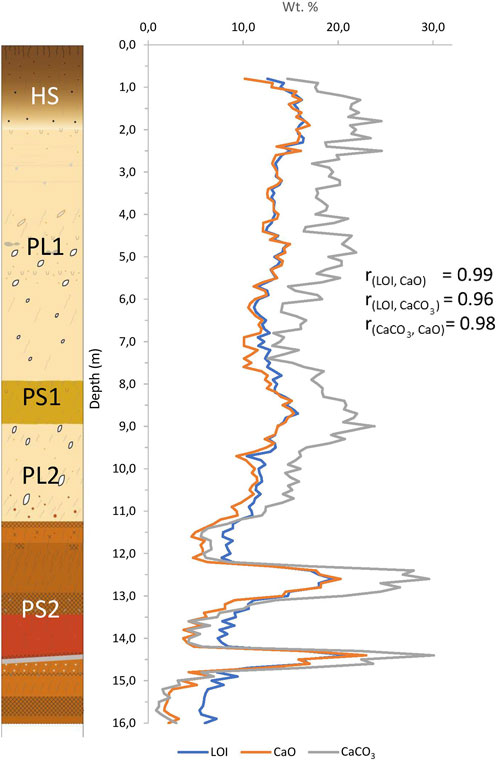
FIGURE 3. Overview of loss on ignition (LOI), CaO and calcium carbonate values trends down the Karamaidan profile.
Curves with similar trends are found in the results for the element oxides (Figure 2). The suggested concentrations of element oxides, obtained using XRF, also display variability between the primary loess and paleosol subhorizons. The average measured carbonate content (μCaCO3) at Karamaidan is 15.53 ± 6.64 wt%. The highest and lowest values of μCaCO3 are both found within the PS2 pedocomplex, measuring 0.07 and 0.82 wt% respectively. PS2 exhibits the highest average values for most element oxides, while HS has the lowest values, although there are some exceptions. For example.
• μMgO is highest in PL2 (>PS1>PL1) and lowest in HS (2.89 ± 0.08 and 2.36 ± 0.06 wt% resp. ly);
• μCaO follows the order HS>PS1>PL1>PL2>PS2 (ranging from 14.87 ± 1.84 to 7.96 ± 5.74 wt%);
• μNa2O follows the order PL2>PL1>PS2>PS1>HS (ranging from 1.39 ± 0.07 to 1.23 ± 0.06 wt%);
• μK2O follows the order PL2>PS2>PL1>PS1>HS (ranging from 2.36 ± 0.13 to 1.99 ± 0.14 wt%);
• μP2O5 follows the order PS1>HS>PL2>PL1>PS2 (ranging from 0.15 ± 0.00 to 0.14 ± 0.01 wt%).
When compared with the Global Average Loess values (GAL (Újvári et al., 2008)), the samples from Karamaidan exhibit lower SiO2 values (51.92 ± 4.80 vs. 70.71 wt%, a decrease of approximately 27%) and higher CaO values (11.24 ± 4.24 vs. 6.67 wt%, an increase of approximately 68%). The values of Al2O3 (12.38 ± 1.31 wt%), Fe2O3(T) (5.84 ± 0.46 wt%), MnO (0.10 ± 0.01 wt%), and MgO (2.69 ± 0.22 wt%) are above the GAL values. Na2O (1.30 ± 0.11 wt%) is approximately 23% below the GAL values, while K2O (2.20 ± 0.23 wt%) and TiO2 (0.65 ± 0.07 wt%) are slightly below average (a decrease of around 1%–18%). In general, the soils (Holocene + paleosols) at Karamaidan exhibit higher values of SiO2 (53.20 vs. 50.80 wt%), Al2O3 (12.86 vs. 11.97 wt%), and Fe2O3(T) (5.34 vs. 4.96 wt%), and lower values of MgO (2.58 vs. 2.79 wt%), Na2O (1.26 vs. 1.34 wt%), and CaO (10.00 vs. 12.31 wt%) (SM-1).
The results of our chemical analysis are summarized in bivariate x/y diagrams (Harker, 1909) (Figure 4A–F) in order to visualize compositional changes related to weathering and pedogenesis (e.g., Újvári et al., 2008; Schatz et al., 2015). The Al2O3/SiO2 diagram shows a positive linear relationship between the two components irrespective of stratigraphic unit (Figure 4A). Samples from the Holocene/recent and weakly developed soils (HS and PS1) cluster in the same region as the primary loess (PL1 and PL2), with the latter trending slightly towards PS2. Samples from the strongly developed soil pedocomplex PS2 yield a wider range of values and generally lower SiO2 values than the other units as aluminum content increases. Similar trends and relationships are observed in the Fe2O3(T)/TiO2 and TiO2/SiO2 diagrams (Figures 4C, D). The Karamaidan samples, and particularly those from PS2, generally yield lower SiO2 but higher Al2O3 values than GAL with values closer to those of the Upper Continental Crust (UCC). Both iron oxide and titanium oxide values are generally higher at Karamaidan than both GAL and UCC.
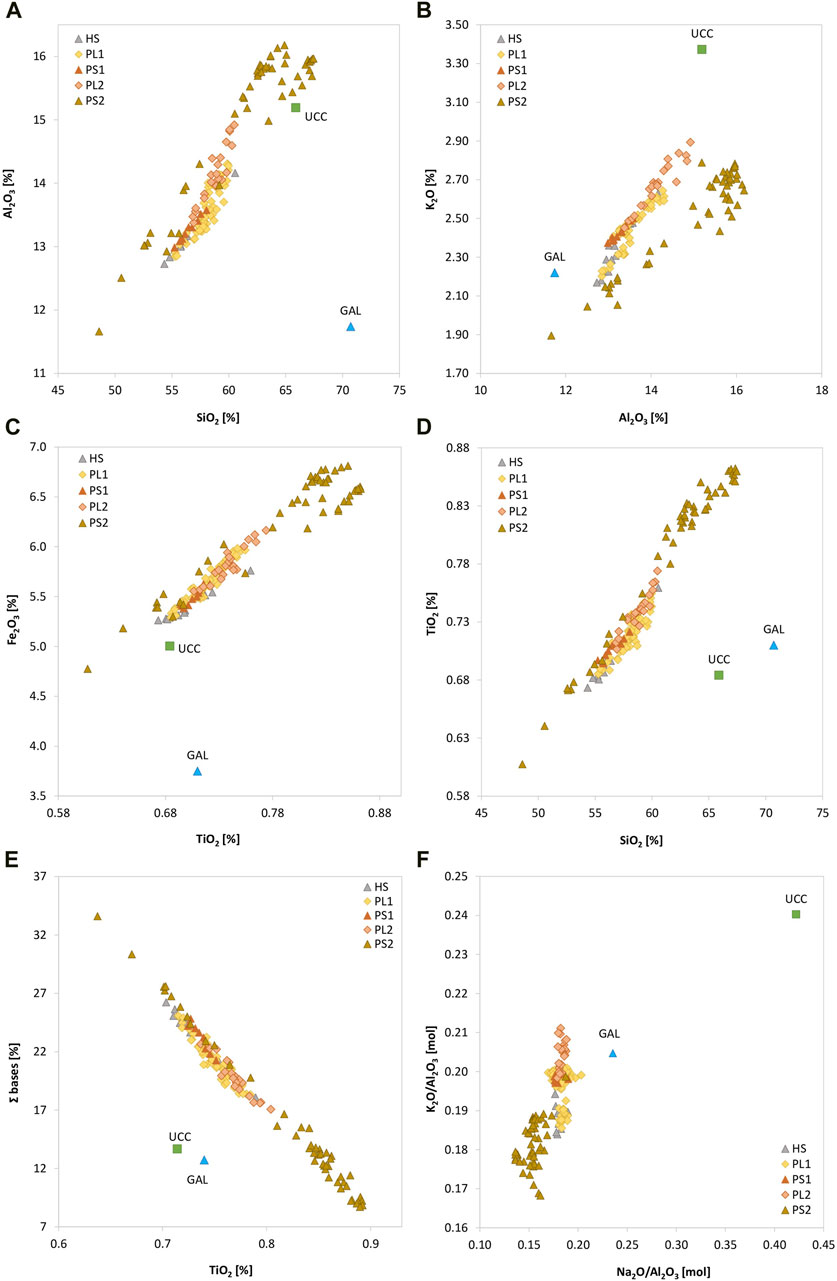
FIGURE 4. Elemental plots based on the XRF elemental geochemistry: (A) Al2O3 vs. SiO2 [wt%]; (B) K2O vs. Al2O3; (C) Fe2O3(T) vs. TiO2 [wt%]; (D) TiO2 vs. SiO2; (E) Σbases vs. TiO2 [wt%]; (F) K2O/Al2O3 vs. Na2O/Al2O3 [mol]. Results are color-coded according to stratigraphy. The compositions of the upper continental crust (UCC, Taylor and McLennan, 1995) and average loess deposits (GAL, Újvári et al., 2008) are provided for comparison.
Basic elements (Σbases = Ca+Mg+Na+K) are displayed in Figure 4E and indicate an inverse linear relationship with TiO2. The PS2 pedocomplex is more depleted in the bases than the other stratigraphic units and yields similar or slightly lower values than both UCC and GAL. By contrast, the graph K2O/Al2O3 (Figure 4B) indicates a positive linear relationship but two distinct trends, one for the primary loess and more weakly developed soils (HS, PL1, PS1, and PL2), and another for the PS2 pedocomplex. This trend is even clearer in the K2O/Al2O3 vs. Na2O/Al2O3. plot (Figure 4F) in which PS2 samples result in lower ratios values than HS, PL1, PS1, and PL2.
3.3 Weathering
In Figure 5 we plot the 12 selected WIs calculated from our XRF data. We calculated Pearson correlation coefficients (r) for the different WIs (Table 3), and for WIs vs. Magnetic Susceptibility (Table 4). Certain weathering indices (WIs) exhibit contrasting calculation methods, whereby a higher weathering intensity corresponds to a lower numerical value, while others follow the opposite pattern (Table 4). In general, we notice consistent patterns across the WI plots. However, there are two indices, CPA, and FENG, that show lower correlation values (r < 0.72). Interestingly, all WIs reach their highest points of weathering intensity within the PS2 pedocomplex. Additionally, the zones of carbonate enrichment show a decrease in weathering intensity. It is also worth noting that there is no increase in weathering intensity within the weakly developed soil PS1 for any of the WIs calculated. Magnetic susceptibility likewise increases only in PS2 and HS, and not in PS1.
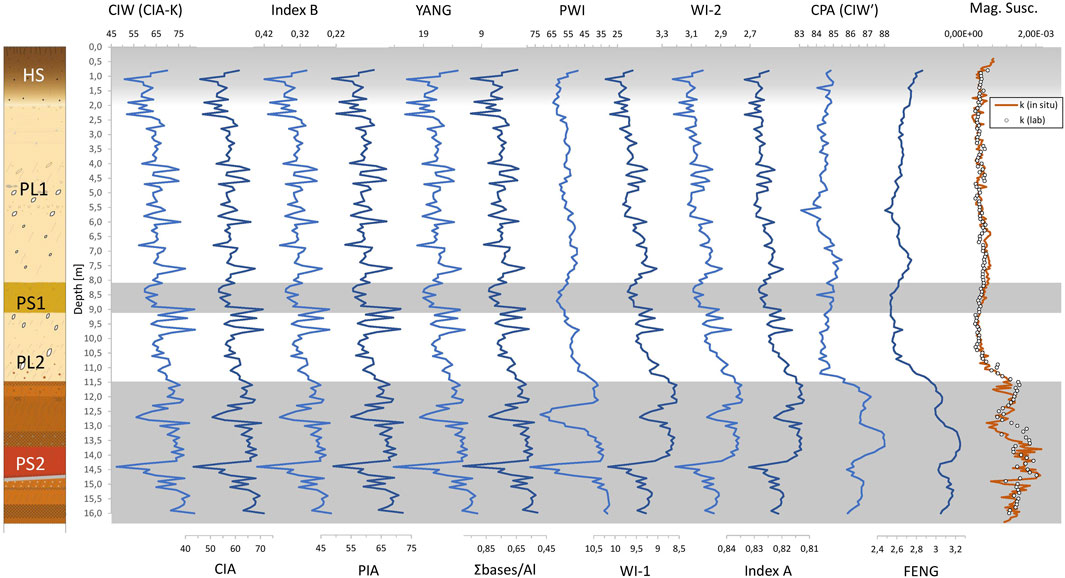
FIGURE 5. Overview of all calculated WIs with depth, shown in relation to stratigraphy and magnetic susceptibility. Palaeosols are highlighted in light gray (0–0.8 m; 7.9–8.9 m; 11.1–16.2 m). We present all plots as indicating an increase in weathering to the right.
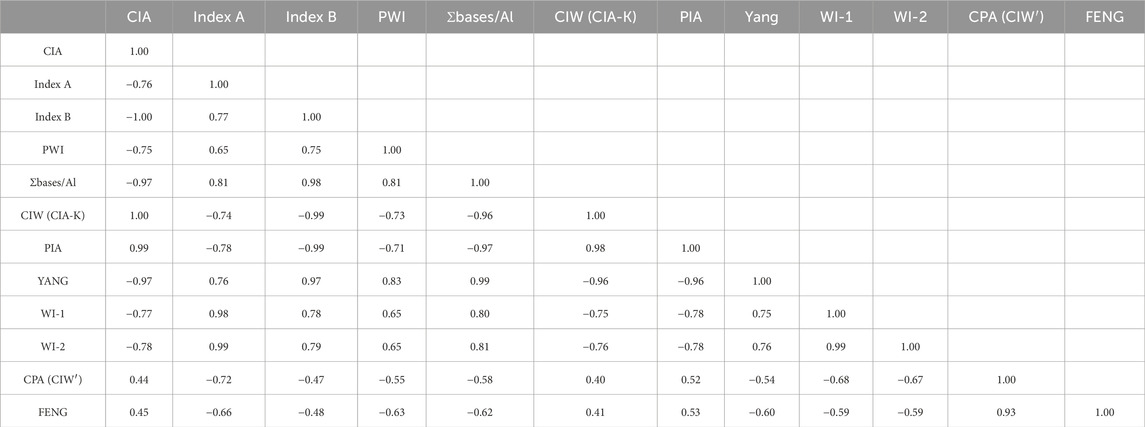
TABLE 3. Pearson’s correlation coefficients among the WIs.
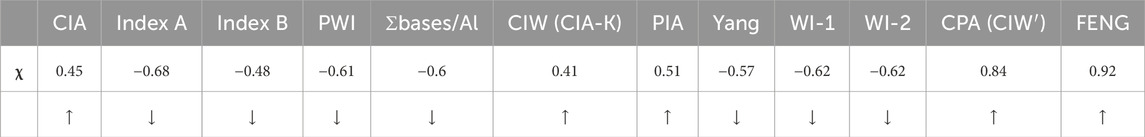
TABLE 4. Pearson’s correlation coefficients of WIs vs. magnetic susceptibility. Arrows indicate increased weathering intensity with ↑ increasing or ↓ decreasing values.
3.4 Luminescence chronology
The results of the equivalent dose measurements, dose rate and resulting luminescence ages from fine-grained quartz and polyminerals are presented in Table 5. The combined quartz OSL–polymineral pIRIR luminescence chronology is illustrated against depth and stratigraphy in Figure 2 and compared against other published sites in Figure 6. Our quartz OSL chronology indicates ages between c. 11 to 35 ka within the depth range 1–8 m. Below 8 m, our preliminary pIRIR ages suggest ages exceeding 60 ka. Of the 12 samples dated using luminescence, eight from the top 8 m were dated using fine grained quartz. The quartz OSL signals in these samples exhibit a fast exponential decay suitable for dating. Below 8 m depth, we observe saturation of the fine-grain quartz signal (See Supplementary Material S2 and Table 5 for more details) consistent with fine-grained loessic quartz of this age elsewhere (Timar-Gabor et al., 2017).
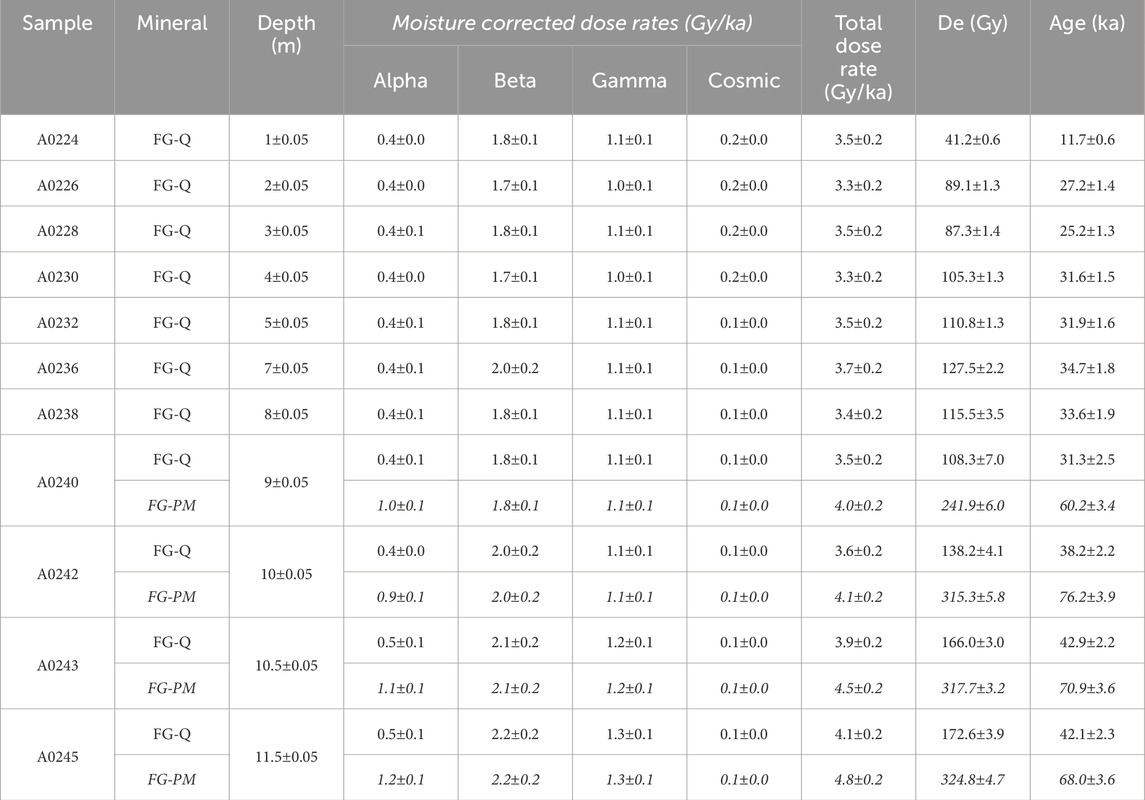
TABLE 5. Equivalent dose (De), dose rate data and age estimates for the site of Karamaidan. The data for the upper 8 m is based on OSL ages on fine-grain quartz. Beyond 8 m we present both OSL ages on fine-grain quartz and post-IRIRSL290 ages on polyminerals for each sample. Ages used for the final interpretation are underlined. Age uncertainties are given as 1σ.
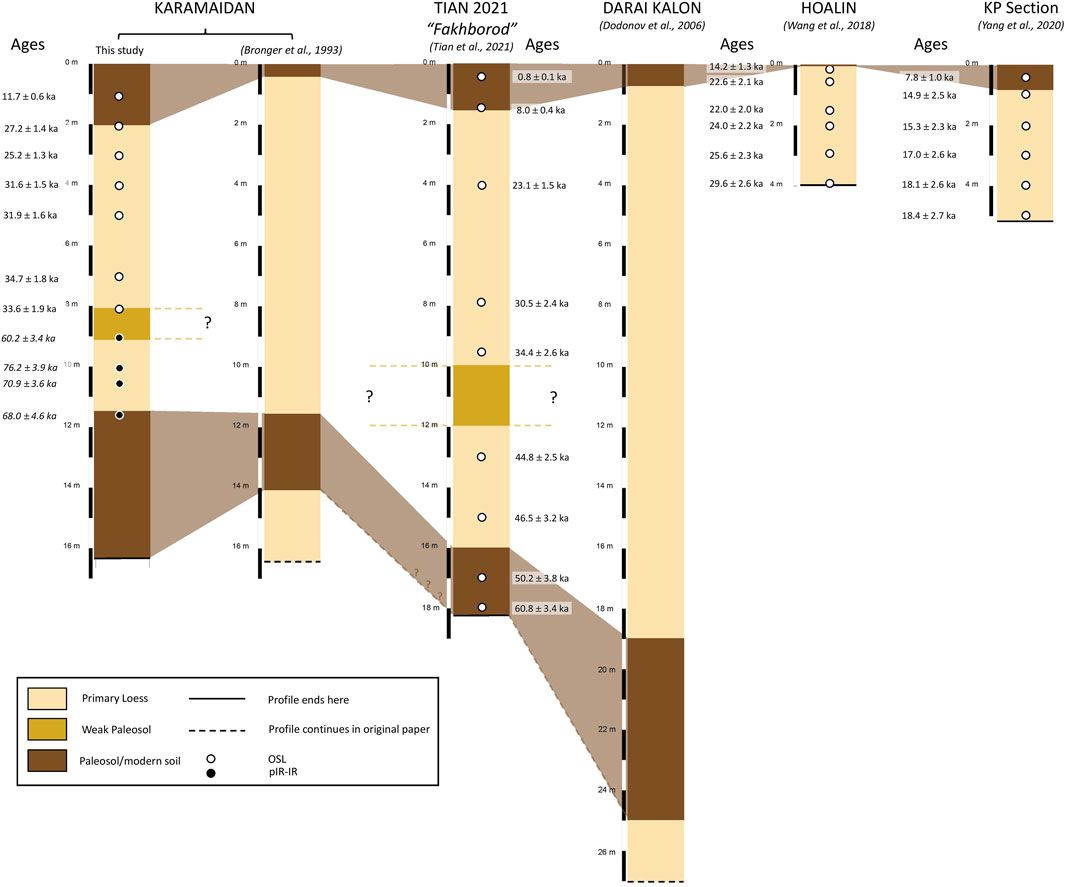
FIGURE 6. Stratigraphic comparison of Karamaidan profile with literature data from Karamaidan (Bronger et al., 1995; Tian et al., 2021 “Fakhrobod” (Tian et al., 2021), and Darai Kalon (Dodonov et al., 2006). Luminescence ages (quartz OSL in plain text; polymineral pIRIR in italics) are provided on the left.
We measured the pIRIR signal from polymineral fine-grain to determine the depositional age for samples from below 8 m depth. Investigations of the elevated-temperature pIRIR protocol on feldspar yield low fading rates (Buylaert et al., 2008; Thomsen et al., 2008; Thiel et al., 2011). We argue that since our samples were obtained from aeolian deposits which experienced ample exposure to sunlight prior to burial, that our samples are well bleached and therefore that residual signal should be negligible in our samples. We observe significant uncertainties in our pIRIR ages, particularly for the samples at 10 and 11 m depth. The cause for such large uncertainties remains unknown and further tests are required to identify the likely cause of such uncertainties and reliability of the ages. These tests are ongoing and beyond the scope of this study; we herewith consider our pIRIR chronology as a preliminary framework only.
4 Discussion
4.1 Considerations of loess stratigraphy in the Tajik Depression
There is an increasing balance of evidence indicating spatial variability in loess stratigraphy relating to spatial differences in accumulation rates and palaeo-topography, particularly in piedmont regions (e.g., Fitzsimmons, 2017; Dave et al., 2023a), although in aggregate it may still be possible to make regional correlations and identify “representative” type sections (e.g., Marković et al., 2015a). Even over scales of tens to hundreds of meters, variability in stratigraphy may be observed (e.g., Fitzsimmons et al., 2013; Fenn et al., 2021). Furthermore, although the thick loess sequences exposed in the Tajik Depression have long been recognized for their potential as archives down to at least the Brunhes-Matuyama boundary (e.g., Dodonov et al., 2006; Yang et al., 2006, Jia et al., 2018; Dodonov et al., 2006, Lü et al., 2020), few sections have been investigated in high resolution and with robust dating over the last full glacial cycle. It is therefore relevant to place the last full glacial cycle stratigraphy of the Karamaidan LPS in the context of previous studies and other sites in the Tajik Depression before proceeding with our interrogation of indications of weathering intensity through time.
In Figure 6 we compare and correlate our (chrono-)stratigraphy at Karamaidan with published work for the last full glacial cycle. The stratigraphy of the Karamaidan LPS which has previously been described (Dodonov, 1991; Bronger et al., 1995) was investigated on a part of the section c. 450 m north of where we worked. We note that the weakly developed paleosol observed in our study (PS1) was not noted by Bronger et al. (1995), and the HS is much thinner at the northern locality, although the depth of the strong PS2 paleosol is similar between the two sites. Nearby sites with published stratigraphy and/or chronologies spanning the last full glacial cycle include Darai Kalon, c. 73 km southeast of Karamaidan (Dodonov et al., 2006), Tian 2021-Fakhrobod, c. 55 km SW of Karamaidan (Tian et al., 2021), KP, c. 27 km west of Karamaidan (Yang et al., 2006) and Hoalin, c. 63 km south east of Karamaidan (chronology but not stratigraphy available: Wang et al., 2016). Apart from Hoalin, where no stratigraphic description is published, and KP, where only 5 m was exposed and no subsurface paleosol was identified, all studies describe a strongly developed pedocomplex comparable with our PS2, at upper depths varying from 11.50 m (Bronger et al., 1995), c. 18.50 m (Dodonov et al., 2006), and c. 16 m (Tien et al., 2021). Our weak paleosol (PS1) is reported only by Tian et al. (2021), at a slightly deeper depth than at Karamaidan. Our identification of PS1 is based on field observations of change in coloration, supported by geochemistry (an increase in CaCO3 and decrease in SiO2, Al2O3, K2O, Na2O, Fe2O3(T), TiO2; Figure 3) although it is not distinguishable by magnetic analyses. The presence of a weakly developed and barely distinguishable paleosol at some but not all localities in the Tajik Depression suggests potential factors such as regionally discontinuous pedogenesis or accumulation, subtle amelioration of climatic conditions influencing weathering and pedogenesis, or variations in the level of detail in observations at specific sites.
4.2 Weathering at Karamaidan and an assessment of appropriate weathering indices
There are multiple ways to assess the degree of rock and sediment weathering, some of which have been successfully applied to LPS. In Figure 4 we investigate compositional changes due to pedogenesis using Harcker diagrams. In Figure 4 a, c and e, we observe the relative enrichment of both Al and Fe during pedogenesis (e.g., Schatz et al., 2015), whereby alkali and alkaline-earth metals such as Na, K, Ca and Mg (Σbases) are mobilized through the breakdown of feldspars. The depletion of alkali metals can be seen most clearly in Figure 4F, which shows the mobilization of more labile components, typically derived from plagioclase and K-feldspar, with increasing chemical weathering. In Figure 4, it is evident that the Karamaidan samples exhibit a decrease in K and Na concentrations when compared to UCC TiO2. Additionally, the higher concentrations of Al2O3 and Fe2O3(T) observed at Karamaidan indicate a more pronounced weathering intensity in the Tajik samples when compared to the Tokaj and Tian-Fakhborod sites included in our comparative analysis. In Figure 7B we observe distinctions in K content between loess and paleosol sediments for both Tokaj and Karamaidan in the K2O/Al2O3, plot. By contrast there is a greater similarity between loess and paleosol chemistry at Tian-Fakhrobod, which may suggest weaker weathering and pedogenesis at that site.
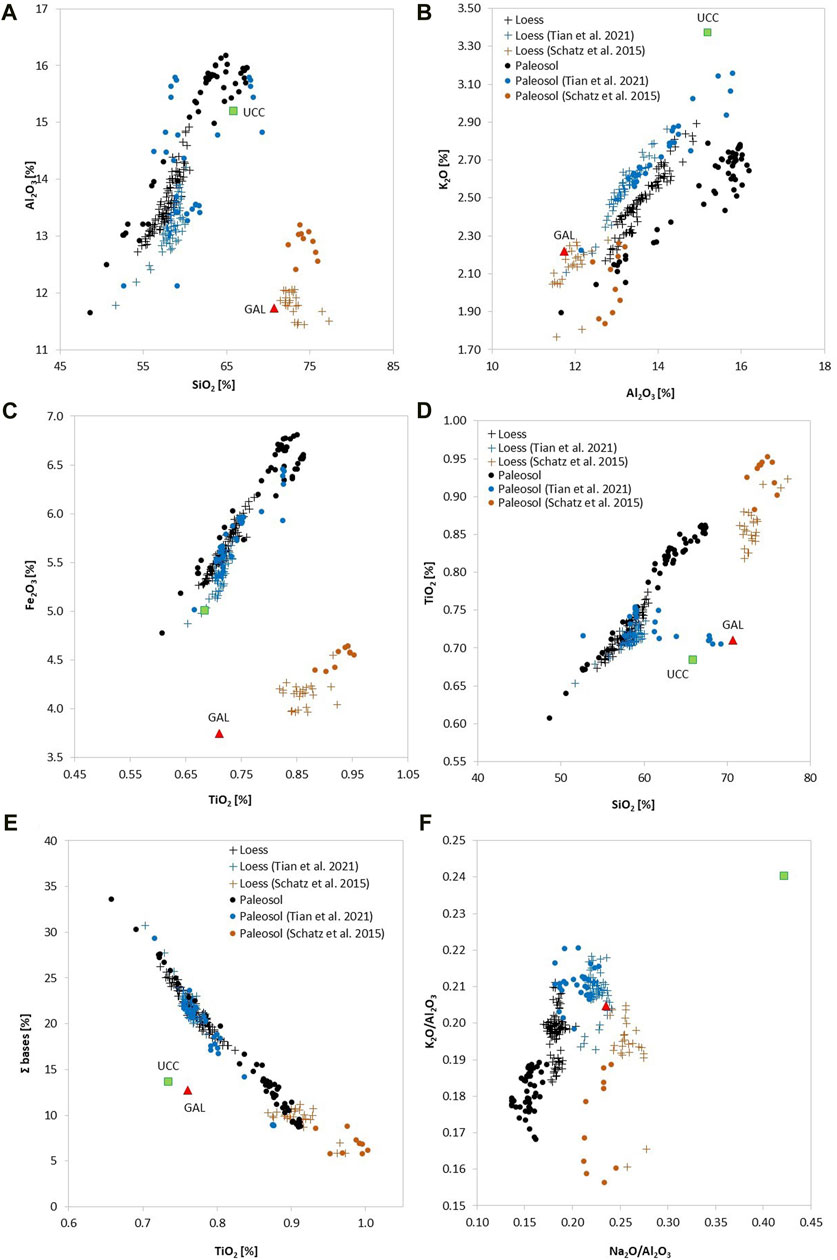
FIGURE 7. Elemental plots based on the XRF elemental geochemistry, comparison of Karamaidan with “Tian 2021” profile of Fakhrobod, and Tokaj (Schatz et al., 2015): (A) Al2O3 vs. SiO2 [wt%]; (B) K2O vs. Al2O3; (C) Fe2O3(T) vs. TiO2 [wt%]; (D) TiO2 vs. SiO2; (E) Σbases vs. TiO2 [wt%]; (F) K2O/Al2O3 vs. Na2O/Al2O3 [mol]. Results are color-coded according to stratigraphy and locality. The compositions of the upper continental crust (UCC, Taylor and McLennan, 1995) and average loess deposits (GAL, Újvári et al., 2008) are provided for comparison.
The degree of chemical weathering is additionally illustrated using a ternary A-CN-K diagram (A=Al2O3, CN=CaO* + Na2O, K=K2O, Figure 8A), (Nesbitt and Young, 1984). Plotted against the Post-Archaean Shale (PAAS, Taylor and McLennan, 1995)–the reference composition for weathered continental sediments–the Karamaidan sediments are clearly less weathered. Our samples trend almost parallel to the A-CN line, which follows the meteoric alteration trend of plagioclase (Nesbitt and Young, 1984), irrespective of loess or paleosol attribution. Our data reflect progressive Al enrichment and reduction of Ca and Na with increasing weathering intensity. Interestingly the Karamaidan samples terminate below UCC values, unlike other LPS where values lie between UCC and PAAS; this could be related to compositional variations due to the heterogeneity of the source material and will be addressed in future studies. In Figure 8B, the A-CNK-FM diagram (A=Al2O3, CNK= CaO* + Na2O+ K2O, FM = Fe2O3(T) + MgO) includes the mafic mineral component of the system (Nesbitt and Young, 1989), and suggests that samples from the PS2 pedocomplex are depleted in Fe and Mg compared with the primary loess (PL1 and PL2) and PS1. The less well-developed HS soil lies midway between the two series and may support the hypothesis that PS1 represents an early or very weak stage of pedogenesis.
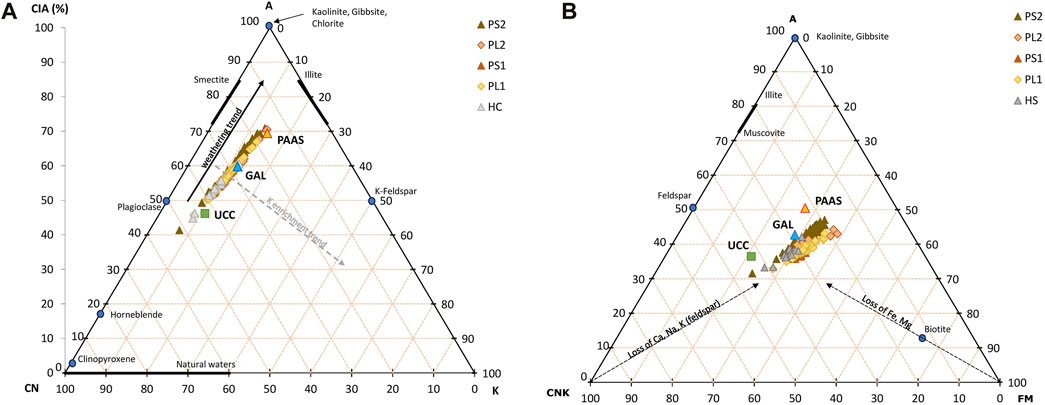
FIGURE 8. A-CN-K and A-CNK-FM ternary diagrams (in molar proportions) of Karamaidan samples. HS: Holocene/recent soil, PL1: Primary loess, PS1: Weak paleosol, PS2: Primary loess, PS2: Pedocomplex. Upper continental crustal (UCC, Taylor and Mclennan, 1985), average loess (GAL, Ujvari et al., 2008), and post-Archean Australian shale (PAAS, Taylor and Mclennan, 1985) values are also shown for comparison.
When we review the WI comparison (Figure 5) we observe that all 12 WIs indicate an increase weathering degree in the pedocomplex PS2, first noticeable c. 50 cm above the paleosol contact. This trend agrees with the χ variation, with reduced magnetic susceptibility in more highly calcareous layers. We observe a series of weathering “spikes” in the meter below the weakly developed PS1, in the WIs which are calculated using CaO*. The WIs correlating closely with each other (Tables 3, 4), except for the FENG and CPA indices, although these two correlate well with each other. Consequently, most of the WIs are interchangeable in any assessment of weathering intensity at Karamaidan.
As suggested by Schatz et al. (2015), we compare and correlate different weathering indices with a direct weathering proxy to determine the most sensitive index for variations in weathering intensity. While both low field magnetic susceptibility (χ) and grain size distribution are commonly used as indicators of weathering intensity (e.g., Marković et al., 2008; Buggle et al., 2009; Terhorst et al., 2014; Schatz et al., 2015), only magnetic susceptibility can be directly linked to weathering (e.g., Forster and Heller, 1997) and has been used in this study to evaluate the weathering indices (Table 4). We find that the FENG (r = 0.92) and CPA (r = 0.84) WIs provide the best correlation with magnetic susceptibility at Karamaidan. This result echoes that found by Schatz et al. (2015) for the Tokaj section in Hungary, and therefore we consider first FENG, then CPA, as the most appropriate WI for our site.
The FENG index suggests that zones of lower values, which are generally richer in carbonates, indicate areas that have undergone a less leaching, or accumulation of carbonates leached from overlying sediment. Higher FENG values correspond to more intensely leached sediment which contain less carbonate (Feng, 1997). At Karamaidan, FENG values decrease downwards from the HS soil to the primary loess unit PL1. The lowest values occur within PL1 (c. 5.5 m). The highest FENG weathering intensity occurs just above PS1 (at c. 7 m) and in PS2 (at c. 12 m, 13.6 m, and 15 m), in zones of carbonate leaching (Figure 2).
4.3 Investigation of quantitative palaeoclimate parameters based on WI-derived transfer functions
One of the major ambitions of Quaternary science is the quantitative reconstruction of palaeoclimate parameters. This is certainly the case in investigations of loess; only recently have tools become available to achieve this end, in the form of organic biomarker geochemistry (Peterse et al., 2014; Schreuder et al., 2016), clumped isotopes in pedogenic carbonates (Újvári et al., 2019; Prud’homme et al., 2021), stable isotope geochemistry from earthworm calcite granules (Prudhomme et al., 2021; Prud’homme et al., 2018), and D47 composition of mollusk shells as a quantitative temperature proxy (Újvári et al., 2021). A less tested approach for loess sediments is the use of transfer functions based on elemental WIs. Such transfer functions require calibration to regional conditions and are widely used in palaeoclimate reconstruction in soils outside of the loess realm (Jiamao et al., 1996; Sheldon et al., 2002; Maher et al., 2003; Retallack, 2005; 2009; Sheldon, 2006; Nordt et al., 2007; Sheldon and Tabor, 2009; Gallagher and Sheldon, 2013; Wang et al., 2013). However, the application of WI-derived transfer functions to loess sediments has been met with skepticism since algorithms are based on soil weathering indices that are fundamentally affected by the complex interplay between soil, climate, biota, parent material chemistry and time, and which are poorly understood (Ujvari, 2014). Early attempts to make use of these transfer functions in loess made use of calibrations from regions far removed from the likely environment in which the loess accumulated (Schatz et al., 2015). More recently, however, Wang et al. (2023) developed new transfer functions for mean annual precipitation (MAP) and temperature (MAT) in loess derived from calibration datasets from the Chinese loess plateau and surrounding regions.
Here we investigate the applicability of the Wang et al. (2023) transfer functions to the Central Asian context, and compare these results against “global” MAP (Sheldon et al., 2002) and MAT (Sheldon, 2006; Gallagher and Sheldon, 2013) transfer functions, with respect to present day values (Figure 9). The present-day climate in the Karamaidan area, sitting above 1,600 m, is semi-arid to dry subhumid continental climate, with a notable temperature range, with warm summers and cold winters, and moderate precipitations. The average annual temperature of Karamaidan is approximately 10.8 °C (with a monthly minimum of −1.7 °C in January and maximum of 23.1 °C in July), and the mean annual precipitation is approximately 730 mm (with a monthly minimum of 3 mm in August and maximum of 143 mm in April) (Figure 9B).
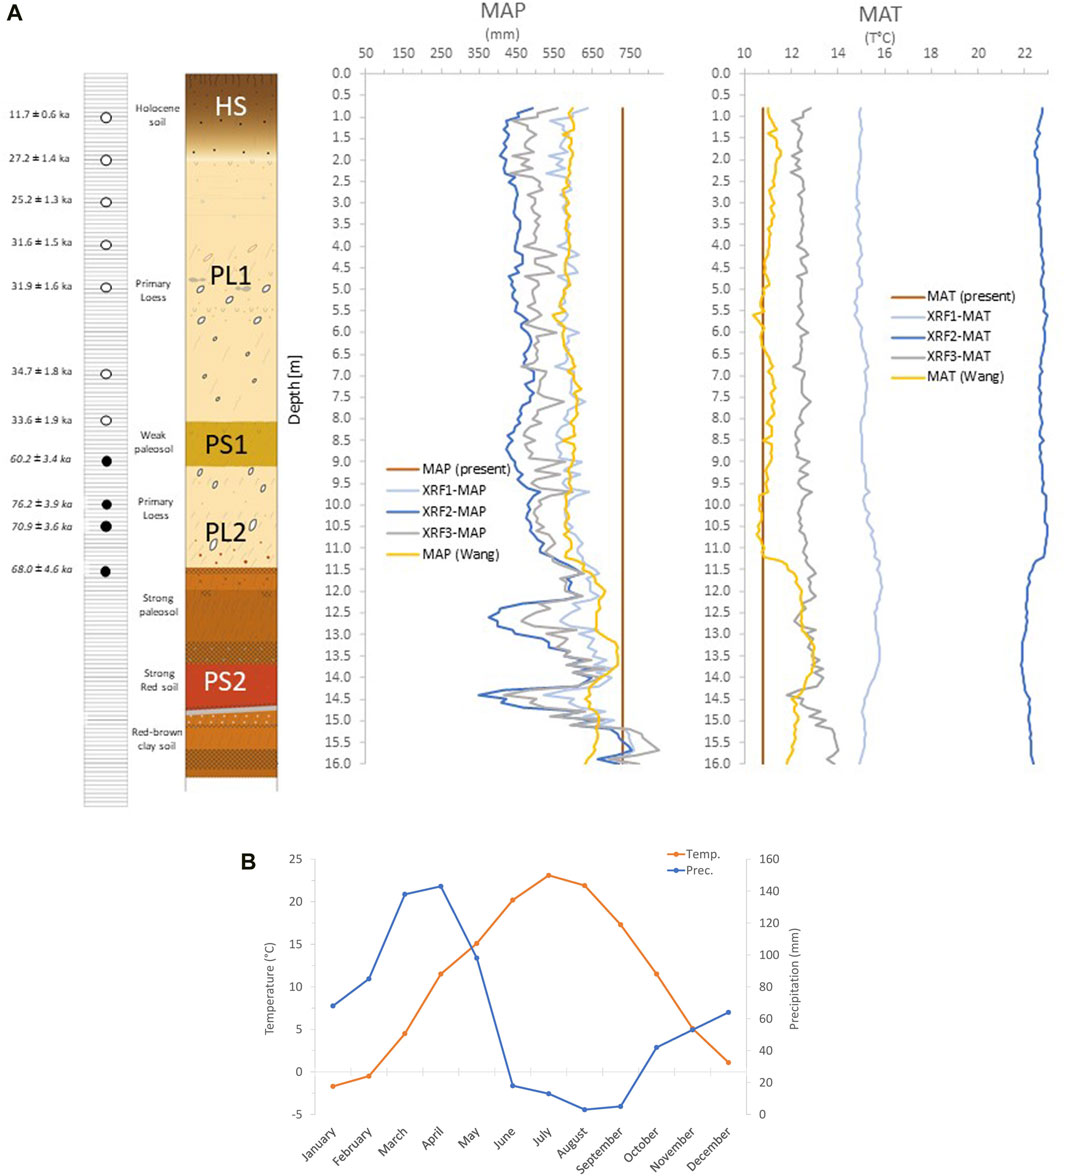
FIGURE 9. (A) Paleoclimatic evolution during the last glacial period vs. Stratigraphy obtained with applications of different MAP and MAT transfer functions (see text). (B) Today’s MAP and MAT of Karamaidan Area (WorldClim v.2).
In Figure 9 it is evident that the Sheldon (2006) MAP values correlate closely with one another (SM-3), whereas the Wang et al. (2023) reconstruction produces an entirely different trend. The latter shows less variation in the upper portion, down to a depth of c. 11 m with an average precipitation of c. 590 mm. At depths greater than 11 m, in PS2, the Wang transfer function shows a significant increase with an average of 665 mm (and a peak of c. 720 mm), without particularly reflecting fluctuations caused by stratigraphic variations, unlike the other MAP functions that suggest substantial fluctuations in rainfall in PS2, indicating variations from extremely less rainy periods (down to c. 350 mm) to extremely rainy periods (over 800 mm). This trend seems at odds with the stratigraphic, geochemical, and magnetic susceptibility results, which suggest a substantial and persistent increase in weathering during the PS2 pedogenic phase - presumably linked to higher precipitation - compared to other periods. Apart from the marked variations in PS2, the mean values calculated for the three Sheldon MAP functions show averages of c. 515 mm in the first 11 m depth and c. 611 mm in the lower portion (PS2 pedocomplex). Lower values then, but not far from those calculated with Wang. Today’s average annual rainfall values at Karamaidan are around 730 mm (Figure 9 a and b, WorldClim v.2 Data; Fick and Hijmans, 2017) and are generally higher than those calculated, indicating a possible gradual but distinct change in the rainfall regime during the LGM. As far as MAT is concerned, we can observe in Figure 9A a wide variation in absolute value of the calculated values with the different functions between the different curves, although each curve presents minimal variations in temperature in almost all cases. Greater variations in the calculated temperatures are recorded for almost all curves (Wang and XRF2-MAT, albeit with inverse trends to each other) at c. 11 m depth, suggesting a marked change in the local climatic regime. The mean temperature values according to Sheldon’s functions are generally higher (XRF1-MAT c. 15°C; XRF2-MAT c. 22°C; XRF3-MAT c. 12.5 °C) than those by the Wang’s function (c. 11°C). In general, XRF2-MAT shows higher temperature values up to 11 m and then shows slightly lower values in PS2 (average values go from 22.7°C to 22.1°C); while for the other functions they all show lower values in the upper portion of the profile and varying degrees of reduction in PS2. In particular, Wang shows in the upper portions of the profile, more recent, temperatures comparable to today’s for Karamaidan (10.8 °C present day MAT measured data vs. c. 11°C calculated according to Wang). This might suggest a higher reliability, at least for estimating MAT, of the values calculated using Wang’s function. Such a hypothesis seems confirmed considering that MAT according to Wang is obtained from the WI CPA, which we have already assessed as well suited to describe Karamaidan. Observing Wang’s MAT values for the lower portion of the PS2 profile we note an increase in temperatures with an average c. 12 °C in the loess and max. c. 13°C in the palaeosol, an increase consistent with the milder interglacial conditions already proposed by other authors (Bronger, Shackleton) as being responsible for the pedogenesis of this stratigraphic unit.
The Wang et al. transfer functions demonstrates a more realistic trend in precipitation and mean annual temperature in Central Asian loess-paleosol sequences compared to alternative transfer functions. This is supported by observed correlations with other lines of evidence, indicating its credibility in capturing relative changes in climate. However, it is important to acknowledge that the transfer function may not accurately estimate absolute present-day values in the study area. Discrepancies between the reconstructed values and actual climate data highlight potential limitations in absolute value estimation. These discrepancies may stem from various factors, including the complex interactions of climate, soil, biota, parent material chemistry, and time, which influence the algorithm’s weathering indices. Further scientific validation and investigation are necessary to assess the function’s broader applicability and its ability to provide accurate absolute values in other regions. Gathering robust data from diverse sources will be crucial to refine and validate the algorithm’s performance, enabling a comprehensive evaluation of its realism and suitability for broader usage in Central Asian loess-paleosol sequences.
4.4 Past weathering and climatic variability in western Central Asia over the last full glacial cycle
Our luminescence-based chronostratigraphy strongly suggests that at Karamaidan, the PS2 pedocomplex formed during the OIS 5 interglacial, the weak PS1 paleosol during the OIS3 interstadial, and the two primary loess units accumulated during the cold OIS2 and OIS4 stadials. Our WI results indicate a higher degree of weathering responsible for developing the PS2 pedocomplex, which we can now confirm as representing the OIS5 interglacial phase. Finally, our quantitative reconstruction of palaeoclimate parameters MAP and MAT, based on the loess-relevant Wang et al. transfer functions derived from the CPA index which we have established is suitable to the Karamaidan context, gives us the first insight into past climate conditions through time in the Tajik Depression.
Based on the OSL dating and the results of the WIs and soil paleoclimate transfer functions, the PS2 pedocomplex at Karamaidan likely developed during OIS 5. This pedocomplex exhibited higher mean temperatures (approximately 13°C), but lower precipitation (665 mm) compared to present-day mean annual conditions (10.8°C and 730 mm). The temperature fluctuations down the profile appear to be around ± c. 1.00°C during stadials and interstadial, while temperatures during interglacial OIS 5 increase of c. 2°C. Precipitation varies along the profile by about ±50 mm on an average of about 600 mm per year during the stadial/interstadial phase, while during OIS 5 it increases by about 100 mm on the same average. The subsequent deposition of primary loess at Karamaidan was characterized by minimal weathering and pedogenesis, and increasing accumulation rates, as indicated by the presence of “Sommerprossen” (small, roundish or irregularly shaped spots or patches of a different color) increasing upward in the profile. The overall accumulation reached approximately 9 m over the age range of approximately 30–70 ka. During the deposition of the primary loess, the calculated MAT was approximately 11°C on average, which closely aligns with the present-day MAT of 10.8°C. However, MAP was estimated to be around 600 mm, about 130 mm lower than the present-day recorded values of 730 mm and 120 mm lower than calculated precipitation during PS2 accumulation/pedogenesis. Consequently, primary loess deposition at Karamaidan experienced a reduction in both temperatures and precipitations by approximately 15% and 17% respectively, compared to the preceding PS2 pedocomplex. These conditions appear to contradict the hypothesis that there was during the OIS 3 an increase in precipitation favored by the northward expansion of the Asian monsoon and glacial expansion in the Tian Shan, but the spatio-temporal inhomogeneity and asynchrony of these events has recently been emphasized by other authors (Dave et al., 2023a). Of course it might also mean that the Wang’s transfer functions, being based on data recorded form Chinese LPSS, are not sensitive enough for the local context. The weak paleosol PS1, likely ascribable to OIS 3, represents a principle of pedogenesis under conditions of high dust accumulation, as shown by the presence of numerous “Sommersprossen” in the parent material. This weakly developed soil suggests that the interstadial conditions in the region were not as pronounced as in Europe or China (e.g., Fitzsimmons et al., 2012; Marković et al., 2015b). Furthermore, PS1 is likely an accretionary soil, indicating the availability of sediment in the region during that time. The presence of PS1 subdivides the loess flow into two pulses, one before and one after its deposition. However, dating these pulses is challenging due to the uncertainty of the results. Nevertheless, they are comparable to depositional events in neighboring Kazakhstan, such as Remizovka (Fitzsimmons et al., 2018). No significant variations in MAT and MAP were detected during this period. Regarding the HS, Wang’s paleoclimate transfer functions suggest a MAT of approximately 11 °C and a MAP of about 600 mm. These findings indicate that during the deposition of the HS at Karamaidan, slightly higher temperatures and lower precipitation levels were present compared to the conditions observed today.
5 Conclusion
In this study, we investigated the compositional geochemical variations of loess-paleosol sequences (LPS) in Karamaidan, Tajikistan, over the last full glacial cycle. Our goal was to understand the relationship between these variations and past climate fluctuations. Weathering indexes based on geochemical variations are an excellent tool for understanding past pedogenetic dynamics. However, distinguishing between in situ weathering and weathering during transport processes can be challenging. Therefore, the choice of the most suitable index should be evaluated on a case-by-case basis, considering a comparison with established direct indexes such as magnetic susceptibility, as previously suggested by Schatz et al. (2015). Different soil paleoclimatic transfer functions have shown good applicability depending on the mode and relationships considered in their formulation. For the Karamaidan case, the functions proposed by Wang et al. (2023) seem to be effective, possibly due to their incorporation of the CPA index, which is one of the best descriptors of weathering in Karamaidan, following FENG. Even though it is worth noting that for the local context they might not be sensitive enough to correctly represent the whole profile. It might be interesting to develop transfer functions based on the different weathering indexes and select the most suitable function based on the best descriptive weathering index for the specific LPS under investigation. In any case, quantitative results should be taken with caution in the absence of a suitable comparison method. The Karamaidan pedocomplex appears to have formed during the OIS 5 interglacial phase. The pedocomplex, identified as PS2, developed under oscillating conditions with higher average temperatures of approximately 13 °C and lower precipitation of around 665 mm compared to present-day conditions. The subsequent deposition of the primary loess, identified as PL1, occurred during OIS 3 and exhibited high accumulation rates with lower mean temperatures and precipitations. The chronological analysis reveals that the deposition of the lower primary loess (PL2) during OIS 4 is associated with reduced apparent accumulation rates, likely influenced by the proximity of measurement errors within the analysis interval. The nature and chemical relationships around the weak paleosol PS1 are uncertain. It would be interesting to couple a colorimetric and grain size study in the future to better understand the origins of this distinct color variation. In the future, it would also be stimulating to couple the high-resolution geochemical analyses along the profile with a detailed mineralogical study in X-ray diffraction, including the <4 µm fraction, to get a broader picture of the possible origin of the parent material and its evolution during transport and in situ, perhaps being able to highlight the differences between pre- and post-deposition weathering.
Data availability statement
The original contributions presented in the study are included in the article/Supplementary Material, further inquiries can be directed to the corresponding author.
Author contributions
AA: Conceptualization, Data curation, Formal Analysis, Investigation, Methodology, Visualization, Writing–original draft, Writing–review and editing. GS: Data curation, Investigation, Writing–review and editing. CP: Data curation, Investigation, Methodology, Writing–review and editing. AD: Data curation, Formal Analysis, Investigation, Methodology, Writing–review and editing. ML: Investigation, Writing–review and editing. AJ: Validation, Writing–review and editing. LM: Data curation, Investigation, Resources, Writing–review and editing. NS: Resources, Writing–review and editing. TL: Validation, Writing–review and editing. KF: Conceptualization, Funding acquisition, Investigation, Methodology, Resources, Supervision, Validation, Writing–review and editing.
Funding
The author(s) declare financial support was received for the research, authorship, and/or publication of this article. This project was funded by an independent Max Planck Research Group (Research Group for Terrestrial Palaeoclimates, Max Planck Institute for Chemistry, Mainz, Germany) awarded to KEF. Laboratory analyses at UNESP were supported by CNPq (424365/2016-2).
Acknowledgments
We wish to thank Nora Groschopf, technician of the XRF Laboratory of the Institute of Geosciences of the University of Mainz, for the assistance during the sample preparation and for carrying out all the XRF analyses. We thank Zoran Peric for his assistance in the luminescence laboratories in Mainz. Thank you to the students of the Tajik National University (Shuhrat, Alikhon, Zoir), to Stefan de Graaf, Kristina Reetz, Maike Nowatzki, Zoran Peric, Bastian Speckle and Gabriel Bera, and to the many local residents of the village of Karamaidan for their assistance with the fieldwork in Tajikistan.
Conflict of interest
The authors declare that the research was conducted in the absence of any commercial or financial relationships that could be construed as a potential conflict of interest.
Publisher’s note
All claims expressed in this article are solely those of the authors and do not necessarily represent those of their affiliated organizations, or those of the publisher, the editors and the reviewers. Any product that may be evaluated in this article, or claim that may be made by its manufacturer, is not guaranteed or endorsed by the publisher.
Supplementary material
The Supplementary Material for this article can be found online at: https://www.frontiersin.org/articles/10.3389/feart.2024.1347910/full#supplementary-material
References
An, Z., Liu, T., Lu, Y., Porter, S. C., Kukla, G., Wu, X., et al. (1990). The long-term paleomonsoon variation recorded by the loess-paleosol sequence in Central China. Quat. Int. 7–8, 91–95. doi:10.1016/1040-6182(90)90042-3
Antoine, P., Rousseau, D. D., Zöller, L., Lang, A., Munaut, A. V., Hatté, C., et al. (2001). High-resolution record of the last Interglacial–glacial cycle in the Nussloch loess–palaeosol sequences, Upper Rhine Area, Germany. Quat. Int. 76, 211–229. doi:10.1016/S1040-6182(00)00104-X
Balsam, W. L., Ellwood, B. B., Ji, J., Williams, E. R., Long, X., and El Hassani, A. (2011). Magnetic susceptibility as a proxy for rainfall: worldwide data from tropical and temperate climate. Quat. Sci. Rev. 30, 2732–2744.
Banerjee, D., Murray, A. S., Bøtter-Jensen, L., and Lang, A. (2001). Equivalent dose estimation using a single aliquot of polymineral fine grains. Radiat. Meas. 33, 73–94. doi:10.1016/S1350-4487(00)00101-3
Banerjee, S. K., King, J., and Marvin, J. (1981). A rapid method for magnetic granulometry with applications to environmental studies. Geophys. Res. Lett. 8, 333–336. doi:10.1029/GL008I004P00333
Bronger, A. (2003). Correlation of loess-paleosol sequences in east and central Asia with SE central Europe: towards a continental quaternary pedostratigraphy and paleoclimatic history. Quat. Int. 107, 11–31. doi:10.1016/S1040-6182(02)00159-3
Bronger, A., Winter, R., Derevjanko, O., and Aldag, S. (1995). Loess–palaeosol sequences in tadjikistan as a palaeoclimatic record of the quaternary in central Asia. Wind Blown Sediments Quat. Rec. 4, 69–81.
Buggle, B., Glaser, B., Hambach, U., Gerasimenko, N., and Marković, S. (2011a). An evaluation of geochemical weathering indices in loess-paleosol studies. Quat. Int. 240, 12–21. doi:10.1016/j.quaint.2010.07.019
Buggle, B., Glaser, B., Hambach, U., Gerasimenko, N., and Marković, S. (2011b). An evaluation of geochemical weathering indices in loess–paleosol studies. Quat. Int. 240, 12–21. doi:10.1016/J.QUAINT.2010.07.019
Buggle, B., Hambach, U., Glaser, B., Gerasimenko, N., Marković, S., Glaser, I., et al. (2009). Stratigraphy, and spatial and temporal paleoclimatic trends in Southeastern/Eastern European loess–paleosol sequences. Quat. Int. 196, 86–106. doi:10.1016/J.QUAINT.2008.07.013
Buylaert, J. P., Murray, A. S., Vandenberghe, D., Vriend, M., De Corte, F., and Van den haute, P. (2008). Optical dating of Chinese loess using sand-sized quartz: Establishing a time frame for Late Pleistocene climate changes in the western part of the Chinese Loess Plateau. Quat. Geochronol. 3, 99–113. doi:10.1016/J.QUAGEO.2007.05.003
Catt, J., Felix-Henningsen, P., Kemp, R., and Scholten, T. (2000). Preface. CATENA 41, 1–2. doi:10.1016/S0341-8162(00)00101-6
Catt, J. A. (1991). Soils as indicators of quaternary climatic change in mid-latitude regions. Geoderma 51, 167–187. doi:10.1016/0016-7061(91)90070-A
Caves, J. K., Moragne, D. Y., Ibarra, D. E., Bayshashov, B. U., Gao, Y., Jones, M. M., et al. (2016). The neogene de-greening of central Asia. Geology 44, 887–890. doi:10.1130/G38267.1
Cheng, H., Spötl, C., Breitenbach, S. F. M., Sinha, A., Wassenburg, J. A., Jochum, K. P., et al. (2016). Climate variations of Central Asia on orbital to millennial timescales. Sci. Rep. 61 (6), 36975–37011. doi:10.1038/srep36975
Cullers, R. L. (2000). The geochemistry of shales, siltstones and sandstones of Pennsylvanian–Permian age, Colorado, USA: implications for provenance and metamorphic studies. Lithos 51, 181–203. doi:10.1016/S0024-4937(99)00063-8
Darmody, R. G., Thorn, C. E., and Allen, C. E. (2005). Chemical weathering and boulder mantles, Kärkevagge, Swedish Lapland. Geomorphology 67, 159–170. doi:10.1016/J.GEOMORPH.2004.07.011
Dave, A. K., Lisá, L., Scardia, G., Nigmatova, S., and Fitzsimmons, K. E. (2023a). The patchwork loess of Central Asia: implications for interpreting aeolian dynamics and past climate circulation in piedmont regions. J. Quat. Sci. 38, 526–543. doi:10.1002/JQS.3493
Dave, A. K., Timar-Gabor, A., Scardia, G., Safaraliev, N., and Fitzsimmons, K. E. (2022). Variation in luminescence characteristics and paramagnetic defect centres in fine-grained quartz from a loess-palaeosol sequence in Tajikistan: implications for provenance studies in aeolian environments. Front. Earth Sci. 10, 1–10. doi:10.3389/feart.2022.835281
Dearing, J. (1999). Environmental magnetic susceptibility using the Bartington MS2 system. London: Bartington Instruments Ltd. Br. Libr.
Derbyshire, E., Kemp, R. A., and Meng, X. (1997). Climate change, loess and palaeosols: proxy measures and resolution in North China. J. Geol. Soc. Lond. 154, 793–805. doi:10.1144/GSJGS.154.5.0793
Dettman, D. L., Kohn, M. J., Quade, J., Ryerson, F. J., Ojha, T. P., and Hamidullah, S. (2001). Seasonal stable isotope evidence for a strong Asian monsoon throughout the past 10.7 m.y. Geology 29, 31. doi:10.1130/0091-7613(2001)029<0031:SSIEFA>2.0
Ding, Z. L., Ranov, V., Yang, S. L., Finaev, A., Han, J. M., and Wang, G. A. (2002). The loess record in southern Tajikistan and correlation with Chinese loess. Earth Planet. Sci. Lett. 200, 387–400. doi:10.1016/S0012-821X(02)00637-4
Dodonov, A. E. (2007). Loess records | central Asia. Encycl. Quat. Sci., 1418–1429. doi:10.1016/B0-44-452747-8/00161-7
Dodonov, A. E., and Baiguzina, L. L. (1995). Loess stratigraphy of central Asia: palaeoclimatic and palaeoenvironmental aspects. Quat. Sci. Rev. 14, 707–720. doi:10.1016/0277-3791(95)00054-2
Dodonov, A. E., Sadchikova, T. A., Sedov, S. N., Simakova, A. N., and Zhou, L. P. (2006). Multidisciplinary approach for paleoenvironmental reconstruction in loess-paleosol studies of the Darai Kalon section, Southern Tajikistan. Quat. Int. 152–153, 48–58. doi:10.1016/j.quaint.2005.12.001
Fedo, C. M., Nesbitt, H. W., and Young, G. M. (1995). Unraveling the effects of potassium metasomatism in sedimentary rocks and paleosols, with implications for paleoweathering conditions and provenance. Geology 23, 921–924. doi:10.1130/0091-7613(1995)023<0921:uteopm>2.3.co;2
Feng, Z.-D. (1997). Geochemical characteristics of a loess-soil sequence in central Kansas. Soil Sci. Soc. Am. J. 61, 534–541. doi:10.2136/SSSAJ1997.03615995006100020023X
Fenn, K., Thomas, D. S. G., Durcan, J. A., Millar, I. L., Veres, D., Piermattei, A., et al. (2021). A tale of two signals: global and local influences on the Late Pleistocene loess sequences in Bulgarian Lower Danube. Quat. Sci. Rev. 274, 107264. doi:10.1016/J.QUASCIREV.2021.107264
Fick, S. E., and Hijmans, R. J. (2017). WorldClim 2: new 1-km spatial resolution climate surfaces for global land areas. Int. J. Climatol. Int. J. Clim. 37, 4302–4315. doi:10.1002/joc.5086
Fitzsimmons, K. E. (2017). Reconstructing palaeoenvironments on desert margins: new perspectives from Eurasian loess and Australian dry lake shorelines. Quat. Sci. Rev. 171, 1–19. doi:10.1016/j.quascirev.2017.05.018
Fitzsimmons, K. E., Hambach, U., Veres, D., and Iovita, R. (2013). The campanian ignimbrite eruption: new data on volcanic ash dispersal and its potential impact on human evolution. PLoS One 8, e65839. doi:10.1371/JOURNAL.PONE.0065839
Fitzsimmons, K. E., Iovita, R., Sprafke, T., Glantz, M., Talamo, S., Horton, K., et al. (2017). A chronological framework connecting the early Upper Palaeolithic across the Central Asian piedmont. J. Hum. Evol. 113, 107–126. doi:10.1016/j.jhevol.2017.07.006
Fitzsimmons, K. E., Marković, S. B., and Hambach, U. (2012). Pleistocene environmental dynamics recorded in the loess of the middle and lower Danube basin. Quat. Sci. Rev. 41, 104–118. doi:10.1016/J.QUASCIREV.2012.03.002
Fitzsimmons, K. E., Nowatzki, M., Dave, A. K., and Harder, H. (2020). Intersections between wind regimes, topography and sediment supply: perspectives from aeolian landforms in Central Asia. Palaeogeogr. Palaeoclimatol. Palaeoecol. 540, 109531. doi:10.1016/J.PALAEO.2019.109531
Fitzsimmons, K. E., Sprafke, T., Zielhofer, C., Günter, C., Deom, J.-M. M., Sala, R., et al. (2018). Loess accumulation in the Tian Shan piedmont: implications for palaeoenvironmental change in arid Central Asia. Quat. Int. 469, 30–43. doi:10.1016/j.quaint.2016.07.041
Forster, T., and Heller, F. (1994). Loess deposits from the Tajik depression (Central Asia): magnetic properties and paleoclimate. Earth Planet. Sci. Lett. 128, 501–512. doi:10.1016/0012-821X(94)90166-X
Forster, T., and Heller, F. (1997). Magnetic enhancement paths in loess sediments from Tajikistan, China and Hungary. Geophys. Res. Lett. 24, 17–20. doi:10.1029/96GL03751
Gallagher, T. M., and Sheldon, N. D. (2013). A new paleothermometer for forest paleosols and its implications for Cenozoic climate. Geology 41, 647–650. doi:10.1130/G34074.1
Gorshkov, G. P. (1935). Сейсмичность Южного Таджикистана в связи с его тектоникой. Proc. Exped. Vol. L., Seismol. Inst. USSR Acad. Sci.
Gorshkov, G. P. (1949). Zemletriaseniia na territorii sovetskogo soiuza. Russ. Gos. Izd. Geogr. Lit.
Guérin, G., Guérin, G., Mercier, N., and Adamiec, G. (2011). Dose-rate conversion factors: update. Anc. TL 29 (1), 5–8. Available at: https://www.academia.edu/2453969/Guérin_G_Mercier_N_and_Adamiec_G_2011_Dose_rate_conversion_factors_update_Ancient_TL_29_1_5_8 (Accessed February 23, 2023).
Harnois, L. (1988). The CIW index: a new chemical index of weathering. Sediment. Geol. 55, 319–322. doi:10.1016/0037-0738(88)90137-6
Heller, F., and Liu, T.-S. (1982). Magnetostratigraphical dating of loess deposits in China. Nature 300, 431–433. doi:10.1038/300431A0
Jain, M., Tandon, S. K., Singhvi, A. K., Mishra, S., and Bhatt, S. C. (2005). Quaternary alluvial stratigraphic development in a desert setting: a case study from Luni river basin, Western India. 349–371. Available at: https://orbit.dtu.dk/en/publications/quaternary-alluvial-stratigraphic-development-in-a-desert-setting (Accessed March 19, 2023).
Jia, J., Lu, H., Wang, Y., and Xia, D. (2018). Variations in the iron mineralogy of a loess section in Tajikistan during the mid-pleistocene and late pleistocene: implications for the climatic evolution in central asia. G-cubed. 19, 1244–1258. doi:10.1002/2017GC007371
Jiamao, H., Houyuan, L., Naiqin, W., and Zhengtang, G. (1996). The magnetic susceptibility of modern soils in China and its use for paleoclimate reconstruction. Stud. Geophys. Geod. 40, 262–275. doi:10.1007/bf02300742
Kronberg, B. I., and Nesbitt, H. W. (1981). QUANTIFICATION OF WEATHERING, SOIL GEOCHEMISTRY AND SOIL FERTILITY. J. Soil Sci. 32, 453–459. doi:10.1111/J.1365-2389.1981.TB01721.X
Kukla, G. (1987). Loess stratigraphy in central China. Quat. Sci. Rev. 6, 191–219. doi:10.1016/0277-3791(87)90004-7
Kukla, G., and An, Z. (1989). Loess stratigraphy in Central China. Palaeogeogr. Palaeoclimatol. Palaeoecol. 72, 203–225. doi:10.1016/0031-0182(89)90143-0
Kukla, G., Heller, F., Ming, L. X., Chun, X. T., Sheng, L. T., and Sheng, A. Z. (1988). Pleistocene climates in China dated by magnetic susceptibility. Geology 16, 811–814. doi:10.1130/0091-7613(1988)016<0811:PCICDB>2.3
Lehmkuhl, F., Nett, J. J., Pötter, S., Schulte, P., Sprafke, T., Jary, Z., et al. (2021). Loess landscapes of Europe – mapping, geomorphology, and zonal differentiation. Earth-Science Rev. 215, 103496. doi:10.1016/j.earscirev.2020.103496
Leone, G., Leoni, L., and Sartori, F. (1988). Revisione di un metodo gasometrico per la determinazione di calcite e dolomite. Atti della Soc. Toscana Sci. Nat. Mem. Ser. A 95, 7–20.
Li, Y., Song, Y., Chen, X., Li, J., Mamadjanov, Y., and Aminov, J. (2016). Geochemical composition of Tajikistan loess and its provenance implications. Palaeogeogr. Palaeoclimatol. Palaeoecol. 446, 186–194. doi:10.1016/J.PALAEO.2016.01.025
Li, Y., Song, Y., Fitzsimmons, K. E., Chen, X., Wang, Q., Sun, H., et al. (2018). New evidence for the provenance and formation of loess deposits in the ili river basin, arid central Asia. Aeolian Res. 35, 1–8. doi:10.1016/j.aeolia.2018.08.002
Li, Y., Song, Y., Kaskaoutis, D. G., Chen, X., Mamadjanov, Y., and Tan, L. (2019). Atmospheric dust dynamics in southern Central Asia: implications for buildup of Tajikistan loess sediments. Atmos. Res. 229, 74–85. doi:10.1016/J.ATMOSRES.2019.06.013
Liang, L., Sun, Y., Beets, C. J., Prins, M. A., Wu, F., and Vandenberghe, J. (2013). Impacts of grain size sorting and chemical weathering on the geochemistry of Jingyuan loess in the northwestern Chinese Loess Plateau. J. Asian Earth Sci. 69, 177–184. doi:10.1016/j.jseaes.2012.12.015
Lü, L. X., Sun, J. M., Zhang, Z. L., Jia, Y. Y., Tian, S. C., and Abdulov, S. (2020). Late Miocene accelerated exhumation in the central Tajik Basin and implications for northward indention and lateral growth of the Pamir. Tectonophysics. 787. doi:10.1016/j.tecto.2020.228438
Machalett, B., Oches, E. A., Frechen, M., Zöller, L., Hambach, U., Mavlyanova, N. G., et al. (2008). Aeolian dust dynamics in central Asia during the Pleistocene: driven by the long-term migration, seasonality, and permanency of the Asiatic polar front. Geochem. Geophys. Geosystems 9. doi:10.1029/2007GC001938
Maher, B. A. (1986). Characterisation of soils by mineral magnetic measurements. Phys. Earth Planet. Inter. 42, 76–92. doi:10.1016/S0031-9201(86)80010-3
Maher, B. A., Alekseev, A., and Alekseeva, T. (2003). Magnetic mineralogy of soils across the Russian Steppe: climatic dependence of pedogenic magnetite formation. Palaeogeogr. Palaeoclimatol. Palaeoecol. 201, 321–341. doi:10.1016/S0031-0182(03)00618-7
Maher, B. A., and Thompson, R. (1995). Paleorainfall reconstructions from pedogenic magnetic susceptibility variations in the Chinese loess and paleosols. Quat. Res. 44, 383–391. doi:10.1006/QRES.1995.1083
Marković, S. B., Bokhorst, M. P., Vandenberghe, J., McCoy, W. D., Oches, E. A., Hambach, U., et al. (2008). Late Pleistocene loess-palaeosol sequences in the Vojvodina region, north Serbia. J. Quat. Sci. 23, 73–84. doi:10.1002/JQS.1124
Marković, S. B., Stevens, T., Kukla, G. J., Hambach, U., Fitzsimmons, K. E., Gibbard, P., et al. (2015a). Danube loess stratigraphy - towards a pan-European loess stratigraphic model. Earth-Science Rev. 148, 228–258. doi:10.1016/j.earscirev.2015.06.005
Marković, S. B., Stevens, T., Kukla, G. J., Hambach, U., Fitzsimmons, K. E., Gibbard, P., et al. (2015b). Danube loess stratigraphy — towards a pan-European loess stratigraphic model. Earth-Science Rev. 148, 228–258. doi:10.1016/J.EARSCIREV.2015.06.005
Maynard, J. B. (1993). Chemistry of modern soils as a guide to interpreting precambrian paleosols. Source J. Geol. 100, 279–289. doi:10.1086/629632
Nemecz, E., Pécsi, M., Hartyáni, Z., and Horváth, T. (2000). The origin of the silt size quartz grains and minerals in loess. Quat. Int. 67–71, 199–208. doi:10.1016/s1040-6182(00)00044-6
Nesbitt, H. W., and Young, G. M. (1982). Early Proterozoic climates and plate motions inferred from major element chemistry of lutites. Nature 299, 715–717. doi:10.1038/299715a0
Nesbitt, H. W., and Young, G. M. (1984). Prediction of some weathering trends of plutonic and volcanic rocks based on thermodynamic and kinetic considerations. Geochim. Cosmochim. Acta 48, 1523–1534. doi:10.1016/0016-7037(84)90408-3
Nesbitt, H. W., and Young, G. M. (1989). Formation and diagenesis of weathering profiles. J. Geol. 97, 129–147. doi:10.1086/629290
Nordt, L., von Fischer, J., and Tieszen, L. (2007). Late quaternary temperature record from buried soils of the North American Great Plains. Geology 35, 159–162. doi:10.1130/G23345A.1
Obruchev, V. A. (1945). Loess types and their origin. Am. J. Sci. 243, 256–262. doi:10.2475/AJS.243.5.256
Parker, A. (1970). An index of weathering for silicate rocks. Geol. Mag. 107, 501–504. doi:10.1017/S0016756800058581
Pécsi, M. (1990). Loess is not just the accumulation of dust. Quat. Int. 8, 1–21. doi:10.1016/1040-6182(90)90034-2
Peterse, F., Martínez-García, A., Zhou, B., Beets, C. J., Prins, M. A., Zheng, H., et al. (2014). Molecular records of continental air temperature and monsoon precipitation variability in East Asia spanning the past 130,000 years. Quat. Sci. Rev. 83, 76–82. doi:10.1016/j.quascirev.2013.11.001
Porter, S. C. (2001). Chinese loess record of monsoon climate during the last glacial–interglacial cycle. Earth-Science Rev. 54, 115–128. doi:10.1016/S0012-8252(01)00043-5
Porter, S. C., and An, Z. (1995). Correlation between climate events in the North Atlantic and China during the last glaciation. Nature 375, 305–308. doi:10.1038/375305a0
Prescott, J. R., and Hutton, J. T. (1994). Cosmic ray contributions to dose rates for luminescence and ESR dating: large depths and long-term time variations. Radiat. Meas. 23, 497–500. doi:10.1016/1350-4487(94)90086-8
Prud’homme, C., Lécuyer, C., Antoine, P., Hatté, C., Moine, O., Fourel, F., et al. (2018). δ13C signal of earthworm calcite granules: a new proxy for palaeoprecipitation reconstructions during the Last Glacial in western Europe. Quat. Sci. Rev. 179, 158–166.
Prud’homme, C., Scardia, G., Vonhof, H., Guinoiseau, D., Nigmatova, S., Fiebig, J., et al. (2021). Central asian modulation of northern hemisphere moisture transfer over the late cenozoic. Commun. Earth Environ. 2, 106–108. doi:10.1038/s43247-021-00173-z
Rees-Jones, J. (1995). Optical dating of young sediments using fine-grain quartz. Ancient TL. 13 (2), 9–14.
Retallack, G. J. (2005). Pedogenic carbonate proxies for amount and seasonality of precipitation in paleosols. Geology 33, 333–336. doi:10.1130/G21263.1
Retallack, G. J. (2008). Soils of the past: an introduction to paleopedology. USA: John Wiley and Sons.
Retallack, G. J. (2009). Greenhouse crises of the past 300 million years. GSA Bull. 121, 1441–1455. doi:10.1130/B26341.1
Rocha Filho, P., Antuenes, F. S., and Falcao, M. F. G. (1985). “Quantitative influence of the weathering upon the mechanical properties of a young gneiss residual soil,” in Proceedings of first international conference on geomechanics in tropical lateritic and saprolitic soils, Brazil, 11-14 February 1985, 281–294.
Rutter, N., Ding, Z., Evans, M. E., and Liu, T. (1991). Baoji-type pedostratigraphic section, Loess Plateau, north-central China. Quat. Sci. Rev. 10, 1–22. doi:10.1016/0277-3791(91)90028-S
Schaetzl, R. J., Bettis, E. A., Crouvi, O., Fitzsimmons, K. E., Grimley, D. A., Hambach, U., et al. (2018). Approaches and challenges to the study of loess—introduction to the LoessFest special issue. Quat. Res. 89, 563–618. doi:10.1017/qua.2018.15
Schatz, A.-K. (2014). Towards a quantification of environmental and climatic factors between 60 and 20 ka in SE Europe using geochemistry and luminescence dating. Available at: https://publikationen.uni-tuebingen.de/xmlui/bitstream/handle/10900/57224/Diss_ASchatz_2014.
Schatz, A. K., Scholten, T., and Kühn, P. (2015). Paleoclimate and weathering of the Tokaj (Hungary) loess–paleosol sequence. Palaeogeogr. Palaeoclimatol. Palaeoecol. 426, 170–182. doi:10.1016/J.PALAEO.2015.03.016
Schreuder, L. T., Beets, C. J., Prins, M. A., Hatté, C., and Peterse, F. (2016). Late Pleistocene climate evolution in Southeastern Europe recorded by soil bacterial membrane lipids in Serbian loess. Palaeogeogr. Palaeoclimatol. Palaeoecol. 449, 141–148. doi:10.1016/j.palaeo.2016.02.013
Shackleton, N. J. (1995). Accumulation rate of loess in Tajikistan and China: relationship with global ice volume cycles. Wind Blown Sediments Quat. Rec. 1–6.
Sheldon, N. D. (2006). Quaternary glacial-interglacial climate cycles in Hawaii. J. Geol. 114, 367–376. doi:10.1086/500993
Sheldon, N. D., Retallack, G. J., and Tanaka, S. (2002). Geochemical climofunctions from North American soils and application to paleosols across the Eocene-Oligocene boundary in Oregon. J. Geol. 110, 687–696. doi:10.1086/342865
Sheldon, N. D., and Tabor, N. J. (2009). Quantitative paleoenvironmental and paleoclimatic reconstruction using paleosols. Earth-Science Rev. 95, 1–52. doi:10.1016/J.EARSCIREV.2009.03.004
Smalley, I. (1995). Making the material: the formation of silt sized primary mineral particles for loess deposits. Quat. Sci. Rev. 14, 645–651. doi:10.1016/0277-3791(95)00046-1
Smalley, I., and Derbyshire, E. (1990). The definition of “ice-sheet” and “mountain” loess. Area 22, 300–301.
Smalley, I., Marković, S. B., and Svirčev, Z. (2011). Loess is [almost totally formed by] the accumulation of dust. Quat. Int. 240, 4–11. doi:10.1016/J.QUAINT.2010.07.011
Smalley, I., O’Hara-Dhand, K., Wint, J., Machalett, B., Jary, Z., and Jefferson, I. (2009). Rivers and loess: the significance of long river transportation in the complex event-sequence approach to loess deposit formation. Quat. Int. 198, 7–18. doi:10.1016/J.QUAINT.2008.06.009
Smalley, I. J. (1966). The properties of glacial loess and the formation of loess deposits. J. Sediment. Res. 36, 669–676. doi:10.1306/74D7153C-2B21-11D7-8648000102C1865D
Smalley, I. J., and Krinsley, D. H. (1978). Loess deposits associated with deserts. Catena (Amst). 5, 53–66. doi:10.1016/S0341-8162(78)80006-X
Smalley, I. J., and Vita-Finzi, C. (1968). The formation of fine particles in sandy deserts and the nature of desert’ loess. J. Sediment. Res. 38, 766–774. doi:10.1306/74D71A69-2B21-11D7-8648000102C1865D
Sprafke, T., and Obreht, I. (2016). Loess: rock, sediment or soil - what is missing for its definition? Quat. Int. 399, 198–207. doi:10.1016/j.quaint.2015.03.033
Stevens, T., Palk, C., Carter, A., Lu, H., and Clift, P. D. (2010). Assessing the provenance of loess and desert sediments in northern China using U-Pb dating and morphology of detrital zircons. GSA Bull. 122, 1331–1344. doi:10.1130/B30102.1
Stuut, J. B., Smalley, I., and O’Hara-Dhand, K. (2009). Aeolian dust in Europe: african sources and European deposits. Quat. Int. 198, 234–245. doi:10.1016/j.quaint.2008.10.007
Sun, Y., Lu, H., and Zhisheng, A. (2006). Grain size of loess, palaeosol and Red Clay deposits on the Chinese Loess Plateau: significance for understanding pedogenic alteration and palaeomonsoon evolution. Palaeogeogr. Palaeoclimatol. Palaeoecol. 241, 129–138. doi:10.1016/j.palaeo.2006.06.018
Taylor, S. ., McLennan, S. ., and McCulloch, M. (1983). Geochemistry of loess, continental crustal composition and crustal model ages. Geochim. Cosmochim. Acta 47, 1897–1905. doi:10.1016/0016-7037(83)90206-5
Taylor, S. R., and McLennan, S. M. (1995). The geochemical evolution of the continental crust. Rev. Geophys. 33, 241–265. doi:10.1029/95RG00262
Terhorst, B., Kühn, P., Damm, B., Hambach, U., Meyer-Heintze, S., and Sedov, S. (2014). Paleoenvironmental fluctuations as recorded in the loess-paleosol sequence of the Upper Paleolithic site Krems-Wachtberg. Quat. Int. 351, 67–82. doi:10.1016/J.QUAINT.2013.03.045
Thiel, C., Buylaert, J. P., Murray, A., Terhorst, B., Hofer, I., Tsukamoto, S., et al. (2011). Luminescence dating of the Stratzing loess profile (Austria) – Testing the potential of an elevated temperature post-IR IRSL protocol. Quat. Int. 234, 23–31. doi:10.1016/j.quaint.2010.05.018
Thomsen, K. J., Bøtter-Jensen, L., Denby, P. M., Moska, P., and Murray, A. S. (2006). Developments in luminescence measurement techniques. Radiat. Meas. 41, 768–773. doi:10.1016/J.RADMEAS.2006.06.010
Thomsen, K. J., Murray, A. S., Jain, M., and Bøtter-Jensen, L. (2008). Laboratory fading rates of various luminescence signals from feldspar-rich sediment extracts. Radiat. Meas. 43, 1474–1486. doi:10.1016/j.radmeas.2008.06.002
Tian, S., Sun, J., Zhang, Z., Abdulov, S., Cao, M., Gadoev, M., et al. (2021). Loess deposits in the Tajik basin, central Asia: chronology, provenance and palaeoclimatic implications since the last glacial. Boreas 50, 147–166. doi:10.1111/bor.12467
Timar-Gabor, A., Buylaert, J. P., Guralnik, B., Trandafir-Antohi, O., Constantin, D., Anechitei-Deacu, V., et al. (2017). On the importance of grain size in luminescence dating using quartz. Radiat. Meas. 106, 464–471. doi:10.1016/J.RADMEAS.2017.01.009
Tsoar, H., and Pye, K. (1987). Dust transport and the question of desert loess formation. Sedimentology 34, 139–153. doi:10.1111/J.1365-3091.1987.TB00566.X
Ujvari, G. (2014). Interactive comment on “Paleoclimate and weathering of the Tokaj (NE Hungary) loess-paleosol sequence: a comparison of geochemical weathering indices and paleoclimate parameters” by A.-K. Schatz et al. Clim. Past Discuss. 10, C19–C26.
Újvári, G. (2014). Interactive Comment Climate of the Past Discussions Interactive comment on “Paleoclimate and weathering of the Tokaj (NE Hungary) loess-paleosol sequence: a comparison of geochemical weathering indices and paleoclimate parameters” by A.-K. Schatz et al. Available at: Accessed March 3, 2023).
Újvári, G., Bernasconi, S. M., Stevens, T., Kele, S., Páll-Gergely, B., Surányi, G., et al. (2021). Stadial-interstadial temperature and aridity variations in east central Europe preceding the last glacial maximum. Paleoceanogr. Paleoclimatology 36, e2020PA004170. doi:10.1029/2020PA004170
Újvári, G., Kele, S., Bernasconi, S. M., Haszpra, L., Novothny, Á., and Bradák, B. (2019). Clumped isotope paleotemperatures from MIS 5 soil carbonates in southern Hungary. Palaeogeogr. Palaeoclimatol. Palaeoecol. 518, 72–81. doi:10.1016/J.PALAEO.2019.01.002
Újvári, G., Varga, A., and Balogh-Brunstad, Z. (2008). Origin, weathering, and geochemical composition of loess in southwestern Hungary. Quat. Res. 69, 421–437. doi:10.1016/j.yqres.2008.02.001
Újvári, G., Varga, A., Raucsik, B., and Kovács, J. (2014). The Paks loess-paleosol sequence: a record of chemical weathering and provenance for the last 800 ka in the mid-Carpathian Basin. Quat. Int. 319, 22–37. doi:10.1016/J.QUAINT.2012.04.004
Vandenberghe, J., Renssen, H., van Huissteden, K., Nugteren, G., Konert, M., Lu, H., et al. (2006). Penetration of atlantic westerly winds into central and east Asia. Quat. Sci. Rev. 25, 2380–2389. doi:10.1016/j.quascirev.2006.02.017
Wang, Q., Cui, D., Han, C., Bai, C., Zhang, Y., and Sun, Z. (2013). Relationship between soil-developing indicators and climate factors and reconstruction of paleoclimate in the western area, Liaoning Province. Acta Pedol. Sin. 50, 244–252.
Wang, T. H., Wang, Q. B., Han, C. L., Cui, D., and Sauer, D. (2023). Development and application of new transfer functions between climate and soil weathering indices for paleoclimatic reconstructions from Chinese loess-paleosol sections. CATENA 224, 106974. doi:10.1016/J.CATENA.2023.106974
Wang, X., Wei, H., Taheri, M., Khormali, F., Danukalova, G., and Chen, F. (2016). Early Pleistocene climate in western arid central Asia inferred from loess-palaeosol sequences. Sci. Rep. 6, 20560. doi:10.1038/SREP20560
Yang, S., Ding, F., and Ding, Z. (2006). Pleistocene chemical weathering history of Asian arid and semi-arid regions recorded in loess deposits of China and Tajikistan. Geochim. Cosmochim. Acta 70, 1695–1709. doi:10.1016/J.GCA.2005.12.012
Zhang, X. (2021). Penetration of monsoonal water vapour into arid central Asia during the Holocene: an isotopic perspective. Quat. Sci. Rev. 251, 106713. doi:10.1016/J.QUASCIREV.2020.106713
Keywords: loess-palaeosol sequences, weathering index, central Asia, Karamaidan, Tajikistan
Citation: Aquino A, Scardia G, Prud’homme C, Dave AK, Lezzerini M, Johansson AE, Marquer L, Safaraliev N, Lauer T and Fitzsimmons KE (2024) Variability in geochemical weathering indices in loess over the last full glacial cycle at Karamaidan, central Asia (Tajikistan). Front. Earth Sci. 12:1347910. doi: 10.3389/feart.2024.1347910
Received: 01 December 2023; Accepted: 29 January 2024;
Published: 22 February 2024.
Edited by:
János Kovács, Faculty of Science, University of Pécs, HungaryReviewed by:
Slobodan B. Markovic, University of Novi Sad, SerbiaGábor Újvári, Hungarian Academy of Sciences (MTA), Hungary
Copyright © 2024 Aquino, Scardia, Prud’homme, Dave, Lezzerini, Johansson, Marquer, Safaraliev, Lauer and Fitzsimmons. This is an open-access article distributed under the terms of the Creative Commons Attribution License (CC BY). The use, distribution or reproduction in other forums is permitted, provided the original author(s) and the copyright owner(s) are credited and that the original publication in this journal is cited, in accordance with accepted academic practice. No use, distribution or reproduction is permitted which does not comply with these terms.
*Correspondence: Andrea Aquino, andrea.aquino@uni-tuebingen.de