Dynamic change of soil aggregate stability and infiltration properties during crop growth under four tillage measures in Mollisols region of northeast China
 Chong Xu
 Wenli Liu*
 - College of Resources and Environment, Jilin Agricultural University, Changchun, China
Introduction: Previous studies have proven that different tillage measures have significant different effects on soil structure, hydrology properties and soil erosion. However, few studies have clarified the dynamic changes in soil aggregate stability and infiltration properties during crop growth under four tillage measures.
Methods: Four field plots (150 m × 15 m) managed by four tillage methods including wide ridge tillage (DT), no-tillage (NT), contour ridge tillage (CT) and traditional tillage (CK) were built in 2021 to evaluate their effects on dynamic changes of soil structure and water conductivity during crop growth. Soybean was the seasonal crop. Soil bulk density, soil porosity, soil aggregate stability and soil infiltration characteristics were measured to assess dynamic changes in soil aggregate stability and infiltration from June to October 2022.
Results: The results showed that NT significantly increased soil bulk density by up to 21.62% compared with CK, while DT did not show significantly increase in soil bulk density. DT, NT and CT could greatly increase the capillary porosity and proportion of capillary porosity to total porosity. DT and NT also improved the stability of soil water-stable aggregates by 3.37% and 10.6%. In terms of soil infiltration properties, all three tillage methods increased the initial, stable and average infiltration rates by 8.4%–52.94%, of which the DT and NT showed the greatest improvement. The soil infiltration process of four tillage measures could be better fitted by Horton model than Kostiakov and Philip models. Soil saturated hydraulic conductivity (SHC) of CK exhibited a significant negative correlation with soil bulk density and capillary porosity, and showed a positive correlation with total porosity and geometric average diameter of water-stable aggregate (GMD), whereas the other three treatments only displayed a significant correlation with the stability of soil water-stable aggregate.
Conclusion: The results suggest that DT, NT and CT have potential to improve soil structure and infiltration capacity compared with CK, and contribute to preventing and controlling soil erosion in sloping farmland of Northeast China.
1 Introduction
Mollisols (called Black soils) which are distributed primarily in the northeast region in China (Xing et al., 2005), renowned worldwide as among the most fertile soil types, are a prominent hallmark of our global agricultural landscape. The northeastern region of China harbors a sprawling expanse of Mollisols, a vital grain production hub responsible for an astonishing one-third of China’s total annual commodity grain output (Sun et al., 2020). Characterized by gently rolling hills with the unique topographic characteristics of gentle slope gradient and long slope length, the surface soil is loose while the subsoil is compact and impermeable, resulting in poor soil erosion resistance. Additionally, the area experiences concentrated summer rainfall, characterized by high precipitation rates (Chen et al., 2014). Unfortunately, due to prolonged unsustainable agricultural practices and suboptimal land management (Li et al., 2020), soil erosion has cast a dark shadow over this region. An alarming 85% of dryland farmland in the Mollisols region comprises sloping terrain with gradients exceeding 0.5°, a challenge exacerbated by sporadic intense summer rainfall and ridge farming practices along the slopes. Consequently, the Mollisols layer has undergone severe degradation, this manifests as a thin Mollisols layer, compact soil, and a decrease in soil organic matter content., leading to the perilous consequences of soil and water loss (SWL) (Wang et al., 2020). This looming threat jeopardizes both food and ecological security in the Mollisols region.
Studies have underscored a disconcerting 60% decline in organic matter content in Mollisols farmland due to prolonged unsustainable agricultural practices, resulting in a 20% decline in natural productivity in the hundred years of large-scale development of Mollisol in northeastern China and the organic matter content in surface soil continues to decline at an average annual rate of 5%. (Duan et al., 2011). Furthermore, the slope farmland within the Mollisols area experiences an annual thinning rate averaging 2–3 mm, culminating in the topsoil having a worryingly thin layer of only about 30 cm. Presently, the degradation of Mollisols can be predominantly attributed to SWL arising from ridge farming along slopes (Li et al., 2019). Implementing effective conservation measures for Mollisols has become an urgent and critical issue, encompassing the arrangement and composition of heterogeneous solid particles, aggregates, and pores, plays a pivotal role in soil erosion resistance (Nunes et al., 2020). Key indicators of soil erosion resistance, such as soil bulk density and soil aggregate stability, hinge on the properties of soil solid, liquid, and gas phases (Ivchenko et al., 2020). Soil pore characteristics mirror how soil structure regulates essential processes like nutrient supply, water retention, infiltration, and gas exchange. An ideal pore structure amplifies soil water infiltration while curtailing surface runoff, thus effectively mitigating soil erosion. Maintaining a rational soil structure is imperative for robust soil erosion prevention and control in Mollisols.
Conservation tillage practices have garnered widespread recognition as potent tools for controlling SWL and elevating soil fertility. These practices wield their impact by reshaping the microtopography of gently sloping farmland, augmenting ground cover, enhancing soil structure, and fortifying soil fertility (Madarász et al., 2021). They exert a conspicuous influence on water storage and soil retention, augmenting infiltration, mitigating drought-related crop setbacks, enhancing soil structure, and stabilizing crop yields (Lampurlanés et al., 2016; Dekemati et al., 2019). Studies have conclusively shown that tillage methods such as wide ridge tillage (Wang et al., 2019), straw mulching with no-tillage (Cunha et al., 1997; Jr and Dick, 2008) and contour ridge tillage (Hung et al., 2023) can effectively curtail surface runoff, enhance soil structure, and heighten water infiltration, thus diminishing soil erosion and safeguarding cultivated land.
Furthermore, antecedent research has ascertained that diverse tillage methods engender distinct effects on soil properties, reshaping the soil environment by altering soil structure, physical and chemical attributes, and hydraulic properties (Liu and Lei, 2019). However, in previous studies, researchers often focused on small-scale changes in tillage practices at the plot level to investigate the impact of tillage methods on soil, with meager comparative investigations into the water storage impacts of disparate tillage measures and the seasonally fluctuating shifts in soil structure stability and infiltration under varying tillage strategies at the field scale. In this experiment, we selected long and gentle sloping farmland and comprehensively evaluated four different tillage methods, namely, wide ridge tillage, no-tillage, contour ridge tillage, and traditional tillage, at the field scale. We studied the dynamic changes in soil aggregate stability and infiltration characteristics during the growing season under the large-scale implementation of these tillage methods. Thereby furnishing a solid theoretical foundation for the effective control of SWL and the preservation of land productivity.
2 Materials and methods
2.1 Study area
The research site is situated at the Hailun Soil and Water Conservation Monitoring and Research Station of the Chinese Academy of Sciences (47°21′N, 126°49′E) in Guangrong Village, Hailun City, Heilongjiang Province. The site lies at an elevation of 226 m and features a typical landform with a slope ranging from 1.5° to 7.0°. The gully density is 2.27 km/km2, and the soil erosion modulus exceeds 1,000 t/(km2·a). The local climate is classified as a temperate continental monsoon climate, with an average annual temperature of 1.5°C. Winters are cold and dry, while summers are hot and rainy with an average annual precipitation of 500 mm, with 70% of rainfall occurring between July and September. The average monthly precipitation in July and August can reach over 125 mm, with an average of around 14 days of rainfall. The site receives an average annual sunshine duration of 2,600–2,800 h and an average annual total radiation of 113 MJ/cm2. The annual effective accumulated temperature (≥10°C) is 2,450°C, and the water table is located at a buried depth of 90 m. The soil type is typical Mollisol (Ren et al., 2024)with discernible layers and an average thickness of the humus horizon is 30 cm. The topsoil organic matter content is 42.1 g/kg.
2.2 Experimental design
The research was conducted on the gently sloping cultivated land in Guangrong Village, Hailun City, where the planting mode is corn and soybean rotation with an annual harvest. The slope of this plots is 3°, 150 m long and 15 m wide. Soybean was the seasonal crop, planted on 10 May 2022. The study included four treatments: No-tillage (NT), Contour ridge tillage (CT), Wide ridge tillage (DT), and Traditional tillage (CK). All treatments were consistent except for tillage practices (Figure 1). No-tillage (NT), Planting along the slope, using a no-till seeder, no tillage was carried out except for sowing. After harvest in autumn, all the straw was directly mulched and returned to the field manually. Contour ridge tillage (CT), after being levelled by a 103-kW large-scale tractor, the ridges should be modified along the contour line. The slope of ridges should be less than 1° and the depth of ploughing layer should be more than 18 cm. Wide ridge tillage (DT), Ridge height is 15 cm, ridge spacing is 130 cm; Plant two rows of crop in each row. Traditional tillage (CK), Making ridges along the slopes, artificial weeding twice without herbicide at seedling stage, medium tillage and ridge setting twice, rotary tillage and ridge setting after autumn harvest, is a common tillage method for local farmers.
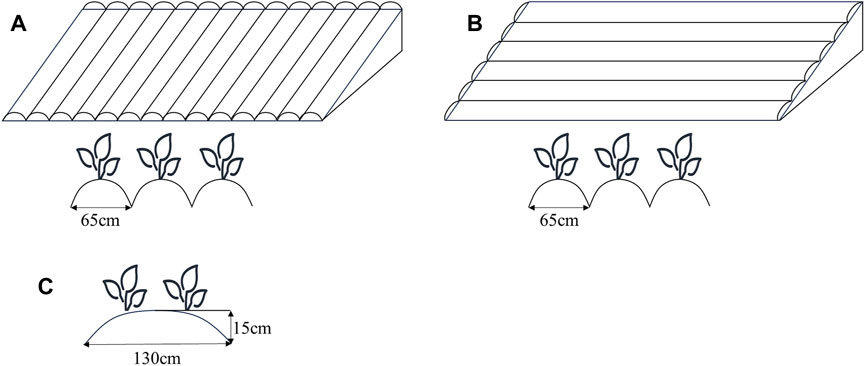
Figure 1. Schematic drawing of four farming practices, (A) Schematic drawing of CK, (B) Schematic drawing of CT, (C) Schematic drawing of DT.
The soil samples were collected five times every 30 days from the early June after the crop is planted, with a sampling depth of 0–10 cm. The 150 m slope was divided into three slopes from top to bottom every 50 m, and the sampling points were set at 25, 75 and 125 m in the middle of each slope. The soil samples were collected three times on each slope and appropriately away from the boundaries between processing, namely, there were 9 sites in each treatment. A three-point sampling method was used to take one undisturbed soil sample from each point for soil water stability aggregate test and two topsoil ring tool samples were taken for soil bulk density, porosity and infiltration characteristics test. Figure 2.
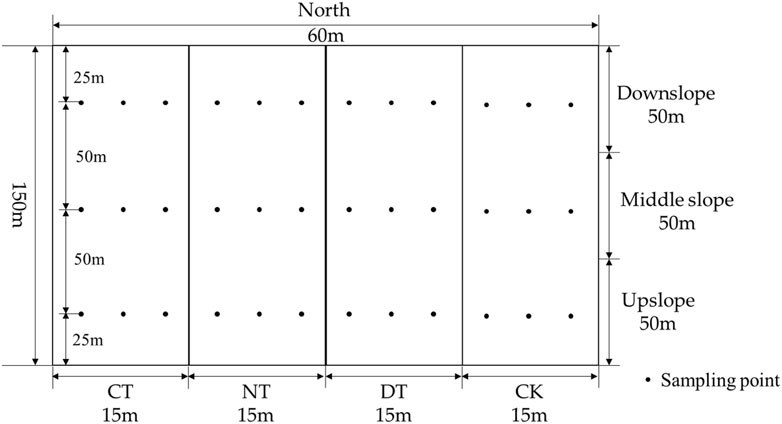
Figure 2. Plot diagram.
2.3 Parameter calculation
Soil bulk density, using ring knife method, one sample is taken every 30 days at each site for testing.
Water-stable aggregates, using wet sieve method, a 50-gram air-dried soil sample was distributed evenly onto the nested sieves to determine >5 mm, 2–5 mm, 1–2 mm, 0.5–1 mm, 0.25–0.5 mm, <0.25 mm water stability aggregate mass fraction. The nest was held at the highest point of the oscillating cylinder, and distilled water was added into each cylinder until the water was above the topmost sieve. Before wet-sieving, the soils were submerged into distilled water for 10 min. During the whole fractionating process, the stroke length in the vertical direction of 4 cm, the oscillation time of 10 min, and the frequency of 900 cycle/h always remained constant (Zhou et al., 2023). Calculate water stability mass fraction (WR0.25), average mass diameter of water-stable aggregate (MWD), geometric average diameter of water-stable aggregate (GMD), fractal dimension of water-stable aggregate (D), using the following Eqs (1)–(4).
Fractal dimension is calculated using the fractal dimension formula derived by Yang Peiling (Yang et al., 1993).
Where Mr>0.25 is the aggregate mass of size >0.25 mm; M is the sum of mass of soil aggregates of different sizes; Xi is the average diameter of a certain grade of aggregate (mm); Wi represents the percentage of aggregate mass of aggregate size in each layer; Mr<Xi is the mass of aggregates with diameter less than Xi; Xmax is the maximum diameter of the aggregate (mm).
Porosity, the soil porosity, soil capillary porosity and soil non-capillary porosity use the following Eqs (5, 6).
Where ρb is soil bulk density (g/cm3); ρa is soil particle density; Φ is the fieldcapacity (%) (measured by ring knife immersion method) (Nemes et al., 2011), f and f1 are the soil porosity (%) and soil capillary porosity (%), respectively.
Soil infiltration rate, the soil sample is immersed in the tank for a duration of 6 h. During immersion, it is important to ensure that the top edge of the ring knife aligns with the water surface. At the designated time, the ring knife was carefully removed, and its cover was lifted. An empty ring knife was then placed atop the soil-filled ring knife to hold water, with the water level maintained approximately 1 mm below the rim of the ring knife, resulting in a water layer of 5 cm in thickness. To prevent any leakage at the junction, it was sealed securely with adhesive tape. These two coupled ring knives were positioned on top of the funnel, while a beaker was positioned beneath the funnel to collect the percolated water. Following the completion of water addition, starting from the moment when the first drop of water was collected in the beaker beneath the funnel, at intervals of 1, 2, 3, 5, 10. Tn minutes (the specific interval depended on the infiltration rate), the beaker beneath the funnel was replaced, and the amount of percolated water, Q1, Q2, Q3. Qn, was measured using a graduated cylinder, ranging from 10 to 100 mL. The height of the water surface inside the hollow ring cutter must remain basically unchanged and the test time should be 90 min. Soil infiltration rate use the following Eqs (7), (8).
Where υ represents the soil infiltration rate of soil samples at a certain moment (mm/min). Qn is the water yield at the n-th determination time (ml); c is the cross-sectional area (cm2); tn is the time interval of the n-th measurement (min).
Where K is saturated water conductivity (permeability coefficient) (mm/min); Qn is the amount of seepage for n-th times (ml); c is the cross-sectional area of the ring cutter (cm2); h is the thickness of water layer (cm); L is the soil layer thickness (cm).
2.4 Infiltration model fitting
In order to assess the practicality of various infiltration models under different cultivation practices on Mollisol slopes, we selected three commonly used infiltration models: the Kostiakov infiltration model, the Philip infiltration model, and the Horton infiltration model, to simulate the soil water infiltration effects.
(1) Kostiakov Infiltration Model (Kostiakov, 1932; Dai et al., 2022), Kostiakov introduced one of the earliest empirical infiltration models. The Kostiakov formula is widely used due to its advantages of having few parameters and a simple structure. The infiltration model is expressed as Eq. (9).
Where t represents the infiltration time (min); y is the infiltration rate (mm/min); a is the empirical infiltration coefficient, representing the infiltration rate when non-saturated soil reaches a relatively stable infiltration rate; b is the empirical infiltration exponent, reflecting the rate of decay of soil water infiltration capacity.
(2) Philip Infiltration Model (Philip, 1957; Jha et al., 2019), The infiltration model proposed by Philip suggests a power-law relationship between infiltration rate and infiltration time during the infiltration process. The infiltration model is expressed as Eq. (10).
Where t represents the infiltration time (min); y is the infiltration rate (mm/min); s is the sorptivity (mm/min); A is the steady-state infiltration rate (mm/min).
(3) Horton Infiltration Model (Horton, 1940; Beven, 2021), Horton’s approach is widely used for simulating the infiltration process. This model not only includes the infiltration process but also incorporates infiltration characteristics. The infiltration model is expressed as Eq. (11).
Where t represents the infiltration time (min); y is the infiltration rate (mm/min); fc is the steady-state infiltration rate (mm/min); f1 is the initial infiltration rate (mm/min); k is the decay parameter, characterizing the degree of decrease in infiltration rate over time.
2.5 Data analysis
Excel 2016 was used for data collation and preliminary analysis. SPSS26.0 was used to analyze the significance of differences among the treatments and the correlation among the indicators, one-way ANOVA analysis was used to test the differences between groups at p < 0.05 significance levels, and LSD method was used to compare the differences at p < 0.05 significance levels. Origin 2022 was used for image drawing.
3 Results
3.1 Influence of tillage measures on soil bulk density and soil porosity
Soil bulk density stands as a pivotal indicator of soil structure. Within this research, we conducted an examination of temporal change in soil bulk density (refer to Figure 3). The DT and CT exhibited a pattern of initial increase, subsequent decrease, followed by a subsequent increase. NT and CK, displayed a progressive upward trend over a period of the 150th day. Throughout the entire growth period, the bulk density of the NT consistently exceeded that of the other three treatments. Meanwhile, the DT showed higher bulk density than the CT and CK at 30th and 60th days, but it reached the minimum at 90th day. Subsequently, the soil bulk density started to increase, eventually surpassed that of the CT and CK at 150th day. Soil porosity emerges as a pivotal indicator of soil structure and function, with notable implications for soil aeration, water transport, and conservation. Figure 4 illustrates the impact of different tillage methods on soil porosity. Soil capillary porosity for each treatment initially increased and subsequently decreased, reaching its peak around 90th day, while total porosity exhibited a tendency to fluctuate and decrease. DT and NT led to an increase in soil bulk density compared to CK, with NT showing a significant increase of up to 21.62%, whereas DT displayed a statistically insignificant increase of up to 6.14%. Furthermore, DT, NT, and CT demonstrated extremely significant improvements in capillary porosity compared to CK, with the highest increases recorded as 37.35%, 60.36%, and 42.66%, respectively. The ratio of capillary porosity to total porosity increased from 50.42% in CK to 58.82% in DT, 58.42% in CT, and 75.85% in NT. Additionally, the ratio between capillary porosity and non-capillary porosity for each treatment also exhibited improvements. The average capillary porosity ratio of CK to NT was 1.07:1, while the ratios of DT, NT, and CT increased to 1.47:1, 3.58:1, and 1.50:1, respectively.
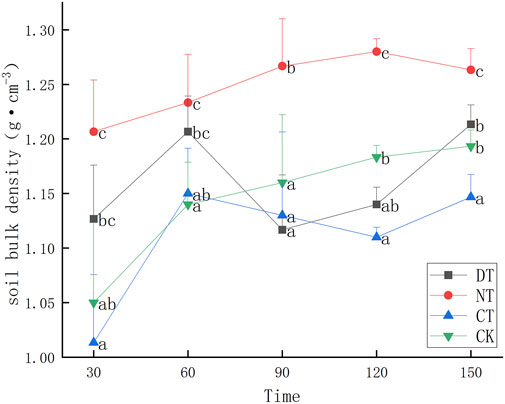
Figure 3. Influence of tillage measures on soil bulk density, different small letters indicate significant difference between different processes at the same time (p < 0.05).
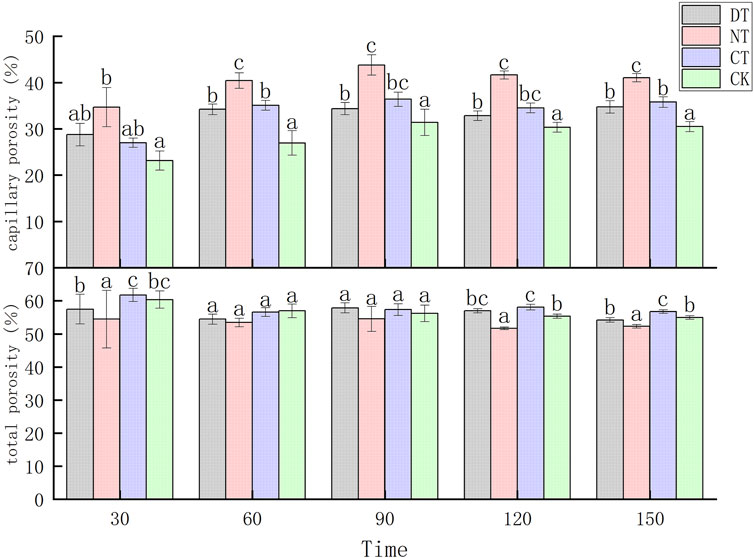
Figure 4. Influence of tillage measures on soil porosity, different small letters indicate significant difference between different processes at the same time (p < 0.05).
3.2 Influences of tillage measures on water-stable soil aggregates
3.2.1 Size distribution of water-stable aggregates
Water-stable soil aggregates represent a vital, comprehensive metric for assessing soil quality, exerting a profound influence on soil structure and functionality (Gao et al., 2019). Figure 5 illustrates the variations in water-stable aggregate content. In this experiment, the water-stable aggregate content for all treatments was highest among aggregates with the sizes less than 0.25 mm. At 30th day mark, both DT and NT exhibited higher water-stable aggregate contents for aggregates >1 mm compared to the CK, with increases of 18.02% and 5.79%, respectively. Additionally, the CT showed a 15.09% increase in water-stable aggregates with the sizes ranging from 0.5 to 5 mm compared to CK. The CK had a higher content of water-stable aggregates with the aggregates sizes <0.5 mm compared to the DT, NT, and CT. At 60th day, the DT exhibited lower water-stable aggregate content for aggregates >0.25 mm compared to the CK. In contrast, the CT showed the opposite trend, with a higher content of water-stable aggregates >0.25 mm than the CK. At 60th day, the NT exhibited higher water-stable aggregates contents for aggregates in the size range of 1–2 mm and 0.25–0.5 mm compared to the CK. However, for other aggregates sizes, the water-stable aggregate content of the NT was lower than that of the CK. At 90th day, the DT showed a lower content of water-stable aggregates in the size range of >0.5 mm compared to the CK. Similarly, the CT exhibited a lower content of water-stable aggregates in the size range of >0.25 mm than the CK. Additionally, the NT had a reduced content of water-stable aggregates in the size range of 0.25–5 mm compared to the CK. At 120th day, the content of water-stable aggregates in the size range of >0.5 mm of DT and CT was higher than that of the CK. These two treatments showed increases of 18.11% and 26.36%, respectively, compared to CK. Additionally, the content of water-stable aggregates in the size range of >0.25 mm of the NT was higher than of the CK, representing a 12.43% increase of NT compared to CK. At 150th day, the content of water-stable aggregates in the size range of >0.5 mm of DT was higher than CK, accompanied by an increase of 5.32%. The content of water-stable aggregates in the size range of >0.25 mm of NT was higher than CK, accompanied by an increase of 6.86%. However, the CT at 150th day, only the content of water-stable aggregates in the size range of >5 mm was higher than the CK.
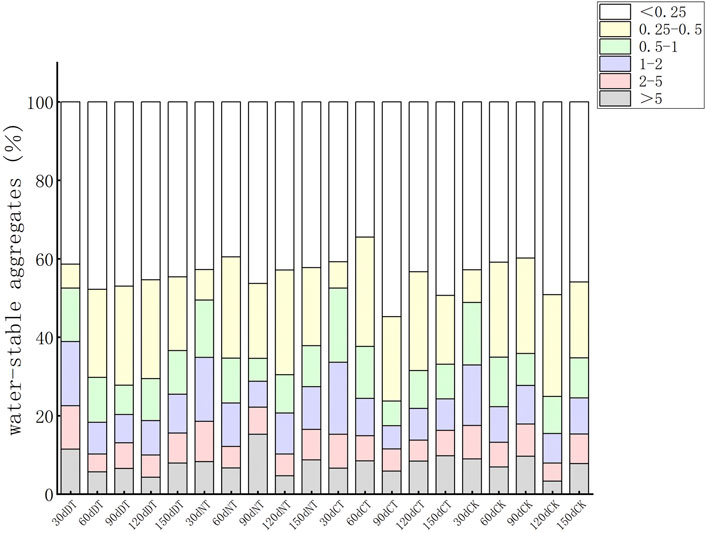
Figure 5. Effect of tillage measures on aggregate size distribution of water-stable aggregates. 30dDT refers to the water-stable aggregate distribution after 30 days under DT measure condition.
3.2.2 The water stability of soil aggregates
The content of water-stable aggregates exceeding 0.25 mm (WR0.25) exhibits a robust correlation with the erosive potential of unit rainfall and plays a pivotal role in influencing soil erosion dynamics (Liu et al., 2020). The trajectory of WR0.25 for each treatment over the 150-day observation period is presented in Table 1. DT initially demonstrated a declining trend, followed by a subsequent upturn, with the nadir occurring around the 60th day. In contrast, NT exhibited an upward trajectory from 30 to 60 days, followed by a decrease from 60 to 90 days. Similarly, CT also displayed an upward pattern from 30 to 60 days, followed by a decline from 60 to 90 days. However, CT registered an increase from 90 to 120 days, followed by a decrease at 120th day, while NT exhibited an upward trend after 90th day. CK, on the other hand, exhibited an initial ascent followed by a subsequent descent. Notably, WR0.25 values for DT, NT, and CT exceeded those of the CK at 30th day, 120th day, and 150th day, but were lower than the CK at 90th day. Furthermore, significant disparities were observed between NT and CT when compared to the CK at 120th day, as well as between DT and NT and the CK at 150th day. Specifically, DT, NT, and CT contributed to WR0.25 increases of 3.4%, 8.18%, and 7.29%, respectively, at 120th day, and 6.38%, 10.97%, and 3.03%, respectively, at 150th day. At 60th day, WR0.25 for DT was less than that of the CK, while NT and CT surpassed the CK in this regard.
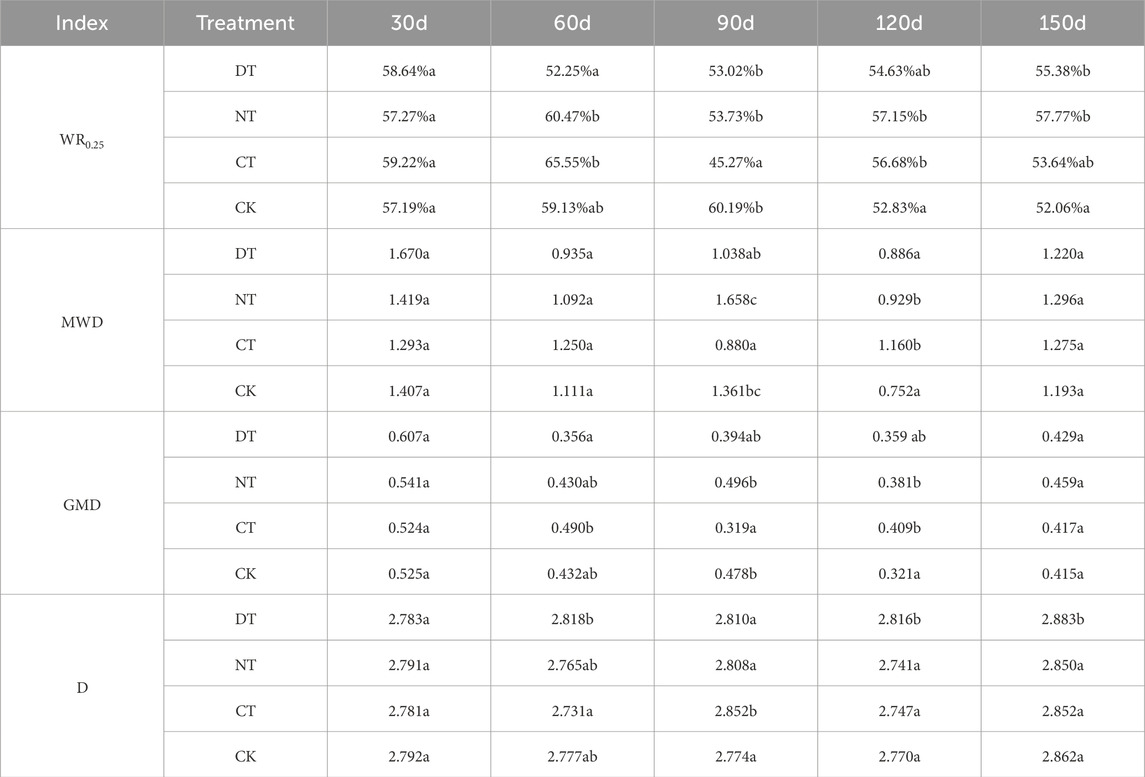
Table 1. Effects of tillage methods on the stability of soil aggregates. Some indicators are abbreviated as follows: Water stable aggregate content with diameter greater than 0.25 mm (WR0.25); Mean mass diameter (MWD); geometric mean diameter (GMD); fractal dimension (D), different small letters indicate significant difference between different processes at the same time (p < 0.05).
Average mass diameter of water-stable aggregate (MWD), geometric average diameter of water-stable aggregate (GMD) and fractal dimension of water-stable aggregate (D) are pivotal metrics for gauging the stability of soil aggregates (Dou et al., 2020; Xia et al., 2022). It is widely accepted that an increase in mean mass diameter and geometric mean diameter indices is associated with a decrease in the distribution and an improvement in the stability of soil aggregates, respectively (Mozaffari et al., 2021). Additionally, a lower fractal dimension signifies enhanced soil structure stability and resistance to erosion. The alterations in MWD, GMD, and D are presented in Table 1. MWD and GMD for DT, NT, and CK exhibited a dynamic pattern during the growth period, characterized by an initial decline, followed by an increase, subsequent decline, and ultimately, an increase. In contrast, CT exhibited an initial decrease, followed by an increase, reaching its lowest point at 90th day. The fractal dimension D of NT and CT exhibited a fluctuating pattern of initial decrease, subsequent increase, further decrease, and final increase. DT displayed a pattern of initial increase, followed by a decrease, and then another increase. CK, on the other hand, demonstrated a pattern of initial decrease followed by an increase, reaching its minimum value at 120th day. Beyond 120 days of cultivation, MWD and GMD for soil aggregates of the DT, NT, and CT all exceeded those of the CK. At 150th day, the MWD of DT, NT, and CT increased by 2.26%, 8.63%, and 6.87%, respectively, compared to the CK, and the GMD of these three treatments increased by 3.37%, 10.6%, and 0.48%, respectively, but these differences were not statistically significant. At 120th day, there is a significant increase in the MWD and GMD of soil aggregates in NT and CT compared to CK. At 30th day, both MWD and GMD of DT and NT surpassed those of the CK, while at 60th day, MWD and GMD of CT exceeded those of the CK. At 90th day, the MWD and GMD of the NT had also surpassed those of the CK. At 30th day, the fractal dimension of the DT, NT, and CT were all slightly lower than that of the CK, although these differences were not statistically significant. At 60th day, 120th day, and 150th day, D values of the NT and CT remained lower than those of the CK, with no statistically significant differences, while the DT exhibited higher D values compared to the CK. At 90th day, D values of all three treatments (DT, NT, and CT) were greater than those of the CK.
3.3 Effects of tillage measures on soil infiltration
3.3.1 Soil infiltration process
In this investigation, we investigated the fluctuations of soil infiltration rate across four treatments, as visually depicted in Figure 6. The findings reveal that all treatments initially experienced a rapid decline in infiltration rate during the early stages of infiltration. Subsequently, this rate of decline gradually tapered, ultimately reaching a plateau. At 30th day, the CK and CT displayed faster initial infiltration rates, whereas the infiltration rate of NT shows an upward trend, ultimately emerging as the treatment with the highest infiltration rate during the later phases of infiltration. At 60th day, 90th day, 120th day and 150th day, the DT and CT exhibited expedited infiltration rates at the initial stage, while the NT consistently maintained a superior infiltration rate during the later stages. At 60th day, 90th day, 120th day, and 150th day, NT exhibited the fastest infiltration rate among four treatments after 45 min of infiltration. At 30th day, NT exhibited the fastest infiltration rate among four treatments after 75 min of infiltration. It is noteworthy that the NT demonstrated the most gradual reduction of soil infiltration rate over the course of the study, while the DT showcased a steeper decline during the initial phase of infiltration.
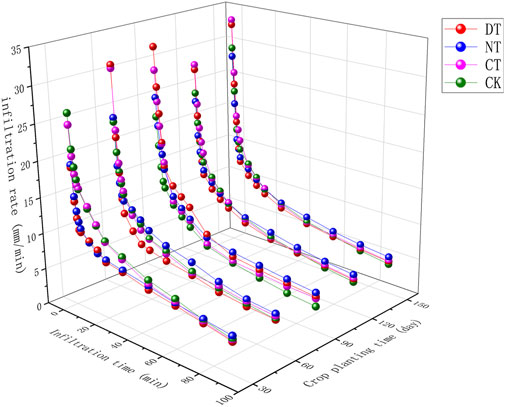
Figure 6. Soil infiltration process under different tillage measures.
The fitting outcomes of three infiltration models for soil infiltration processes under four tillage measures are systematically presented in Table 2. Notably, the parameters ‘b' within the Kostiakov model and ‘k’ within the Horton model both serve as indicators of the rate at which soil water infiltration capacity diminishes. A higher ‘b’ value signifies a swifter decline of infiltration rate, whereas a lower ‘k’ value signifies a more precipitous descent of infiltration (Saito et al., 2016; Amami et al., 2021). It is noteworthy that the ‘b’ values associated with the CT consistently register lower values compared to the CK across the entire growth period. With the exception of the 30-day interval, the ‘b’ values pertaining to the DT are inferior to those of the CK during the remaining time periods. Furthermore, the ‘k’ values affiliated with the DT, CT, and NT all surpass those of the CK. Collectively, these findings point to the capacity of the DT, CT, and NT to, to some extent, amplify soil infiltration rates. Within the Philip model, the variable‘s' stands representative of sorptivity (Santra et al., 2021), with its numeric magnitude contingent on the initial infiltration rate, inextricably tied to soil permeability and infiltration capacity (Amami et al., 2021). Notably, for both the CT and DT, sorptivity exceeds that of the CK after 60 days, signifying an enhancement in soil permeability attributable to these two treatments. The coefficient of determination (R2) emerges as a valuable metric for assessing the goodness-of-fit between each infiltration model and the observed soil infiltration process curve. Elevated R2 values signal superior model performance, with the highest R2 values found in the Horton model, spanning a range from 0.785 to 0.963, averaging 0.896, and thus outstripping the other two models. In second place, the Kostiakov model boasts R2 values ranging from 0.679 to 0.891, with an average of 0.771. Conversely, the Philip model exhibits the lowest R2 values within the trio of models, oscillating between 0.179 and 0.825, with an average of 0.470. These results distinctly underscore the superiority of the Horton model in terms of simulation performance, rendering it the most fitting choice for modeling the observed infiltration process curve under this experimental context.
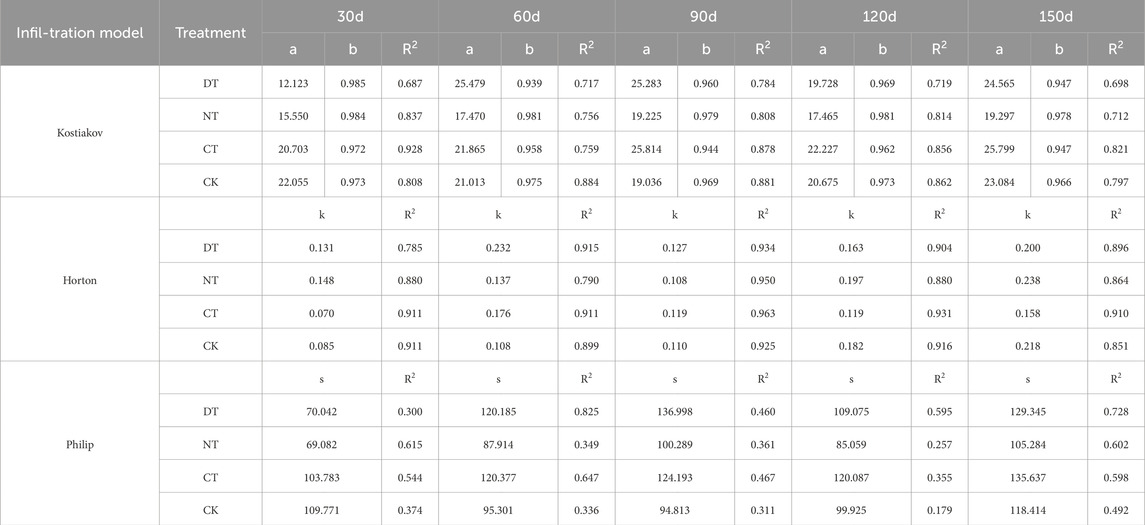
Table 2. Soil infiltration process curve model fitting.
3.3.2 Soil infiltration rate and saturated water conductivity
Table 3 provides a comprehensive overview of the influence of various tillage methods on soil infiltration rates. Over the span of 150th day, the initial infiltration rates for DT, NT, and CT underwent an initial increase followed by a subsequent decline. Notably, DT achieved its zenith at approximately 90th day, NT at around 120th day, and CT at around 60th day, while CK experienced a consistent reduction throughout the testing period. Except for the 30-day time point, the initial infiltration rates observed of the DT, NT, and CT displayed marked increases of contrast to the CK. The improvements of the initial infiltration rates for DT, NT, and CT of comparison to CK were evident. At the 150th day, DT, NT and CT showcased substantial enhancements of approximately 32.43%, 37.03% and 29.46%. The average infiltration rate across the entire growth period was consistently superior for DT, NT, and CT compared to CK. In particular, the stable infiltration rate within the NT consistently outpaced that of the CK over the 150-day duration. Of the DT, the stable infiltration rate exceeded that of the CK after 90th day, mirroring a similar trend of the CT, where the stable infiltration rate surpassed that of the CK after the 60th day. The stable infiltration rate and average infiltration rate for DT and CT exhibited an initial increase followed by a subsequent decrease, with DT reaching its zenith at approximately 90th day and CT at around 60th day. Meanwhile, NT displayed a sustained upward trajectory within the 150-day period, while CK’s trend was characterized by a gradual decline. In contrast to CK, the stable infiltration rate for DT, NT, and CT exhibited remarkable improvements of 28.57%, 52.94%, and 27.73%, respectively, at the 150th day. Furthermore, the average infiltration rate showed noticeable enhancements of 21.37%, 37.58%, and 18.28%, respectively, at the same juncture. The saturated hydraulic conductivity for DT and CT displayed a diminishing pattern within the 150-day timeframe, while NT and CK exhibited an initial decline followed by an upswing. It is noteworthy that DT, NT, and CT exhibited slight but statistically insignificant improvements of comparison to CK, with increases of approximately 33.44%, 33.77%, and 64.36%, respectively, at the 150th day.
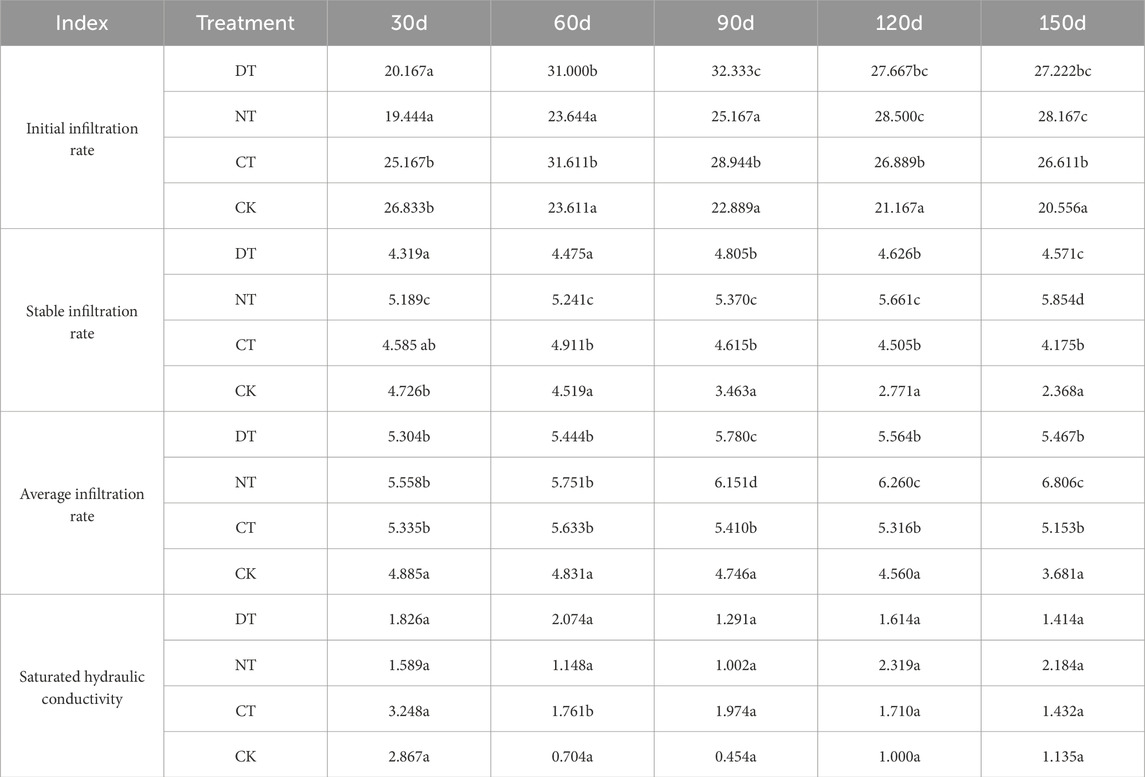
Table 3. Effects of tillage measures on soil infiltration rate and saturated water conductivity, different small letters indicate significant difference between different processes at the same time (p < 0.05).
3.4 Correlation between soil structure and infiltration indices
The outcomes illustrated in Figure 7 unveil the interplay between various soil indices. Although the NT displayed a similar trend, the correlation in this case did not attain statistical significance, of the DT, a noteworthy negative correlation was observed between WR0.25 and capillary porosity, as well as fractal dimension D, while it exhibited a positive correlation with MWD, GMD, and saturated hydraulic conductivity. A significant negative correlation materialized between WR0.25 and stable infiltration rate and mean infiltration rate of NT. Both MWD and GMD of CT exhibited a substantial negative correlation with soil bulk density and capillary porosity, but exhibited positive correlations with total porosity. Furthermore, MWD demonstrated a positive association with WR0.25, while GMD displayed a positive correlation with saturated hydraulic conductivity. Fractal dimension exhibited a positive correlation with bulk density but a negative correlation with total porosity and WR0.25 of the CT. Both MWD and GMD of CK displayed significant negative correlations with soil bulk density and capillary porosity, but exhibited positive correlations with total porosity. Additionally, MWD demonstrated a negative correlation with initial infiltration rate, while GMD displayed a positive correlation with saturated hydraulic conductivity. The associations among soil infiltration indices exhibited variations across treatments. Of the DT, a substantial positive correlation surfaced between initial infiltration rate and capillary porosity, alongside a significant positive correlation between mean infiltration rate and stable infiltration rate. Within the NT, significant positive correlations were observed between initial infiltration rate and stable infiltration rate, as well as between mean infiltration rate and saturated hydraulic conductivity. Robust positive correlations emerged among initial infiltration rate, stable infiltration rate, and mean infiltration rate of CT and CK. Furthermore, initial infiltration rate of CT was positively correlated with soil bulk density and capillary porosity but negatively correlated with total porosity. Stable infiltration rate and saturated hydraulic conductivity of the CK exhibited significant negative correlations with soil bulk density and capillary porosity, while positively correlating with total porosity and initial infiltration rate.
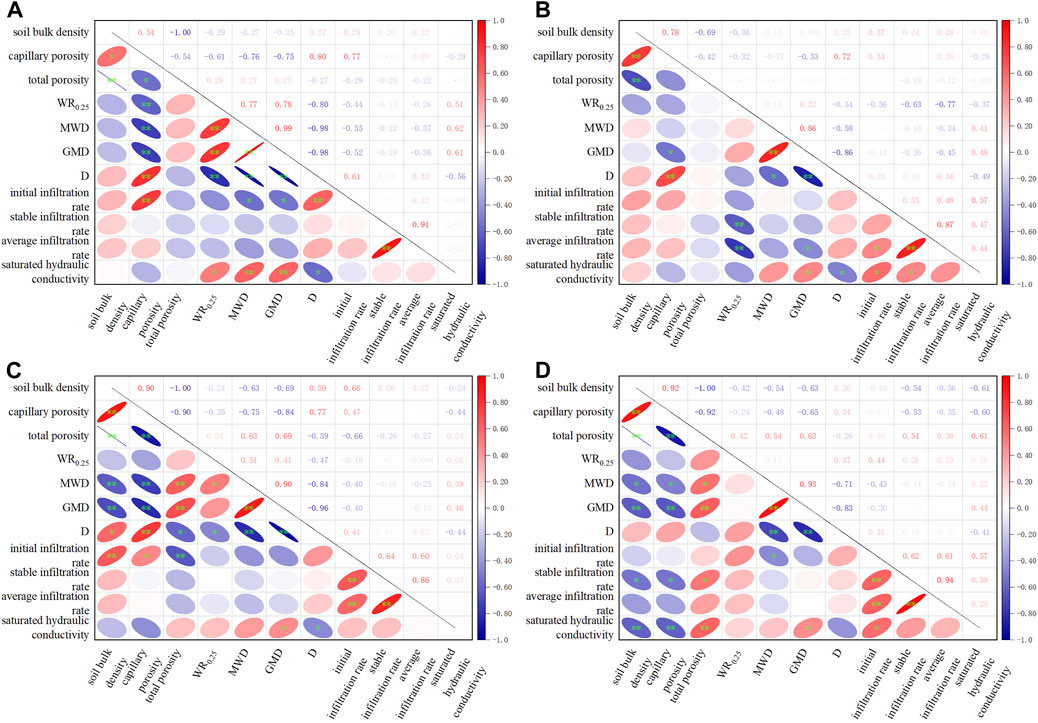
Figure 7. Correlations between soil structure and infiltration indices. In this figure, some indicators are abbreviated as follows: Water stable aggregate content with diameter greater than 0.25 mm (WR0.25); Mean mass diameter (MWD); geometric mean diameter (GMD); fractal dimension (D); * indicates that there is a significant correlation between indicators. Subfigure (A–D) refer to DT, NT, CT and CK.
4 Discussions
4.1 Effects of tillage methods on soil structure
Various tillage practices exert a significant influence on soil bulk density (Romaneckas et al., 2015). Soil bulk density exhibits continuous fluctuations throughout the entire growth period under the influence of different tillage measures. These fluctuations can be attributed to man-made disturbances such as mechanical tillage and compaction or the subsequent increase in soil bulk density following rainfall leaching (Moreira et al., 2020). It is worth noting that both DT and NT were observed to elevate soil bulk density, consequently enhancing soil erosion resistance. However, the resulting surge in soil bulk density and compaction may impede crop root development and impact various physiological activities within crops, ultimately leading to diminished crop yields. Interestingly, a study by (Ur et al., 2020). Reported that long-term reduced and no-tillage practices could potentially enhance crop yields to some extent, suggesting that the effects of tillage on soil structure may vary depending on the duration of the tillage practice, long-term no-tillage may reduce soil bulk density, but it is also possible that the impact of no-tillage on soil bulk density does not reach the threshold for affecting crop growth (Blanco-Canqui and Ruis, 2018). Consequently, further research is warranted to delve into the ramifications of tillage practices on soil bulk density and the corresponding crop yield responses to these alterations. While some studies have underscored the positive impacts of DT and NT on soil structure and erosion resistance, others, such as the study by (Zhang et al., 2021), have indicated that the alternating use of no-tillage and subsoiling can yield favorable outcomes for both soil structure and crop yields. Hence, adopting a rotational approach among various tillage measures may present a promising strategy for enhancing farmland soil quality. Soil pore structure stands as a pivotal factor reflective of soil structure, with soil pore distribution intricately affecting the migration and retention of soil water. This, in turn, exerts a substantial influence on the infiltration of rain or irrigation water (Kreiselmeier et al., 2019). The humaninduced impact on soil porosity is considerable, as mechanical tillage tends to increase total soil porosity while concurrently inflicting some damage upon capillary pores (Bonini et al., 2022). This damage results in a diminished proportion of capillary pores within the overall pore structure, potentially adverse to crop growth. Conversely, the implementation of DT, NT, and CT practices serves to reduce the overall soil porosity while simultaneously augmenting the fraction of soil capillary porosity. This nuanced shift of pore structure composition holds the potential to confer certain advantages for crop growth.
Soil aggregates are intricately linked to soil quality, with optimal soil quality necessitating both an appropriate size of soil aggregates and a requisite quantity of large-aggregates size soil aggregates. This combination ensures that the soil possesses a favorable pore structure, conducive to the growth and development of crops (Zhao and Hu, 2022). Regarding soil aggregate stability and the macroaggregate content, a general decreasing trend was observed at the 60 and 90th day marks. This decline can be attributed to the rainfall in July and August, which led to the fragmentation of soil macroaggregates, thereby diminishing soil aggregate stability. It is worth noting that the rainfall intensity in July was marginally lower than that in August. Consequently, at the 60th day point, the NT exhibited enhanced erosion resistance, with the decomposition of straw facilitating the transformation of microaggregates into macroaggregates. This transformation resulted in a slight upturn in aggregate stability and macroaggregate content within the NT. DT and NT also contributed to an incremental improvement in aggregate stability, aligning with the findings of (Lei et al., 2020). Li et al. also found that no-tillage primarily enhances soil aggregate stability by reducing disturbance, increasing the accumulation of surface organic matter, and mitigating fluctuations in soil moisture and temperature near the surface (Li et al., 2019). However, it is important to highlight that the current treatments employed in this experiment did not yield a statistically significant enhancement in soil aggregate stability. Several factors may have contributed to this outcome, including slope gradient, crop types, the duration of the experiment, and the rainfall patterns during the specific year. Both no-tillage and wide ridge tillage exhibit the potential to shield soil structure from damage, thereby sustaining soil aggregate stability. Prolonged tillage practices can maintain soil aggregate stability over more extended periods, magnifying the differences in soil aggregate stability observed in multiyear experiments. In this study, no-tillage emerged as the most favorable method for enhancing soil pore structure and soil aggregate stability, despite its associated drawback of soil compaction, which, in turn, had a negative impact on crop growth. Therefore, it is recommended to undertake long-term, location-specific research to comprehensively investigate the influence of tillage methods on crop yields.
4.2 Effects of tillage methods on soil infiltration characteristics
The soil infiltration rate plays a pivotal role in surface runoff and exerts a substantial influence on SWL in sloping farmland. Typically, the soil water infiltration process follows a pattern characterized by an initial rapid infiltration rate that subsequently diminishes, eventually stabilizing (Xin et al., 2019). The results from our experiment revealed that the NT, in comparison to CK, demonstrated an enhanced soil infiltration capacity, corroborating the findings of (Ranaivoson et al., 2017), who attributed this enhancement to straw mulching and no-tillage practices, which effectively mitigated surface runoff while bolstering soil structure. As observed in Chen et al.'s study (Chen et al., 2014), loose soil on ridge platforms exhibited a high infiltration rate, and consequently, expanding the ridge platform area, as achieved of DT, positively impacted soil infiltration, augmenting the infiltration rate. CT, by altering the ridge orientation of sloping farmland, curtailed surface runoff to some extent, consequently enhancing the soil infiltration rate. Moreover, both DT and CT moderately improved soil structure, further fortifying soil infiltration rates. Notably, the infiltration rates of the DT, NT, and CT all exhibited increases during the rainy season. This phenomenon can be attributed to crop roots penetrating the soil, creating pores that enhance water infiltration pathways and thus improving the soil infiltration capacity of sloping farmland (Carvalho et al., 2015). Additionally, the NT involved straw mulching, and the continuous decomposition of straw gradually improved soil structure, optimizing soil infiltration performance (Wilk et al., 2018). In contrast, the infiltration rate of the CK consistently decreased throughout the entire growth period. This decline could be attributed to the weaker erosion resistance of the CK, leading to rainfall-induced microaggregates blocking soil pores. Furthermore, high-intensity erosion disrupted soil structure, resulting in reduced soil porosity and, consequently, decreased soil infiltration rates. In contrast, the DT, NT, and CT exhibited stronger erosion resistance, thereby preventing soil structure degradation caused by erosion. Among the three infiltration models (Kostiakov, Philip, Horton), the Horton model exhibited reasonable fitting performance in this experiment, which diverged from the findings of Albalasmeh and Thomas (Thomas et al., 2020; Albalasmeh et al., 2022). The Kostiakov model proved to be the most suitable for fitting the infiltration process curve in this experiment, aligning with similarities observed in Thomas’s study (Thomas et al., 2020). Additionally, certain studies suggest that in healthy grasscovered lawn soils, the Horton model boasts the best predictive capability for measured and cumulative infiltration (Shukla et al., 2003). Discrepancies in model performance can be attributed to varying experimental conditions, such as soil texture, rainfall intensity, crop type, and tillage practices. Soil texture and rainfall intensity directly influence soil infiltration properties, while tillage practices significantly modify soil properties and infiltration characteristics. Consequently, the superiority of different infiltration models varies across different experiments. Research underscores that the performance of Kostiakov, Horton, and Philip models is highly contingent on the data collection location (Dashtaki et al., 2009), which is the primary factor contributing to these results in our experiment. Notably, the Philip model exhibited the poorest fit, suggesting that some of its underlying theoretical assumptions may not hold under these field conditions, rendering it unsuitable for this specific context.
4.3 Correlation between soil structure and infiltration characteristics
Schlüter’s research on the impact of soil compaction on porosity has demonstrated that higher soil compaction is associated with increased bulk density and reduced porosity (Schlüter and Vogel, 2017). However, it is noteworthy that capillary porosity increased with the rise in bulk density in our study. This phenomenon can be attributed to the shift in pore size from large to small as soil bulk density increased, as a result, the non-capillary porosity decreases, and a part of the non-capillary porosity is transformed into capillary porosity, which increases the capillary porosity. In this paper, with the increase of soil bulk density, total porosity decreases while capillary porosity increases, indicating that non-capillary porosity decreases with the increase of soil bulk density, thus supporting the above view. Nevertheless, it is plausible that there exists a threshold for this relationship, beyond which further increases in soil bulk density may lead to a negative correlation with capillary pores. The correlation between soil bulk density and aggregate stability displayed a negative trend, consistent with the findings of (Liu et al., 2022), However, in this study, the correlation between bulk density and aggregate stability of the DT and NT was not statistically significant, possibly due to the relatively short duration of the experiment. Under the 1-year treatment of altering tillage practices, certain physical properties of the soil did not undergo significant changes, such as soil aggregate stability, resulting in insignificant differences among treatments. This necessitates further research through long-term field experiments to make accurate assessments. Of the CK, a negative correlation was observed between soil infiltration rate and capillary porosity, while a positive correlation was observed with total porosity. While an increase in porosity can enhance infiltration, it is crucial to recognize that crop growth is highly dependent on capillary porosity (Chhina et al., 2019). Therefore, increasing the proportion of capillary porosity while simultaneously increasing total porosity is of paramount importance. Notably, the DT, NT, and CT all exhibited improvements in this regard, demonstrating a positive correlation between infiltration rate and capillary porosity. This suggests that while enhancing soil infiltration capacity, these treatments also improved soil capillary porosity. (Menon et al., 2020). Found that soil aggregate stability was positively correlated with all types of pores. However, in our study, capillary porosity exhibited a negative correlation with soil aggregate stability. This discrepancy may be attributed to differences in soil quality. Additionally, the experimental area in our study experienced severe SWL, leading to the loss of smaller aggregates of the soil. Consequently, soil water-stable aggregates exhibited a more stable trend due to the reduction in small aggregate content. Moreover, the decrease in small aggregate content resulted in an increase in total porosity but a decrease in capillary porosity.
5 Conclusion
Tillage practices, including no-tillage and wide ridge tillage, have been demonstrated to enhance soil porosity and improve soil bulk density compared to traditional tillage methods. Additionally, they can partially increase soil aggregate stability, thereby alleviating the detrimental impacts of slope erosion on soil structure. Among these practices, straw mulching and no-tillage exerted the most substantial influence on enhancing soil porosity and aggregate stability. It is possible to alleviate the damage to soil structure caused by precipitation during heavy erosion seasons at the field scale. However, it is important to note that in this experiment, soil bulk density exhibited a significant increase, which had certain adverse effects on crop growth. All three tillage practices had positive effects on soil infiltration, namely, no-tillage, contour ridge tillage, and wide ridge tillage, when compared to local traditional farming methods. These practices resulted in enhanced soil infiltration, so that fields can increase water infiltration and reduce surface runoff during the rainy season, and mitigated SWL at the field scale. Contour ridge tillage showed the potential to improve the initial infiltration rate, although its effect became less significant in the later stages of infiltration. On the other hand, straw mulching and no-tillage had the most pronounced impact on stable infiltration rates.
Data availability statement
The original contributions presented in the study are included in the article/supplementary material, further inquiries can be directed to the corresponding authors.
Author contributions
CX: Conceptualization, Data curation, Formal Analysis, Investigation, Methodology, Resources, Software, Validation, Writing–original draft. WL: Conceptualization, Methodology, Writing–review and editing. JL: Conceptualization, Funding acquisition, Methodology, Supervision, Writing–review and editing. JW: Resources, Writing–review and editing. YZ: Validation, Writing–review and editing. RK: Validation, Writing–review and editing.
Funding
The author(s) declare financial support was received for the research, authorship, and/or publication of this article. This research was funded by The National Key Research and Development Program of China, grant number 2021YFD1500804.
Conflict of interest
The authors declare that the research was conducted in the absence of any commercial or financial relationships that could be construed as a potential conflict of interest.
Publisher’s note
All claims expressed in this article are solely those of the authors and do not necessarily represent those of their affiliated organizations, or those of the publisher, the editors and the reviewers. Any product that may be evaluated in this article, or claim that may be made by its manufacturer, is not guaranteed or endorsed by the publisher.
References
Albalasmeh, A. A., Alghzawi, M. I. Z., Gharaibeh, M. A., and Mohawesh, O. (2022). Assessment of the effect of irrigation with treated wastewater on soil properties and on the performance of infiltration models. Water (Basel) 14, 1520. doi:10.3390/W14091520
Amami, R., Ibrahimi, K., Sher, F., Milham, P., Ghazouani, H., Chehaibi, S., et al. (2021). Impacts of different tillage practices on soil water infiltration for sustainable agriculture. Sustainability 13, 3155. doi:10.3390/SU13063155
Beven, K. (2021). The era of infiltration. Hydrol. Earth Syst. Sci. 25, 851–866. doi:10.5194/hess-25-851-2021
Blanco-Canqui, H., and Ruis, S. J. (2018). No-tillage and soil physical environment. Geoderma 326, 164–200. doi:10.1016/j.geoderma.2018.03.011
Bonini, D. L. F., Lustosa, C. M., Ferreira, C. G. A., Ricardo, D. O. B., Miguel, C., Nunes, C. J. L., et al. (2022). Soil structure changes induced by tillage and reduction of machinery traffic on sugarcane – a diversity of assessment scales. Soil Tillage Res. 223, 105469. doi:10.1016/J.STILL.2022.105469
Carvalho, D. F. D., Eduardo, E. N., Almeida, W. S. D., Santos, L. A. F., and Sobrinho, T. A. (2015). Water erosion and soil water infiltration in different stages of corn development and tillage systems. Rev. Bras. De. Eng. Agrícola E Ambient. - Agriambi 19, 1072–1078. doi:10.1590/1807-1929/agriambi.v19n11p1072-1078
Chen, Q., Yuriy, S. K., Chen, Y., Li, X., Li, H., Song, C., et al. (2014). Seasonal variation of soil structure and water conductivity and its water retention effect with little or no tillage. Acta Pedol. Sin. 51, 11–21. doi:10.11766/trxb201304190189
Chhina, L. K., Gupta, R. K., and Kukal, S. S. (2019). Soil structural attributes in relation to land use in shiwaliks region of northwest India. J. Soil Water Conserv. 18, 22–26. doi:10.5958/2455-7145.2019.00003.1
Cunha, M. J., Espejo, S. R., Hernanz, M. J. L., and Sánchez, G. V. (1997). Effect of various soil tillage systems on structure development in a haploxeralf of central Spain. Soil Technol. 11, 197–204. doi:10.1016/s0933-3630(96)00131-6
Dai, Y., Guo, J., Li, Y., Dong, Z., and Li, H. (2022). Soil physical and chemical properties affected by long-term grazing on the desert steppe of inner Mongolia, China. Catena (Amst) 211, 105996–106012. doi:10.1016/J.CATENA.2021.105996
Dashtaki, S. G., Homaee, M., Mahdian, M. H., and Kouchakzadeh, M. (2009). Site-dependence performance of infiltration models. Water Resour. Manag. 23, 2777–2790. doi:10.1007/s11269-009-9408-3
Dekemati, I., Simon, B., Vinogradov, S., and Birkás, M. (2019). The effects of various tillage treatments on soil physical properties, earthworm abundance and crop yield in Hungary. Soil Tillage Res. 194, 104334. doi:10.1016/j.still.2019.104334
Dou, Y., Yang, Y., An, S., and Zhu, Z. (2020). Effects of different vegetation restoration measures on soil aggregate stability and erodibility on the loess plateau, China. Catena (Amst) 185, 104294. doi:10.1016/j.catena.2019.104294
Duan, X., Xie, Y., Ou, T., and Lu, H. (2011). Effects of soil erosion on long-term soil productivity in the black soil region of northeastern China. Catena (Amst) 87, 268–275. doi:10.1016/j.catena.2011.06.012
Gao, L., Wang, B., Li, S., Wu, H., Wu, X., Liang, G., et al. (2019). Soil wet aggregate distribution and pore size distribution under different tillage systems after 16 years in the loess plateau of China. Catena (Amst) 173, 38–47. doi:10.1016/j.catena.2018.09.043
Horton, R. (1940). Approach toward a physical interpretation of infiltration capacity. Soil Sci. Soc., 339–417.
Hung, D. V., Nguyen, L., Göran, B., Sigrun, D. A., Rachmat, M., Thach, N. V., et al. (2023). Agroforestry with contour planting of grass contributes to terrace formation and conservation of soil and nutrients on sloping land. Agric. Ecosyst. Environ. 345, 108323. doi:10.1016/J.AGEE.2022.108323
Ivchenko, V. K., Polosina, V. A., Eremina, E. V., Lugantseva, M. V., and Ilchenko, O. I. (2020). Tillage influence of on the qualitative composition of soil structure. Iop Conf. Ser. Earth Environ. Sci. 548, 052045. doi:10.1088/1755-1315/548/5/052045
Jha, M. K., Mahapatra, S., Mohan, C., and Pohshna, C. (2019). Infiltration characteristics of lateritic vadose zones: field experiments and modeling. Soil Tillage Res. 187, 219–234. doi:10.1016/j.still.2018.12.007
Jr, G. B. T., and Dick, W. A. (2008). No-tillage crop production: a revolution in agriculture. Agron. J. 100, 153–165. doi:10.2134/agronj2007.0005c
Kostiakov, A. V. (1932). On the dynamics of the coefficient of water percolation in soils and on the necessity for studying it from a dynamics point of view for purposes of amelioration. Trans. Sixth Comm. Int. Soc. Soil Sci., 15–21.
Kreiselmeier, J., Chandrasekhar, P., Weninger, T., Schwen, A., Julich, S., Feger, K., et al. (2019). Quantification of soil pore dynamics during a winter wheat cropping cycle under different tillage regimes. Soil Tillage Res. 192, 222–232. doi:10.1016/j.still.2019.05.014
Lampurlanés, J., Plaza-Bonilla, D., Álvaro-Fuentes, J., and Cantero-Martínez, C. (2016). Long-term analysis of soil water conservation and crop yield under different tillage systems in mediterranean rainfed conditions. Field Crops Res. 189, 59–67. doi:10.1016/j.fcr.2016.02.010
Lei, Y., Jiang, X., Ji, X., Zhou, L., Li, S., Chen, C., et al. (2020). Distribution of water-stable aggregates under soil tillage practices in a black soil hillslope cropland in northeast China. J. Soils Sediments 20, 24–31. doi:10.1007/s11368-019-02361-z
Li, H., Liao, X., Zhu, H., Wei, X., and Shao, M. (2019a). Soil physical and hydraulic properties under different land uses in the black soil region of northeast China. Can. J. Soil Sci. 99, 406–419. doi:10.1139/cjss-2019-0039
Li, H., Zhu, H., Qiu, L., Wei, X., Liu, B., and Shao, M. (2020). Response of soil oc, n and p to land-use change and erosion in the black soil region of the northeast China. Agric. Ecosyst. Environ. 302, 107081. doi:10.1016/j.agee.2020.107081
Li, Y., Li, Z., Cui, S., Jagadamma, S., and Zhang, Q. (2019b). Residue retention and minimum tillage improve physical environment of the soil in croplands: a global meta-analysis. Soil and Tillage Res. 194, 104292. doi:10.1016/j.still.2019.06.009
Liu, C., Li, Z., Fu, S., Ding, L., and Wu, G. (2020). Influence of soil aggregate characteristics on the sediment transport capacity of overland flow. Geoderma 369, 114338. doi:10.1016/j.geoderma.2020.114338
Liu, Z., Cao, S., Wang, N., Wang, H., Sun, Z., Luo, Y., et al. (2022). Effects of different tillage practices on soil structure and nutrient content in newly cultivated land. Southwest Agric. J., 1–12. doi:10.16213/j.cnki.scjas.2023.1.005
Liu, Z., and Lei, N. (2019). Effect of different tillage managements on soil physicochemical properties and crop yield. Iop Conf. Ser. Earth Environ. Sci. 384, 012175. doi:10.1088/1755-1315/384/1/012175
Madarász, B., Jakab, G., Szalai, Z., Juhos, K., Kotroczó, Z., Tóth, A., et al. (2021). Long-term effects of conservation tillage on soil erosion in central europe: a random forest-based approach. Soil Tillage Res. 209, 104959. doi:10.1016/J.STILL.2021.104959
Menon, M., Mawodza, T., Rabbani, A., Blaud, A., Lair, G. J., Babaei, M., et al. (2020). Pore system characteristics of soil aggregates and their relevance to aggregate stability. Geoderma 366, 114259. doi:10.1016/j.geoderma.2020.114259
Moreira, W. H., Tormena, C. A., Lima, R. P. D., Anghinoni, G., and Imhoff, S. (2020). The influence of sowing furrow opening and wetting and drying cycles on soil physical quality under no-tillage in southern Brazil. Soil Tillage Res. 204, 104711. doi:10.1016/j.still.2020.104711
Mozaffari, H., Rezaei, M., and Ostovari, Y. (2021). Soil sensitivity to wind and water erosion as affected by land use in southern Iran. Earth 2, 287–302. doi:10.3390/EARTH2020017
Nemes, A., Pachepsky, Y. A., and Timlin, D. J. (2011). Toward improving global estimates of field soil water capacity. Soil Sci. Soc. Am. J. 75, 807–812. doi:10.2136/sssaj2010.0251
Nunes, M. R., Karlen, D. L., and Moorman, T. B. (2020). Tillage intensity effects on soil structure indicators—a us meta-analysis. Sustainability 12, 2071. doi:10.3390/su12052071
Philip, J. (1957). The theory of infiltration: 1. The infiltration equation and its solution. Soil Sci., 335–345.
Ranaivoson, L., Naudin, K., Ripoche, A., Affholder, F., Rabeharisoa, L., and Corbeels, M. (2017). Agro-ecological functions of crop residues under conservation agriculture. A review. Agron. Sustain Dev. 37, 26–17. doi:10.1007/s13593-017-0432-z
Ren, L., Yao, S., Sun, J., and Zhou, H. (2024). Assessment of soil aggregate pore structure after 8 years of cultivation from the parent material of a mollisol. Catena (Amst) 235, 107699–107710. doi:10.1016/J.CATENA.2023.107699
Romaneckas, K., Šarauskis, E., Avižienytė, D., Buragienė, S., and Arney, D. (2015). The main physical properties of planosol in maize (zea mays l.) Cultivation under different long-term reduced tillage practices in the baltic region. J. Integr. Agric. 14, 1309–1320. doi:10.1016/S2095-3119(14)60962-X
Saito, T., Yasuda, H., Suganuma, H., Inosako, K., Abe, Y., and Kojima, T. (2016). Predicting soil infiltration and horizon thickness for a large-scale water balance model in an arid environment. Water (Basel) 8, 96. doi:10.3390/w8030096
Santra, P., Kumar, M., and Kumawat, R. N. (2021). Characterization and modeling of infiltration characteristics of soils under major land use systems in hot arid region of India. Agric. Res. 10, 417–433. doi:10.1007/S40003-020-00511-1
Schlüter, S., and Vogel, H. (2017). Analysis of soil structure turnover with garnet particles and x-ray microtomography. Plos One 11, e0159948. doi:10.1371/journal.pone.0159948
Shukla, M. K., Lal, R., and Unkefer, P. (2003). Experimental evaluation of infiltration models for different land use and soil management systems. Soil Sci. 168, 178–191. doi:10.1097/01.ss.0000058890.60072.7c
Sun, Q., Meng, J., Sarkar, B., Lan, Y., Lin, L., Li, H., et al. (2020). Long-term influence of maize stover and its derived biochar on soil structure and organo-mineral complexes in northeast China. Environ. Sci. Pollut. Res. Int. 27, 28374–28383. doi:10.1007/s11356-020-08171-y
Thomas, A., Ofosu, A. E., Emmanuel, A., De-Graft, A. J., Ayine, A. G., Asare, A., et al. (2020). Comparison and estimation of four infiltration models. Open J. Soil Sci. 10, 45–57. doi:10.4236/ojss.2020.102003
Ur, R. S., Sohail, I. S., Saifullah, K. K., and Muhammad, A. (2020). Long term reduced tillage improved soil physical characteristics and crop productivity in subtropical dryland of Pakistan. Int. J. Agric. Biol. 24, 229–237. doi:10.17957/IJAB/15.1429
Wang, B., Zhao, X., Wang, X., Zhang, Z., Yi, L., and Hu, S. (2020). Spatial and temporal variability of soil erosion in the black soil region of northeast China from 2000 to 2015. Environ. Monit. Assess. 192, 370. doi:10.1007/s10661-020-08298-y
Wang, L., Shi, H., Liu, G., Zheng, F., Tan, C., Zhang, X., et al. (2019). Comparison of soil erosion on slope of wide ridge and narrow ridge cultivation in black soil area. Trans. Agric. Eng. 35, 176–182. doi:10.11975/j.issn.1002-6819.2019.19.021
Wilk, S. D. A., Elói, P., Paulo, T. S. D. O., Roniedison, D. S. M., Teodorico, A. S., and Daniel, F. D. C. (2018). Effect of soil tillage and vegetal cover on soil water infiltration. Soil Tillage Res. 175, 130–138. doi:10.1016/j.still.2017.07.009
Xia, R., Shi, D., Ni, S., Wang, R., Zhang, J., and Song, G. (2022). Effects of soil erosion and soil amendment on soil aggregate stability in the cultivated-layer of sloping farmland in the three gorges reservoir area. Soil Tillage Res. 223, 105447. doi:10.1016/J.STILL.2022.105447
Xin, Y., Xie, Y., and Liu, Y. (2019). Effects of residue cover on infiltration process of the black soil under rainfall simulations. Water (Basel) 11, 2593. doi:10.3390/w11122593
Xing, B., Liu, X., Liu, J., and Han, X. (2005). Physical and chemical characteristics of a typical mollisol in China. Commun. Soil Sci. Plant Anal. 35, 1829–1838. doi:10.1081/LCSS-200026802
Yang, P., Luo, Y., and Shi, Y. (1993). Soil fractal characteristics characterized by weight distribution of particle size. Sci. Bull. (Beijing), 1896–1899.
Zhang, Y., Tan, C., Wang, R., Li, J., and Wang, X. (2021). Conservation tillage rotation enhanced soil structure and soil nutrients in long-term dryland agriculture. Eur. J. Agron. 131, 126379. doi:10.1016/J.EJA.2021.126379
Zhao, Y., and Hu, X. (2022). How do freeze-thaw cycles affect the soil pore structure in alpine meadows considering soil aggregate and soil column scales. J. Soil Sci. Plant Nutr. 22, 4207–4216. doi:10.1007/s42729-022-01019-z
Keywords: tillage measure, soil structure, soil hydrology, sloping farmland, soil conservation, Mollisol
Citation: Xu C, Liu W, Li J, Wu J, Zhou Y and kader R (2024) Dynamic change of soil aggregate stability and infiltration properties during crop growth under four tillage measures in Mollisols region of northeast China. Front. Earth Sci. 12:1357467. doi: 10.3389/feart.2024.1357467
Received: 18 December 2023; Accepted: 29 March 2024;
Published: 18 April 2024.
Edited by:
Alex Hay-Man Ng, Guangdong University of Technology, ChinaReviewed by:
Yuan Li, Lanzhou University, ChinaMilena Kercheva, Institute of soil science, agrotechnologies and plant protection “Nikola Poushkarov”, Bulgaria
Copyright © 2024 Xu, Liu, Li, Wu, Zhou and kader. This is an open-access article distributed under the terms of the Creative Commons Attribution License (CC BY). The use, distribution or reproduction in other forums is permitted, provided the original author(s) and the copyright owner(s) are credited and that the original publication in this journal is cited, in accordance with accepted academic practice. No use, distribution or reproduction is permitted which does not comply with these terms.
*Correspondence: Wenli Liu, 850970632@qq.com; Jianming Li, ljmluck@126.com