Modeling the morphological response of gravel–bed rivers subject to repeated sediment bypass tunnel operations
 Matteo Facchini
 David F. Vetsch
 Robert M. Boes
 Annunziato Siviglia
- 1Eastern Alps River Basin District Authority, Trento, Italy
- 2Laboratory of Hydraulics, Hydrology and Glaciology (VAW), ETH Zurich, Zurich, Switzerland
- 3Department of Civil, Environmental and Mechanical Engineering, University of Trento, Trento, Italy
Introduction: Sediment bypass tunnels (SBTs) are operated during floods to re-establish sediment continuity past dams with the ultimate goal of decreasing accumulation in reservoirs. Depending on the location of the intake structure and operational conditions, SBTs may release either bed load-laden or bed load-free flows in the form of sudden floods (pulses). When evaluating the impacts of SBTs, the traditional approach has been to monitor channel changes in the years following project completion. However, by the time these impacts become evident, mitigation is challenging.
Methods: This research adopts a forward-thinking methodology, emphasizing the prediction of potential impacts during the project’s early planning stages. We use a one-dimensional morphodynamic model to forecast the potential morphological response of a gravel-bed river with an idealized geometry to a series of SBT operations characteristic of projects in the Swiss Alps.
Results: The morphological response of the downstream reach over the medium to long term is influenced by the alternating pattern of bed load-laden and bed load-free flow releases. This pattern is instrumental in forming a transition region near the SBT outlet hydrograph boundary layer (HBL).
Discussion: Within the (HBL), fluctuations in bed elevation and slope are localized, while variations in grain-size distribution persist throughout the downstream region.
1 Introduction
Interruption of sediment continuity in gravel bed rivers due to dam construction causes reservoir sedimentation in the upstream reach and sediment starvation in the downstream reach. In turn, this affects downstream river morphology, resulting in channel narrowing and incision (Williams and Wolman, 1984; Brandt, 2000) and coarsening of the bed material (Dietrich et al., 1989), diminishing the ecological integrity of downstream rivers (Kondolf, 1997; Pitlick and Wilcock, 2001).
In the last decades, approaches for sediment management aiming at restoring natural sediment regimes have been widely discussed by the scientific community. Consequently, many sediment management techniques have been studied and implemented, whereby sediments are 1) mechanically removed and added downstream of dams (Bunte, 2004), 2) mobilized by induced side erosion caused by mechanical channel reconfiguration (Die Moran et al., 2013), 3) mobilized with artificial floods (Kondolf and Wilcock, 1996), or 4) routed around or through reservoirs (Sumi et al., 2012; Hager et al., 2020).
Implementation of such strategies significantly influences long-term changes in the downstream reach, leading to a variety of morphological configurations. Among them, sediment bypass tunnels (SBTs) have been designed with the main aim of routing sediment around reservoirs, thereby avoiding accumulation of new or even removing previous sediment (Vischer et al., 1997; Kondolf et al., 2014; Boes, 2015; Sumi, 2017; Chang and Lai, 2019; Hager et al., 2020). Investigations on existing SBTs showed that in some cases, up to 98% of the incoming sediments are diverted to the downstream river reach, considerably increasing the estimated lifespan of interested reservoirs (Auel et al., 2016; Albayrak et al., 2019; Hager et al., 2020). Most SBTs are located in mountainous regions, with small (<1 million m3) to medium-sized (<10 million m3) reservoirs, where a considerable amount of coarse material is entrained and transported as bed load (Auel and Boes, 2011; Boes et al., 2014). Typically, SBTs are solely operated during flood events with significant bed load transport (Figure 1A), when the incoming bed load-laden flows are diverted to the downstream reach (see the planar view and cross-section of the Solis SBT in Switzerland in Figure 1B). The frequency and duration of an SBT in operation is thus generally a function of the incoming flow. They are generally operated for a few hours, a few times a year (Mueller-Hagmann, 2017), imposing cycled hydrographs with or without synchronized sedimentographs as boundary conditions to the downstream reach. We distinguish two different types of SBTs (Auel and Boes, 2011; Hager et al., 2020), namely, type A with intakes at the reservoir head and type B with intakes positioned in the reservoir and therefore submerged, unless the reservoir level is substantially drawn down (see the 3D view of typical SBT systems in Figure 1C).
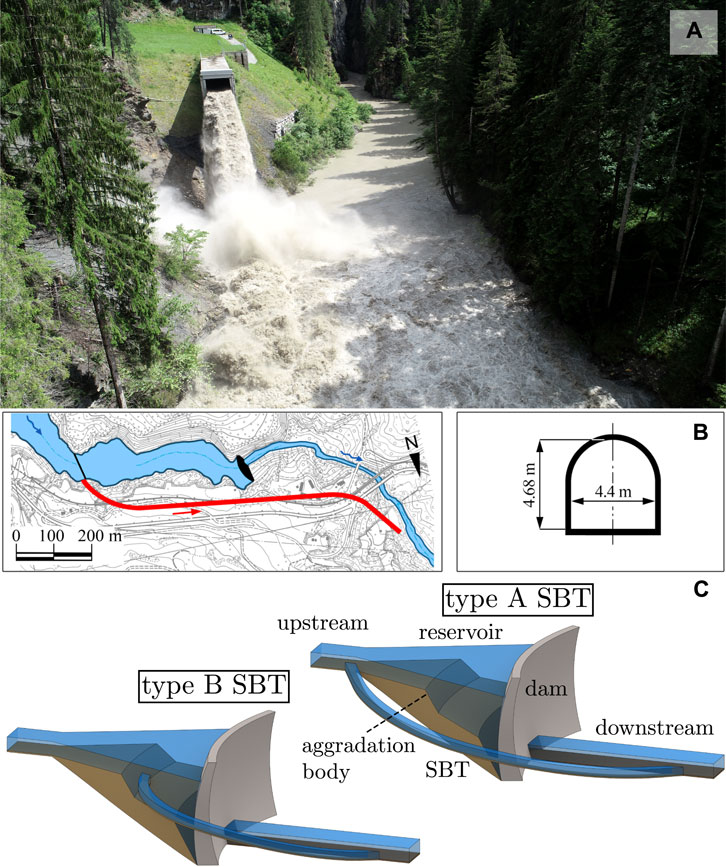
Figure 1. Example and functioning of sediment bypass tunnels. (A) Outlet structure of the Solis SBT (canton of Grisons, Switzerland) during an SBT operation; (B) layout and cross-section of the Solis SBT (view against flow direction); (C) 3D view of type A (intake structure at the upstream end of the reservoir) and type B (intake structure within the reservoir) SBT systems.
While numerous studies have focused on the design, construction, and operation of SBTs (Boes, 2015; Sumi, 2017; Chang and Lai, 2019) and the ecological state of downstream reaches post-construction (Auel et al., 2017; Martín et al., 2017; Serrana et al., 2018), few have examined the morphological impacts of SBTs. In particular, research on the morphological responses of rivers to repeated SBT operations remains scarce. For instance, Fukuda et al. (2012) noted that Japan’s Asahi Dam’s downstream riffle–pool morphology and grain-size distribution (GSD) were recovered after more than 15 years of SBT operations, yet highlighting the uncertainties of long-term effects of SBTs. Similarly, Kobayashi et al. (2018) showcased the potential of SBTs in mirroring upstream eco-morphology downstream based on in-field results. The current understanding of SBT impacts largely stems from monitoring post-SBT operations, but these are temporally and spatially constrained. Few studies, like Facchini (2018), have adopted a sediment-focused, process-based approach to investigate these morphological effects. Given the rising global implementation of SBTs, their morphological impacts might become pronounced before detection. Modeling of these operations can shed light on the varied time-scaled responses of downstream river segments, offering a glimpse into both their immediate and long-term consequences.
Regardless of the type, SBTs exert a strong control on rates of water and sediment supply being released to the downstream reach. Essentially, SBTs act as boundary conditions for the downstream reach, where they impose particular cyclic flow and sediment regimes, mostly depending on 1) the SBT type (particularly in terms of their intake location, see Figure 1C), 2) the magnitude of the event during which they are operated (i.e., the release scenario), and 3) other operational conditions related, for instance, to activities occurring in the upstream reach, such as gravel mining (Baumer and Radogna, 2015) or release of bed load-free flows (Mueller-Hagmann, 2017). Morphological effects in response to cycled hydrographs are well-documented and have been studied using laboratory experiments and by means of simplified mathematical models (Wong and Parker, 2006; Parker et al., 2008; An et al., 2017b). Adjustment of the bed surface size distribution of gravel-bed rivers in response to cycled hydrographs, similar to that of SBT operations, shows that the riverbed cyclically degrades and coarsens at a high flow and aggrades and becomes finer at a low flow (Parker et al., 2008). These variations of riverbed level and composition caused by repeated hydrographs under a constant sediment feed rate are found to be restricted to a short reach downstream of the feed point, i.e., a hydrograph boundary layer (HBL), where riverbed level and composition changes are confined. Downstream of the HBL, the variations are found in bed load composition and rate, while riverbed level and composition are invariant to the hydrograph (Parker et al., 2008). The dynamic related to the formation and evolution of the HBL described above, originally proposed by Wong and Parker (2006) and Parker et al. (2008) and confirmed by An et al. (2017a) breaks down if a sufficiently wide grain-size distribution is considered (An et al., 2017b). In this case, An et al. (2017b) demonstrates the persistence of forced grain-scale oscillations of the riverbed composition over the entire reach. Similarly, cyclic SBT operations might trigger the formation of an HBL. However, given the huge variability in the feed rate and composition caused by the particular operational conditions of the existing SBT operations (see Tables 2.1 and 2.2 in Facchini (2018)), it is unclear whether the very specific conditions needed for hydrograph boundary layer formation, i.e., the ones described by Parker et al. (2008), can be matched by SBT operations or if these have the power to break down the mechanism of HBL formation. In this case, the effects of SBT operations, concerning in particular the riverbed composition, might be substantial even far from the feeding point (An et al., 2017b).
Herein, we use a numerical model to describe the potential impacts of a range of SBT release scenarios, which are typical of existing Swiss and Japanese projects, under different operational conditions such as riverbed slope and bed material grain size. We performed one-dimensional (1D) morphodynamic simulations of a river reach where bed load-laden or bed load-free flows are fed to the downstream reach in the form of repeated hydrographs and potentially combined sedimentographs. By changing the boundary conditions in our model to better resemble SBT release scenarios, we aim to produce a matrix of the predicted changes in the riverbed level and composition as a function of the imposed boundary conditions. While a classical geomorphologist or river engineer can qualitatively describe the investigated processes, only a modeling approach can provide quantitative predictions, thereby offering a more accurate assessment of the potential impacts of forthcoming SBT operations and thus inform operators to optimize the SBT operations. The framework produced can be further used to extend the scope of our modeling, e.g., to model in detail the effects of specific projects or to predict the effects of SBT releases with more advanced modeling techniques (e.g., two-dimensional).
2 Sediment bypass tunnel release scenarios
Morphological changes on the downstream reach are determined by SBT operations, i.e., the sequence of cycled hydrographs and potentially combined sedimentographs released by the SBT. In this section, a conceptual framework is developed to identify the possible scenarios under which SBTs can be operated. Each scenario is characterized by 1) the peak water discharge of the hydrograph and 2) the peak of the combined sedimentograph.
2.1 Identification of possible release scenarios
The volumes of water and bed load conveyed through the SBT are linked to the discharge and bed load transport rate of the upstream (us) river reach. The relationship between the water discharge Qw and the bed load transport rate Qb (i.e., the bed load rating curve, BRC) in the upstream reach can be established under the hypothesis of uniform flow. Therefore, given the slope and the grain-size distribution of the upstream river reach, it is possible to determine the upstream bed load rating curve (line BRCus in Figure 2). In general, SBTs are designed with a larger transport capacity than those of the upstream reach (Auel and Boes, 2011). Since SBTs are mostly operated under open channel flow conditions, the SBT bed load rating curve can be derived considering the slope of the SBT and the grain-size distribution of the sediment mixture entering the tunnel (line BRCSBT in Figure 2).
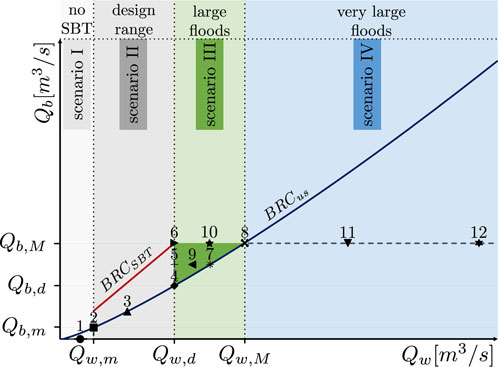
Figure 2. Sediment bypass tunnel release scenarios: bed load rating curves for the upstream reach (BRCus, solid blue line) and for the SBT (BRCSBT, solid red line). Black symbols represent the values of hydrograph and sedimentograph peaks used as input for the numerical runs under OC1, OC2a, and OC2b, and to each run, a specific symbol is given.
The minimum value of water discharge for which the SBT is first put into operation is Qw,m, which defines, on the BRCus, the corresponding minimum bed load discharge transported by the tunnel (Qb,m). SBTs are designed according to a given water discharge capacity, i.e., a design water discharge Qw,d. On the BRCSBT, Qw,d identifies the maximum bed load discharge that can be carried by the SBT (Qb,M). The Qw needed to carry the maximum bed load discharge Qb,M in the upstream reach is Qw,M. Then, we identified four possible scenarios based on the intensity of the flood events in the upstream reach causing (or not) the opening of the SBT. We define scenarios from I to IV in terms of water and bed load discharges released through the SBT to the downstream river reach (see Figure 2) as follows:
1 For small events, i.e., water discharges in the upstream reach below the minimum discharge (Qw,us < Qw,m, point 1), we define scenario I for which the SBT is not operated and sediments carried by the upstream reach are not conveyed to the downstream reach.
2 For values of water discharge in the design range of the SBT (Qw,m ≤ Qw,us < Qw,d, points 2 and 3), we define scenario II, where the entire amount of sediments coming from upstream is conveyed through the SBT, and the possible SBT operations are identified by the points lying on the BRCus line (points 2 and 3).
3 In case of large floods exceeding the water discharge capacity of the SBT (Qw,d ≤ Qw,us ≤ Qw,M, points 4–10), we define scenario III, where the water and bed load discharges being delivered to the downstream reach range between the SBT design discharges and the maximum discharges possible. For scenario III, two extreme conditions can be considered. The first one occurs when the water discharge fed to the downstream reach flows only through the SBT, and thus it is kept constant and equal to its design discharge Qw,d. In this case, the water surplus (when Qw,us exceeds Qw,d) is stored in the reservoir, and the bed load discharge carried through the SBT ranges between the design and maximum one (vertical segment between points 4 and 6) since, for a given water discharge, the SBT can transport larger volumes of bed load as compared to the upstream reach, due to its larger transport capacity (BRCSBT > BRCus). The second condition occurs when the surplus water (when Qw,us exceeds Qw,d) flows inside the reservoir, but water is also released from the dam outlets. In this case, the delivered water and bed load discharges range both between the design and the maximum values, and possible release discharges can be identified on the BRCus (points 4, 7, and 8). Between these two situations, a number of other release scenarios are also possible, which can be identified generally inside the green area delimited by points 4, 6, and 8.
4 In case of very large floods exceeding the maximum water discharge needed to transport the maximum bed load discharge through the SBT (Qw,us > Qw,M), the bed load discharge fed to the downstream reach is constant and equal to the maximum transport capacity of the SBT (points 11 and 12). The water discharge exceeding the maximum discharge is released from the dam outlets.
2.2 Definition of possible operational conditions
The release scenarios presented in the previous section describe how SBTs can be operated based only on the intensity of flood events. However, SBTs can be operated in different ways (Figure 2), i.e., the operational conditions (OCs) of the SBT depend on its design and on the transport conditions in the upstream reach. In this work, hydrographs and sedimentographs fed to the domain resemble real-event hydrographs, such as the ones relative to the Solis SBT (represented in Figures 3A,B) with steep rising and falling limbs and a rather long release duration. The magnitude of the outflow hydrographs resembles that of natural floods up to a 10-year return period. Furthermore, we consider three different operational conditions, OC1, OC2, and OC3, among the most common adopted worldwide (Sumi, 2017). For OC1 and OC2a and b, the peak values of hydrographs and sedimentographs (if any) correspond to the numbered points in Figure 2, while for OC3, the peak of the sedimentograph is reduced as specified hereafter.
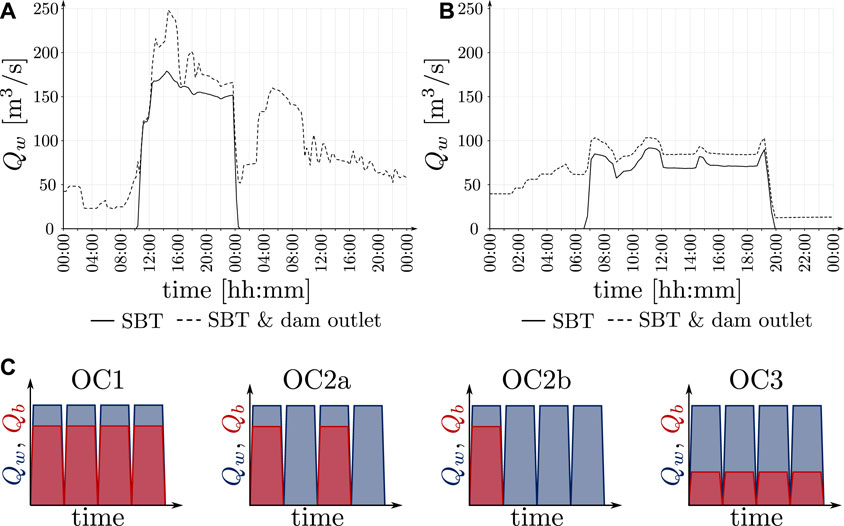
Figure 3. Hydrographs and sedimentographs released through sediment bypass tunnels. (A) and (B) examples of hydrographs from real SBT operations at Solis, Switzerland, 13 August 2014 (A) and 11 June 2016 (B). Solid and dashed lines refer to the water discharge conveyed through the SBT and the total water discharge delivered to the downstream reach, respectively. (C) SBT sediment release patterns (cycles) under OC1, OC2, and OC3. Under OC1 and OC3 at each SBT operation, bed load (red) is released (at different magnitudes) together with water (blue); under OC2a, bed load-laden and bed load-free flow releases are alternating; and under OC2b, three bed load-free flow releases follow a bed load-laden release.
2.2.1 OC1: reference condition
The reference condition is relative to the conditions under which the SBT releases water and bed load during each operation. Thus, during each SBT operation, a hydrograph and a synchronized sedimentograph are released through the SBT. The grain-size distribution of the released bed load is identical to the distribution of the bed load transported in the upstream reach, and no bed load-free flow releases occur between two consecutive SBT operations (see Figure 3C). This typically holds for type A SBTs (see Figure 1C) operated during floods.
2.2.2 OC2: alternate bed load-laden and bed load-free flow releases
In practical situations, i.e., most commonly, SBTs may be used outside their reference (or design) conditions. Between two consecutive releases, certain SBTs may be opened just to route bed load-free flow (Facchini, 2018). To describe this case of alternating bed load-laden and bed load-free flow releases, we consider two release patterns for the bed load supply rate, one where bed load-laden and bed load-free flow releases are alternated (OC2a) and one where one bed load-laden flow release is followed by three bed load-free flow releases (OC2b) (see Figure 3C).
2.2.3 OC3: upstream mining of coarse material
Gravel may be extracted upstream of the SBT intake structure, typically at the upstream end of the reservoir where backwater begins. This is the case for most Japanese SBTs, where, to avoid SBT invert abrasion (see Kondolf, 1997), coarse bed load is trapped and mined upstream of the SBT inlet structure and sold as a construction material (Baumer and Radogna, 2015). In this work, we consider that only the coarsest gravel fraction is removed, causing in turn a decrease in the volume of the released bed load (see Figure 3C).
3 Numerical model
To predict the downstream changes in the riverbed slope and grain-size distribution, we run 1D numerical simulations using BASEMENT (Vetsch et al., 2017a). The hydrodynamic component of the model is solved using the Saint-Venant equations, while morphodynamic processes are described using the Exner equation, assuming a cohesionless bed composed of mixed-size sediment. The grain-size distribution on the riverbed surface and size stratification are described by the active layer modeling developed by Hirano (1971, 1972). Further insights into the numerical solution and management of size stratification, including its vertical storage, in BASEMENT, are available in the software reference manual (Vetsch et al., 2017b). Our numerical investigations are restricted to the case of bed load transport of gravel with some admixtures of sand, typical for gravel-bed rivers (see Supplementary Appendix A1.3). To account for the effect of sand (i.e., dk < 2 mm) on coarser grains, we adopt the Wilcock and Crowe (2003) transport formula (see Supplementary Appendix A1.3).
The mathematical model resolved by BASEMENT is a standard model that has been widely used to describe stream-wise sorting and its relationship to bed elevation in gravel-bed rivers (Parker, 2008). It has been effective in describing the morphodynamic evolution in gravel-bed rivers, as demonstrated in laboratory experiments (Cui et al., 2003; Nelson et al., 2009; Viparelli et al., 2011; Stecca et al., 2016; An et al., 2017a). Consequently, it is expected to be well-suited for predicting potential morphodynamic changes in the downstream reach due to variations in sediment supply. Moreover, the lack of data relative to SBT-affected river reaches hinders the possibility of calibrating the model. However, the absence of a calibration does not affect the soundness of the results of this work or the possibility of extending them to specific SBT operations or to different modeling approaches. More details on the numerical modeling approaches are given in Supplementary Appendix A1.
4 Definition of and input to the numerical model runs
We constructed our model using an idealized river geometry that captures the key characteristics of the Albula River, located just downstream of Tiefencastel in the canton of Grisons, Switzerland. Although the SBT operations of our model are hypothetical, they are based on the characteristics observed in the SBT of the Solis reservoir, which was constructed in 2012 (see Figures 1A,B) (Facchini, 2018). A schematic representation of the modeled reach with input hydrographs and sedimentographs is given in Figure 4.
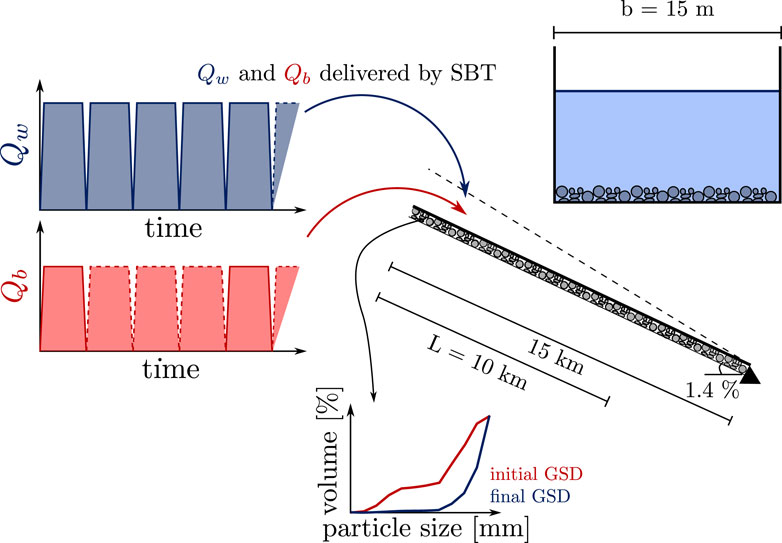
Figure 4. Schematic representation of the modeled reach with input hydrographs (Qw) and sedimentographs (Qb).
4.1 Upstream reach and SBT bed load rating curves
The bed load rating curve for the upstream reach (BRCus line in Figure 2) is calculated considering uniform flow conditions in a rectangular channel 1.5% steep and 15 m wide where the friction term is calculated using a Gauckler–Strickler parameter ks=32 m1/3s−1 obtained with Supplementary Appendix Eq. 4 considering d50 = 80 mm, relative to a sample from the Albula River upstream of the Solis reservoir. The riverbed grain-size distribution is similar to the that of the material sampled in the vicinity of the SBT inlet structure and is represented by a bimodal mixture with geometric mean size dg = 16.22 mm and geometric standard deviation σg = 7.37 mm. It is composed of 25% sand mode (d<2 mm) and a 75% gravel mode (d ≥2 mm) (Facchini et al., 2015). The full description of GSD is given in Supplementary Tables A1, A2.
Usually, sediment transport calculations for SBTs differ from those for alluvial rivers because of low relative roughness (ke/h << 0.1, where ke is the equivalent sand roughness height), a non-movable bed, and an initial planar bed. Therefore, the bed load rating curve for the SBT (BRCSBT line in Figure 2) is calculated using the Smart and Jaeggi (1983) formula for the fixed planar bed (Boes et al., 2017) considering uniform open channel flow conditions and the characteristics of the Solis SBT, which has a slope of 1.9% and a channel width of 4.4 m. For the concrete invert, the roughness is characterized by a coefficient ks=65 m1/3s−1 (VAW, 2010). These conditions are used to evaluate the maximum bed load discharge carried by the SBT (Qb,M in Figure 2). The minimum (Qw,m), the design (Qw,d), and the maximum (Qw,M) water discharges of the Solis SBT, considered in this work for running the numerical simulations, are 50, 170, and 275 m3s−1, respectively, and the corresponding volumetric bed load rates (Qb,m, Qb,d, Qb,M) are 0.18, 0.67, and 1.06 m3s−1, respectively.
4.2 Downstream reach
Numerical simulations in the downstream reach are conducted under unsteady flow conditions in a straight rectangular channel with a width of 15 m, an initial constant slope of S = 1.4%, and a Gauckler–Strickler parameter of ks = 32 m1/3s−1, as in the upstream reach. The total length of the channel is 15 km, even though for the results, only the first 10 km are considered to neglect the possible effects of the downstream boundary condition. The channel width is assumed to be sufficiently wide compared to the flow depth that sidewall effects can be neglected. Floodplains are not considered and deemed negligible due to the morphology of river stretches downstream of SBTs. The initial bed composition is the same as the upstream reach (see Supplementary Tables A1). The numerical domain consists of cross-sections that are spaced out evenly (100 m), and the active layer thickness La has been considered constant in time and twice as thick as the d90 of its initial composition, i.e., considering the dimensionless constant of order 1 na = 2 in Supplementary Appendix Eq. 6 (Parker, 2004). A schematic representation of the 1D channel used for the numerical simulations is given in Figure 4. For all runs, initial conditions (t = t0) are obtained by setting constant discharge, i.e., uniform flow conditions both at the inlet and the outlet of the numerical domain and by running simulations under fixed-bed conditions until the steady state is reached.
4.3 Boundary conditions
Water and bed load are fed into the downstream reach at its inlet in the form of cycled hydrographs with or without synchronized sedimentographs. At the channel outlet (x = 15 km), bed elevation is held constant throughout the calculation. The shape and duration of the hydrograph and sedimentograph and of the rising and falling limbs used as boundary conditions for the runs resemble the ones that occurred in 2014 and 2016 at the Solis SBT (Figures 3A,B). Details of the SBT operations at Solis can be found in Mueller-Hagmann (2017). The geometrical characteristics of the channel and the hydrograph features used in the numerical study are common to all runs and are represented in Figure 4 and summarized in Table 1.
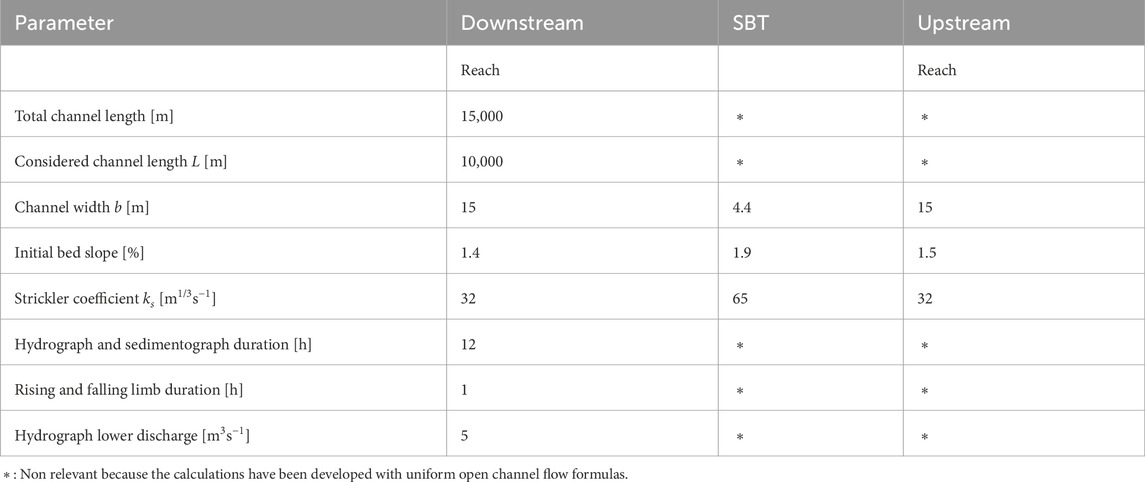
Table 1. Summary of the geometrical characteristics of the upstream and downstream reach and of the hydrograph and sedimentograph characteristics used for the numerical study. The downstream reach values refer to the topography of the Albula River downstream of the Solis SBT (canton of Grisons, Switerland).
Model runs are grouped into four sets based on the operational condition considered (i.e., OC1, OC2a, OC2b, and OC3). For each set, we run 12 numerical simulations numbered 1 to 12 (see the symbols in Figure 2). For each run, the relative single release pattern (see Figure 3C) is cyclically repeated. If any of the configurations is sustained for a sufficient amount of time (ca. 103 events for this study), a mobile-bed equilibrium is finally reached, which is not characterized by constant values of riverbed level and composition, but is instead dynamic. Thus, the equilibrium can strictly be defined only in relation to a cycle of events that is repeated over time (Parker et al., 2008). In this study, we refer to a cycle of four events, regardless of the OC, considered to encompass all operational conditions and to highlight the different dynamics developed when bed load-free flows are (OC2a and b) or are not (OC1 and OC3) released between two consecutive bed load-laden flow releases (see Figure 3C).
For OC1, OC2a, and OC2b, the set of two peak values (Qw and Qb) are calculated as follows: 1) for run 1, Qb is 0; 2) for runs 2, 3, 4, and 7, the peak values correspond to the ones lying on the upstream bed load rating curve; 3) simulations 5, 9, and 7 are runs using increasing values of the water discharge and using the same sediment discharge corresponding to the value found on the BRCus for a water discharge equal to the average of Qw,d and Qw,M; iv) runs 6, 10, 8, 11, and 12 are characterized by increasing values of water discharge and the same bed load rate equal to the maximum discharge that can be carried by the SBT (i.e.,.Qb,M), which is calculated using the bed load rating curve of the SBT. The grain-size distribution of the material fed to the downstream reach is the mixture transported to the upstream reach and is calculated by running numerical simulations with constant discharge using the geometry of the upstream reach, i.e., 15 m width, 1.5% slope, and 32 m1/3s−1 Strickler ks (see the Supplementary Appendix A1.1). Peak values for OC3 runs are calculated considering that the coarsest fraction (d = 256 mm) is removed from the sediment transport of the upstream reach before entering the SBT. As a consequence, the feeding GSD changes and becomes finer. We define two bimodal mixtures of sand and gravel used for our runs: one composed by 31% of the sand mode and 69% of the gravel mode (OC1 and OC2a and b) and one composed by 38% of the sand mode and 62% of the gravel mode (OC3). The peak values and the mean geometrical diameter used for the 4 × 12 = 48 numerical runs are given in Table 2.
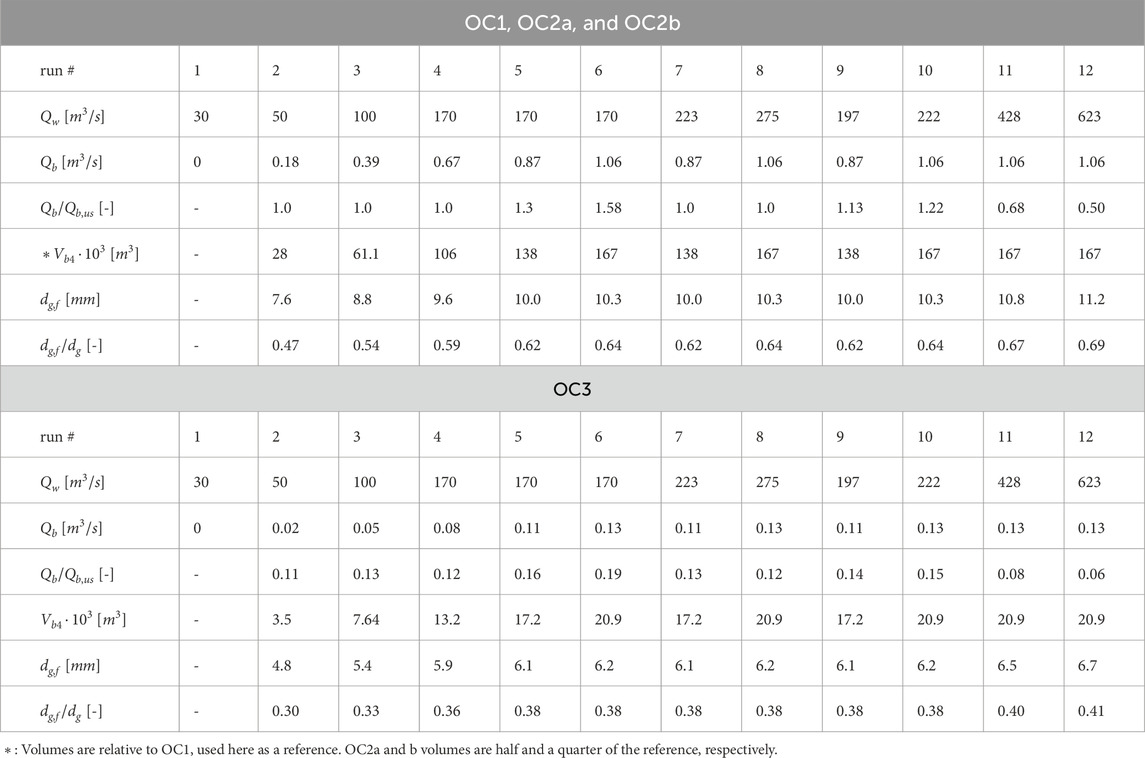
Table 2. Parameters defining numerical model runs. Qw = hydrograph peak value; Qb = sedimentograph peak value; Qb/Qb,us = ratio between the sedimentograph peak value and the bed load discharge in the upstream river reach under uniform flow conditions and water discharge Qw; Vb4 = bed load volume released over a cycle of four releases; dg,f = mean geometric diameter of the grain-size distribution of the feeding; dg,f/dg = ratio between the mean geometric diameter of the grain-size distribution of the feeding and the upstream river reach.
5 Results
Our results are presented and later discussed in terms of longitudinal riverbed changes (channel slope and riverbed level) and evolution of the active layer composition. As a reference configuration, we assume the slope and the grain-size distribution of the reach upstream of the reservoir. In particular, to assess the ability of SBT operations in reproducing the upstream morphological conditions in the downstream reach, we define two dimensionless variables. Namely, we define a dimensionless slope as S* = S/Sus and a dimensionless mean geometric size as
5.1 Riverbed slope and composition at mobile-bed equilibrium
The results in Figure 5 show that the values of the riverbed slope and composition at the mobile-bed equilibrium are highly dependent on the volume of water that is released through the SBT, i.e., on the unbalance between the transport capacity in the downstream reach and the bed load feeding from the SBT. The results in Figure 5 are displayed in terms of dimensionless slope S* and mean geometric sizes
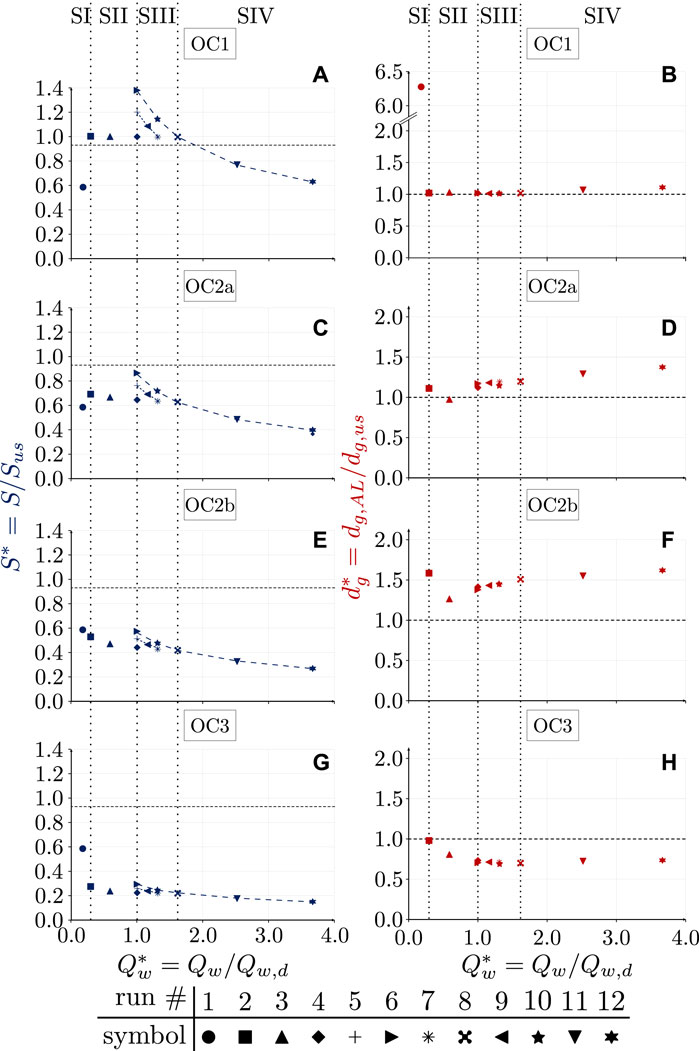
Figure 5. Long-term results concerning dimensionless riverbed slope S* (panels (A, C, E, and G)) and composition
Figure 5 shows that, for events where water is released only from the dam outlets and the SBT is not in operation (scenario I: no bed load at the inlet), the riverbed slope and composition at the mobile-bed equilibrium are smaller (S* = 1.0, Figures 5A,C,E,G) and larger (
Our equilibrium results are in good agreement with the widely applied, qualitative relationship for channel adjustments proposed by Lane (1955), which can be extended to infer that gravel-bed rivers adjust prevailing channel characteristics (e.g., slope and riverbed composition) to provide, with the available water discharge, just the velocity required for the transportation of the load supplied from upstream (Mackin, 1948). This suggests that our model supports the expected physics of a river reach subject to changes in water and bed load supply regimes.
5.2 Riverbed level and composition fluctuations at the inlet of the downstream reach
The results in Figure 6 show that both riverbed level and composition might fluctuate, depending on the operational conditions. The first fluctuates in a short region close to the SBT outlet, i.e., at the upstream end of the considered river reach, while the second fluctuates along the whole reach. For representing the general trend of both riverbed level and composition, we average the results at the mobile-bed equilibrium over a four-event cycle (see Figure 3C), regardless of the operational conditions. For representing the fluctuations, we calculate their minimum and maximum as well as the 25th and 75th percentiles of the distribution over the whole cycle. We refer to the equilibrium characterized by values averaged over a cycle as macroscopic mobile-bed equilibrium (An et al., 2017b). Results in Figure 6 show that under OC2a and b, both riverbed level and composition present larger average values close to the upstream end (black solid lines in Figures 6C–F). The main cause of the pronounced deposition (and consequent coarsening) occurring during alternate bed load-laden–bed load-free flow releases is the imbalance between bed load supply and transport capacity evaluated over a four-event cycle of SBT operations. During the releases of bed load-laden flow, the riverbed aggrades, and during the following clear-water releases, the aggraded material is transported downstream, returning the morphology of the channel back to the equilibrium state at the end of each cycle. The more bed load-free flow is released after a bed load-laden flow release, the larger the deposition close to the inlet is. Furthermore, over a cycle of events, both riverbed level and composition may or may not fluctuate, depending on the conditions under which the SBT is operated. As for the average values, if the feeding rate and transport capacity are significantly unbalanced and bed load-free flows are released between two consecutive bed load-laden flow releases (OC2a and OC2b), fluctuations in riverbed level (Figures 6C,E) and composition (Figures 6D,F) are clearly observable. On the contrary, if bed load-free flows are never released (OC1 and OC3), results show no significant fluctuations in the deviatoric riverbed level (Figures 6A,G) and small fluctuations of the riverbed composition (Figures 6B,H). Under all circumstances, the disturbance of the average values and the fluctuations of the riverbed level are always confined within the first 1 to 2 km downstream of the feeding point (see Figures 6C,E), i.e., they are limited to the HBL (Parker et al., 2008). In addition to the findings of Parker et al. (2008), our results indicate that oscillations of the riverbed composition extend beyond the HBL (see Figures 6D,F) due to the different upstream boundary conditions imposed in this work, that is, the original idea of the HBL breaks down in this case, mostly due to the fact that alternating bed load-laden and bed load-free flow releases generate an imbalance between sediment feeding and transport capacity, which propagates the oscillations of the riverbed composition along the reach. The oscillations are anyway more intense inside the HBL due to the fact that the riverbed level, and thus the slope, is also strongly oscillating.
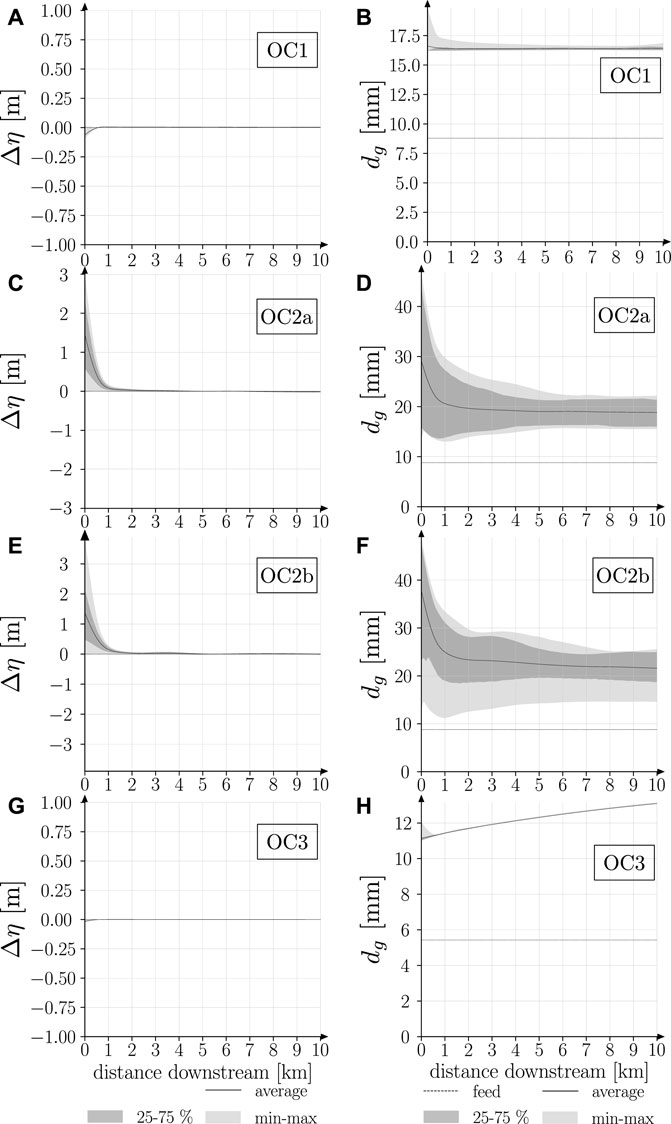
Figure 6. Long-term fluctuations of deviatoric bed elevation Δη [m] (left) and geometric mean size of riverbed composition dg during a cycle of four events for run 3 (Scenario II). Panels (A) and (B) refer to OC1, (C) and (D) refer to OC2a, (E) and (F) refer to OC2b, and (G) and (H) refer to OC3. In all panels, the black line represents the average over the cycle (macroscopic equilibrium), the light gray area represents the minimum–maximum oscillation, and the dark gray area represents the oscillation between the 25% and 75% percentiles. In panels (B), (D), (F), and (H), the black dashed line represents the geometric mean size of the feeding.
The results in Figure 7 expand the analysis on the effect of alternating bed load-laden and bed load-free flow releases on the dynamics of the armoring ratio. The latter fluctuates more intensely close to the feeding point (Figures 7A,C,E,G) and if bed load-free flows are released between two consecutive bed load-laden flow releases (Figures 7C,E). In these cases, fluctuations of the armoring ratio follow a pattern, which follows, in turn, the release cycle of bed load-laden and bed load-free flows from the SBT (refer to Figure 3C for the duration of the cycles under different operational conditions). In Figure 7, two cross sections are considered, namely, 1 km downstream of the feeding point (i.e., “upstream end,” Figures 7A,C,E,G) and 10 km downstream of the feeding point (i.e., “downstream end,” Figures 7B,D,F,H). The dynamics of fining and coarsening is different depending on the operational conditions, i.e., if no, one or more bed load-free flow releases are carried out between two consecutive bed load-laden flow releases, that is, both at the upstream and downstream end of the domain, there are no significant fluctuations under OC1 and OC3 (Figures 7A,B,G,H, respectively). However, a small increase in the armoring ratio occurs at the upstream end during the rising limb of the hydrograph (hours 0 to 1 in the inset in Figure 7A), followed by a fining during the first hour of the peak (hours 1 to 2 in the inset in Figure 7A). Then, the armoring ratio remains constant (hours 2 to 11 in the inset in Figure 7A), followed by coarsening during the falling limb of the hydrograph (hours 11 to 12 in the inset in Figure 7A). At the downstream end, the coarsening–fining process is delayed by about 5 h (inset in Figure 7B), which is the time needed by the perturbations in the average diameter of the mixture to propagate until the downstream end. As previously described in the literature (Ribberink, 1987; Stecca et al., 2014; Siviglia et al., 2017), such perturbations, which are associated with changes in the grain-size distribution in the active layer, travel slower than hydraulic perturbations. In this case, the flow velocity is 4.5 ms−1, i.e., it takes ca. 35 min for the hydraulic perturbation to travel to the downstream end of the reach.
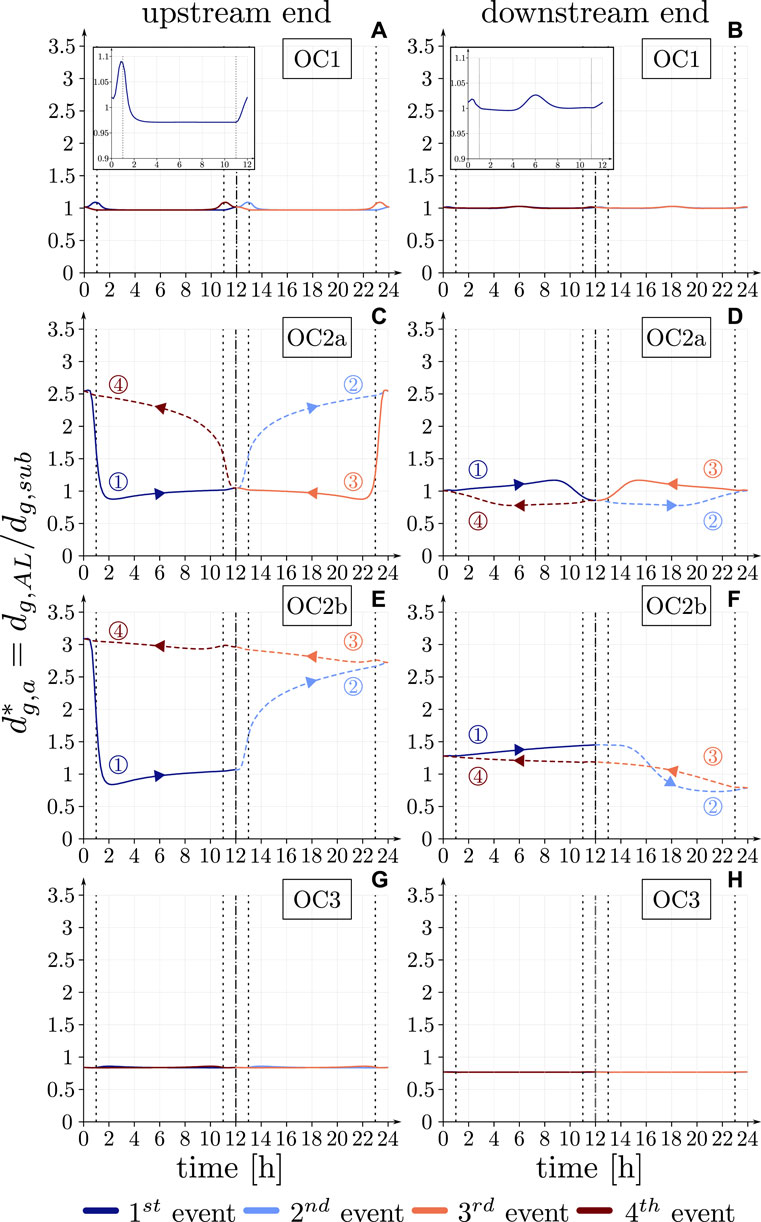
Figure 7. Long-term evolution of the armoring ratio during a cycle of four events at equilibrium. Panels (A) and (B) refer to OC1, and the two insets are a zoom in to the first event. Panels (C) and (D) refer to OC2a, (E) and (F) to OC2b, and (G) and (H) to OC3. Panels (A), (C), (E), and (G) refer to a cross-section 1 km downstream of the feeding point (upstream end), while panels (B), (D), (F), and (H) refer to a cross-section 10 km downstream of the feeding point (downstream end). Both the armoring ratios during bed load-laden (solid lines) and bed load-free (dashed lines) water releases are plotted. Black dashed vertical lines define the beginning and the end of the peak of the hydrograph, while the black dash–dotted vertical line divides two consecutive events. Arrows indicate the positive marching of time during each release, i.e., releases 3 and 4 also span over 24 h like releases 1 and 2. They are represented like this to highlight their cyclic pattern.
Close to the inlet, under OC2a and b, the armoring is removed within the first hour (rising limb of the hydrograph, hours 0 to 1 in Figures 7C,E) of the bed load-laden flow release (solid lines in Figures 7C,E), and then coarsening occurs during bedload-free flow releases (dashed lines in Figures 7C,E). Under OC2a, two identical cycles composed of two events follow one another, while under OC2b, coarsening occurs during the three bed load-free flow releases following the first bed load-laden release. However, more than 80% of the coarsening process under OC2b occurs during the first bed load-free flow release, where the armoring ratio increases from 1.06 to 2.72. Similarly, the armoring ratio increases from 1.04 to 2.54 during the bed load-free flow release under OC2a.
5.3 Riverbed level and composition fluctuations for different scenarios at the inlet of the downstream reach
Results in Figure 8 refer to all scenarios and show that the riverbed composition evolution relative to scenario II presented in Figures 6, 7 is similar in each run, i.e., results at mobile-bed equilibrium appear to be similar regardless of the scenario. In Figure 8, the results are plotted for the armoring ratio
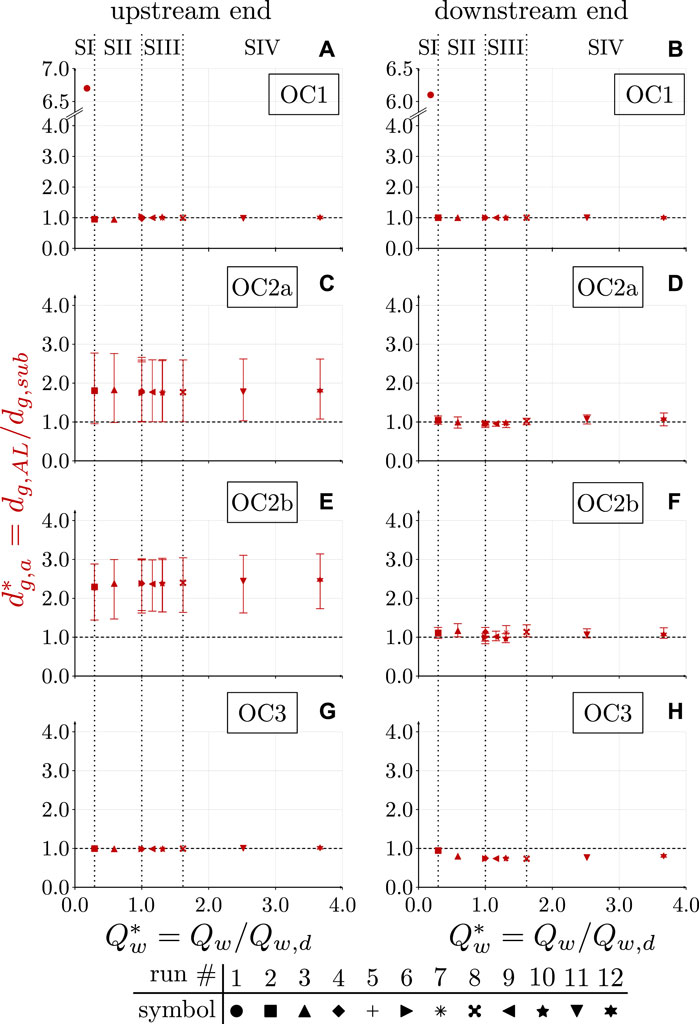
Figure 8. Long-term results concerning the armoring ratio
With respect to the magnitude and extension of the riverbed fluctuations, we represent their amplitude and length in Figure 9, in terms of dimensionless variables, i.e., A* and L* as defined in section A1.7.
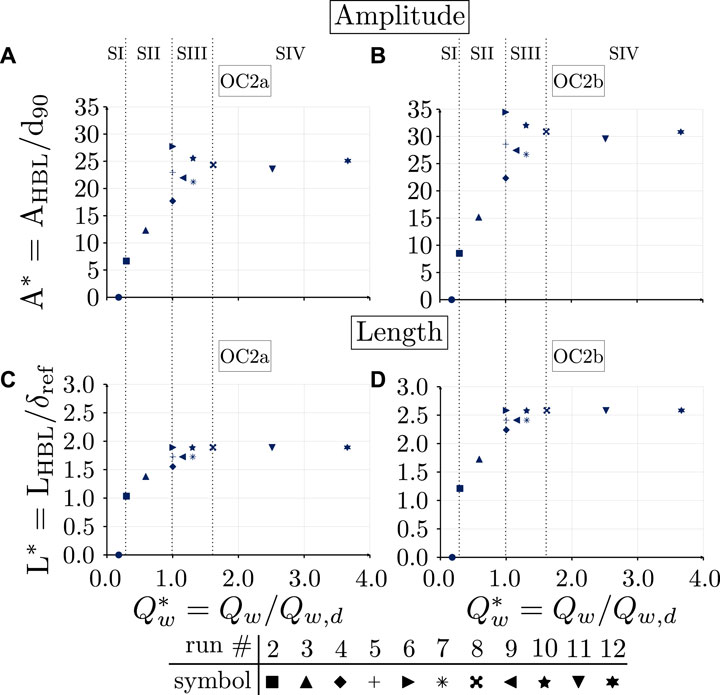
Figure 9. Long-term results concerning the dimensionless hydrograph boundary layer (HBL) amplitude panels (A,B) and length panels (C,D) under OC2a and OC2b at mobile-bed equilibrium plotted against the dimensionless water discharge
The aggradation (i.e., positive AHBL) induced by SBT operations at the mobile-bed equilibrium is between 5 and 35 times the d90 (Figures 9A,B). Despite the large amplitude of the upstream aggradation caused by the release of bed load-laden flow (as for results in Figure 6), this remains confined ca. within the first 1.5 km downstream of the feeding point for all scenarios (see Figures 9C,D).
5.4 Short-term effects of SBT releases
Results in Figure 10 are relative to a cycle of four SBT releases after 12 operations, i.e., after three complete cycles, under OC2a and OC2b. As compared to the results in Figures 6C,E, the results in Figures 10A,C show that the riverbed level is oscillating during a cycle close to the upstream end, while it is adapting to the boundary conditions imposed by the SBT (incision occurs). The general trend of erosion is confirmed by results in Figure 5, where initial values of the slope are equal to 1.4% for each run (S* = 0.93, dashed line in Figures 5C,E), while the equilibrium slopes for run 3 (upward-pointing triangle) are 1% and 0.7% for OC2a and b (S* = 0.67 and 0.47), respectively. Results in Figures 10B,D are quite similar to the results in Figures 6D,F, showing that the evolution of the riverbed composition is faster than the one of the riverbed level, that is, the riverbed composition is close to the equilibrium configuration and it oscillates around the average (solid black line in Figures 10B,D) along the whole reach already after a few SBT operations.
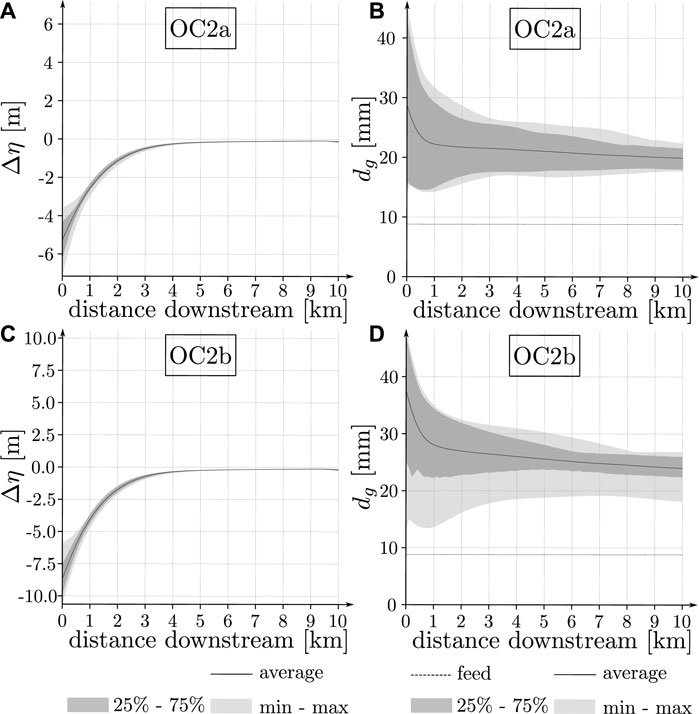
Figure 10. Short-term fluctuations of deviatoric bed elevation Δη [m] (left) and geometric mean size of riverbed composition dg [mm] during a cycle of four events for run 3 (Scenario II), after the first three cycles (i.e., 12 events). Panels (A) and (B) refer to OC2a and (C) and (D) refer to OC2b. In all panels, the black line represents the average over the cycle (macroscopic equilibrium), the light gray area represents the minimum–maximum oscillation, and the dark gray area the oscillation between the 25% and 75% percentiles. In panels (B) and (D), the black dashed line represents the geometric mean size of the feeding.
6 Discussion
6.1 Long-term effects of SBT operations on riverbed slope and composition
SBTs release water, and potentially bedload, in the form of cyclic hydrographs combined or not with synchronized sedimentographs. The characteristics of the hydrograph, i.e., flow magnitude, duration, shape, and sequence, are relevant to the bedload flux only in terms of their contribution to the total transported volume (Phillips et al., 2018), but they greatly affect the river morphology (riverbed level and composition). Compared to less intense hydrographs with more gradual rising and falling limbs (Humphries et al., 2012), intense hydrographs with steep rising and falling limbs may affect the morphology far from the inlet and cause coarsening of the riverbed (e.g., Mao, 2012). In addition to that, the limitation of sediment supply has been proven to be a first-order control on the formation of an armored layer (Hassan et al., 2006), like long periods of low flow between floods, which favor the consolidation and stabilization of the riverbed (Reid et al., 1985; Waters and Curran, 2015). Similarly, short periods between two consecutive floods reduce the time over which fine sediment can be entrained and transported as bed load, thus favoring downstream fining (Ferrer-Boix and Hassan, 2015).
In this work, we fed the domain with hydrographs having steep rising and falling limbs as compared to the duration of the peak and no low-flow periods between two consecutive hydrographs. Furthermore, we limit the sediment feeding only during bed load-free flow releases. Results in Figure 5 show that if the feeding grain-size distribution is the same as the upstream one (this is always the case, except for OC3) and the feed rate is the one of the upstream bedload rating curves (runs 2, 3, 4, 7, and 8 under OC1 lying on the BRCus in Figure 2), the SBT can be considered a means to make the reservoir transparent since the volume and composition of the sediment delivered downstream correspond exactly to what is transported by the upstream reach. In this case, the upstream and downstream reaches are perfectly connected by the SBT, and the resulting riverbed composition and slopes will be the same as the reference SBT. If the feed rate or grain-size distribution are different from those described above, i.e., if the scenario or the operational conditions are changed, the volume and composition of the sediment delivered downstream do not correspond to what is transported upstream; thus, the reservoir acts as a disturbance which cannot be countered by the SBT. As a consequence, the downstream reach will adapt to the modified conditions, and its mobile-bed equilibrium will diverge from the reference.
Bed load-free flow releases play a major role in creating unbalanced conditions. Under OC2a (alternating bed load-laden and bed load-free releases) and OC2b (one bed load-laden release followed by three bed load-free releases), the equilibrium slopes and riverbed composition are milder and coarser than the reference ones (see Figures 5C–F), respectively. This is a consequence of the bed load-free flow releases during which the sediment is picked up from the riverbed and entrained into the bed load (see Figure 7). Under OC3, the volume of the delivered sediment is further reduced, and the feeding grain-size distribution is deprived of its coarsest fractions (refer to Vb4 and dg,f in Table 2); thus, reductions in the resulting slope and riverbed composition are to be expected (see Figures 5G,H).
Mobile-bed equilibrium conditions develop after sustaining an operational SBT regime for enough time, regardless of the initial conditions, i.e., of the downstream reach morphological state at the beginning of the process. The mobile-bed equilibrium developed after sustaining an SBT operational regime for a sufficient amount of time is a fluctuating equilibrium, which consists of a state in which the bed degrades and coarsens at high-flow stages and during bed load-free releases, and aggrades and becomes finer at the low-flow stages or during bed load-laden releases (Figures 6, 7). A cycle can be identified depending on the boundary conditions sustained to reach the equilibrium, at the end of which the riverbed level and composition are the same as at the beginning. In this study, the cycle is characterized by a varying number of events to represent a pattern, depending on the operational conditions. For OC1 and OC3, a cycle is represented by one event; for OC2a and OC2b, it is represented by two and four events, respectively (see Figure 3B). Given the different equilibrium slopes, the amplitude of the riverbed level changes, i.e., the amplitude of the hydrograph boundary layer (Figure 9), is different depending on the operational conditions. During a single bed load-laden release, the release of the same volume of sediment causes larger depositions for milder slopes (OC2a and OC2b, Figures 5C,E) than for steeper slopes (OC1, Figure 5A). Furthermore, during the first bed load-laden release under OC2a and OC2b, the bed aggrades and becomes finer, reaching its maximum level (upper limit of the light gray area in Figures 6C,E) and its finest riverbed composition (lower limit of the light gray area in Figures 6D,F). During the following one (OC2a) or three (OC2b) bed load-free releases, the riverbed gradually degrades and becomes coarser, reaching the initial riverbed level (Δη = 0 in Figures 6C,E) and composition (upper limit of the light gray area in Figures 6D,F). Under OC1 and OC3, the whole aggradation–fining and degradation–coarsening dynamics is completed within one event, i.e., during a single hydrograph, as shown in Parker et al. (2008), Wong and Parker (2006), and An et al. (2017b) since every release is equal to the previous and following releases.
6.2 Hydrograph boundary layer formation, rework of the riverbed composition, and short-term effects
On a short temporal scale (say a few cycles), results reported in Figure 10 indicate that even far from the mobile-bed equilibrium conditions, riverbed slope and grain-size distribution cyclically fluctuate during every single-cycle SBT operation. This means that the mobile-bed equilibrium is slowly attained through a repeated sequence of hydrographs and sedimentographs, which at every cycle of SBT operations results in cyclic variations of both riverbed slope and grain-size distribution.
As shown in Figures 6, 7, oscillations of riverbed level and composition are mostly induced by the presence of bed load-free flow releases. The oscillations over a single bed load-laden release, i.e., over the single hydrograph (Figures 7A,B), are negligible and occur mostly because the sedimentograph is synchronized with the hydrograph (see Figure 3) and not with the time distribution of the transport capacity, that is, the sediment discharge relative to the hydrographs lags behind the feeding rate (Facchini, 2018). Such a time lag between the end of the rising limb of the hydrograph and of the sedimentograph has been observed under unsteady flows (Bombar et al., 2011; Mao, 2012; Khosravi et al., 2019). Fluctuations of riverbed levels shown in Figure 6 are realized only in a relatively short region, i.e., the hydrograph boundary layer (Parker et al., 2008; An et al., 2017b), downstream of the feed point. Unlike the findings of Parker et al. (2008), here oscillations of the riverbed composition extend along the whole reach and are not limited to the HBL (see Figures 6D,F). Thus, the original idea of the HBL breaks down in this case, mostly due to the fact that alternating bed load-laden and bed load-free flow releases propagate the oscillations of the riverbed composition along the whole reach. The grain-size distribution oscillations are anyway more intense inside the hydrograph boundary layer due to the fact that the riverbed level, and thus the slope, is strongly oscillating inside it. Bed load-free releases produce fluctuations of riverbed level and composition during each event, even after the first few SBT operations (see Figure 10), and induce the system to evolve toward the equilibrium configuration, repeating the same cycle over and over. Results in Figures 10A,C show that the amplitude (ca. 3 m) as well as the length of the hydrograph boundary layer (less than 2 km) are comparable to the ones shown in Figures 6C,E. However, the average deviatoric riverbed level (solid black line in Figures 10A,C) shows an erosion trend that confirms the general trajectory predicted by the results shown in Figure 5, where to all runs under OC2a and b (Figures 5C,E), an equilibrium slope is associated, which is milder than the initial runs (compare the results with the dashed line in Figure 5). The fluctuations of riverbed composition caused by bed load-free flow releases are the same after few events (Figures 10B,D) or at equilibrium (Figures 6D,F), that is, riverbed composition adapts to the imposed boundary conditions faster than the riverbed level.
The cycle over which the fluctuations around the equilibrium state occur is represented in Figure 7, where it is shown how the system returns to the equilibrium conditions after each bed load-laden flow release under OC1 (Figures 7A,B) and OC3 (Figures 7G,H), after two releases (alternate bed load-laden and bed load-free) under OC2a (Figures 7C,D), and after four releases (one bed load-laden followed by three bed load-free) under OC2b (Figures 7E,F), that is, the reworking of the riverbed surface is negligible under OC1 and OC3, where hydrographs and sedimentographs are always synchronized, while it is not under OC2a and b, where bed load-free releases cause an imbalance between transport capacity and sediment feeding. The dynamics imposed by bedload-free releases is repeated from the first few events on (not shown here), which confirms that the riverbed composition is reworked along the whole reach, starting with the initial SBT operations. The trend of the riverbed composition close to the upstream end (Figures 7C–F) is in line with the one relative to the bed load rate during flood events described in the literature (Mao, 2012). That is, during the initial stages of the rising limb, mostly fine particles are entrained, while coarse particles of the feeding and those on the riverbed surface are not, hence causing coarsening. During the following stages of the rising limb, the transport capacity increases together with the capacity of entrained coarse particles into bed load, leaving finer particles on the riverbed surface, hence causing fining. On the contrary, during the falling limb and the following bed load-free water release(s), coarse particles are deposited first, causing the coarsening of the riverbed.
6.3 Implications for river management
The construction of SBTs is among the few techniques applied to restore water and sediment continuity without removing man-made obstructions. Projects restoring natural sediment and water regimes in rivers aim to promote morphological complexity, hydraulic diversity, and ecosystem health (Lisle, 1989; Merz and Ochikubo Chan, 2005; Elosegi et al., 2010; Czapiga et al., 2022). Studies on the ecological effects of SBT operations suggest that micro- and macroinvertebrate density and richness (Auel et al., 2017; Martín et al., 2017; Serrana et al., 2018) as well as fish habitat suitability (Sumi et al., 2012) are positively affected by SBT operations. This notwithstanding, the outcome of such operations is strongly dependent on the frequency of the events (Martín et al., 2017; Serrana et al., 2018). Extreme magnitudes or frequencies of SBT operations could have severe consequences on the river ecosystem (Martín et al., 2017). However, since SBTs are operated only few times a year (Mueller-Hagmann, 2017; Sumi, 2017), they impose an army schedule on the downstream reach: “long periods of relative quiet punctuated by short bursts of frenetic activity” (Wohl, 2013). That is, when SBTs are not releasing bed load-laden or bed load-free flows to the downstream reach, the latter is fed only with the environmental flow and no sediment (Martín et al., 2017; Serrana et al., 2018) and can be considered morphologically inactive during non-operational times (not counting potential feeding from tributaries). A release pattern is repeated every year or so when SBTs are operated, but when they are not, the downstream reach keeps the morphological configuration reached at the end of the SBT operation. Our study confirms the importance of the frequency of SBT operations and proves additionally that the effects of SBT operations are strongly dependent on how (not only how often) an SBT is operated, i.e., on the operational conditions and scenarios. Results in Figures 5–10 show that releasing bed load-free flows can induce the formation of an HBL and the rework of the riverbed composition in the downstream reach even at the early stages. The riverbed level oscillates in a region close to the upstream end, while the riverbed composition is reworked along the entire reach (see Figure 6), even after the first few SBT operations (see Figure 10). Except for OC2b, the average armoring ratio at equilibrium is always smaller than 2, i.e., SBT operations cause the riverbed to be in unarmored conditions at equilibrium (Hassan et al., 2006). Furthermore, riverbed composition changes occur, almost in all cases, at the event scale (Figure 7) and are not greatly affected by the initial state of the riverbed surface (as discussed in the Supplementary Appendix A1.2). Improved sediment mobility and the presence of gravel and cobbles on the riverbed have tremendous ecological importance as a habitat for benthic macroinvertebrates and fish (Kondolf and Matthews, 1991; Kondolf et al., 2008; Hauer, 2015).
Results in Figure 7 show that the downstream riverbed composition oscillates during a cycle of bed load-free and bed load-laden releases, causing the riverbed to be either in unarmored or in mobile-armor conditions. That is, depending on whether the last SBT release is bed load-laden or bed load-free, the resulting riverbed composition is different (see Figures 7C,E). Moreover, SBTs are operating only a few times a year and are therefore unable to restore natural hydrological processes (Wohl et al., 2015) since during non-operational times, no sediment and environmental flows are fed to the downstream reach (Martín et al., 2017; Serrana et al., 2018). Thus, knowing the pattern of the SBT releases allows predicting the riverbed composition in the downstream reach, which may last for several months during non-operational times.
Our analysis demonstrates the critical role of managing SBT operations in shaping the downstream river morphology. Specifically, to reduce incision, or rather favor deposition to revert river damming effects, prioritizing bed load-laden water releases over bed load-free ones is essential. Bed load-free releases facilitate the transport of sediment deposited near the SBT outlet, accelerating the reworking of the riverbed texture, with a minimal impact on riverbed elevation. Moreover, bedload-free water releases favor the formation of the HBL, which causes strong oscillations of riverbed level and composition in a confined region. This may have negative effects on 1) infrastructures due to the large variation in the riverbed level (Surian and Rinaldi, 2003), 2) fish due to stranding (Nagrodski et al., 2012), and 3) macroinvertebrates due to drift (Bruno et al., 2013). To avoid such strong oscillations and counteract the formation of the HBL, bedload-laden releases should be favored against bedload-free releases. However, the release of only bedload-laden waters (OC1 and OC3) can also have negative effects such as an increase in the downstream slope due to large floods (scenario III) where the SBT is operated above the transport capacity of the downstream river reach. Overall, coupling bedload-laden releases with controlled water releases may be the most effective strategy to reduce sediment deposition and promote downstream transport.
7 Conclusion
The rapid increase in SBT development worldwide has outpaced our understanding of their potential morphological effects. Although SBTs are commonly assumed to be beneficial in restoring sediment continuity past dams, this assumption has not been rigorously evaluated. The primary method of gaining an insight into the effects of SBTs has been through long-term field monitoring. However, due to the duration of time it takes for these effects to be observed in the field, we may be experiencing the full effects of SBT dams before they are fully understood. To proactively understand the geomorphic impacts of SBTs, we modeled the effects on grain-size distribution and bed elevation associated with typical (still idealized) SBT release scenarios in the Alps. Using a 1-D morphodynamic model, we simulated different SBT release scenarios based on a simplified geometry resembling the reach of the Albula River downstream of the Solis SBT. Our model results can be summarized as follows:
• The more bed load-free flow is released, the milder the riverbed slopes become, and the coarser their composition turns out to be. If the released material’s grain-size distribution becomes finer in relation to a reduction in the released bedload volume, the downstream riverbed composition becomes finer, contrasting with the coarser upstream composition.
• Repetitive SBT operations at mobile-bed equilibrium yield cyclic riverbed changes. The riverbed undergoes aggradation and fining during bedload-laden releases and degradation and coarsening with bed load-free releases. Riverbed level oscillations mainly occur upstream near the inlet, forming a hydrograph boundary layer (HBL). The HBL’s longitudinal extension and amplitude strongly depend on the frequency of bed load-free releases. However, riverbed grain-size distribution changes span the entire downstream length with the strongest intensity within the HBL.
• In the short term, the riverbed displays oscillations after only a few SBT operations.
• Our insights particularly pertain to type-B SBTs, where bed load-free releases are more prevalent than in type-A SBTs.
Although an experienced geomorphologist could qualitatively describe most of the processes happening in the downstream river reach of an SBT, our quantitative, objective framework offers a way to evaluate the potential influences of upcoming SBT developments. Present SBT project monitoring, due to its limited scope, faces challenges in providing significant insights into the detailed description of the morphological response of the river downstream from SBT. While our method should not replace regular monitoring of the morphological impact, it aids in formulating testable hypotheses for more targeted monitoring.
Data availability statement
The data can be made available by the first author upon reasonable request.
Author contributions
MF: conceptualization, data curation, formal analysis, investigation, methodology, writing review–editing. DV: funding acquisition, project administration, resources, software, validation, and writing–review and editing. RB: funding acquisition, project administration, resources, validation, and writing–review and editing. AS: conceptualization, methodology, project administration, resources, software, supervision, validation, writing–original draft, and writing–review and editing.
Funding
The author(s) declare that financial support was received for the research, authorship, and/or publication of this article. This work was co-funded by the Swiss Federal Office for the Environment (FOEN) and open access funding by ETH Zurich.
Acknowledgments
The authors would like to thank the Swiss Federal Office for the Environment (FOEN) for their financial support in the scope of the project “Sediment transport and habitat dynamics” within the research program “Hydraulic Engineering and Ecology,” and the Swiss Competence Center for Energy Research—Supply of Electricity (SCCER-SoE), to which the project was further affiliated. They extend their gratitude to C. Oertli and T. Ziegler of the electric power company of Zurich (Elektrizitätswerk der Stadt Zürich, ewz) and D. Rickenmann of the Swiss Federal Institute for Forest, Snow, and Landscape Research (WSL) for providing data relative to the Solis SBT and the upstream reach of the Albula River, respectively. They would also like to thank M. Saletti of the Department of Fisheries and Oceans (Government of Canada) for accurate proofreading and the valuable comments that greatly helped them improve the paper. Eventually, they kindly acknowledge the three reviewers for their careful reading of the manuscript and their many insightful comments and suggestions that helped them in improving the paper, too.
Conflict of interest
The authors declare that the research was conducted in the absence of any commercial or financial relationships that could be construed as a potential conflict of interest.
The author(s) declared that they were an editorial board member of Frontiers, at the time of submission. This had no impact on the peer review process and the final decision.
Publisher’s note
All claims expressed in this article are solely those of the authors and do not necessarily represent those of their affiliated organizations, or those of the publisher, the editors, and the reviewers. Any product that may be evaluated in this article, or claim that may be made by its manufacturer, is not guaranteed or endorsed by the publisher.
Supplementary material
The Supplementary Material for this article can be found online at: https://www.frontiersin.org/articles/10.3389/feart.2024.1357759/full#supplementary-material
References
Albayrak, I., Mueller-Hagmann, M., and Boes, R. (2019). “Efficiency evaluation of swiss sediment bypass tunnels,” in Proceedings of 3rd International Workshop on Sediment Bypass Tunnels. doi:10.3929/ethz-b-000337945
An, C., Cui, Y., Fu, X., and Parker, G. (2017a). gravel-bed river evolution in earthquake-prone regions subject to cycled hydrographs and repeated sediment pulses. Earth Surf. Process. Landforms 42, 2426–2438. doi:10.1002/esp.4195
An, C., Fu, X., Wang, G., and Parker, G. (2017b). Effect of grain sorting on gravel-bed river evolution subject to cycled hydrographs: bedload sheets and breakdown of the hydrograph boundary layer. J. Geophys. Res. Earth Surf. 122, 1513–1533. doi:10.1002/2016JF003994
Auel, C., and Boes, R. (2011). “Sediment bypass tunnel design — review and outlook,” in ICOLD Symposium - dams under changing challenges. Editors A. Schleiss, and R. Boes (London, UK: Taylor and Francis), 403–412.
Auel, C., Kantoush, S., and Sumi, T. (2016). “Positive effects of reservoir sedimentation management on reservoir life - Examples from Japan,” in Proc. 84th ICOLD Annual meeting, Johannesburg, South Africa, May, 4.11–14, 20.
Auel, C., Kobayashi, S., Takemon, Y., and Sumi, T. (2017). Effects of sediment bypass tunnels on grain size distribution and benthic habitats in regulated rivers. Int. J. River Basin Manag. 15, 433–444. doi:10.1080/15715124.2017.1360320
Baumer, A., and Radogna, R. (2015). “Rehabilitation of the Palagnedra sediment bypass tunnel (2011-2013),” in First International Workshop on Sediment Bypass Tunnels, ETH Zurich, Switzerland. Editor R. Boes, 235–245. Laboratory of Hydraulics, Hydrology and Glaciology (VAW).
Boes, R. (2015). “First international workshop on sediment bypass tunnels,” in VAW-Mitteilung 232. Editor R. Boes Laboratory of Hydraulics, Hydrology and Glaciology (VAW), ETH Zurich, Switzerland.
Boes, R., Auel, C., Hagmann, M., and Albayrak, I. (2014). “Sediment bypass tunnels to mitigate reservoir sedimentation and restore sediment continuity,” in Reservoir sedimentation. Editors A. J. Schleiss, G. de Cesare, M. J. Franca, and M. Pfister (London, UK: Taylor and Francis Group), 221–228.
Boes, R., Beck, C., Lutz, N., Lais, A., and Albayrak, I. (2017). “Hydraulics of water, air-water and sediment flow in downstream-controlled sediment bypass tunnels,” in Proc. 2nd Intl. Workshop on Sediment Bypass Tunnels, Kyoto, Japan, 1–19.
Bombar, G., Elçi, Ş., Tayfur, G., Güney, M., and Bor, A. (2011). Experimental and numerical investigation of bed-load transport under unsteady flows. J. Hydraulic Eng. 137, 1276–1282. doi:10.1061/(asce)hy.1943-7900.0000412
Brandt, S. A. (2000). Classification of geomorphological effects downstream of dams. Catena 40, 375–401. doi:10.1016/S0341-8162(00)00093-X
Bruno, M. C., Siviglia, A., Carolli, M., and Maiolini, B. (2013). Multiple drift responses of benthic invertebrates to interacting hydropeaking and thermopeaking waves. Ecohydrology 6, 511–522. doi:10.1002/eco.1275
Bunte, K. (2004). State of the science review, gravel mitigation and augmentation below hydroelectric dams: a geomorphological perspective. Tech. rep.
Chang, T.-J., and Lai, J.-S. (2019). Proceedings of the third International Workshop on Sediment Bypass Tunnels, Taipei, Taiwan. National Taiwan University.
Cui, Y., Parker, G., Pizzuto, J., and Lisle, T. (2003). Sediment pulses in mountain rivers: 2. Comparison between experiments and numerical predictions. Water Resour. Res. 39. doi:10.1029/2002wr001805
Czapiga, M., Blom, A., and Viparelli, E. (2022). Sediment nourishments to mitigate channel bed incision in engineered rivers. J. Hydraulic Eng. 148. doi:10.1061/(asce)hy.1943-7900.0001977
[Dataset] Vetsch, D., Siviglia, A., Ehrbar, D., Facchini, M., Kammerer, S., Koch, A., et al. (2017a). Basement — basic simulation environment for computation of environmental flow and natural hazard simulation.
Die Moran, A., El Kadi Qbderrezzak, K., Mosselman, E., Habersack, H., Lebert, F., Aelbrecht, D., et al. (2013). Physical model experiments for sediment supply to the old Rhine through induced bank erosion. Int. J. Sediment Res. 28, 431–447. doi:10.1016/S1001-6279(14)60003-2
Dietrich, W., Kirchner, J., Ikeda, H., and Iseya, F. (1989). Sediment supply and the development of the coarse surface layer in gravel-bedded rivers. Nature 342, 215–217. doi:10.1038/340215a0
Elosegi, A., Díez, J., and Mutz, M. (2010). Effects of hydromorphological integrity on biodiversity and functioning of river ecosystems. Hydrobiologia 657, 199–215. doi:10.1007/s10750-009-0083-4
Facchini, M. (2018). “Downstream moprhological effects of sediment bypass tunnels (ph.D. Thesis),” in VAW-Mitteilung 243. Editor R. Boes Laboratory of Hydraulics, Hydrology and Glaciology (VAW), ETH Zurich.
Facchini, M., Siviglia, A., and Boes, R. (2015). “Downstream morphological impact of a sediment bypass tunnel: preliminary results and forthcoming actions,” in First International Workshop on Sediment Bypass Tunnels, ETH Zurich, Switzerland. Editor R. Boes, 137–146. Laboratory of Hydraulics, Hydrology and Glaciology (VAW).
Ferrer-Boix, C., and Hassan, M. (2015). Channel adjustments to a succession of water pulses in gravel bed rivers. Water Resour. Res. 51, 8773–8790. doi:10.1002/2015wr017664
Fukuda, T., Yamashita, K., Osada, K., and Fukuoka, S. (2012). “Study on flushing mechanism of dam reservoir sedimentation and recovery of riffle-pool in downstream reach by a flushing bypass tunnel,” in International Symposium on Dams for a Changing World, 1–6.
Hager, W. H., Schleiss, A. J., Boes, R. M., and Pfister, M. (2020). Hydraulic engineering of dams. London: Taylor and Francis. doi:10.1201/9780203771433
Hassan, M., Egozi, R., and Parker, G. (2006). Experiments on the effect of hydrograph characteristics on vertical grain sorting in gravel bed rivers. Water Resour. Res. 42, 1–15. doi:10.1029/2005WR004707
Hauer, C. (2015). Review of hydro-morphological management criteria on a river basin scale for preservation and restoration of freshwater pearl mussel habitats. Limnologica 50, 40–53. doi:10.1016/j.limno.2014.11.002
Hirano, M. (1971). River bed degradation with armoring. Transactions of the Japan Society of Civil Engineers 3, 194–195.
Hirano, M. (1972). Studies on variation and equilibrium state of a river bed composed of nonuniform material. Transactions of the Japan Society of Civil Engineers 4, 128–129.
Humphries, R., Venditti, J., Sklar, L., and Wooster, J. (2012). Experimental evidence for the effect of hydrographs on sediment pulse dynamics in gravel-bedded rivers. Water Resour. Res. 48. doi:10.1029/2011wr010419
Khosravi, K., Chegini, A., Binns, A., Daggupati, P., and Mao, L. (2019). Difference in the bed load transport of graded and uniform sediments during floods: an experimental investigation. Hydrology Res. 50, 1645–1664. doi:10.2166/nh.2019.078
Kobayashi, S., Fukuroi, H., Sumi, T., and Takemon, Y. (2018). “Sediment derivation by bypass tunnel restores downstream environment,” in Twenty-sixth international congress on large dams (Vienna, Austria, CRC Press), 3464–3465. doi:10.1201/9780429465086
Kondolf, G. (1997). PROFILE: hungry water: effects of dams and gravel mining on river channels. Environ. Manag. 21, 533–551. doi:10.1007/s002679900048
Kondolf, G., Gao, Y., Annandale, G., Morris, G., Jiang, E., Zhang, J., et al. (2014). Sustainable sediment management in reservoirs and regulated rivers: experiences from five continents. Earth’ s Future 2, 256–280. doi:10.1002/2013ef000184
Kondolf, G., and Matthews, W. (1991). “Management of coarse sediment in regulated rivers of California,” in UC berkley technical completion reports (Davis, California: University of California Water Resources Center), 80, 102.
Kondolf, G., and Wilcock, P. (1996). The flushing flow problem: defining and evaluating objectives. Water Resour. Res. 32, 2589–2599. doi:10.1029/96wr00898
Kondolf, G., Williams, J., Horner, T., and Milan, D. (2008). “Assessing physical quality of spawning habitat,” in American Fisheries Society Symposium. Editors D. Sear, and P. DeVries, 1–26.
Lane, E. (1955). The importance of fluvial morphology in hydraulic engineering. Hydraulic Laboratory Report No. 372, Denver, Colorado, United States: Engineering Laboratories of the US Department of the Interior, Bureau of Reclamation. 81, 1–17.
Lisle, T. (1989). Sediment transport and resulting deposition in spawning gravels, north coastal California. Water Resour. Res. 25, 1303–1319. doi:10.1029/wr025i006p01303
Mackin, J. (1948). Concept of the graded river. Geol. Soc. Am. Bull. 59, 463–512. doi:10.1130/0016-7606(1948)59[463:cotgr]2.0.co;2
Mao, L. (2012). The effect of hydrographs on bed load transport and bed sediment spatial arrangement. J. Geophys. Res. Earth Surf. 117, 1–16. doi:10.1029/2012JF002428
Martín, E., Doering, M., and Robinson, C. (2017). Ecological assessment of a sediment by-pass tunnel on a receiving stream in Switzerland. River Res. Appl. 33, 925–936. doi:10.1002/rra.3145
Merz, J. E., and Ochikubo Chan, L. K. (2005). Effects of gravel augmentation on macroinvertebrate assemblages in a regulated California River. River Res. Appl. 21, 61–74. doi:10.1002/rra.819
Mueller-Hagmann, M. (2017). “Hydroabrasion in high speed flows at sediment bypass tunnels (Ph.D. thesis),” in VAW-Mitteilung 239. Editor R. Boes Laboratory of Hydraulics, Hydrology and Glaciology (VAW), ETH Zurich.
Nagrodski, A., Raby, G., Hasler, C., Taylor, M., and Cooke, S. J. (2012). Fish stranding in freshwater systems: sources, consequences, and mitigation. J. Environ. Manag. 103, 133–141. doi:10.1016/j.jenvman.2012.03.007
Nelson, P. A., Venditti, J. G., Dietrich, W. E., Kirchner, J. W., Ikeda, H., Iseya, F., et al. (2009). Response of bed surface patchiness to reductions in sediment supply. J. Geophys. Res. Earth Surf. 114. doi:10.1029/2008jf001144
Parker, G. (2004). 1D Sediment transport morphodynamics with applications to rivers and turbidity currents Champaign, Illinois, USA: University of Illinois - Ven Te Chow Hydrosystems Laboratory.
Parker, G. (2008). Transport of gravel and sediment mixtures. In Sedimentation engineering: processes, measurements, modeling, and practice, ed. M. H. Garcia ASCE American Society of Civil Engineers, 165–251.
Parker, G., Hassan, M., and Wilcock, P. (2008). “Adjustment of the bed surface size distribution of gravel-bed rivers in response to cycled hydrographs,” in Gravel-bed rivers VI: from process understanding to river restoration, 1–47.
Phillips, C. B., Hill, K. M., Paola, C., Singer, M. B., and Jerolmack, D. J. (2018). Effect of flood hydrograph duration, magnitude, and shape on bed load transport dynamics. Geophys. Res. Lett. 45, 8264–8271. doi:10.1029/2018GL078976
Pitlick, J., and Wilcock, P. (2001). Relations between streamflow, sediment transport, and aquatic habitat in regulated rivers. Water Sci. Appl. 4, 185–198. doi:10.1029/WS004p0185
Reid, I., Frostick, L. E., and Layman, J. T. (1985). The incidence and nature of bedload transport during flood flows in coarse-grained alluvial channels. Earth Surf. Process. Landforms 10, 33–44. doi:10.1002/esp.3290100107
Ribberink, J. S. (1987). Mathematical modelling of one-dimensional morphological changes in rivers with non-uniform sediment. Ph.D. thesis. TU Delft, The Netherlands.
Serrana, J., Yaegashi, S., Kondoh, S., Li, B., Robinson, C., and Watanabe, K. (2018). Ecological influence of sediment bypass tunnels on macroinvertebrates in dam-fragmented rivers by DNA metabarcoding. Sci. Rep. 8, 10185–10210. doi:10.1038/s41598-018-28624-2
Siviglia, A., Stecca, G., and Blom, A. (2017). “Modelling of mixed–sediment morphodynamics in gravel–bed rivers using the active–layer approach,” in Gravel-bed rivers: processes and disasters. Editors D. Tsutsumi, and J. Laronne (Chichester, UK: John Wiley and Sons, Ltd). John wiley edn.), 703–728. doi:10.1002/9781118971437.ch26
Smart, G., and Jaeggi, M. (1983). “Sediment transport on steep slopes,”. VAW-Mitteilung. Editor D. Vischer (Zurich, Switzerland: Laboratory of Hydraulics, Hydrology and Glaciology (VAW), ETH Zurich), 64, 1–191.
Stecca, G., Siviglia, A., and Blom, A. (2014). Mathematical analysis of the Saint-Venant-Hirano model for mixed-sediment morphodynamics. Water Resour. Res. 50, 7563–7589. doi:10.1002/2014WR015251
Stecca, G., Siviglia, A., and Blom, A. (2016). An accurate numerical solution to the Saint-Venant-Hirano model for mixed-sediment morphodynamics in rivers. Adv. Water Resour. 93 Part A, 39–61. doi:10.1016/j.advwatres.2015.05.022
Strickler, A. (1923). Beiträge zur Frage der Geschwindigkeitsformel und der Rauhigkeitszahlen für Ströme, Kanäle und geschlossene Leitungen. No. 16 in Amt für Wasserwirtschaft: Mitteilungen des Amtes für Wasserwirtschaft (Sekretariat des Eidgenössischen Amtes für Wasserwirtschaft)
Sumi, T. (2017). Proceedings of the second international workshop on sediment Bypass tunnels. Japan: DPRI, University of Kyoto.
Sumi, T., Kantoush, S., and Suzuki, S. (2012). “Performance of Miwa Dam sediment bypass tunnel: evaluation of upstream and downstream state and bypassing efficiency,” in International Symposium on Dams for a Changing World (Kyoto: International COmmission on Large Dams (ICOLD)), 576–596.
Surian, N., and Rinaldi, M. (2003). Morphological response to river engineering and management in alluvial channels in Italy. Geomorphology 50, 307–326. doi:10.1016/S0169-555X(02)00219-2
Toro-Escobar, C., Paola, C., and Parker, G. (1996). Transfer function for the deposition of poorly sorted gravel in response to streambed aggradation. J. Hydraulic Res. 34, 35–53. doi:10.1080/00221689609498763
VAW (2010). Solis sediment Bypass tunnel — hydraulic study (geschiebeumleitstollen Solis — hydraulische modellversuche). Tech. Rep. 4269, Laboratory of Hydraulics, Hydrology and Glaciology (VAW), [in German], ETH Zurich, Zurich, Switzerland.
Vetsch, D., Siviglia, A., Ehrbar, D., Facchini, M., Kammerer, S., Koch, A., et al. (2017b). System manuals of BASEMENT. Laboratory of hydraulics, glaciology and hydrology (VAW). Zurich, Switzerland: ETH Zurich. Version 2.7.
Viparelli, E., Gaeuman, D., Wilcock, P., and Parker, G. (2011). A model to predict the evolution of a gravel bed river under an imposed cyclic hydrograph and its application to the Trinity River. Water Resour. Res. 47. doi:10.1029/2010wr009164
Vischer, D., Hager, W., Casanova, C., Joos, B., Lier, P., and Martini, O. (1997). “Bypass tunnels to prevent reservoir sedimentation,” in International Congress on large dams (florence: international COmmission on large dams (ICOLD)), 605–624.
Waters, K., and Curran, J. (2015). Linking bed morphology changes of two sediment mixtures to sediment transport predictions in unsteady flows. Water Resour. Res. 51, 2724–2741. doi:10.1002/2014wr016083
Wilcock, P., and Crowe, J. C. (2003). Surface-based transport model for mixed-size sediment. J. Hydraulic Eng. 129, 120–128. doi:10.1061/(asce)0733-9429(2003)129:2(120)
Wilcock, P., and MacArdell, B. (1993). Surface-based fractional transport rates: mobilization thresholds and partial transport of a sand-gravel sediment. Water Resour. Res. 29, 1297–1312. doi:10.1029/92wr02748
Williams, G. P., and Wolman, M. G. (1984). Downstream effects of dams on alluvial rivers, 1286. Washington, DC, USA: U.S. Geological Surveys Professional Papers (U.S. Geological Surveys), 83. doi:10.1126/science.277.5322.9j
Wohl, E. (2013). Wide rivers crossed: the south platte and the Illinois of the American prairie. Boulder, CO, USA: University Press of Colorado.
Wohl, E., Lane, S., and Wilcox, A. (2015). The science and practice of river restoration. Water Resour. Res. 51, 5974–5997. doi:10.1002/2014WR016874
Keywords: sediment bypass tunnel, gravel-bed, sediment transport, 1D numerical modeling, basement
Citation: Facchini M, Vetsch DF, Boes RM and Siviglia A (2024) Modeling the morphological response of gravel–bed rivers subject to repeated sediment bypass tunnel operations. Front. Earth Sci. 12:1357759. doi: 10.3389/feart.2024.1357759
Received: 19 December 2023; Accepted: 15 March 2024;
Published: 05 April 2024.
Edited by:
Tianming Huang, Chinese Academy of Sciences (CAS), ChinaReviewed by:
Tetsuya Sumi, Kyoto University, JapanAlessandro Stocchino, Hong Kong Polytechnic University, Hong Kong SAR, China
Claudia Ylla Arbos, Delft University of Technology, Netherlands
Copyright © 2024 Facchini, Vetsch, Boes and Siviglia. This is an open-access article distributed under the terms of the Creative Commons Attribution License (CC BY). The use, distribution or reproduction in other forums is permitted, provided the original author(s) and the copyright owner(s) are credited and that the original publication in this journal is cited, in accordance with accepted academic practice. No use, distribution or reproduction is permitted which does not comply with these terms.
*Correspondence: David F. Vetsch, dvetsch@ethz.ch