Evaluation method of oil saturation index OSI for shale oil reservoir based on well logging data
 Han Tian
 Hongliang Wu1*
  Hongjun Xu
- 1Research Institute of Petroleum Exploration and Development, Beijing, China
- 2Research Institute of Exploration and Development, Daqing Oilfield Company Limited, Daqing, China
- 3PetroChina Well Logging Company Limited, Daqing Branch, Daqing, China
Oil saturation index (OSI) serves as an important indicator for potential movable hydrocarbons evaluation of shale oil reservoirs, which is mainly obtained through rock pyrolysis experiments. A new method is proposed to evaluate the OSI of shale quantitatively by NMR logging. The OSI value can be accurately obtained through the experimental measurement of organic carbon content (TOC) and rock pyrolysis of shale samples, which can identify the development of mobile hydrocarbons. Subsequently, the mobile fluid porosity can be obtained based on NMR logging. In order to establish the relationship between OSI value and mobile fluid porosity, it is important to determine the T2 cutoff value corresponding to the mobile fluid porosity. Take shale samples from the first member of the Qingshankou Formation (“Qing 1 Member”) as an example, based on 2D NMR experimental analysis in three different states (original, dried state at 105°C, saturated kerosene), the NMR T2 cutoff value of movable fluid porosity in the shale of Qing 1 Member is clarified as 8 ms. Integrating rock pyrolysis and 2D NMR experiments, it suggests that the NMR bin porosity with T2>8 ms has a good linear relationship with the OSI value obtained by pyrolysis analysis. The NMR bin porosity with T2> 8 ms reflects the OSI value of shale effectively. The larger the NMR bin porosity with T2>8 ms, the higher the mobile oil content of shale reservoir, which is consistent with the understanding of oil-bearing large pores in the Gulong Shale. The NMR bin porosity can continuously evaluate the vertical variation of the mobile hydrocarbon content. Compared with the traditional experimental measurement of finite depth points, this method has significant advantages, and can avoid the possibility of missing potentially movable oil layers.
1 Introduction
With the advancement of hydrocarbon exploration and the increasing understanding of petroleum geology, unconventional oil and gas have attracted a great attention in the past few years. And shale oil has become another focus after shale gas, tight oil, and tight gas, (Li and Zhu, 2020; Yao et al., 2022). Terrestrial hydrocarbon-bearing sedimentary basins in China cover an area of 310 × 104 km2, and organic-rich shale formations are widely distributed, providing a rich oil source for conventional petroleum resources. A large amount of oil remains in the shale layer of hydrocarbon source, and the shale oil resources in the basin are much larger than the conventional oil resources outside the source, which is a significant field to achieve sizeable growth of oil and gas reserves and production in the future (Du et al., 2019; Li et al., 2020).
Shale oil reserved in organic-rich, nano-scale pore-size dominated shale formations is mainly in free and adsorbed state in matrix pores and micro-fractures of shale, which needs to be economically extracted by techniques such as horizontal drilling and hydraulic fracturing (Jiang et al., 2014). Due to the unique generation and enrichment mechanisms of shale oil, the source rock quality and engineering quality need to be considered in addition to reservoir quality compared to conventional oil and gas reservoirs. Although both shale gas and shale oil reservoir evaluation include the “three qualities” parameters of organic shale, there are differences in the subjects of attention. In addition, a significant difference is that shale gas exploration focuses on natural gas in the adsorbed and free states, while shale oil exploration focuses on the free oil content in the reservoir. For shale oil, crude oil in the adsorbed state is poorly movable and difficult to be exploited, while free oil is the most realistic resource applying current technology (Yu et al., 2018). Therefore, quantitative characterization of free oil content is crucial for shale oil reservoir evaluation and sweet spot preference. The OSI is an important indicator for evaluating movable oil in shale formations, which has been widely used in the oil-bearing properties evaluation of shale. The shale oil exploration practices in North America show that the OSI in unconventional oil and gas intervals with production capacity is generally greater than 100 mg HC/g TOC (Chen et al., 2019; Sun et al., 2019). The larger the OSI value, the higher the mobility of shale oil.
Currently, the OSI is mainly calculated with TOC and S1 obtained from rock pyrolysis. The major reason that OSI rather than TOC is used to evaluate shale reservoir potential is that OSI accounts for the movable hydrocarbon content in shale, while TOC only evaluates the total organic carbon. TOC cannot specifically distinguish whether it is producible or residual (Piedrahita and Aguilera, 2017), so it does not truly reflect the recoverable resource potential of shale oil. The OSI, an important parameter for the oil content evaluation of shale oil, can only be obtained through rock pyrolysis experiments at present. Due to the limited and discrete data in experimental analysis, the OSI cannot be widely used in the oil content evaluation of actual shale oil reservoirs. NMR logging has been broadly used in the logging evaluation of unconventional oil and gas reservoirs, with the most significant advantage of directly measuring the hydrogen content in rocks. The hydrogen content is mainly related to the organic matter in rocks and fluids (free oil, bound oil, free water, bound water, and constitution water) in the porous space, and different hydrogen-containing components are characterized with varied distribution intervals and response characteristics on the NMR T1-T2 spectrum (Li et al., 2020; Liu et al., 2019).
In this regard, we propose a new method to calculate the OSI of shale oil. As oil and gas in shale oil reservoirs are easily dispersed, traditional experimental measurement cannot accurately reflect the physical properties and oil content. In order to accurately obtain the shale physical properties and oil content, two-dimensional nuclear magnetic resonance measurement of shale oil samples is conducted in this study under three states: original, drying and saturated kerosene. Based on the changes of 2D NMR spectra under different states, the distribution characteristics of different hydrogen-containing components on 2D NMR T1-T2 are defined, especially the free hydrocarbon component through 2D NMR measurements in three states of shale oil. Combining the TOC, S1 and OSI values of rock samples obtained from rock pyrolysis experimental analysis, the relationship between the NMR free hydrocarbon porosity and the OSI values analyzed by experimental measurements is constructed, and the quantitative calculation of OSI values using NMR logging is realized. Compared with the traditional geochemical experimental measurement, this method has distinct advantages in obtaining continuous OSI curves along the well section, which can be applied to the whole study area to better evaluate the oil content of shale oil reservoirs and minimize the possibility of missing the “sweet spot”.
2 Experimental measurements
The experimental samples all organic-rich shales, were collected from the First Member of Qingshankou Formation in Gulong Sag, Songliao Basin, NE China. In order to carry out the experimental analyses such as rock pyrolysis and 2D NMR respectively, for the specific rock samples, the plunger samples required for the 2D NMR experiments were obtained by wire-cutting. The remaining irregular samples were used for organic carbon content measurement and pyrolysis experimental analyses. The operations are as follows.
2.1 Organic carbon content measurement and rock pyrolysis experiment
The measurement of organic carbon content and the experimental analysis of rock pyrolysis were carried out according to the national standards “GB/T 19145-2003″ and “GB/T 18602-2012″ respectively. The measurement of organic carbon content was carried out by CS230 carbon and sulfur analyzer, and the experimental measurement of rock pyrolysis was carried out by OGE-VI rock pyrolyzer of Beijing Otto Technology Ltd, both of which were conducted under the conditions of room temperature and pressure. The specific experimental operation process is not described here.
The TOC of rock samples and the parameters S1, S2, S4 and Tmax of rock pyrolysis were obtained by the measurement of organic carbon content and the experimental analysis of rock pyrolysis, respectively, as shown in Table 1.
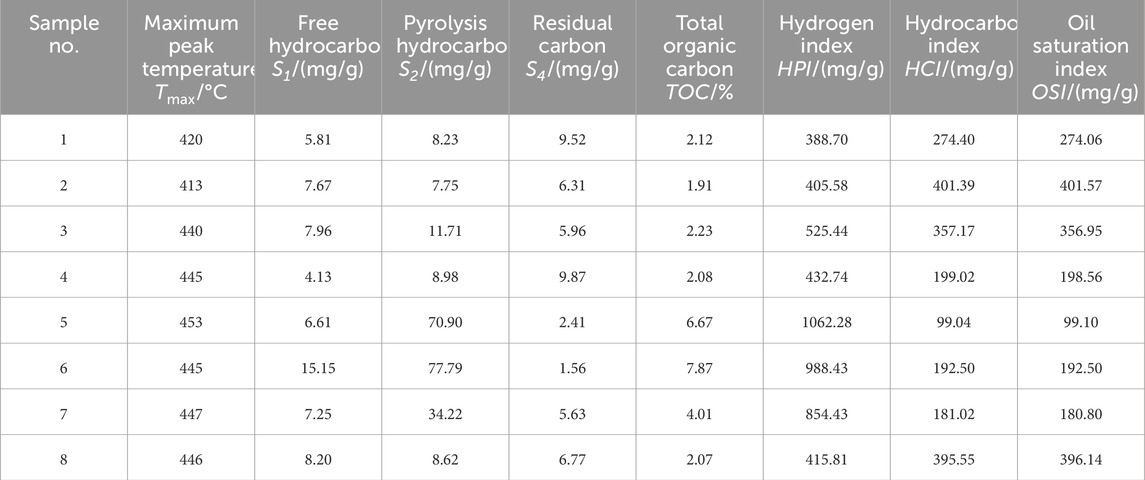
Table 1. Measured results of organic carbon content and pyrolysis experimental parameters of shale samples.
The results show that the shale in the Qing 1 Member is characterized by high TOC, ranging from 1.91% to 7.87% (average value 3.62%). S1 ranges from 4.13 mg/g to 15.15 mg/g; except for sample 6, which contains more than 10 mg/g (average value 7.85 mg/g), indicating a high content of free hydrocarbons. Tmax is between 413°C and 453°C, which is in the main oil generation stage (Bai et al., 2021). The OSI values range from 99.1 mg/g to 401.57 mg/g. If regarding the OSI of shale greater than 100 mg/g as the basis for evaluating the recoverable resource potential of shale oil, the shale in the Qing 1 Member suggests its recoverable resource potential (Wang et al., 2020). TOC and S1+S2 have an excellent correlation with a linear correlation coefficient of 0.997. However, the correlation of TOC and S1 is poor, with a correlation coefficient of 0.4339 (Figure 1), reflecting that the free hydrocarbon content of the shale in the Qing 1 Member does not have a monotonic positive correlation with the organic carbon content; i.e., the higher the organic carbon content, the not definitely high the free hydrocarbon content. There is a large amount of residual hydrocarbons (asphaltenes) in the shale, which is manifested more clearly in the T1-T2 spectra of 2D NMR experiments, therefore it cannot be simply assumed that high organic carbon content indicates high oil content of the shale.
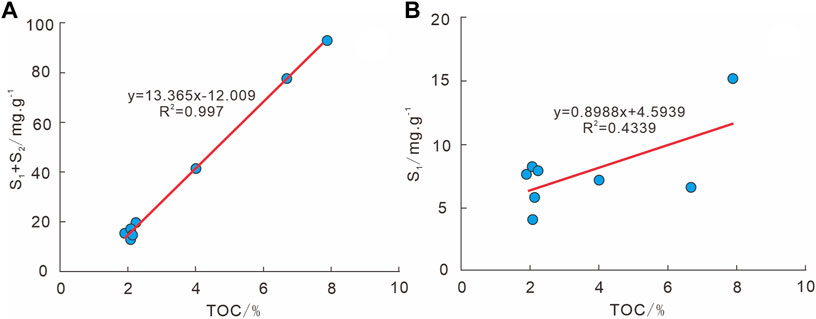
Figure 1. (A) and (B) showing the correlation of TOC with S1+S2 and S1, respectively.
2.2 Two-dimensional NMR experiments
The 2D NMR experiments of rock samples were conducted following the national standard “SY/T6490-2007.” The experimental equipment is a GeoSpec2 high precision multi-dimensional NMR core analyzer from Oxford, U.K., with an operating frequency of 2 MHZ. The acquisition parameters of 2D NMR are: number of scans 128, gain value 40, waiting time 1 s, number of echoes 5000 and echo time 0.1 ms.
In order to clarify the distribution characteristics of different hydrogen-containing components on the T1-T2 NMR spectra, the experiment was carried out for rock samples in three states: original sample, dried state at 105°C and saturated kerosene, respectively, to perform 2D NMR measurements. The specific operations were as follows.
State 1. For the original sample, without oil washing and salt washing measurements, a high precision NMR imaging analyzer was used for 2D NMR T1-T2 mode signal acquisition in the original state. In this step, the fluid components in the rock sample mainly included bound fluids in organic and inorganic pores and some information of movable oil that may be found.
State 2. The original sample was dried by setting the drying temperature at 105°C for 24 h; when dried at 105°C, no capillary bound water could be existed in the sample except for clay-bound water (Dong, 2017). In the meantime, 2D NMR T1-T2 measurements could be performed to obtain the T2 cutoff value of clay-bound water.
State 3. The dried samples were vacuumed and saturated with pressure, in which the vacuuming time was 24 h and the pressure was 50 MPa, and saturated with kerosene to revert the fluid distribution characteristics in the state of formation. Later the same equipment and parameters were used for acquiring 2D NMR T1-T2 signals, and the T2 cutoff value of the movable fluid could be obtained.
Figure 2 shows the results of 2D NMR measurements in different states of two shale samples. For the original sample state, the measured NMR signals include bound water, bound oil, asphaltene and a small amount of movable oil information. In the drying state at 105°C, bound oil and capillary bound water are dispersed, and obvious changes are visible on the T1-T2 spectrum, such as T1<1 ms, T2<1 ms and T2>1 ms regions, and there is a significant weakening of the NMR signals compared with the original sample state. As for the saturated kerosene state, the fluid distribution state can be identified using the T1/T2 ratio. When the T1/T2 ratio is greater than 3, the fluid is mainly distributed in organic pores. When the T1/T2 ratio is in the range of 1-3, the saturated kerosene mainly exists in the intergranular pores of inorganic minerals (Ding et al., 2020; Shi et al., 2021). Compared with the drying state at 105°C, the signals of both yellow and red dashed box parts of sample 2 are significantly enhanced, indicating that the saturated kerogen not only enters the macropore space, but also partly enters the bound oil zone. In terms of the T1/T2 ratio, it mainly falls in the range of 1-3, showing that it mainly penetrates the inorganic pore space. As for sample 6, the signal of the part in the red dashed box is obviously enhanced, reflecting that the kerosene mainly penetrates the inorganic macro-pore space.
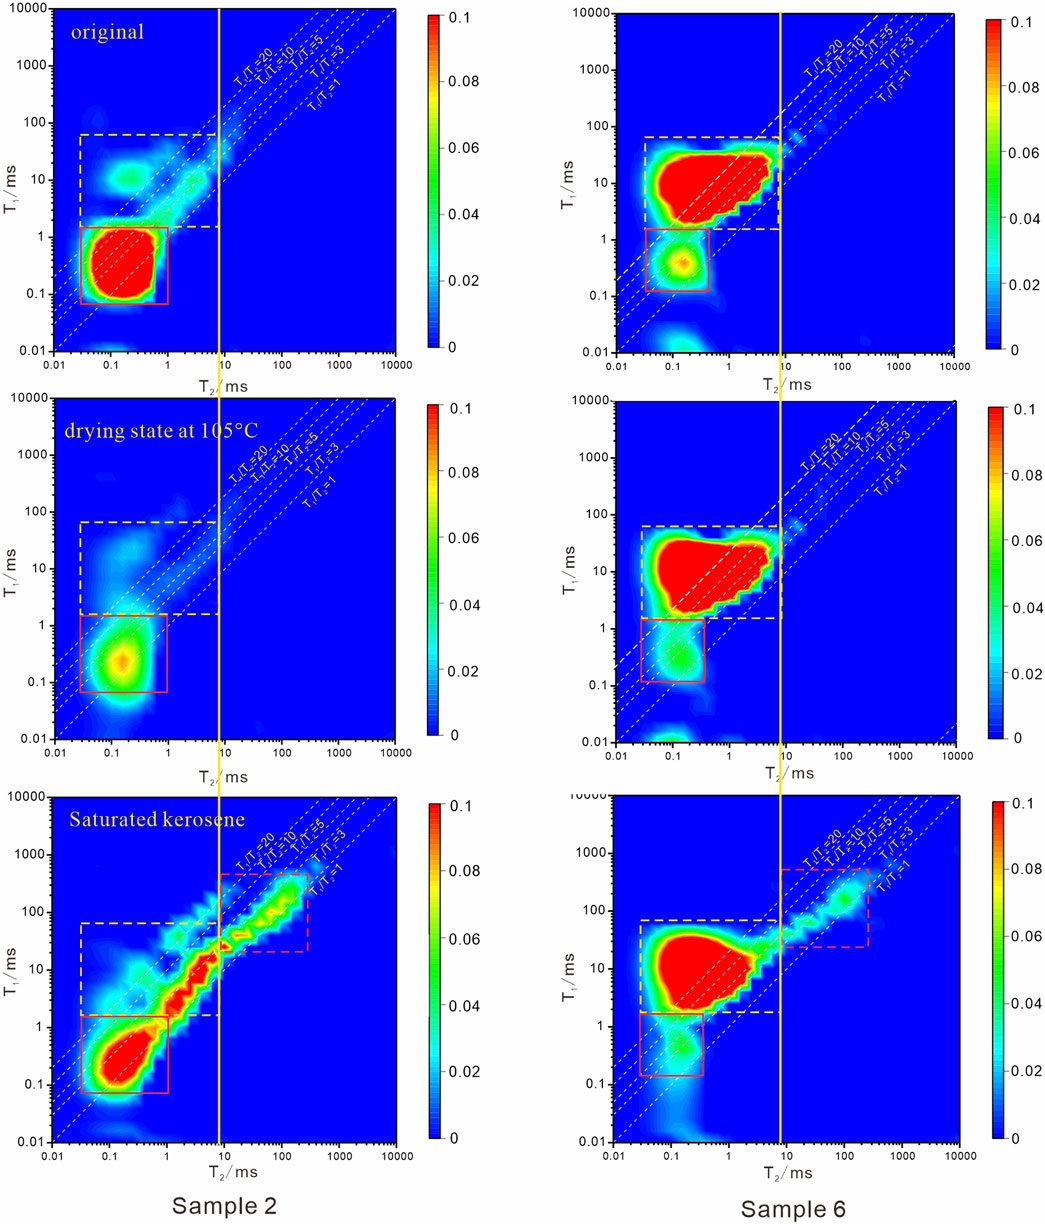
Figure 2. Characteristics of 2D NMR T1-T2 spectrum in different states.
3 Experimental analyses
3.1 NMR experimental analysis
According to the three states above, 2D NMR experimental measurements were carried out on each of the 8 organic-rich shale rock samples in the Qing 1 Member. Previous studies have concluded that the Gulong shale has many light components with high volatility characteristics (Yan et al., 2021), so the original shale rock samples from the field have dissipated some of the light hydrocarbon components. If the analysis was carried out based on the original sample, it could be difficult to truly reflect the actual state of the shale reservoir. For this reason, we dried the rock samples at 105°C for 24 h after measuring the 2D NMR experiments in the original state, to make the movable oil and gas and capillary-bound fluid in the rock samples completely volatilized. Then we vacuumed and saturated them with kerosene to convert them back to the original subsurface fluid distribution state. By comparing the differences in 2D NMR spectrum between the dried and saturated kerosene states, the T2 cutoff values of the movable fluid portion can be clarified. The 2D NMR T1-T2 fluid identification plate given by Kausik et al. (2016) concludes that for the 2 MHZ instrument, the kerogen signal is undetectable, the clay-bound water relaxation rate is faster and the T2 value is smaller, T1-T2 values are between 1 and 2. The asphaltene relaxation rate is faster and the T2 value is smaller, T1/T2 values are between 4 and 15. The oil in organic pores relaxes faster, with T1/T2 values between 2 and 6. Smaller oil relaxation rates occur in inorganic pores, usually with larger T2 values and T1/T2 values between 1 and 2 (Kausik et al., 2016). Based on this understanding, the T2 cutoff value of movable fluid porosity in Gulong Shale is clarified for the first time in combination with the 2D NMR experiments.
In Figure 2, the red solid box mainly shows the signal of clay-bound water, and the yellow dashed box mainly shows the signal of oil in asphaltene, organic pores and inorganic pores. Comparing the two-dimensional NMR spectrums in dried and original sample states, it suggests that the oil and gas signals in the clay-bound water in the red solid box and the T2>1 ms region in the yellow dashed box of sample 2 are significantly weakened. In contrast, the asphaltene portion in the T2<1 ms and T2>5 regions in the yellow dashed box of sample 6 remains unchanged. Based on the difference of T1/T2 NMR spectrum in the two states and the one-dimensional T2 distribution spectrum projected in the corresponding T2 direction, the T2 cutoff value of clay-bound water can be determined. Through the comparative analysis of 8 rock samples, the T2 cutoff value of clay-bound water in the Qing 1 Member of Gulong shale is finally determined to be 1 ms.
Comparing the 2D NMR spectrum of the dried and saturated kerosene states, we find that the signal of the macro-pore part is almost absent in the dried state at 105°C. In contrast, after saturated kerosene, the signals of bound oil and macro-pore region are obviously enhanced, especially in the zone of T2>8 ms (red dashed box), indicating that kerosene mainly enters the macro-pores. The T1/T2 values in this zone are in the range of 1–3, which is the signal of movable oil in inorganic pores, and both rock samples show the same characteristics. Based on the comparative analysis of the 8 rock samples, it can be determined that the T2 cutoff value of movable fluid porosity in the Qing 1 Member of Gulong Shale is about 8 ms.
Centrifugal - NMR measurements can effectively characterize the movable oil content of shale (Zhang, 2019). In order to further determine the T2 cutoff value of movable fluid porosity, NMR measurements were carried out for Gulong shale samples before and after centrifugation. The amplitude of T2 spectrum signal decreases after centrifugation of saturated kerosene shale (the centrifugal force is about 2.76 Mpa). The cumulative signal amplitude difference before and after centrifugation reflects the movable oil quantity of shale oil. The T2 value corresponding to the intersection of the horizontal extension line of the stable section of the cumulative curve after centrifugation and the cumulative curve before centrifugation is the T2 cutoff value of the moving fluid. By analyzing the shale samples measurement results, it is found that the T2 cutoff values range from 6.8 ms to 10.7 ms (Figure 3), most of which are distributed around 8 ms.
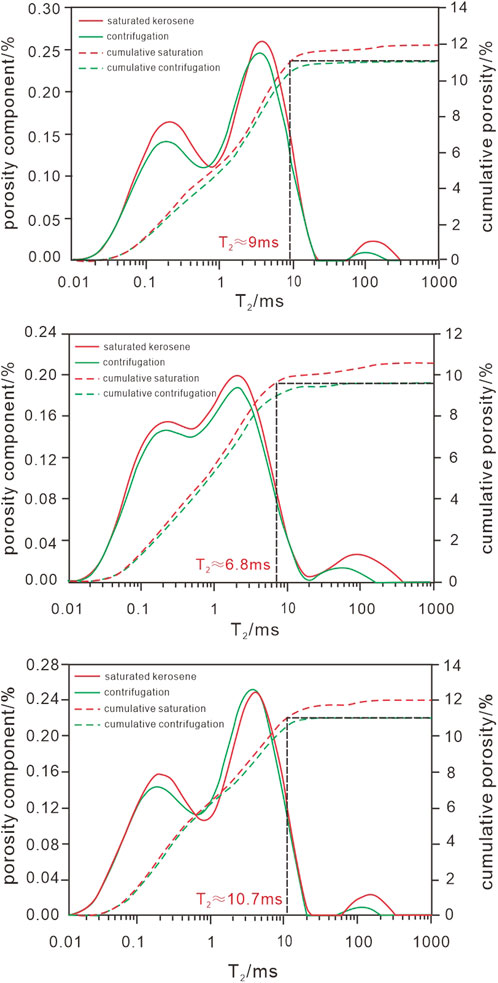
Figure 3. NMR measurements of rock samples before and after centrifugation.
The 2D NMR T1-T2 spectrum and the corresponding 1D T2 distribution spectrum at different states (Figure 4) are used to further analyze the physical characteristics of the shale reservoir in the Qing 1 Member in combination with the identified T2 cutoff values. For the saturated kerosene state, the measured porosity of the shale ranges from 6.6% to 9.4%, with an average of 7.5%. The porosity of movable fluid is lower, and the movable fluid porosity of 8 rock samples ranges from 0.3% to 1.6%, with an average of only 1%. This indicates that the Gulong shale reservoir is dominated by small pores with high bound fluid content.
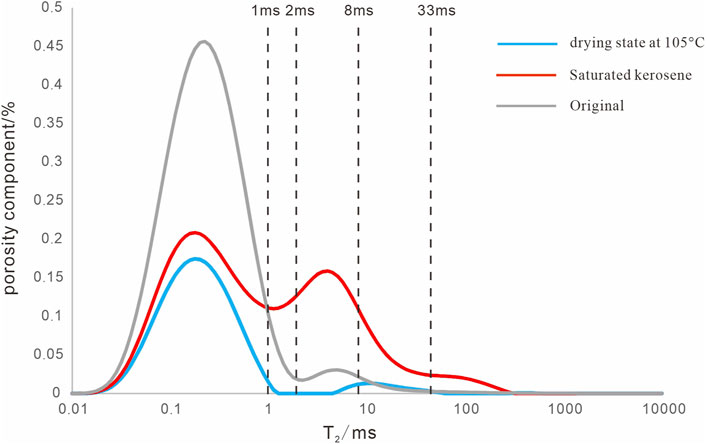
Figure 4. NMR T2 distribution spectrums in different states (sample 3).
3.2 Comprehensive analysis of NMR and pyrolysis experiments
In order to understand the oil-bearing characteristics of the Gulong shale, we analyzed the rock pyrolysis experimental data of the 8 rock samples. In the cross plots of Figure 5, the correlation between free hydrocarbon S1 and organic carbon content TOC is poor. For example, the TOC of sample 5 is as high as 6.67%, but the S1 is only 6.61 mg/g. For sample 8, although the TOC is only 2.07%, the S1 is 8.2 mg/g, which is higher than that of sample 5. Comparing the 2D NMR T1-T2 spectrum of the two drying states, although the TOC of sample 5 is high, it is mainly caused by the high asphaltene content and has a strong signal in the region of T2<1 ms and T1/T2>5 in the 2D NMR T1-T2 spectrum. In contrast, the signal in the corresponding region of sample 8 is weaker, which indicates almost no occurrence of asphaltene. Although asphaltenes can increase the organic carbon content, they do not contribute to the free hydrocarbon content, so the “high TOC, low S1” pattern of sample 5 is observed. This also suggests that for the organic-rich shale in the Qing 1 Member, high organic content is not necessarily associated with high free hydrocarbon content, since the influence of solid organic matter such as kerogen and asphaltene on organic carbon cannot be ignored.
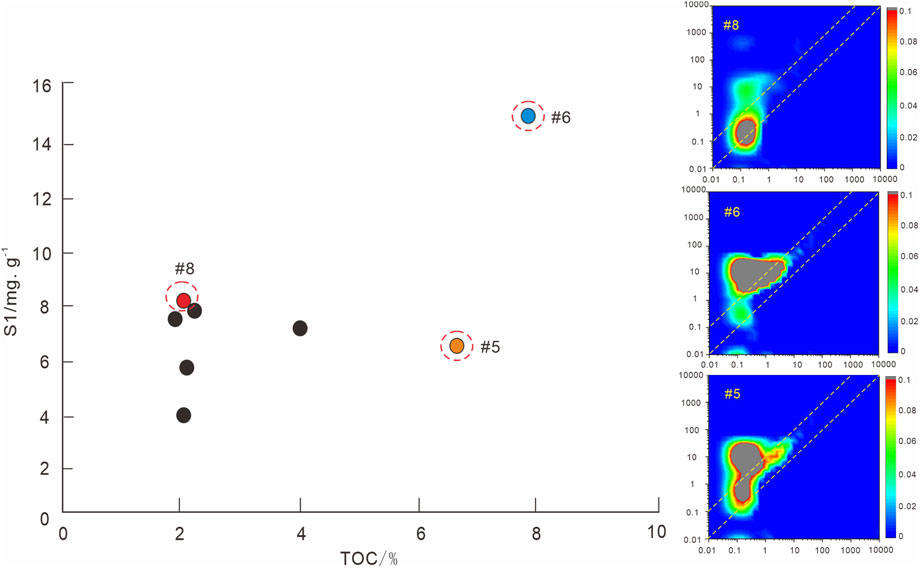
Figure 5. Relationship between the S1 and TOC.
The OSI truly reflects the resource potential of free hydrocarbons in shale oil: OSI=100×S1/TOC (mg/g), where S1 is the free hydrocarbon content of pyrolysis and TOC is the total organic carbon content of rock samples (Cui et al., 2020). The higher the OSI, the better the mobility of the shale oil and the more the mobile hydrocarbon content. For example, the OSI value of sample 5 is 99.1 mg/g, while the OSI value of sample 8 is 396.14 mg/g; although the organic carbon content of sample 5 is higher, the OSI of sample 8 is significantly higher than that of sample 5, indicating that the shale oil in sample 8 is more movable.
Zeng et al. (2019) found that the pore structure of the shales of the Qingshankou Formation in the Songliao Basin significantly influenced the shale oil enrichment, and there is a positive correlation between the OSI and the porosity obtained by mercury injection, with shale oil mainly reserved in the larger pores. Based on the principle of NMR logging, it is known that the NMR T2 spectrum can quantitatively characterize the development of pores with different sizes. The NMR T2 spectrum morphological characteristics visually reflect the structural characteristics of pores. The lateral relaxation time T2 is closely related to the pore size. The smaller the pore, the shorter the relaxation time T2. The larger the pore, the longer the relaxation time T2 (Tian et al., 2020). Since the NMR T2 spectrum reveals the integrated response of hydrogen-containing components in different pore spaces (micro-pores, small pores, medium pores, and large pores). The closer to the left end of the T2 spectrum, the smaller the pore space is reflected. The closer to the right end of the T2 spectrum, the larger the shale pore space is reflected. If a suitable T2 cutoff value can be found, the porosity interval most relevant to the OSI of shale can be established, and the quantitative evaluation of OSI can be accomplished.
Based on the investigations above, the NMR T2 spectrum characteristics of the 8 shale samples were comprehensively analyzed. Considering the morphological characteristics of T2 spectrum in different states and the T2 cutoff values obtained from 2D NMR experiments, the relationship between the OSI and the corresponding bin porosity was analyzed for T2 cutoff values of 1 ms, 2 ms, 8 ms and 33 ms (Figure 4), respectively. Figure 6 shows the correlation coefficients with the OSI, and the different bin porosities are 0.67, 0.8, 0.89, and 0.74, respectively. Since the T2 cutoff value of clay-bound water is 1 ms, the bin porosity with T2>1 ms contains not only the fluid signal in the macro-pore portion, but also the contribution of capillary-bound water and bound oil. Therefore, although the bin porosity with T2>1 ms correlates with the OSI, the correlation is not high. The correlation between OSI and bin porosity becomes significantly better as the T2 cutoff value is chosen as 2 ms. When the T2 cutoff value is 8 ms, the correlation between them is the best. When the T2 cutoff value is increased further, the correlation becomes gradually worse again, indicating that T2=8 ms is just the NMR T2 cutoff value of porosity of movable fluid in the Gulong shale. This suggests that the OSI value of the Gulong shale is closely related to the porosity of the movable fluid, i.e., the larger the porosity of the movable fluid, the larger the OSI value, and the higher the oil content of the shale. Therefore, the porosity of movable fluid can be used to calculate the OSI value of shale, which is calculated as Eq. 1.
where OSI is oil saturation index, mg/g;
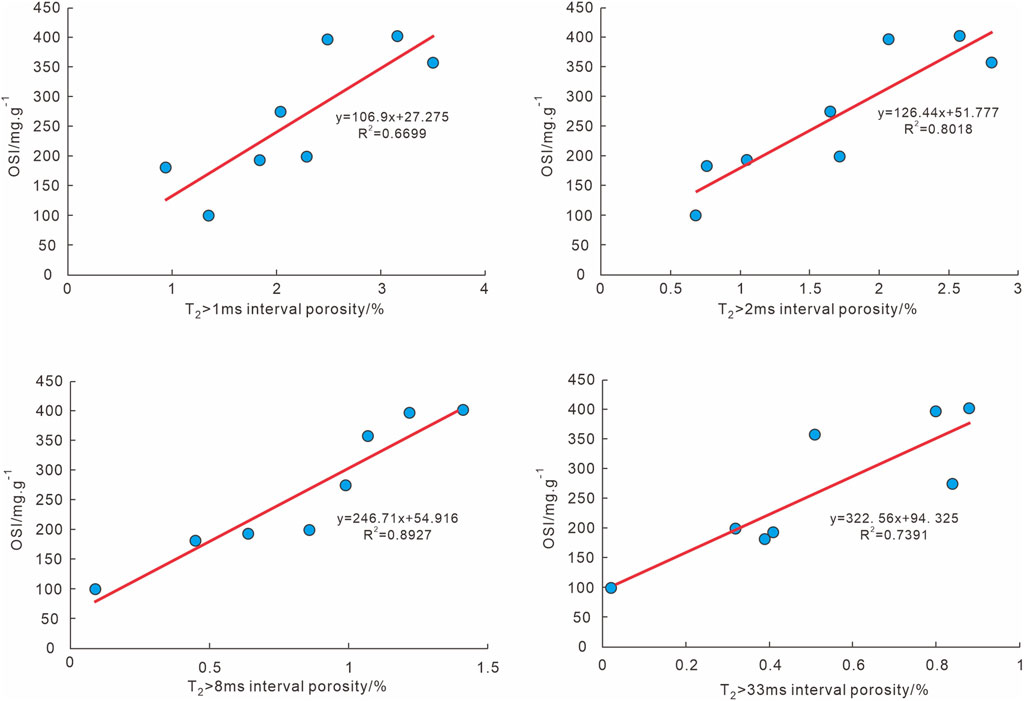
Figure 6. Relationship between OSI and different bin porosities.
The conclusive understanding acquired from the above experimental analysis was also verified by actual drilling and logging. In Figure 7, the logging results of well X1, the sixth panel shows the 1D NMR T2 distribution spectrum. The curve in the seventh panel shows the organic carbon content calculated from the elemental logging, and the red point shows the organic carbon content from the actual rock chip analysis. The curve in the eighth panel shows the bin porosity of T2>8 ms. the red point shows the OSI value obtained from the actual pyrolysis experiment analysis. The variation trend of the bin porosity with T2> 8 ms is in a good agreement with the actual OSI value. The bin porosity is also in a good agreement with the trend of the measured OSI value. The NMR calculation of movable fluid porosity in some well sections have obvious oscillation. From the corresponding conventional curves and mineral profiles obtained from elemental logging, it is known that these well sections are dominated by thin shelly limestone, although the shelly limestone reservoir is not well-developed (Gao et al., 2022). Despite that the actual sampling analysis did not cover the whole well section, from the experimental data of rock chip pyrolysis from 2040–2050 m, the OSI values of the shelly limestone developed section are lower and the movable fluid porosities are smaller, both of which have the same trend. The comparative analysis of the drilled wells further confirms the good correlation between the bin porosity with T2>8 ms and the pyrolysis OSI value. In this well, the OSI value and movable fluid porosity of the Qing 1 Member show an overall decreasing trend from bottom to top, indicating that the oil content of the lower formation is generally better than that of the upper.
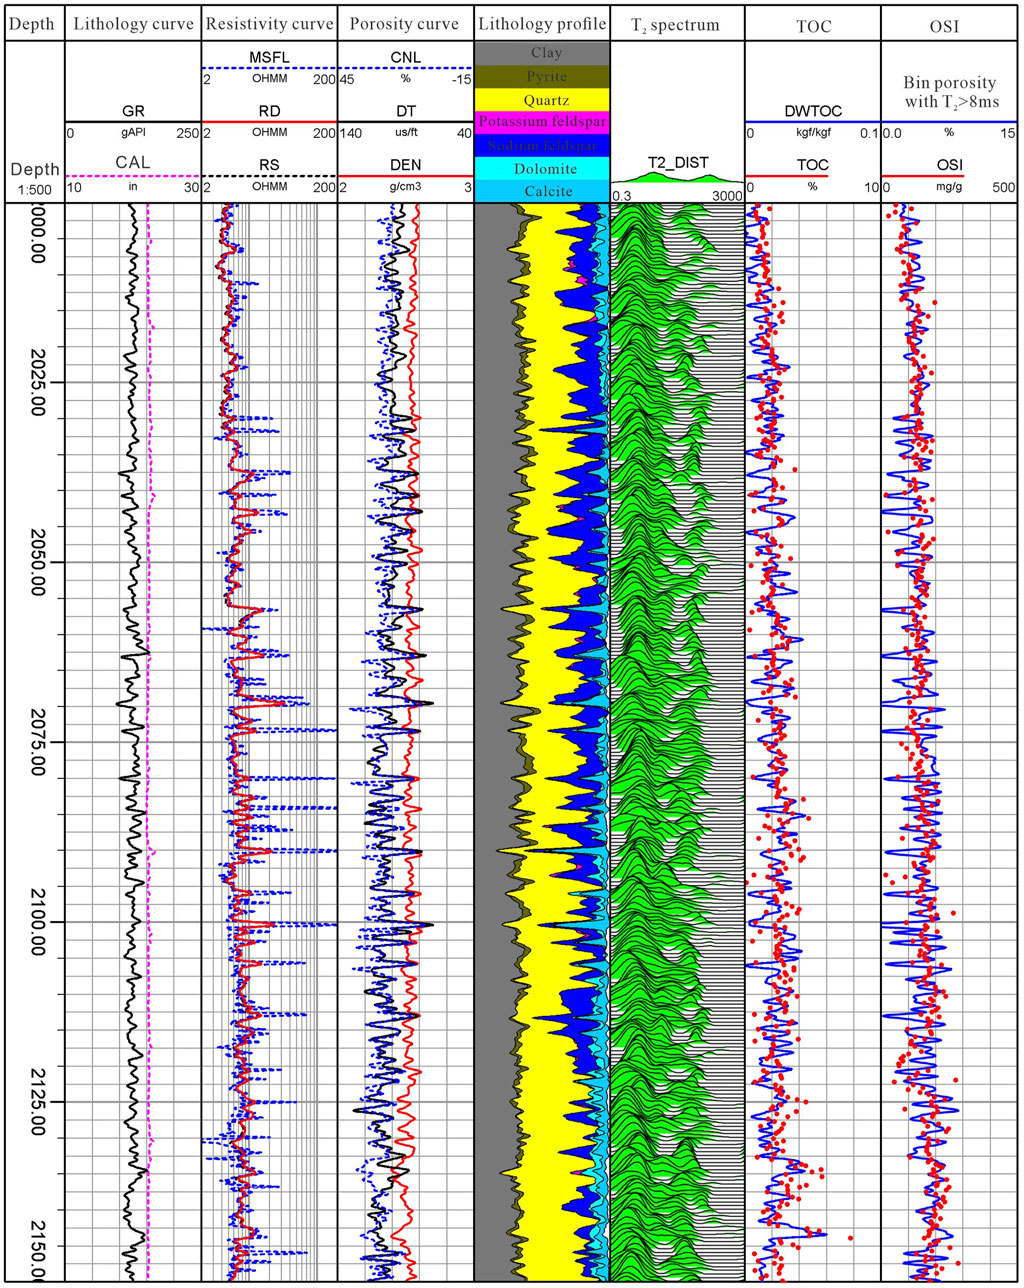
Figure 7. Relationship between the OSI and bin porosity with T2>8 ms of well X1.
4 Discussion
4.1 Challenges of quantitative evaluation
Through the aforementioned comparison of the differences in the 2D NMR experimental T1-T2 spectrum in varied states, it is clear that the OSI value of the Gulong shale is closely related to the size of the pores containing movable fluid (bin porosity with T2>8 ms). The OSI calculated by NMR logging can reflect the change of oil content in wellbore, but there are still differences between the calculated results and the actual core analysis. Below are the two specific reasons.
(1) Because of the light hydrocarbon components and high volatility of Gulong shale, there are differences between the core samples under laboratory conditions and the original state subsurface. Although the original samples were re-saturated with kerosene after drying at 105°C for 24 h, they still could not be fully returned to the real state of the subsurface. And it is still unclear whether the drying and re-saturation of kerosene can damage the original pore structure. From the comparison of the T1-T2 spectrum of the 2D NMR experiments of the two states of drying and saturated kerosene in Figure 2, it is found that the kerosene has not only penetrated the large pore space during the pressurized saturation, but also has partially entered the small pore space of the bound fluid. Comparing the 2D NMR T1-T2 spectrum of sample 2 in saturated kerosene and drying state, the signals in the yellow dashed box and the red dashed box are obviously enhanced. Also, the questions of whether the pore space is completely saturated, the degree of filling of the original bound fluid region by kerosene, and the reasons for the sudden signal enhancement of the capillary bound water part in the saturated kerosene state need to be investigated in depth. Therefore, the porosity of the interval obtained by using the T2 cutoff value from the experimental analysis to classify the NMR T2 distribution spectrum in the saturated kerosene state is still different from the actual situation.
(2) The T2 cutoff values of clay-bound water and movable fluid porosity in Gulong shale can be determined by 2D NMR experiments under different states. Although there are differences between the experimental environment and the downhole conditions, and between the experimental and the downhole NMR logging instrument, the T2 cutoff value of movable fluid porosity is still credible. The measurement frequency used in this NMR experiment is the same as that of CMR, which is 2 MHZ. There is a difference in TE (echo time) between the two, and the TE of the experimental and downhole NMR instrument is 0.1 ms and 0.2 ms, respectively. It is found that TE has a significant effect on the signal of the small pores, especially in the T2<3 ms region. The T2 cutoff value of movable fluid porosity determined under experimental conditions is applicable and has been proved in actual drilling, but the T2 cutoff value of effective porosity still need to consider the effect of TE.
4.2 Reliability of the new method
The good linear relationship between movable fluid porosity and OSI also reflects the oil-bearing characteristics of the large pores of the Gulong shale. Previous studies (Zeng, 2020) concluded that different sizes of pores in the Qingshankou Formation shale have different effects on shale oil enrichment through experimental studies, in which adsorbed oil is mainly in pores less than 10 nm, while free oil is mainly in pores larger than 10 nm. Similar characteristics also exist in shale oil reservoirs of other sedimentary basins in China. For example, in the Qianjiang Formation shale reservoir of Paleogene in Qianjiang Sag, Jianghan Basin, free shale oil mainly occurs in pores with pore size larger than 5 nm (Sun et al., 2020). For shale oil reservoirs, organic-rich shale is regarded as both source rock and a reservoir layer. Shale oil is mainly formed in the liquid hydrocarbon stage of organic matter evolution and generally undergoes a strong hydrocarbon generation process with extremely complex wettability, but it has become a consensus that large pore spaces contain oil (Zou et al., 2013; Kuang et al., 2021). This further indicates that shale oil reservoirs are oil-bearing in large pore spaces and dominated by free oil, which provides a basis for evaluating the OSI in shale using the movable-flow porosity (Figure 8).
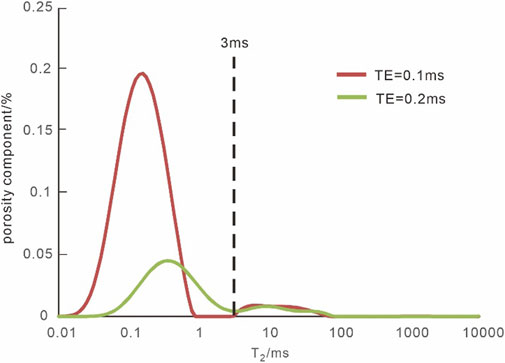
Figure 8. The T2 spectrum characteristics measured at different TE in the drying state.
5 Conclusion
(1) Organic carbon measurement and rock pyrolysis experiments reveal that the source rock of the organic-rich shale in the Qing 1 Member is of good quality, with high TOC and S1 contents. But the correlation between them is poor, and the manifestation of “high TOC and low S1” exists, which cannot be simply assumed that high organic matter is necessarily associated with high movable oil content. Instead, the OSI can truly reflect the movable hydrocarbon content of the shale, in which the OSI value of the Qing 1 Member shale is greater than 100 mg/g, and the oil content of the lower formation is better than that of the upper, showing the potential to produce a large amount of movable hydrocarbon.
(2) The NMR T2 cutoff value of movable fluid porosity in Gulong shale is determined to be 8 ms for the first time through 2D NMR experimental measurements in different states. Combined with experiments such as rock pyrolysis and organic carbon measurements, there is a good linear relationship between porosity and OSI in the NMR bin porosity with T2>8 ms, which makes it possible to evaluate OSI continuously and quantitatively by means of well logging. For the key wells, the geochemical analysis data and NMR logging data can be applied together to establish a suitable OSI calculation model.
(3) The OSI calculation based on logging can effectively compensate for the disadvantage that geochemical experiments cannot cover the whole well section or the whole study area. The calculation method based on the calibrated core analysis data can be extended and applied to other wells without geochemical data, thus achieving the possibility of avoiding missing the movable hydrocarbon layers in shale.
Data availability statement
The original contributions presented in the study are included in the article/Supplementary material, further inquiries can be directed to the corresponding author.
Author contributions
HT: Conceptualization, Investigation, Methodology, Writing–original draft, Writing–review and editing. HW: Methodology, Supervision, Writing–review and editing. WY: Methodology, Writing–review and editing. ZF: Methodology, Writing–review and editing. CL: Methodology, Writing–review and editing. LR: Methodology, Writing–review and editing. HX: Methodology, Writing–review and editing.
Funding
The author(s) declare that financial support was received for the research, authorship, and/or publication of this article. The study is funded by Petrochina major science and technology project “Large-scale Reserves Increasing and Exploration and Development Techniques for Continental Shale Oil” (2023ZZ15) and National Key Laboratory for Multi-resources Collaborative Green Production of Continental Shale Oil.
Conflict of interest
Author WY was employed by the Daqing Oilfield Company Limited. Author LR was employed by the PetroChina Well Logging Company Limited.
The remaining authors declare that the research was conducted in the absence of any commercial or financial relationships that could be construed as a potential conflict of interest.
Publisher’s note
All claims expressed in this article are solely those of the authors and do not necessarily represent those of their affiliated organizations, or those of the publisher, the editors and the reviewers. Any product that may be evaluated in this article, or claim that may be made by its manufacturer, is not guaranteed or endorsed by the publisher.
References
Bai, L. H., Liu, B., Chi, Y. A., Li, S. C., and Wen, X. (2021). 2D NMR studies of fluids in organic-rich shale from the Qingshankou Formation, Songliao Basin. Oil Gas Geol. 42 (6), 1389–1400.
Chen, Z. H., Li, M. W., Jiang, C. Q., and Qian, M. H. (2019). Shale oil resource potential and its mobility assessment: a case study of Upper Devonian Duvernay shale in Western Canada Sedimentary Basin. Oil Gas Geol. 40 (3), 459–468.
Cui, B. W., Chen, C. R., Lin, X. D., Zhao, Y., Cheng, X. Y., Zhang, Y. P., et al. (2020). Characteristics and distribution of sweet spots in Gulong shale oil reservoirs of Songliao Basin. Petroleum Geol. Oilfield Dev. Daqing 39 (3), 45–55. doi:10.19597/J.ISSN.1000-3754.202005025
Ding, Y. J., Li, J. G., Zhu, W. F., Liu, A. P., Lv, F. F., and Zhong, W. (2020). T1-T2 two-dimensional NMR method for detecting oil-bearing property in shale oil reservoirs. Mud Logging Eng. 31 (S1), 48–53. doi:10.3969/j.issn.1672-9803.2020.S1.009
Dong, X. (2017). Experimental study of porosity and electrical properties of gas shale. East China: China University of Petroleum.
Du, J. H., Hu, S. Y., Pang, Z. L., Lin, S. H., Hou, L. H., and Zhu, R. K. (2019). The types, potentials and prospects of continental shale oil in China. China Pet. Explor. 24 (5), 560–568. doi:10.3969/j.issn.1672-7703.2019.05.003
Gao, B., He, W. Y., Feng, Z. H., Shao, H. M., Zhang, A. D., Pan, H. F., et al. (2022). Lithology, physical property, oil-bearing property and their controlling factors of Gulong shale in Songliao Basin. Petroleum Geol. Oilfield Dev. Daqing 41 (3), 68–79. doi:10.19597/j.issn.1000-3754.202111075
Jiang, Z. X., Zhang, W. Z., Liang, C., Wang, Y. S., Liu, H. M., and Chen, X. (2014). Characteristics and evaluation elements of shale oil reservoir. Acta Pet. Sin. 35 (1), 184–196. doi:10.7623/syxb20141024
Kausik, R., Fellah, K., Rylander, E., Singer, P. M., Lewis, R. E., and Sinclair, S. M. (2016). NMR relaxometry in shale and implications for logging. Petrophysics 57 (4), 339–350.
Kuang, L. C., Hou, L. H., Yang, Z., and Wu, S. T. (2021). Key parameters and methods of lacustrine shale oil reservoir characterization. Acta Pet. Sin. 42 (1), 1–14. doi:10.7623/syxb202101001
Li, G. X., and Zhu, R. K. (2020). Progress, challenges and key issues of unconventional oil and gas development of CNPC. China Pet. Explor. 25 (2), 1–13. doi:10.3969/j.issn.1672-7703.2020.02.001
Li, J. B., Jiang, C. Q., Wang, M., Lu, S. F., Chen, Z. H., Chen, G. H., et al. (2020b). Adsorbed and free hydrocarbons in unconventional shale reservoir: a new insight from NMR T1-T2 maps. Mar. Petroleum Geol. 116, 104311. doi:10.1016/j.marpetgeo.2020.104311
Li, N., Yan, W. L., Wu, H. L., Zheng, J. D., Feng, Z., Zhang, Z. Q., et al. (2020a). Hydrophobic interactions of relaxin family peptide receptor 3 with ligands identified using a NanoBiT-based binding assay. Petroleum Geol. Oilfield Dev. Daqing 39 (3), 117–126. doi:10.1016/j.biochi.2020.08.008
Liu, Z. S., Liu, D., Karacan, M., Cai, Y. D., Yao, Y. B., Pan, Z. J., et al. (2019). Application of nuclear magnetic resonance (NMR) in coalbed methane and shale reservoirs: a review. Int. J. Coal Geol. 218, 103261. doi:10.1016/j.coal.2019.103261
Piedrahita, J., and Aguilera, R. (2017). “Estimating oil saturation index OSI from NMR logging and comparison with rock-eval pyrolysis measurements in a shale oil reservoir,” in SPE Unconventional Resources Conference, Alberta, Canada, February 15–16, 2017 (SPE).
Shi, Q. M., Mi, Y. C., Wang, S. M., Sun, Q., Wang, S. Q., and Kou, B. Y. (2021). Trap characteristic and mechanism of volatiles during pyrolysis of tar-rich coal [J/OL]. J. China Coal Soc. doi:10.13225/j.cnki.jccs.XR21.1734
Sun, H. Q., Cai, X. Y., Zhou, D. H., Gao, B., and Zhao, P. R. (2019). Practice and prospect of Sinopec shale oil exploration. China Pet. Explor. 24 (5), 569–575. doi:10.3969/j.issn.1672-7703.2019.05.004
Sun, Z. L., Wang, F. R., Han, Y. J., Hou, Y. G., He, S., Luo, J., et al. (2020). Multi-scale characterization of the spatial distribution of movable hydrocarbon in intersalt shale of Qianjiang Formation, Qianjiang Sag, Jianghan Basin. Petroleum Geol. Exp. 42 (4), 586–595. doi:10.11781/sysydz202004586
Tian, H., Wang, G. W., Wang, K. W., Feng, Q. F., Wu, H. L., and Feng, Z. (2020). Study on the effect of pore resistivity of carbonate reservoirs. Chin. J. Geophys. 63 (11), 4232–4243. doi:10.6038/cjg2020O0110
Wang, G. Y., Wang, F. L., Meng, Q. A., and Gu, S. F. (2020). Strategic significance and research direction for Gulong shale oil. Petroleum Geol. Oilfield Dev. Daqing 39 (3). doi:10.19597/j.issn.1000-3754.202005036
Yan, W. L., Zhang, Z. Q., Chen, L. C., Zhao, Z. W., and Wang, W. J. (2021). New evaluating method of oil saturation in Gulong shale based on NMR technique. Petroleum Geol. Oilfield Dev. Daqing 40 (5), 78–86. doi:10.19597/j.issn.1000-3754.202107007
Yao, D. H., Zhou, L. H., Wang, W. G., Pu, X. G., Song, Y. J., and Xu, C. W. (2022). Logging evaluation of composite sweet spots for shale oil: a case study of Member 2 of Kongdian Formation in Cangdong sag. Acta Pet. Sin. 43 (7), 912–924. doi:10.7623/syxb202207003
Yu, T., Lu, S. F., Li, J. Q., and Zhang, P. F. (2018). Prediction for favorable area of shale oil free resources in Dongying Sag. Fault-block Oil Gas Field 25 (1), 16–21. doi:10.6056/dkyqt201801004
Zeng, W. Z. (2020). Pore structure and shale oil potential of Qingshankou Formation shale in Songliao Basin. ACS Omega 40, 35755–35773.
Zeng, W. Z., Zhou, G. Y., and Song, Z. G. (2019). Influence of pore structure on the shale oil accumulation of the Qingshankou Formation in the Songliao Basin. Geochimica 48 (6), 632–643. doi:10.19700/j.0379-1726.2019.06.011
Zhang, P. F. (2019). Research on shale oil reservoir, occurrence and movability using nuclear magnetic resonance (NMR). Qingdao: China University of Petroleum.
Keywords: Gulong shale, rock pyrolysis analysis, oil saturation index, 2D NMR experiment, T2 cutoff value
Citation: Tian H, Wu H, Yan W, Feng Z, Li C, Ren L and Xu H (2024) Evaluation method of oil saturation index OSI for shale oil reservoir based on well logging data. Front. Earth Sci. 12:1358268. doi: 10.3389/feart.2024.1358268
Received: 19 December 2023; Accepted: 18 March 2024;
Published: 28 March 2024.
Edited by:
Qiaomu Qi, Chengdu University of Technology, ChinaReviewed by:
Ruiqi Fan, China University of Petroleum, ChinaLiang Wang, Chengdu University of Technology, China
Copyright © 2024 Tian, Wu, Yan, Feng, Li, Ren and Xu. This is an open-access article distributed under the terms of the Creative Commons Attribution License (CC BY). The use, distribution or reproduction in other forums is permitted, provided the original author(s) and the copyright owner(s) are credited and that the original publication in this journal is cited, in accordance with accepted academic practice. No use, distribution or reproduction is permitted which does not comply with these terms.
*Correspondence: Hongliang Wu, wuhongliang@petrochina.com.cn