Determining complex petroleum migration pathways along faults and sandbodies: a new method and application
 Shi Jijian
 Fu Guang1,2
 - 1School of Earth Sciences, Northeast Petroleum University, Daqing, Heilongjiang, China
- 2Key Laboratory of Natural Gas Sealing Mechanism, CNPC Key Laboratory of Gas Reservoir Formation and Development, Daqing, Heilongjiang, China
- 3Exploration and Development Institute of Daqing Oilfield, China National Petroleum Corporation, Daqing, China
Introduction: The reservoir-forming rule in the paleo-slope zone outside petroliferous basins’ source kitchens of the eastern basin in China is unclear, manifested in the distribution of oil and gas in complex multi-layers. This study focuses on petroleum migration along faults and sandbodies to clarify this question and improve the exploration efficiency of petroleum in areas with similar geological conditions.
Method: We summarized two models of petroleum migration based on two factors: the connected sandbodies and the vertical unsealing faults. Model I is conducive to the migration of hydrocarbons within a single layer, while Model II is conducive to the vertical migration of hydrocarbons across layers. Combining the means for evaluating fault sealing and sandbody connectivity, integrating these models could form a set of characterization methods for the distribution of the complex fluid migration pathways.
Results: This method is applied to characterize the complex multilayer migration pathways distribution in the first and second members of the Shahejie Formation in the central-southern area of the Wen’an Slope in the Baxian Sag, Jizhong Depression, Bohai Bay Basin, China. The results show that, in the first and second members of the Shahejie Formation in the central-southern area of the Wen’an Slope, the area for Model II is mainly distributed in the central-eastern regions. The second member has a Model I area distributed in its western region, and the first member has a Model I area distributed in its centraleastern parts. The latter distribution area is larger than the former. According to hydrocarbon migration analysis, the first member is more conducive to large regional migration and accumulation of hydrocarbons than the second member.
Discussion: The predicted result of petroleum migration is consistent with the hydrocarbon distribution found in the central-southern areas of the Wen’an Slope, which is that oil and gas distribution in the first member is significantly greater than that in the second member. Thus, our method is feasible for characterizing the regional distribution of complex multi-layer migration pathways in simple tectonic setting and oil source conditions. However, further research is still needed to increase the effectiveness of present petroleum migration analysis.
1 Introduction
The slope zone is one of the structural units of a basin. It is a gentle monocline formed during the development of the basin and is usually distributed at the edges, outside of the deep source rock kitchens of the basin. According to the theory of oil and gas accumulation, the geological structure background during the large-scale generation and migration of oil and gas has a controlling effect on the migration characteristics and accumulation locations of oil and gas. In the paleo-slope zone, the accumulated oil and gas all come from the kitchens in the center of the basin, and the oil and gas have undergone remarkable lateral and vertical migration. The relationship among sandbodies, faults, and the caprock can provide conduits for the migration of oil and gas within a single layer and between layers, resulting in a significantly more complex oil and gas accumulation distribution (Wang, 2007; Berndt et al., 2012; Foschi et al., 2014; Liu et al., 2017; Bertoni et al., 2018; Sun et al., 2021; Zhu et al., 2021; Wan et al., 2022).
Complex multi-layer migration pathways mean a three-dimensional oil and gas migration network composed of sandbodies, faults, and other factors (Wang, 2007; Berndt et al., 2012). It is important to evaluate these factors when studying the characteristics of oil and gas migration within the paleo-slope zone outside of source rock kitchens: whether the faults that break through the caprock are vertically sealed, whether the faults are laterally sealed, and whether the formation sandbodies are connected (Allen, 1978; Aydin, 2000; Ligtenberg, 2005; Fu and Zhan, 2017; Zhu et al., 2021).
Previous scholars have conducted in-depth research evaluating fault vertical and lateral sealing capacity (Allan, 1989; Knipe, 1992; Lindsay et al., 1993; Yielding et al., 2010; Fu and Zhan, 2017; Nicol and Childs, 2018). Four types of fault sealing in siliciclastic sequences have already been recognized. These are juxtaposition sealing, shale-smear sealing, fault-rock sealing, and diagenetic sealing (Yielding et al., 2010).
Juxtaposition seals can be produced by a permeability gradient between the different rocks juxtaposed across the fault plane when the hanging wall of a normal fault moves downward. Allan (1989), Knipe (1992), and Lindsay et al. (1993) identified reservoir juxtaposition areas across a fault surface to qualitatively evaluate the sealing ability of a fault by stratigraphic juxtaposition diagrams called an Allan Map (Allan, 1989) and a Knipe Diagram (Knipe, 1992; Knipe, 1997).
Clay smear (i.e., entrainment of clay or shale) into the fault zone gives the fault itself a high entry pressure to form an extremely effective fluid flow barrier. Several algorithms have been developed to predict fault seal capacity using these geological properties, including the shale-smearing factor (SSF) (Lindsay et al., 1993), the clay-smear potential (CSP) (Bouvier et al., 1989; Fulljames et al., 1997; Nicol and Childs, 2018), and caprock juxtaposition thickness (CJT) (Fu and Zhan, 2017).
Fault-rock sealing is a type of fault sealing that relies on fault rock having a lower permeability than the reservoir rock. Fault rocks are composed of different types of host rocks entrained into the fault zone (Schultz and Fossen, 2008). The shale-gouge ratio (SGR) (Yielding et al., 1997; Yielding, 2002; Yielding, 2009; Choi et al., 2015; Bretan, 2017) is a useful algorithm to evaluate fault-sealing ability by predicting the average proportion of fine-grained material entrained into the fault gouge from the host rocks. Another algorithm has been developed by evaluating the fault-rock-reservoir displacement pressure difference (DPD) (Bretan, 2017; Shi, 2019).
When the porosity of fault rocks was partially or completely removed by preferential cementation along a permeable fault plane, a diagenesis seal was ultimately created. Cemented faults or fractures are a common result of deformation (Fisher and Knipe, 1998; Fisher and Knipe, 2001; Fisher et al., 2009). However, due to the complex source timing and mechanisms of cementation, there is no effective algorithm for evaluating the effectiveness of the cementation process on fault sealing.
The above algorithms have successfully evaluated the vertical and lateral sealing of faults from different perspectives. Geologists can apply suitable methods based on their own work conditions.
Success has also been achieved via research into sandbody connectivity. The overlapping and connecting of sheet-like, wedge-shaped (fan-shaped), banded, and complex branching sandbodies are the basis for the long-distance migration of oil and gas along a single formation. Allen (1978) put forward a quantitative model to determine the connectivity of sandbodies in the 1970s. Additional methods to determine the connectivity of sandbodies include seismic, dynamic, and statistical analysis and reservoir geochemical methods (Kaufman et al., 1987; King, 1990; Johnson et al., 1996; Jackson et al., 2005). Determining the connectivity of sandbodies according to their density threshold is a simple and widely used method. The density threshold is usually represented by the sandstone-formation ratio. The sandstone-formation ratio is a ratio of the sum thickness of sandstone to the total thickness of a stratum, which is a parameter that characterizes the relative quantity of sandbodies within a set of strata and can indirectly reflect the connectivity conditions of individual sandbodies deposited in river and lake sedimentary environments (Jackson et al., 2005).
The above-discussed research methods have played a vital role in correctly understanding oil and gas migration and accumulation behavior in sandbodies and faults. According to the combined characteristics of the fault’s vertical and lateral seals and sandbody connectivity, oil and gas migration can be divided into two types: single-layer and cross-layer migration. However, relatively few studies have accurately characterized the distribution of oil and gas cross-layer migration pathways. The main research focus has been on the required conditions for oil and gas cross-layer migration. Thus, there is a gap in the literature regarding the prediction of multi-layer oil and gas migration pathways. Predicting these pathways would be conducive to accurately reflecting the oil and gas distribution pattern in the slope area outside the deep source rock kitchen and guiding oil and natural gas exploration. Therefore, it is of great significance to investigate the characterization of multi-layer complex migration pathways through faults and sandbodies to correctly understand the oil and gas accumulation distribution patterns in the paleo-slope zone of a petroliferous basin to guide oil and gas exploration.
This paper takes the first and second members of the Shahejie Formation in the central-southern area of the Wen’an Slope in the Baxian Sag as an example. The geological situation of the study area is introduced in Section 2. The migration models and integrated method for the distribution of the complex fluid migration pathways on the basin paleo-slope zone outside petroliferous basins’ source kitchens are presented in Section 3. In Section 4, the distribution area of the connected sandbodies located above and below the regional caprock and the vertical unsealed area of the conducting faults that break through the regional caprock linking the sandbodies for the first and second members of the Shahejie Formation in the central-southern area of the Wen’an Slope were evaluated. The distribution of the complex fluid migration pathways was characterized. The relationship with the oil and gas distribution in the first and second members of the Shahejie Formation is discussed. The results illustrate the rationality and applicability of the proposed method.
2 Geological setting
The central-southern area of the Wen’an Slope in the Baxian Sag, Jizhong Depression, Bohai Bay Basin, China, was selected as a case study example. The central-southern area of the Wen’an Slope is located east of the Baxian Sag, adjoins the Dacheng Uplift in the east, the Baxian Depression in the west, the Wuqing Depression in the north, and the Raoyang Depression in the south. It is an inherited monoclinic structure trending NE-SW. The Wen’an Slope is filled with Eocene and Oligocene strata, containing the Kongdian, Shahejie and Dongying formations from bottom to top (Figure 1). The Kongdian Formation (abbreviated for Ek) developed river and delta facies composed of dark mudstone with a small amount of sandstone interbedded. The Shahejie Formation also developed river and delta facies, and it is mainly composed of dark mudstone and oil shale. It is usually divided into four submembers, numbered from fourth to first from bottom to top (abbreviated for Es4, Es3, Es2, and Es1). The sandstones are well-developed in Es3 and Es2; meanwhile, a large amount of dark mudstone and oil shale is developed in Es4, Es3, and the lower part of Es1. Dongying Formation (abbreviated as Ed) river facies are characterized by a sandstone-mudstone interbed.

Figure 1. Simplified geologic background of the Wen’an Slope location map of the Bohai Basin in east China and the tectonic location of the study area (A). (B) Stratigraphic sequences and lithology of the interval of interest and a map showing petroleum geological element details of the study area.
The Wen’an Slope has undergone three distinct stages of tectonic evolution: early Paleogene, late Paleogene, and late Neogene (Wang, 2017). Multiple periods of tectonic evolution have led to well-developed faults. The fault strike is mainly north-east and north-northeast (Wang, 2017).
The oil and gas accumulations discovered in this area are mainly distributed in Es1 and Es2. A small number of accumulations is distributed in the Dongying Formation. The oil and gas mainly originate from the Es1 source rock on the west side of the Baxian Depression (Liu et al., 2017). The oil and gas were generated by the Es3 source rock kitchen located in the Baxian Depression and migrated to the sandbodies of Es2 through a consequent fault and the sandbodies to the central-southern area of Wen’an Slope under the effect of buoyancy (Wang, 2017). In this area, it is recognized that the migration pathways changed between the sandbodies and faults. However, how to determine the conditions and combination models for the complex migration pathways in sandbodies and faults is still unclear. Therefore, characterizing the Es1 and Es2 fault and sandbody migration pathways in the central-southern area of the Wen’an Slope is crucial for correctly understanding the oil and gas distribution pattern and guiding the exploration for oil and gas.
3 Methods
3.1 Model of complex multi-layer migration pathways
Under the influence of buoyancy and due to the limitation of the regional continuous caprock at the top, hydrocarbons will be limited to continuous lateral migration within a single layer within the sandbodies of a monoclinic formation unless there are lateral closed faults and pinch-out sandstone in the upward dip direction of the strata (Fu and Zhan, 2017). If the fault breaks the integrity of the caprock of the layer, the hydrocarbons are more prone to vertical migration through the fault than lateral migration. Thus, the hydrocarbons enter the sandbodies in the upper strata of the cap rock and multi-layer migration pathways are formed.
Of course, there is an extreme situation. Hydrocarbon leakage occurs when a fault that destroys the integrity of the only caprock extends to the surface or the integrity of all the caprocks above is destroyed.
Based on the composition and conditions of the complex multi-layer migration pathways, we summarize two models (Figure 2). Three parameters must be evaluated to clarify which model the migration of hydrocarbons in the paleo-slope belongs to. The first parameter is the connectivity of the sandbodies located above and below the regional caprock. The second parameter is related to the lateral sealing capacity of the faults that cut the sandbodies. The third is the vertical sealing capacity of the faults that cut through the caprock.
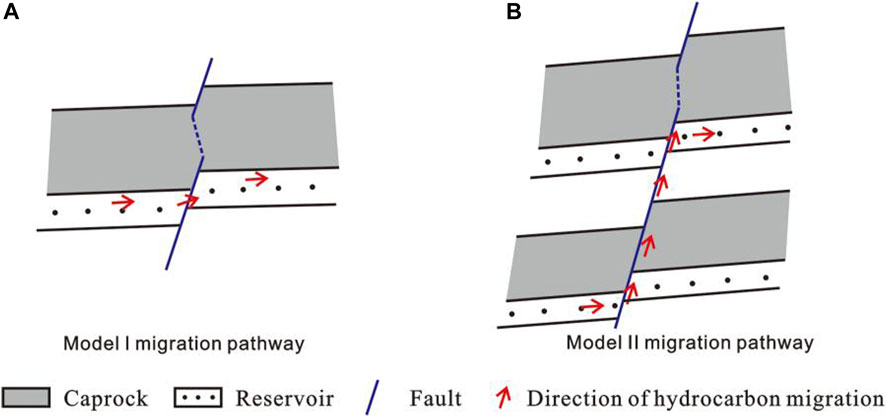
Figure 2. Model of the complex multi-layer migration pathway. (A) Model I is conducive to the migration of hydrocarbons within a single layer. The hydrocarbons can migrate laterally across the fault but not vertically. (B) Model II is conducive to the vertical migration of hydrocarbons across layers.
3.2 Connected sandbodies
Due to limited exploration data and research methods, studying the subsurface sandbody connectivity is challenging. Therefore, only drilling data can provide the sandstone-formation ratio distribution of strata above and below the caprock. As shown in Figure 3A, the sandstone-formation ratio and hydrocarbon indication characteristics of the sandbody at known well points in the study area are gathered and analyzed. In view of the theory that oil and gas can only be transported in connected sandbodies and thus can be found by drilling in the paleo-slope zone outside source rock kitchens (Wang, 2007), we take the minimum sandstone-formation ratio of sandbodies bearing oil and gas as the minimum sandstone-formation ratio required for sandbody connectivity (Figure 3B). Thus, the area where the sandstone-formation ratios of the layers above and below the caprock are greater than the minimum sandstone-formation ratio required for Model I is delineated and combined with the evaluation results of the fault lateral sealing in the region.
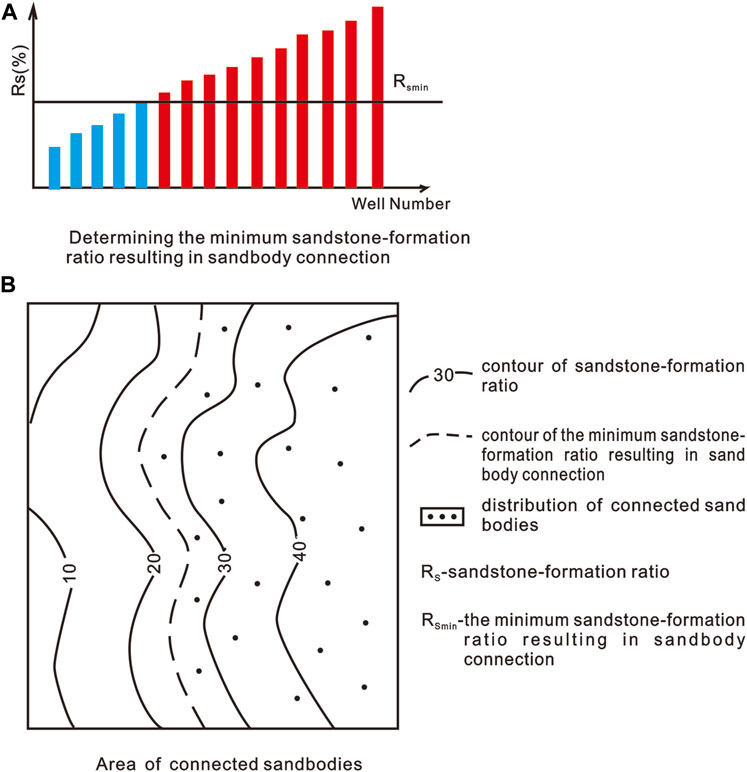
Figure 3. Schematic diagram of the prediction of connected sandbody distribution area in the slope area outside the source area. (A) By collecting the sandstone-formation ratios and containing fluids of drilling wells within the same reservoir in the study area, we can determine the minimum sandstone-formation ratio using the short plate theory. (B) According to the minimum sandstone-formation ratio, we can define the range of connected sandbodies on the distribution map of the sandstone-formation ratio of the reservoir.
3.3 Lateral sealing ability of the fault cutting the sandbodies
A lateral sealed fault in the upward dip direction of a monoclinic formation can stop the lateral migration of oil and gas within a single layer. Thus, determining the fault’s lateral sealing and laying a foundation for characterizing the single-layer migration pathway boundaries in the regional sandbodies is critical.
Based on the difference between the regional fault throw and the thickness of the caprocks and a single sandbody, the fault sealing principle can be inferred (Choi et al., 2015). We can select the Knipe graphical method or the shale-gouge ratio (SGR) standard method to evaluate the lateral sealing ability of the fault cutting the sandbody. In this study, we determined the limits of the SGR (Eq. 1) values that can form a petroleum fault trap through the corresponding relationship among the trap oil and gas-bearing property, trap depth, and SGRs using statistical methods. Based on the above data, a fault lateral sealing ability discrimination chart for the study area was drawn, and the fault lateral sealing was judged according to the attribute value of the target fault depth, the SGR of the fault rock, and the properties of the fluids in the target layer (Figure 4).
where SGR is the shale-gouge ratio, Vcl× ∆z is the volume fraction of clay in an interval of thickness ∆z, and T is the throw across the fault.
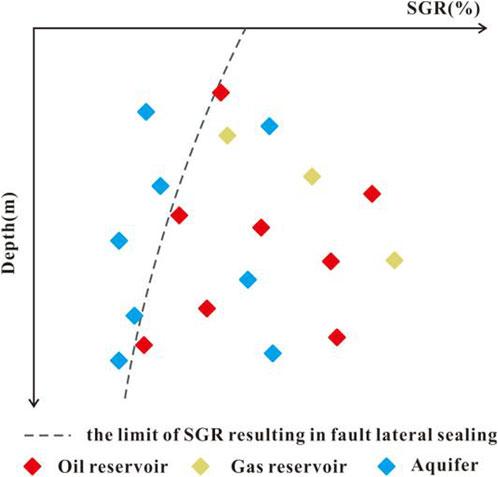
Figure 4. Fault lateral sealing discrimination chart. The burial depths and calculated SGRs of fault rocks and containing fluid in the juxtaposition reservoirs were organized. The chart uses different symbols located within the two-dimension coordinates of SGR and depth. The vectorized envelope curve was determined based on the minimum SGR data on fault rocks placed against oil and gas layers at different depths. It can be used to predict the minimum SGR value of fault rock at different depths to seal hydrocarbons laterally.
3.4 Vertical sealing ability of the fault cutting the caprock
The mudstone forming the caprock undergoes plastic deformation in the faulting process in this study area. Thus, we used the CJT to evaluate the vertical sealing ability of the fault across the caprock. The CJT can be calculated as the difference between the thickness of the cap rock and the vertical displacement of the fault across the cap rock.
The paleo-CJT is more significant than the present-CJT for hydrocarbon migration. The process of obtaining the various parameters to calculate the paleo-CJT is as follows. Present fault vertical displacement and caprock thickness data were collected from drilling and seismic testing. On this basis, the paleo-fault throw in the oil and gas accumulation period was determined using the maximum fault displacement subtraction method (Dutton and Trudgill, 2009), and the paleo-caprock thickness was obtained using the paleo-formation-thickness recovery method (Tan et al., 2005).
The paleo-CJTs and hydrocarbon distributions above and below the caprock at the known well points in the study area were collected. The minimum CJT of oil and gas distributed only under the caprock was considered after statistical analysis, as shown in Figure 5A. When the minimum CJT is reached, the segmented growth of the fault in the caprock begins to connect, and the oil and gas can migrate upward through the caprock at the fault, accumulating and distributing above and below the caprock. The minimum caprock juxtaposition thicknesses of different caprocks are different because of the different geological conditions, which means Hfmin1 is not necessarily the same as Hfmin2.
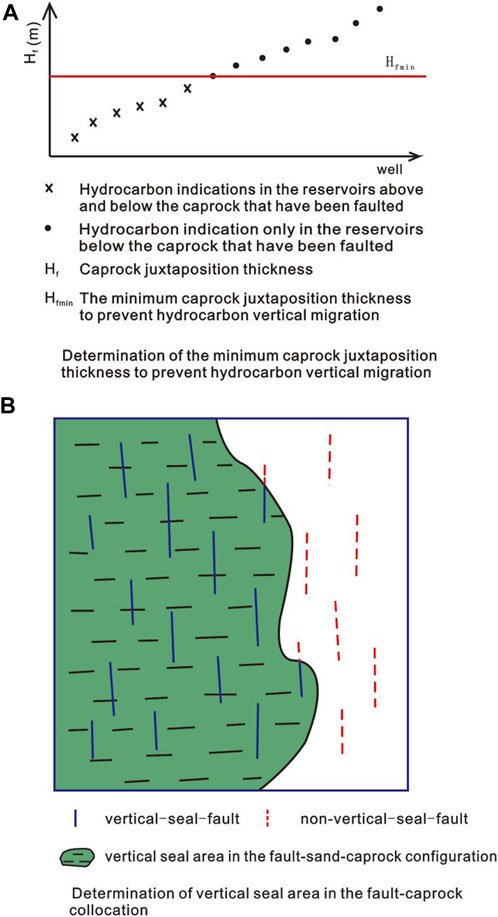
Figure 5. Schematic diagram of the prediction of the vertically sealed area. (A) CJTs with different hydrocarbon distributions above and below the caprock were arranged in numerical order within the coordinate axis at the known well points in the study area. (B) The vertical sealing ability of faults within the caprock can be evaluated using the minimum caprock juxtaposition thicknesses of the caprock. Then, the range of the vertically sealed area in the fault-caprock collocation can be defined.
Finally, the Model II hydrocarbon migration area is shown in Figure 5B.
3.5 Characterization of complex multi-layer migration pathways
The complex multi-layer migration contains elements of both Model I and Model II. The process of formation can be described as shown in Figure 6. First, the connected sandbody distribution area in a single layer above and below the caprock should be determined. Sandstone-formation ratio threshold calibration presented earlier can determine the connected sandbodies in reservoirs without fault for the study area. If there was any fault in the reservoir, the lateral sealing ability of the fault should be evaluated. The fault lateral unseal means the sandbodies on both sides of the fault could be connected. Otherwise, local unconnected sandbody areas surround the fault. Second, the activities of faults linking different layers of reservoirs should be carefully analyzed. Active faults are more favorable to migration pathways during the period of large-scale oil and gas production in source rocks. The vertical sealing ability of these faults in caprocks should be determined. The vertical unsealed faults are the main vertical migration pathways for oil and gas to cross layers, and a Model II area on the plane can be defined around the distribution of vertical unsealed faults. Third, the area distribution characteristics of the complex multi-layer migration pathways can be obtained by overlaying the distribution ranges of Models I and II above and below the caprock (Figure 7).
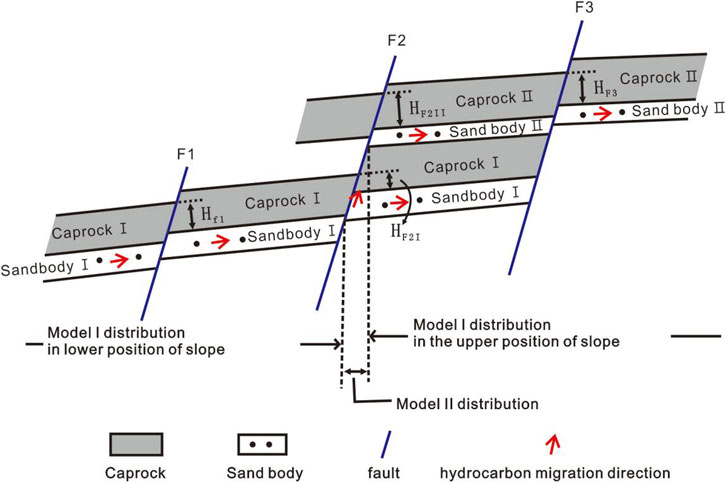
Figure 6. Schematic diagram of multi-layer migration pathways in the paleo-slope zone. There are four strata and three faults. Caprock I and Caprock II are two regional caprocks that are mainly composed of thick mudstone. Sandbody I and Sandbody II are connected, and oil and gas could migrate in them laterally from the lower to the upper position of the slope. Three faults (abbreviated as F1, F2, and F3) cut different strata. F1 cuts Caprock 1 and Sandbody I, while F2 and F3 cut four strata simultaneously. The CJTs for three faults in two caprocks were calculated as HF1, HF2I, HF2II, and HF3. HF2I is smaller than the minimum CJT of Caprock I, and HF1 is larger than the minimum CJT of Caprock I. Therefore, a vertical unsealed section exists in the lower caprock. Hydrocarbons from outside the deep source rock kitchens in the basin could only migrate within Sandbody I in the downward direction of the slope on the left side of F2. Then, they migrated upward into Sandbody II above Caprock I through F2. HF2II and HF3 are larger than the minimum CJTs of Caprock II. Hydrocarbon migration shifted toward the upward slope direction in Sandbody II on the right side of F2.
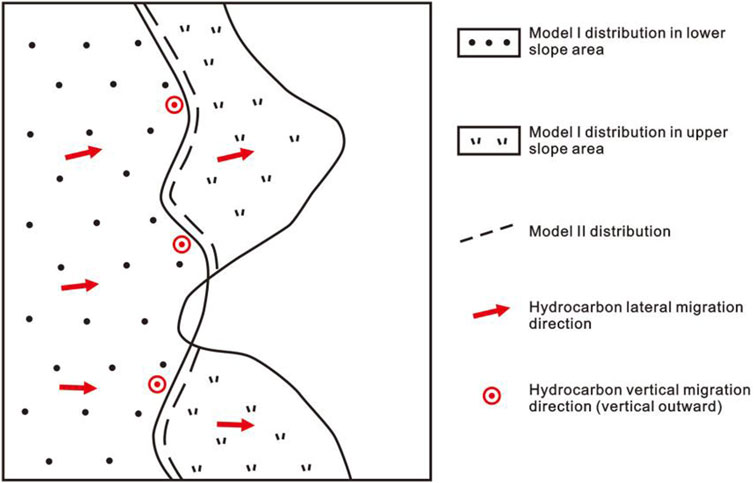
Figure 7. Schematic diagram of the prediction of the distribution area of the complex multi-layer migration pathways in the slope area outside the source. Model I areas of different reservoirs above and below the caprock and a Model II area were overlaid in the paleo-slope. Then, we can establish the complex multi-layer migration pathways by combining the Model 1 and Model 2 areas chosen by oil and gas under migration regularity, which are the areas marked with red arrows and bullseye symbols.
4 Results and discussion
The methods described above were used to characterize the distribution of the complex multi-layer migration pathways in the first and second members of the Shahejie Formation (Es1 and Es2) in the central-southern area of the Wen’an Slope in the Baxian Sag, Jizhong Depression, Bohai Bay Basin, China.
4.1 Determination of Model I distribution
First, we selected the test wells in the study area and screened the minimum SGR value of the fault rock related to the traps in the Es1 and Es2 members. According to the correlation between the SGR in the fault rock and the depth of the faulted strata, the lower limit value of the SGR for the lateral fault sealing was determined using the statistical method. The fault lateral sealing discrimination chart of target layers in the study area was drawn based on this limit value. Statistically, the lower limit value of the SGR in the Wen’an Slope is about 20%–25% between the depths of 1,000 m and 3,500 m (Figure 8). The fault traps that exceed the lower limit are laterally sealed and can simultaneously form fault lateral sealing and oil and gas accumulation.
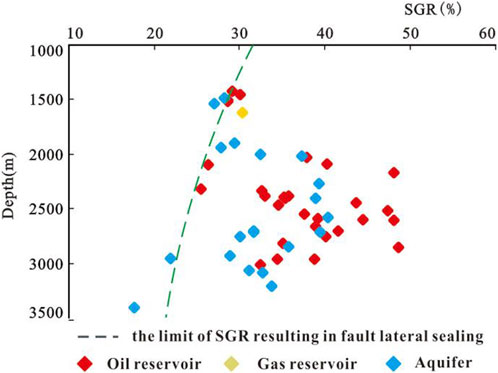
Figure 8. Determination of the lateral sealing threshold of the late active faults in Es1 and Es2 in the Wen’an Slope. Drilling data obtained from the Wen’an Slope are displayed in a two-dimensional coordinate system using depth as the Y-axis and SGR as the X-axis. According to the method shown in Figure 4, the vectorized envelope curve was used to predict the minimum SGR value of fault rock at different depths to seal hydrocarbons laterally in the Wen’an Slope.
Then, we determined the distribution range of connected sandbodies in the formations above and below the caprock based on fault lateral sealing evaluation. The Es1 and Es2 sandstone-formation ratios in the central-southern area of the Wen’an Slope were calculated using drilling data. The planar distribution map was drawn, as shown in Figure 9. As the figure illustrates, the Es2 sandbodies in the central-southern area of the Wen’an Slope are more developed than the Es1. The area with a high sandstone-formation ratio in Es2 is widely distributed in the central part, while the area with a high sandstone-formation ratio in Es1 is only distributed in the eastern part. The Es2 sandstone-formation ratios reach a minimum at the southwestern and eastern boundaries, while Es1 sandstone-formation ratios reach a minimum at the southwest. According to the relationship between the Es1 and Es2 sandstone-formation ratios and the oil and gas distribution in the sandbodies (Figure 10), the minimum sandstone-formation ratio of the formation required for sandbody connectivity was determined to be about 20%. Based on this, the Es1 and Es2 distribution area of connected sandbodies in the central-southern area of the Wen’an Slope can be obtained. Figure 9 shows that the Es2 connected sandbodies in the central-southern area of the Wen’an Slope are mainly distributed in the central area. In contrast, the connected sandbodies of Es1 are mainly distributed in the eastern part, and the distribution area of the former is larger than the latter.
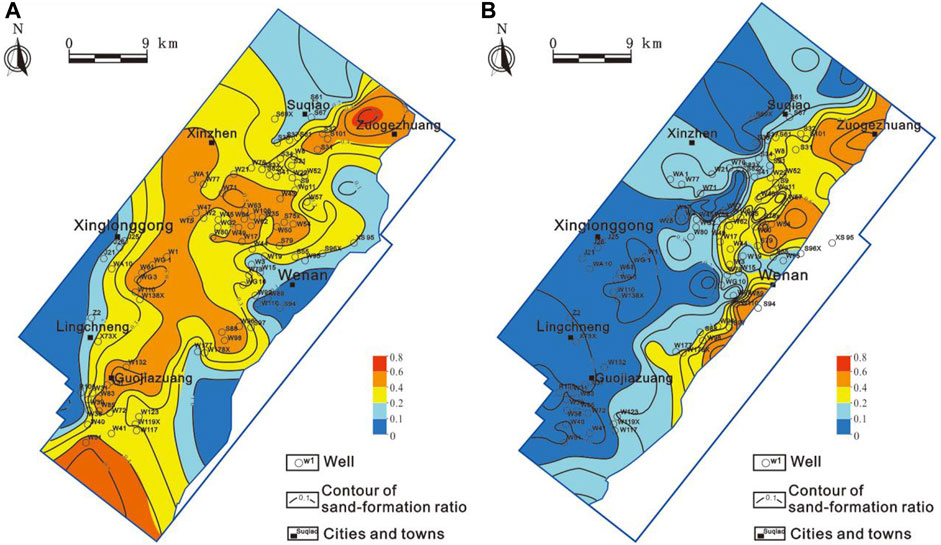
Figure 9. Distribution map of the sand-formation ratios of the Es2 (A) and the Es1 (B) in the central-southern part of the Wen’an Slope. These maps were drawn mainly by seismic attributes and corrected using the actual sand-formation ratio data from wells. The development of the sandbodies in Es2 and Es1 is shown clearly through the two maps. It is possible to determine the planar area of the connected sandbody by the sandstone-formation ratio thresholds within Es2 and Es1.
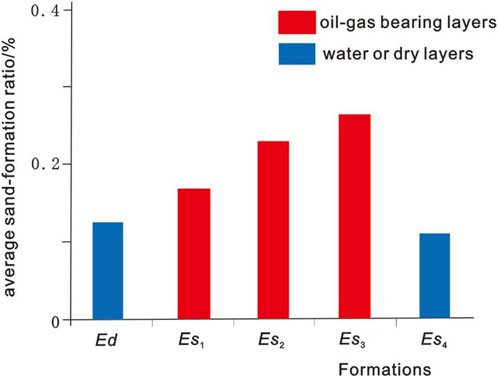
Figure 10. Determination diagram of the minimum sand-formation ratio required for the sandbody connectivity of Es2 in the Wen’an Slope area. The Y-axis of this graph represents the average sand-formation ratio, and the X-axis represents the formations developed in the Wen’an Slope. We analyzed the sand-formation ratios and bearing hydrocarbons of formations from all exploration wells in the Wen’an Slope. The average sand-formation ratios are drawn in the form of bar charts with different colors in two-dimensional coordinates. Finally, the threshold for sandbody connectivity was determined based on the minimum sand-formation ratio.
4.2 Determination of Model II distribution
According to core logging, the oil and gas caprock of Es2 in the Wen’an Slope area is mudstone in the lower part of Es1. The caprock of oil and gas in Es1 is mudstone in the upper part of Es1. In addition, the distribution of mudstone caprocks in the lower and upper parts of Es1 in the central-southern area of the Wen’an Slope was evaluated based on drilling and seismic data. The research results indicate that the mudstone caprocks in the lower and upper parts of Es1 in the Wen’an Slope area are thick in the west and thin in the east. However, the mudstone cap in the upper part of Es1 is thicker than that in the lower part. The mudstone caprock thickness in the lower and upper parts of Es1 decreases gradually from the west to the east. It decreases to 100 m and 0 m in the eastern boundary of the central-southern area of the Wen’an Slope. Based on seismic data interpretation, faults have developed in the mudstone caprock of the lower and upper parts of Es1 in the Wen’an Slope area. Only the faults active during the oil and gas accumulation phases could accommodate the migration of hydrocarbons. According to the tectonic evolution, the main active period of the faults developed within the mudstone caprocks was the deposition period of the middle and upper Minghuazhen Formation (Wang, 2017). The distribution of the hydrocarbon transporting faults in Es1 and Es2 was identified (Figure 11).
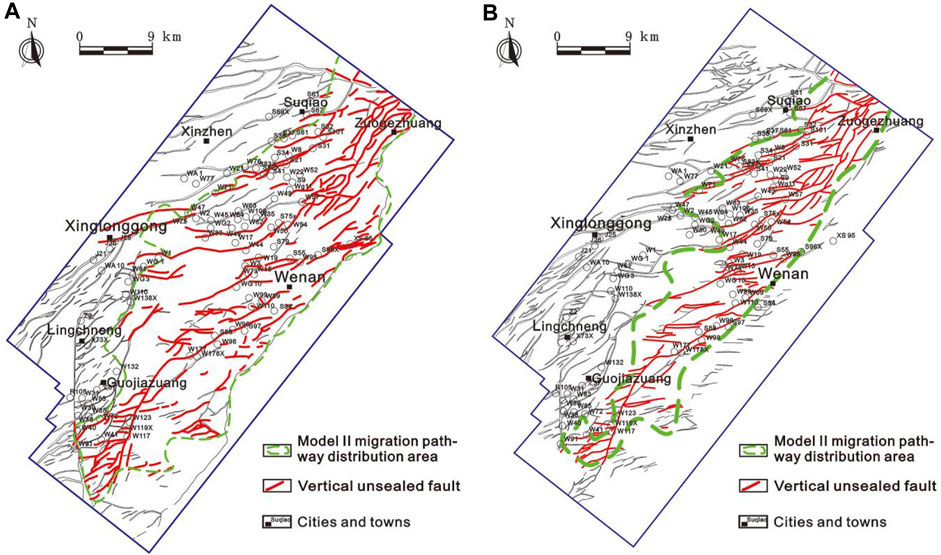
Figure 11. Plane distribution map of the vertical migrating faults in Es2 (A) and Es1 (B) in the middle-south area of the Wen’an Slope. We drew all the fault-cutting Es2 and Es1 in the plane map. The vertical unsealed fault is shown in red. The distribution area of Model II for vertical migrating pathways is delineated by the dashed red line.
Figure 11 shows that the hydrocarbon migration faults that developed in the mudstone caprock in the lower and upper parts of Es1 are in the central-southern area of the Wen’an Slope. They are mainly distributed in the central part, followed by the south, and few are distributed in the northern part of the slope zone. These faults are mainly N-NE striking, followed by NE-E striking, and some are S-N striking. The throw of the fault and the thickness of the cut mudstone caprock in the lower and upper parts of Es1 in the Wen’an Slope area were used to determine the paleo-fault-throw and paleo-thickness of the caprock in the oil and gas accumulation period using the maximum fault displacement subtraction method (Dutton and Trudgill, 2009) and the paleo-thickness recovery method (Xu et al., 2018). These two methods allow the calculation of the migration fault and paleo-CJTs of the mudstone caprock in the lower and upper parts of Es1. Based on the statistics of the relationship between the fault-contact thickness of the upper and lower parts of Es1 at the known wells in the Wen’an Slope and the distribution of the oil and gas above and below the caprocks, the minimum paleo-CJTs were determined through the oil and gas distributed only under the caprocks at approximately 133 m and 137 m (Figure 12). Based on the paleo-CJT threshold, the hydrocarbon migration faults that are vertically sealed are mainly distributed in the western part of the Wen’an Slope (Figure 11).
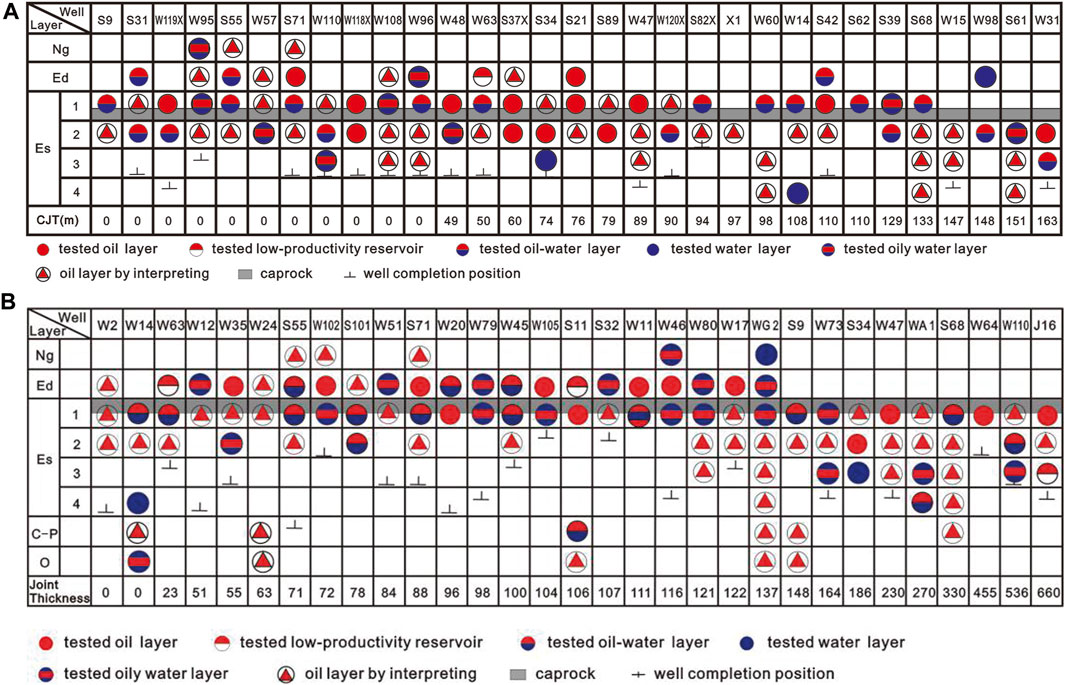
Figure 12. We determined the minimum CJTs in the lower (A) and upper (B) parts of Es1 in the central-south part of the Wen’an Slope in tabular form. In these tables, the Y-axis represents the layers developed in the Wen’an Slope, and the X-axis represents the wells whose CJTs were calculated. The wells are arranged from left to right in the order of CJTs from small to large. In the table, we marked the hydrocarbons shown in different layers of each well with different symbols and also marked the target caprock with a gray stripe. Two types of oil and gas distribution are shown in the table. One is that there are both oil and gas shows above and below the caprock, and the other is that there are oil and gas shows only below the caprock. Observing the table from left to right, when Type one oil and gas shows become Type two, the CJT of the corresponding well undergoing type change is the minimum CJT.
4.3 Distribution of complex multi-layer migration pathways
The Model I and Model II migration pathways in Es2 and Es1 were determined by superimposing the above-determined distribution area of the connected sandbodies and the fault’s vertical sealing area in the lower and upper parts of the Es1 caprocks in the central-southern area of the Wen’an Slope (Figure 13).
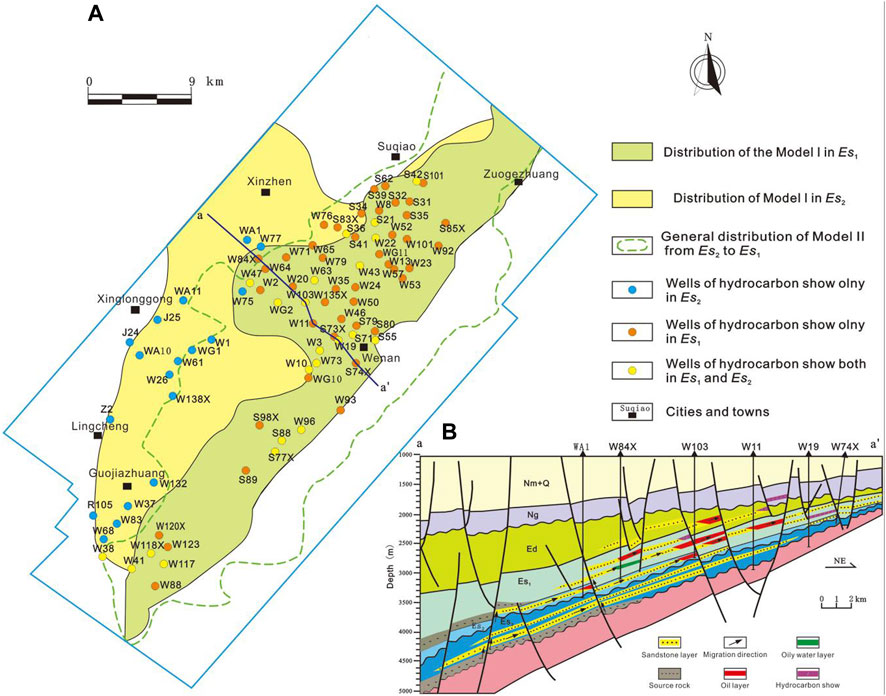
Figure 13. We overlaid the Model 1 area in Figure 9 on the Model 2 area in Figure 11 using the method of determining complex oil and gas migration pathways. (A) shows the complex multi-layer pathway distribution in the central-southern part of the Wen’an Slope. The oil and gas shows of drilling wells in Es1 and Es2 in the study area are marked with different symbols on the graph. In order to more clearly depict the complex migration pathways for oil and gas, we have drawn a profile diagram of (B). The position of (B) is marked with black lines on (A).
It can be concluded that the Model I and Model II areas in Es2 are mainly distributed in the western and central parts, respectively. In contrast, the migration pathways in Es1 are more complex. The hydrocarbons migrated through the Model II pathways in the central part of the study area from Es2 to Es1. Considering that the connected sandbodies and vertical unsealed faults coexist in the central part, the Model I migration pathways in Es1 and Model II migration pathways in Es1 to Ed are complicated and combined.
The discovered hydrocarbon accumulations in Es1 and Es2 in the central-western part of the Wen’an Slope are closely related to the distribution of the complex multi-layer migration pathways (Figure 13). The hydrocarbon accumulations in Es2 are mainly distributed in the area of the Model I migration pathways in Es2.
Similarly, the hydrocarbons in Es1 are mainly distributed in the combined Model I and Model II pathways in Es1. The west boundary of the Model II migration pathways in Es2 divides the hydrocarbon distribution range into two layers. This is because oil and gas can only laterally transport and accumulate along Es1 or Es2 in the distribution area of the Model I migration pathways, and oil and gas drilling could be successful. Due to the smaller distribution area of the Model I migration pathways in Es2 than in Es1, oil and gas migration and accumulation in Es1 is more favorable.
The feasibility of using this integrated approach to characterize the distribution of multi-layer migration pathways for hydrocarbons can be verified by calibrating the prediction results with the current distribution of the hydrocarbon accumulations found in Es1 and Es2 in the central area of the Wen’an Slope.
The results from applying our method to the Wen’an Slope highlight the possibility of successfully predicting the complex multi-layer migration pathways for hydrocarbon. Faults and sandbodies are the main conduits in the study area. However, two issues require further discussion.
One issue is the parameters we used to evaluate the sealing ability of the fault. SGR is a parameter that characterizes the shale content of fault rocks at specific locations under ideal conditions. It only characterizes the quantity of the clay-size -debris particles from host rocks and cannot quantitatively reflect various diagenetic processes that occurred during the formation of fault rocks, such as cataclasis, cementation, and dissolution (Pei et al., 2015). Thus, predicting the fault-sealing ability should be done with care in the basins characterized by strong tectonic movement and hydrothermal activity. In addition, CJT is a statistical parameter reflecting the vertical sealing ability of faults within the regional cap rock and is influenced by factors such as the lithology, thickness of the regional cap rock, and fault activity and scale (Fu and Zhan, 2017). It is only effective for faults within a specific caprock in a period. The minimum CJT for faults in one caprock cannot be used to evaluate faults in another caprock.
The other one is the parameter of sandbody connectivity. Due to the complexity of the sandbody development and distribution of river facies, geologists have creatively proposed a sandstone-formation ratio parameter (Kaufman et al., 1987). It has universal applicability in describing reservoir development, identifying sedimentary environments, and predicting sandbody connectivity. However, we should recognize that the algorithm of a sandstone-formation ratio is an indirect way to determine the connectivity of sandbodies from a probabilistic perspective. The minimum sandstone-formation ratio representing the connectivity of sandbodies has certain limitations and can only be used for a certain basin. Some geologists believe that there are still effective migration pathways for oil and gas in the areas of connected sandbodies, for instance, a sandbody with higher porosity and permeability or structural ridges (Fu and Zhan, 2017; wang, 2017). The mechanism of oil and gas migration is basically clear, but further research is needed to establish more effective methods for evaluating sandbody migration pathways based on the characterization of strata development.
These problems could be solved if we take the effect of fault development mechanism, sedimentation analysis, and diagenesis into account based on the idea and workflow of our methodology. Determining complex petroleum migration pathways could be more practical and accurate in the future.
5 Conclusion
(1) Three factors that affect oil and gas migration within the paleo-slope area outside the source kitchen are the sandbody connectivity, the fault’s lateral sealing ability, and the fault’s vertical sealing ability. By integrating these three factors, the complex migration pathways can be summarized into two models.
(2) Sandbody connectivity can be determined by the minimum sandstone-formation ratio of the reservoirs bearing oil and gas. A fault’s lateral sealing ability can be judged by the limit value of the SGR for the fault rock in the target layer. The caprock juxtaposition thickness (CJT) can be used to evaluate the vertical sealing ability of the fault cutting the caprock. Then, the distribution areas of the Model I and Model II migration pathways are determined. Integrating the definitions of Model I and Model II forms a set of characterization methods for determining the distribution of the complex migration pathways in the slope area outside the source kitchens. The feasibility of using this approach to predict the distribution of complex multi-layer migration pathways is verified using a case study example.
(3) In the area of the Wen’an Slope in the Baxian Sag, Jizhong Depression, Bohai Bay Basin, China, the Model II migration pathways in Es1 and Es2 are mainly distributed in the central-eastern regions. The Model I migration pathways in Es2 are mainly distributed in the western region. In contrast, the Model I migration pathways of Es1 are mainly distributed in the central and eastern regions. The distribution area of the latter is larger than the former. Therefore, Es1 is more favorable for oil and gas migration and accumulation than Es2, which is consistent with the fact that the oil and gas distribution of Es1 is evidently more than that of Es2 in the central-southern area of Wen’an Slope.
Data availability statement
The original contributions presented in the study are included in the article/Supplementary material; further inquiries can be directed to the corresponding author.
Author contributions
SJ: Writing–original draft, Writing–review and editing. FG: Methodology, Writing–review and editing. LL: Software, Writing–review and editing.
Funding
The author(s) declare that financial support was received for the research, authorship, and/or publication of this article. The work was supported by the National Natural Science Foundation of China (No. 41702153), the National Science and Technology Major Project (2016ZX05007-003-003), and the Natural Science Foundation of Heilongjiang Province (QC2017034).
Acknowledgments
The authors thank LetPub (www.letpub.com) for linguistic assistance and pre-submission expert review.
Conflict of interest
Author LL was employed by China National Petroleum Corporation.
The remaining authors declare that the research was conducted in the absence of any commercial or financial relationships that could be construed as a potential conflict of interest.
Publisher’s note
All claims expressed in this article are solely those of the authors and do not necessarily represent those of their affiliated organizations, or those of the publisher, the editors, and the reviewers. Any product that may be evaluated in this article, or claim that may be made by its manufacturer, is not guaranteed or endorsed by the publisher.
References
Allan, U. S. (1989). Model for hydrocarbon migration and entrapment within faulted structures. Am. Assoc. Petroleum Geol. Bull. 73 (7), 803–811. doi:10.1306/44b4a271-170a-11d7-8645000102c1865d
Allen, J. R. (1978). Studies in fluviatile sedimentation: an exploratory quantitative model for the architecture of avulsion-controlled alluvial suites. Sediment. Geol. 21 (2), 129–147. doi:10.1016/0037-0738(78)90002-7
Aydin, A. (2000). Fractures, faults, and hydrocarbon entrapment, migration and flow. Mar. Petroleum Geol. 17, 797–814. doi:10.1016/S0264-8172(00)00020-9
Berndt, C., Costa, S., Canals, M., Camerlenghi, A., de Mol, B., and Saunders, M. (2012). Repeated slope failure linked to fluid migration: the Ana submarine landslide complex, Eivissa Channel, Western Mediterranean Sea. Earth Planet. Sci. Lett. 319–320, 65–74. doi:10.1016/j.epsl.2011.11.045
Bertoni, C., Cartwright, J., Foschi, M., and Martin, J. (2018). Spectrum of gas migration phenomena across multilayered sealing sequences. AAPG Bull. 102, 1011–1034. doi:10.1306/0810171622617210
Bouvier, J. D., Kaarssijpesteijn, C. H., Kluesner, D. F., Onyejekwe, C. C., and Vanderpal, R. C. (1989). Three-dimensional seismic interpretation and fault sealing investigations, Nun River Field, Nigeria. Am. Assoc. Pet. Geol. Bull. 73 (11), 1397–1414. doi:10.1306/44b4aa5a-170a-11d7-8645000102c1865d
Bretan, P. (2017). Trap analysis: an automated approach for deriving column height predictions in fault-bounded traps. Petroleum Geoscience J. 23 (1), 56–69. doi:10.1144/10.44petgeo2016-022
Choi, J. H., Yang, S. J., Han, S. R., and Kim, Y. S. (2015). Fault zone evolution during cenozoic tectonic inversion in SE korea. J. Asian Earth Sci. 98, 167–177. doi:10.1016/j.jseaes.2014.11.009
Dutton, D. M., and Trudgill, B. D. (2009). Four-dimensional analysis of the Sembo-relay system, offshore Angola: implications for fault growth in salt-detached settings. AAPG Bull. 93 (6), 763–794. doi:10.1306/02230908094
Fisher, Q. J., Casey, M., Harris, S. D., and Knipe, R. J. (2003). Fluid-flow properties of faults in sandstone: the importance of temperature history. Geology 31 (11), 965–968. doi:10.1130/g19823.1
Fisher, Q. J., and Knipe, R. J. (1998). Fault sealing processes in siliciclastic sediments. Geol. Soc. Lond., Spec. Publ. 147, 117–134. doi:10.1144/gsl.sp.1998.147.01.08
Fisher, Q. J., and Knipe, R. J. (2001). The permeability of faults within siliciclastic petroleum reservoirs of the north sea and Norwegian continental shelf. Mar. Petroleum Geol. 18 (10), 1063–1081. doi:10.1016/s0264-8172(01)00042-3
Fisher, Q. J., Knipe, R. J., and Worden, R. H. (2009). “Microstructures of deformed and nondeformed sandstones from the North Sea: implications for the origins of quartz cement in sandstones,” in Quartz cementation in sandstones 14. Editors R. H. Worden, and S. Morad (Oxford, UK: Blackwell Publishing Ltd), 129–146.
Foschi, M., Cartwright, J. A., and Peel, F. J. (2014). Vertical anomaly clusters: evidence for vertical gas migration across multilayered sealing sequences. AAPG Bull. 98, 1859–1884. doi:10.1306/04051413121
Fu, G., and Zhan, M. W. (2017). Conversion condition analysis for vertical migration along faults and lateral migration along sandbodies of oil and gas:taking the local structure of Bohai Bay basin as an example. J. China Univ. Min. &Technology 46 (2), 336–344. doi:10.13247/j.cnki.jcumt.000581
Fulljames, J. R., Zijerveld, L. J. J., and Franssen, R. C. M. W. (1997). in Fault seal processes: systematic analysis of fault seals over geological and production time scales. Editors P. Møller-Pedersen, and A. G. Koestler (China: Norwegian Petroleum Society Special Publications), 7, 51–59.
Jackson, M. D., Yoshida, S., Muggeridge, A. H., and Johnson, H. D. (2005). Three-dimensional reservoir characterization and flow simulation of heterolithic tidal sandstones. Bulletin 89 (4), 507–528. doi:10.1306/11230404036
Johnson, C. R., Greenkorn, R. A., and Woods, E. G. (1996). Pulse testing:a new method for describing reservoir flow properties between wells. JPT 18 (12), 1599–1604. doi:10.2118/1517-pa
Kaufman, R. L., Ahmed, A. S., and Hempkins, W. B. (1987). A new technique for the analysis of commingled oils and its application to production allocation calculations. 16th Annu. Indones. Petro.Assoc, 247–268. Paper IPA 87-23/21. doi:10.29118/ipa.13.247.268
King, P. R. (1990). The connectivity and conductivity of overlapping sandbodies A T.North Sea oil and gas reservoirs II. London: Graham & Trotman, 353–358.
Knipe, R. J. (1992). Faulting processes and fault seal. Struct. Tect. Model. Its Appl. Petroleum Geol. 1, 325–342. doi:10.1016/b978-0-444-88607-1.50027-9
Knipe, R. J. (1997). Juxtaposition and seal diagrams to help analyze fault seals in hydrocarbon reservoirs. Am. Assoc. Pet. Geol. Bull. 81 (2), 187–195. doi:10.1306/522b42df-1727-11d7-8645000102c1865d
Ligtenberg, J. H. (2005). Detection of fluid migration pathways in seismic data: implications for fault seal analysis. Basin Res. 17, 141–153. doi:10.1111/j.1365-2117.2005.00258.x
Lindsay, N. G., Murphy, F. C., Walsh, J. J., Watterson, J., Flint, S., et al. (1993). Outcrop studies of shale smears on fault surfaces. Geol. Model. Hydrocarbon Reservoirs Outcrop Analogues 15, 113–123. doi:10.1002/9781444303957.CH6
Liu, N., Qiu, N., Chang, J., Shen, F., Wu, H., Lu, X., et al. (2017). Hydrocarbon migration and accumulation of the suqiao buried-hill zone in wen’an Slope, jizhong subbasin, bohai bay basin, China. Mar. Petrol. Geol. 86, 512–525. doi:10.1016/j.marpetgeo.2017.05.040
Nicol, A., and Childs, C. (2018). Cataclasis and silt smear on normal faults in weakly lithified turbidites. J. Struct. Geol. 117, 44–57. doi:10.1016/j.jsg.2018.06.017
Pei, Y. W., Paton, D. A., Knipe, R. J., and Wu, K. Y. (2015). A review of fault sealing behaviour and its evaluation in siliciclastic rocks. Earth-Science Rev. 150, 121–138. doi:10.1016/j.earscirev.2015.07.011
Schultz, R. A., and Fossen, H. (2008). Terminology for structural discontinuities. AAPG Bull. 92 (7), 853–867. doi:10.1306/02200807065
Shi, J. J. (2019). Quantitative evaluation of the lateral sealing ability of normal faults in siliciclastic sequences: implication for fault trap in well gang 64, in the west qikou sag, China. J. Petroleum Sci. Technol. 9 (3), 27–45. doi:10.1016/S1876-3804(16)30040-4
Shi, J. J., and Guo, F. K. (2020). Analysis of lateral blocking of faults in the saertu reservoir in xiaolinke-halahai fault zone. J. Oil Gas Technol. 42 (4), 34. doi:10.12677/JOGT.2020.424153
Sun, Q., Cartwright, J., Foschi, M., Lu, X., and Xie, X. (2021). The interplay of stratal and vertical migration pathways in shallow hydrocarbon plumbing systems. Basin Res. 33, 2157–2178. doi:10.1111/bre.12552
Tan, K. J., Wei, P. S., Lü, X. M., et al. (2005). Research on quantitative resumption method of stratum paleothickness and its application——taking Ludong area in Zhunge’er Basin as an example. Nat. Gas. Ind. 25 (10), 24–26.
Wan, J. L., Gong, Y. J., Huang, W. H., Zhuo, Q., and Lu, X. (2022). Characteristics of hydrocarbon migration and accumulation in the lower jurassic reservoirs in the tugerming area of the eastern kuqa depression, tarim basin. J. Petroleum Sci. Eng. 208, 109748–109815. doi:10.1016/j.petrol.2021.109748
Wang, B. (2007). Hydrocarbon migration pathway system of panyu low Uplift in the pearl river mouth basin (Wuhan: China University of Geosciences), 1–70. Master Thesis.
Wang, W. (2017). Hydrocarbon migration pattern of sandstone conduit layer and its control on accumulation in Wen’an slope area of Ba sag. Northeast Pet. Univ.
Xu, S., Hao, F., Xu, C., Zou, H., Zhang, X., Zong, Y., et al. (2018). Hydrocarbon migration and accumulation in the northwestern bozhong subbasin, bohai Bay Basin, China. J. Petroleum Sci. Eng. 172, 477–488. doi:10.1016/j.petrol.2018.09.084
Yielding, G. (2002). “Shale gouge ratio – calibration by geohistory,” in Hydrocarbon seal quantification. Editors A. G. Koestler, and R. Hunsdale (Amsterdam: Norwegian Petroleum Society (NPF) Special Publications), 11, 1–15.
Yielding, G. (2009). “Using probabilistic shale smear factor to relate SGR predictions of column height to fault-zone heterogeneity,” in 2nd EAGE International Conference on Fault and Top SealsFrom Pore to Basin Scale, USA, 21 September 2009 (IEEE), 93–95.
Yielding, G., Bretan, P., and Freeman, B. (2010). Fault seal calibration: a brief review. Reserv. Compart. Spec. Publ. 347, 243–255. doi:10.1144/sp347.14
Yielding, G., Freeman, B., and Needhanm, D. T. (1997). Quantitative fault seal prediction. AAPG Bull. 81, 897–917. doi:10.1306/522b498d-1727-11d7-8645000102c1865d
Keywords: sandbody, fault, caprock, migration pathways, hydrocarbon migration, paleo-slope zone
Citation: Jijian S, Guang F and Lili L (2024) Determining complex petroleum migration pathways along faults and sandbodies: a new method and application. Front. Earth Sci. 12:1371864. doi: 10.3389/feart.2024.1371864
Received: 17 January 2024; Accepted: 04 March 2024;
Published: 28 March 2024.
Edited by:
Xixin Wang, Yangtze University, ChinaReviewed by:
Xiaoming Zhao, Southwest Petroleum University, ChinaFangwen Chen, China University of Petroleum (East China), China
Xia Guoqing, Chengdu University of Technology, China
Copyright © 2024 Jijian, Guang and Lili. This is an open-access article distributed under the terms of the Creative Commons Attribution License (CC BY). The use, distribution or reproduction in other forums is permitted, provided the original author(s) and the copyright owner(s) are credited and that the original publication in this journal is cited, in accordance with accepted academic practice. No use, distribution or reproduction is permitted which does not comply with these terms.
*Correspondence: Shi Jijian, shijijian@163.com