Investigation on the behaviors of water infiltration in the unsaturated loess
 Yu Xi1
  Xue-Qing Hua
 Gang Li
- 1Shaanxi Key Laboratory of Safety and Durability of Concrete Structures, Xijing University, Xi’an, Shaanxi, China
- 2China Construction Fourth Engineering Division Corp, Ltd., Guangzhou, Guangdong, China
Introduction: Surface water from precipitation or irrigation is the sole contributor to groundwater replenishment in the Loess Plateau of China. The occurrence of landslides in the Loess Plateau is closely related to the infiltration process of surface water, and the frequent occurrence of landslides in the Loess Plateau in recent years has seriously affected the economic development and security of the Loess Plateau.
Methods: To investigate the loess infiltration in deeper soil, the process of moisture infiltration in unsaturated loess is studied by field observation, theoretical analysis, and numerical simulation.
Results and discussion: The research results indicated that the interstitial flow in loess could be divided into three different zones: the active zone, the stable zone (2–94 m), and the saturated zone (below 97 m); based on the matric suction and water content calculations, the L1 soil stable water content is 24.4%, which corresponds to the moisture sensor measurement of L1 loess 4 m and 7 m of stable zone data; the numerical simulation results show that whether the infiltration is continuous or intermittent, the infiltration law is the same. After 20 years, there will be a stable water content zone in the 1–8 m soil layer with a water content of 31%. The numerical results well confirm the theoretical calculation results. The research results explain the process of surface water infiltration into groundwater through thick loess and can provide an important reference for the prevention and control of geological disasters caused by water infiltration in loess areas.
1 Introduction
In the urbanisation process of Northwest China, metallurgical industrial effluents contain heavy metals that can migrate to the surrounding environment if not properly treated, causing pollution and threatening the fragile loess environment (Hu et al., 2023a; Hu et al., 2023b; Hu et al., 2023c). Natural loess, also known as “macroporous soil,” has wet subsidence (Xie, 2001; Liu et al., 2016), structural (Jang et al., 2019), and water-sensitive (Li et al., 2007a; Leng et al., 2021) characteristics due to the presence of under-compaction features, making loess landslides one of the most frequent, most damaging, and worst-affected sudden geological disasters in China and safety of humans, and are generally associated with the infiltration process of the surface water (Cui et al., 2018a; Cui et al., 2018b; Meng et al., 2020). It is believed that the increase in moisture content induced by water infiltration leads to a reduction in soil shear strength (Feda, 1988; Li et al., 2007b; Suo et al., 2008; Garakani et al., 2015). The reason for that could be the weakening of the inter-particle cementation bond and an increase in pore-water pressure in humidified conditions. On the other hand, some researchers thought that water infiltration causes groundwater to rise, which leads to geological disasters.
However, many studies concluded that the depth of infiltration was limited, around 2 m for a usual rainfall. Li et al. (2005) observed the variations in soil water content, matric suction and pore-water pressure under natural rainfall conditions in a saprolite slope in Hong Kong. The results showed the maximum influence depth of rainfall during the rainy season is 3 m, while has little effect on the deep underground water level. Tu et al. (2008) conducted artificial rainfall testing in the loess cutting slope and found the infiltration depth was 2 m by rainfall under 40 mm/day. In the loess area of China, Zhang et al. (2014) investigated the supply of surface water to groundwater, and the results indicated that moisture content at shallow depths (within 2 m) was strongly dependent on rainfall and evaporation. Li et al. (2016) conducted a field experiment considering the environmental impacts and determined that the peak wetting front depth of loess is 2 m. In general, although the experiments above have different addresses, soil properties, durations and intensity of rain, all of them illustrate the depth of infiltration is limited. In other words, water infiltration can only increase the soil moisture content within a certain depth, just a few meters. The underground water level in the loess plateau is typically 20–80 m, even up to 120 m. As a result, it's difficult to explain the relationship between the infiltration process of water and the increase in moisture content in deep loess. It is also impossible to explain how surface water recharges groundwater through greater-thickness loess.
The behaviour of water infiltration in loess is still controversial. There are several ideas: Ⅰ. The surface water flows into an underground water aquifer through vertical joints or sinkholes (Zhang and Li, 2011; Qi et al., 2016). Ⅱ. Water infiltration in unsaturated loess forms a transient saturated zone (Li et al., 2011; An et al., 2017). Ⅲ. Although it is generally accepted that the amount of vapour migration is relatively small, it cannot be ignored (Li et al., 2000; Wang and Zhao, 2003; Wang et al., 2014; Liu et al., 2015).
The above studies mainly relate the occurrence of geological disasters such as landslides on the Loess Plateau to the infiltration of surface water, conclude that the depth of water infiltration in loess areas generally does not exceed 2 m, and summarise the way of water infiltration in unsaturated loess. However, scholars mainly focus on the study of precipitation in the shallow layer of unsaturated loess (with a depth of no more than 4 m) and have not yet been able to explore whether there is infiltration of water in the deep loess and how the mode of infiltration is. Based on the long-term monitoring data of the whole deep loess section, the paper makes a theoretical analysis of the water infiltrate mode in deep loess by using the unsaturated infiltrate theory and establishes the infiltrate mode analysis and prediction model of unsaturated loess. The infiltration mechanism of water in unsaturated loess is elucidated by combining theoretical analysis and numerical prediction.
2 Materials and test methods
2.1 Field study site
In this study, a field monitoring site was established to explore the movement of natural rainfall in the loess, the meteorological elements such as rainfall, air temperature, air pressure, etc., Soil moisture and underground water levels were observed and recorded.
The monitoring results were used for the theoretical analysis of water infiltration in unsaturated loess. The monitoring site was located in Longdong Loess plateau, Zhengning City, southeast Gansu province, China, like Figure 1A. According to the local meteorological data downloaded from the National Meteorological Information Center, the mean annual precipitation is about 600 mm, while the mean annual evaporation is more than 1,300 mm. The temperature varies from −20°C–35°C.

Figure 1. Monitoring site Loess profile at the top of the plateau and soil properties. (A) Location of the monitoring site; (B) The loess profile at the top of the plateau; (C) Soil properties with depth; (D) Instruments used in the monitoring system.
The study has 15 monitoring sites in the Loess Plateau. The loess and paleosoil appear alternately, and the strata are continuous and complete. It can be seen clearly at the top of the plateau, in Figure 1B. From top to bottom, the first stratum is called Heilu (S0), but it is generally less than 2 m thick and loses in many areas at the monitoring site, which has no impact on the behaviour of moisture migration and is not considered in stratification. Next, there are L1 and S1. L1 is yellowish-brown, S1 is reddish-brown, and both of them are comparatively loose, macropore, vertical joint and granular calcareous tuberculosis. According to Liu (Liu and Zhang, 1962), L1 and S1 can be classified as late quaternary periods, called Manlan. Lishi represents middle quaternary periods, including L2 ∼ L15. Below L15 and above the red clay of the Tertiary periods, they are named Wucheng. Due to the high calcium content of loess in Wucheng and the loess property being similar, it is unnecessary to further subdivide.
In general, the climate of this place is quite typical. In this area, loess is deposited widely, and successively and forms a complete stratum. Therefore, it is one of the comparative ideal areas for study.
An on-site monitoring station has been established in the study area using an abandoned shaft dug in the 1960 s. The shaft, with a diameter of 0.8 m and a depth of 97 m, reaches the groundwater level. The shaft wall was plastered with mud and cement mortar. A hole was drilled at the bottom to a depth of 100 m to install the water table gauge.
2.2 Sediment and soil properties
In the process of shaft excavation, disturbed soil samples for physical property tests were obtained every 0.5 m following the shaft wall. Those properties included particle size, dry density, moisture content, plastic limit, and liquid limit. All of the tests were based on the “Rules of Geotechnical Testing. China (SL237-1999).” The results of physical property are shown in Figure 1C. The main component of the loess is silt (0.005–0.05 mm), which accounts for 70%, followed by clay (<0.005 mm), which constitutes 20%, and fine sand (>0.05 mm), which accounts for less than 10%. The dry density increases gradually from top to bottom, which can be explained by the densification effect of consolidation pressure.
The dry density of paleosol was significantly higher than that of loess. This reflects not only the structural differences but also the composition. There are few fine grains, more large pores, and loose structure in loess. In warmer and wetter climate conditions, the paleosol grows with strong pedogenesis, and the fine particles form and fill in large pores, making its structure denser. The moisture content increases slightly with depth, like dry density, the value of water is lower in loess and higher in paleosol. The liquid limit increased in the paleosol and decreased in the loess; the plastic limit is the opposite. The plasticity index is the difference between them, and its variation is not obvious.
2.3 Monitoring system
2.3.1 Instrumentation
The precipitation, atmospheric pressure, air temperature and groundwater level were monitored with the corresponding equipment installed on the ground surface and in the groundwater, respectively. Moisture contents and soil temperatures were monitored at the designated depth using probes embedded in the shaft wall. All of the instruments used in the monitoring system are shown in Figure 1D. A HOBO RG3 Rain Gauge (Onset Computer Corporation, United States) was used to measure rainfall every day, the data can be stored automatically; The atmospheric pressure and air temperature were measured by the YT-DY-0200 thermometer and the YT-YL-0400 barometer, respectively, every 2 hours, both of which were produced by YITUO Sensing Technology, China.
The most important part of the monitoring system is the soil moisture content measured by the YT-DY-0100 moisture probe, which is also produced by YITUO Sensing Technology, China. This is mainly to monitor the soil water profile under rainfall. The moisture probe can detect the permittivity of soil to get the percentage of water volume in the soil called bulk moisture. It has four stainless steel needles, thereby protecting the whole probe from corrosion in an outdoor environment. Because of its high measurement accuracy, easy installation and stable working, its design totally meets the monitoring requirements.
The DCX-22 water level indicator (KELLER AG für Druckmesstechnik, Switzerland) was used to measure the changes in underground water level.
2.3.2 Instrument installation
A rain gauge was installed on the open space about 15 m from the monitoring shaft. The thermometer and barometer were placed in a well-ventilated house near the shaft. To begin the moisture probe installation, a horizontal hole of about 0.5 m was drilled on the shaft wall at the self-designed depth. Insert the probes into the hole and backfill those holes with soil, then seal them with cement to prevent water diffusion from the shaft wall.
The specific depth of probes was designed with the principle that every layer had one probe at least. There was a 0.2 m interval between two probes in the top 2 m. Below 2 m, the spacing was 3–5 m, like Figure 1D.
A vertical hole with 13.0 cm diameter and 2.5 m depth was drilled at the bottom centre of the shaft. The water level indicator was put into the plastic tube, which was placed in the hole.
2.4 Methods for determining permeability parameters
Based on the ASTM-D5298-10 code of practice, the filter paper method of testing the SWCC test has been improved in five ways: a) Changing the sealing condition from hermetically sealed cans to wax seals, which more effectively prevents the exchange of water vapour between the soil sample and the external environment; b) Changing the weighing method from weighing in aluminium boxes or plastic bags to weighing directly, which avoids interferences, shortens the weighing time, and makes the weighing results more accurate; c) Weighing speed has been verified by tests that the ASTM standard is reasonable within 5 s, and this standard continues to be used; d)The equilibration time is divided into three intervals according to the moisture content of the soil sample, which is less than 10%, 10%–20% and more than 20%, and the recommended equilibration time is 15, 10, and 5 days respectively; e) The rate equation is chosen from the rate equation of F&C-G (1967), which is the nearest to the results of the test by the pressure plate apparatus, and is therefore recommended to be used for the calculation of matric suction in loess. Therefore, it is recommended to use this rate equation for the calculation of matric suction in loess. Based on the filter paper method, a small, self-designed soil column test rig is used to test the unsaturated permeability function. Since the test uses cutting ring samples, it can be used for undisturbed specimens as well as disturbed samples. By placing filter paper between the ring knives, the soil-water characteristic curve can be obtained directly, and then the hydraulic conductivity function can be calculated using the transient profile method (Li et al., 2020).
3 Results and discussion
3.1 The results of monitoring
3.1.1 Monitoring of meteorological conditions
The monitoring started on 1 June 2015 and is still going on. Monitoring data has been obtained in 1 year (From 1 June 2015 to 31 May 2016). The data of rainfall, air pressure and temperature are shown in Figure 2. The total annual rainfall in the year is approximately 577.2 mm, it close to the annual average rainfall; The data shows that rainfall is concentrated mostly in summer (July to September) and is negligible to non-existent in winter (Dec to Feb). Among them, there are 10 times more than 25 mm, 14 times between 10 and 24.9 mm, and the others are less than 9.9 mm. The highest temperature was 30.6°C on 1st 8, 2015, the lowest was −8.0°C on 24th 1, 2016, and in the Jan and Feb. Of the year, the temperature may drop to below zero. The air pressure increases as well as the temperature decreases. In summer, the values of air pressure are most distributed ranging from 85 to 86 kPa, while 86–87 kPa in winter.
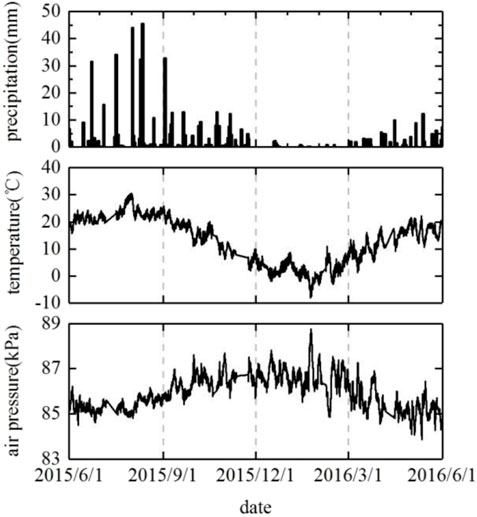
Figure 2. Monitoring results on the ground surface.
3.1.2 Monitoring of shaft wall
As a whole, rainfall can cause soil moisture to rise beyond a certain depth. Below this depth, the increase in soil moisture is nearly negligible. Like rainfall, the influence of evaporation can only be observed at a certain depth. To compare, the data of rainfall are listed with the data of moisture content from 0 to 2 m, like Figures 3A, B. In the y-axis, the major unit (10%) of all graphs had the same distance. Due to soil properties and instrument errors, the natural moisture content at different depths is not completely consistent.
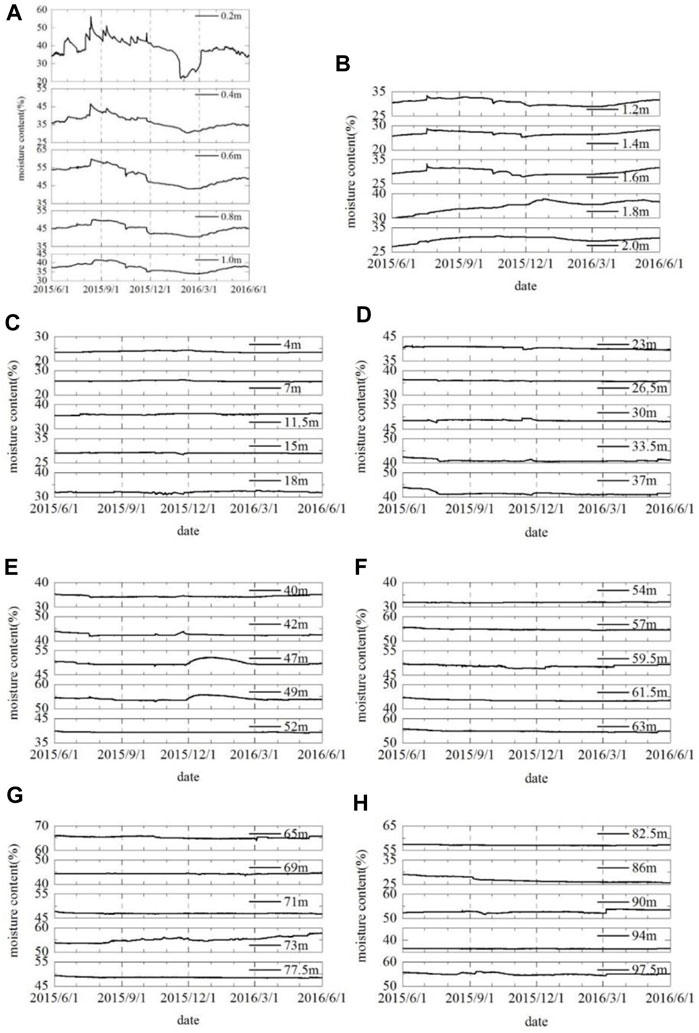
Figure 3. The changes of moisture below 0 m. (A) Moisture content of 0-1 m (unit: %); (B) Moisture content of 1-2 m (unit: %); (C) Moisture content of 2–21 m (unit: %); (D) Moisture content of 21–39 m (unit: %); (E) Moisture content of 39–53 m (unit: %); (F) Moisture content of 53–64 m (unit: %); (G) Moisture content of at 64–79.5 m (unit: %); (H) Moisture content of at 79.5–100 m (unit: %).
Figures 3A, B, obviously show that rainfall and evaporation are the main reasons for the change of soil moisture within the scope of 1 m. The moisture contents increase induced by rainfall and then decrease after the rain stops. With increasing depth, the moisture content curves from 1 to 2 m have the same trend but are smoother.
Below 2 m, as shown in Figures 3C–H, the curves are almost flat throughout the whole year. The soil depth affected by evaporation can only reach 0.8 m. Because the curve of 0.8 m has no significant cut-down after it increases. There are two reasons why the moisture contents at different depths are not exactly the same from the beginning of monitoring: A. depositional history of loess. B. the soil properties are different. C. the instrument error. However, the rule of water change over time in each depth is not affected. The entire Zhengning loess profile is divided into 15 layers, the loess layer is more porous and looser, while the palaeosol layer is less porous and denser, which causes fluctuating changes in water content from top to bottom. Differences in the physical properties of the soil result in differences in its water-holding capacity, and the closeness of the instrument to the soil during installation can affect the results to some extent.
3.1.3 Groundwater level
The change in the groundwater table is shown in Figure 4A. At the beginning of the monitoring, the depth of the water level was 96.95 m. The water level rose to 96.93 m on 26 June 2015, it peaked at 96.93 m in that year, before gradually receding. The lowest level was 97.10 m on 15 May 2016. Overall, the water level showed a downward trend, with a decrease of 10 cm a year. The change in groundwater level was not directly related to rainfall in that year.
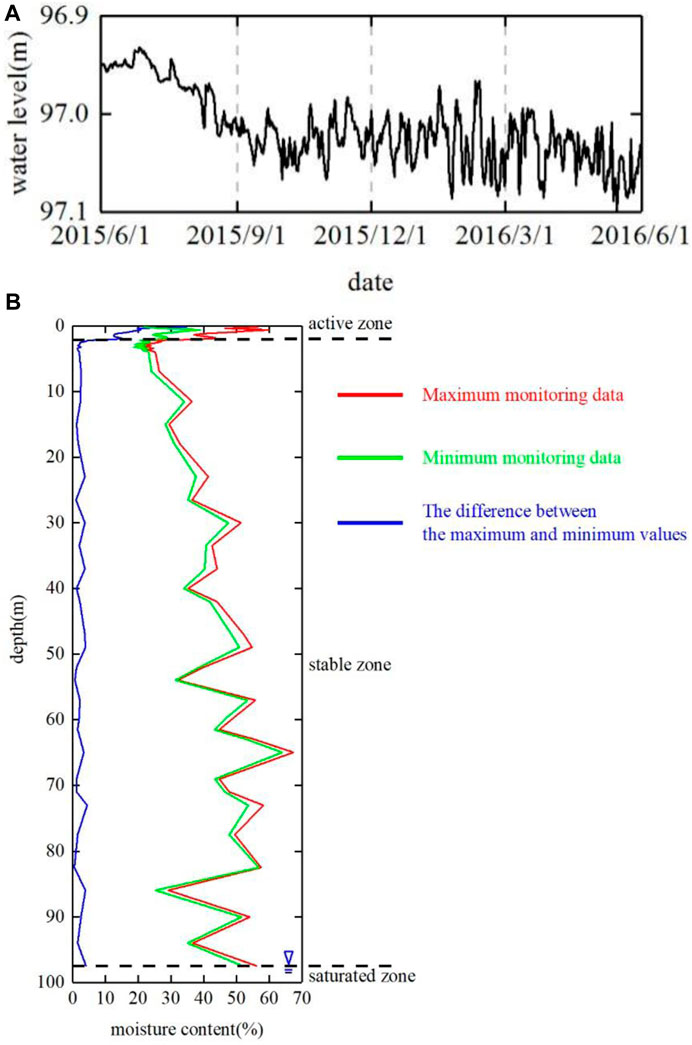
Figure 4. The change of groundwater level and moisture. (A) The change of groundwater level; (B) The variation of moisture with depth.
Combined with air pressure data, it is found that the water table is high when the atmospheric pressure is low in summer. On the contrary, when the pressure rises, the water table decreases in winter. The fluctuations of groundwater level and air pressure are synchronous in a short time. This can be explained by the barometric effect of the well water level (Che et al., 1990). Small fluctuations in barometric pressure in the monitoring area and the periodicity and lag in the response of the well water level to barometric pressure, so that the two fluctuations can be seen as synchronised for short periods. When the air pressure fluctuates greatly, the water level fluctuates greatly. In a short period, the groundwater level with a daily fluctuation was up to 5 cm.
The groundwater level is little changed throughout the year from the data. Groundwater in the area is excreted into rivers by springs, thus, the groundwater level is in a dynamic equilibrium state of supply and discharge for a long time. However, due to the thick loess, the groundwater level supplied by the surface water has a long lag.
3.1.4 Identifying zones of differential infiltration
The above observations confirm that the change of water content in loess under rainfall is only reflected in the shallow layer, less than 2 m. Below this layer, there is a quite thick zone of stable water content at the groundwater level. In order to show this feature more clearly, the maximum and minimum water content of annual monitoring data and the difference between them are plotted on a graph, Figure 4B.
The effective influence of the depth of rainfall on moisture content is determined as 2 m. Thus, based on this analysis, water percolation in loess can be classified into three distinct zones: the active zone, the stable zone, and the saturated zone.
The active zone is linked to the environment, the moisture content varies with rainfall, evaporation and temperature, and its depth is about 2 m. The moisture content of the stable zone is nearly unchanged from the bottom to the top of the saturated zone. The saturated zone is below the underground water level.
The observations are somewhat similar to previous studies (Toll, 2001; Zhuang et al., 2017). That is the change of moisture content in loess under the action of rainfall is only reflected in the shallow layer, and there is a very thick stable moisture content zone between its lower part and the groundwater level. Is the surface water passing through the stable zone and recharging the groundwater? This can be illustrated by unsaturated seepage analysis.
3.2 Theories and simulation
3.2.1 Theoretical calculations
From the monitoring, the moisture content in the stable zone and the underground water level are not responding to current rainfall events. Thus, the rainfall event in a short period can only trigger shallow landslides (above the stable zone) (Hou et al., 2018). It is generally believed that there are two reasons for large-scale loess landslides. Respectively, the increase of the water table and the growth of deep soil moisture content. Therefore, it is imperative to elucidate the conditions for increasing the water content and groundwater level in the stable zone.
According to Darcy’s law, the control equation for one-dimensional vertical flow is expressed as follows:
where k = coefficient of permeability, ht =the total head, q = water flux, z = elevation head.
The moisture content of the stable zone in loess remains constant all year round, which means its permeability coefficient and hydraulic gradient do not change with time. As can be seen from Eq. 1, q is a constant value with time in the stable zone. Therefore, over a prolonged period, rainfall can be considered an intermittent supply process which eventually transitions from transient flow to steady flow in the vertical section. The same is true for other types of surface water infiltration, such as irrigation, channel leakage and so on.
In the natural environment, the moisture content of the stable zone remains unchanged, which means a stable supply from the surface water.
In Eq. 1, the total head ht of water is composed of matric suction and elevation head: ht = hm + z, Gravity provides an additional driving force for vertical liquid flow, and it must also be able to impact how the total head is distributed. The formula can be expressed as the gradient of the elevation head (dz/dz=1) and the gradient of the suction head (dhm/dz). Osmotic suction is not considered, then as
The Formula 2 can also be expressed as:
This Formula 3 provides a theoretical basis for the quantitative evaluation of the vertical distribution of the suction head and the water content.
The assumption is that the soil has a thickness of 100 m, the underground water level is at a depth of 100 m but the elevation head z = 0 m, and the surface layer is at depth of 0 m but z = 100 m. The boundary conditions z = 0, hm = 0 and z = 1, hm = h1 are used to integrate the above Eq. 3.
The reorganization of Eq. 4 yields:
By that analogy, suction head h2, h3
There is an ideal homogeneous soil for giving stable infiltration flux from q = 0 cm/s to saturation coefficient q = 10−5 cm/s. The q is set as 0, 10−10, 10−9, 10−8, 10−7, 10−6, and 10−5 cm/s respectively. If q >ks, the analysis is pointless. Once the soil-water characteristic curve (SWCC) (Wang et al., 2014) and hydraulic conductivity functions (HCF) are known, the distribution of suction head and moisture content in the whole soil layer can be obtained.
Two characteristic parameters are used in the process of calculation: SWCC and HCF, as in Figures 5A, B. The test points of HCF are obtained by the instantaneous profile method (Van Genuchten, 1980), and the data are fitted with the van Genuchten (1980) function.
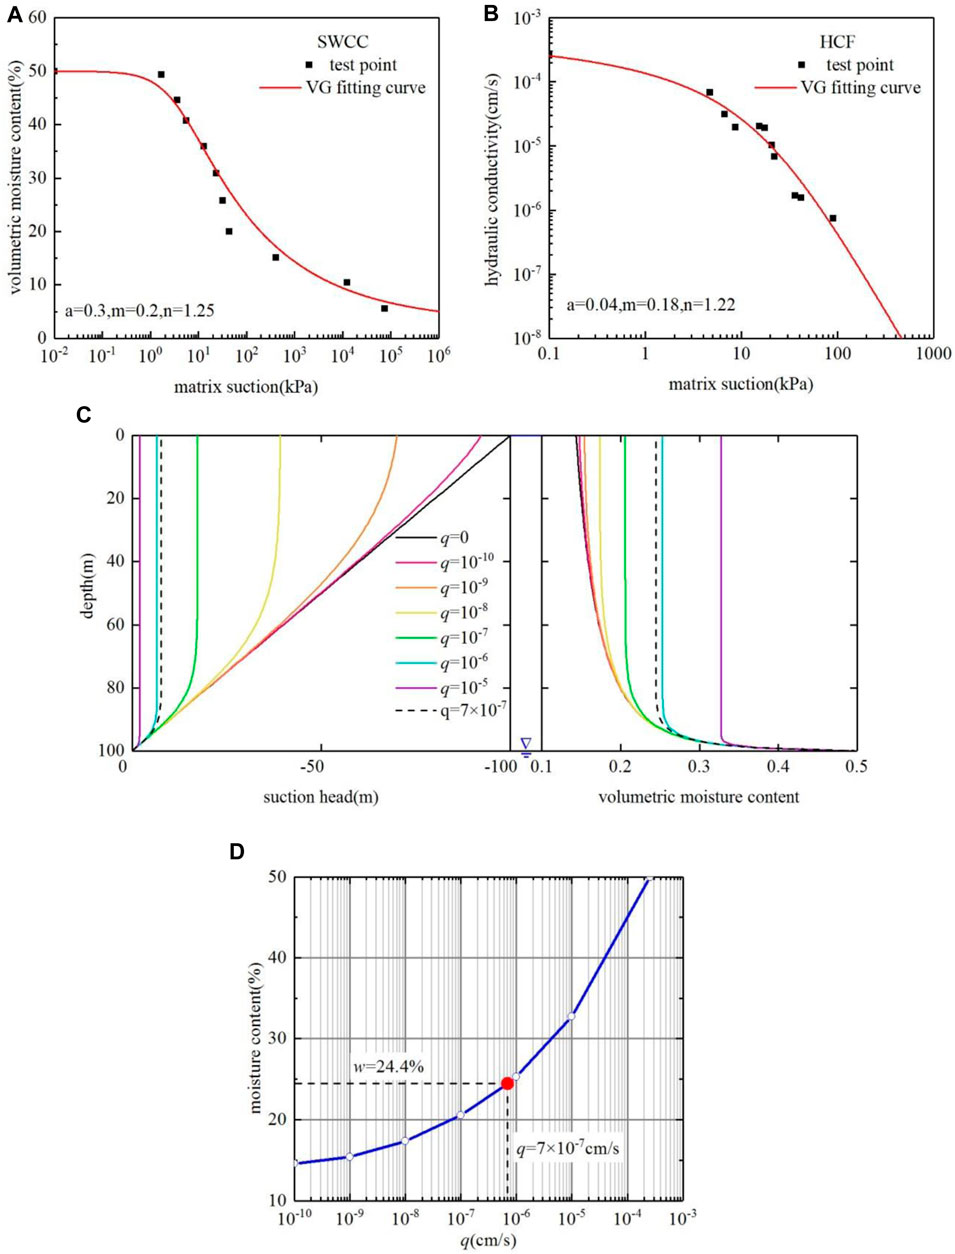
Figure 5. Theoretical calculations. (A) SWCC; (B) HFC; (C) The calculation results of the suction head and moisture content with depth; (D) The relationship between q and moisture content.
In Eq. 6, kw represents the hydraulic conductivity when the matrix suction is of ψ; ks is the hydraulic conductivity of saturated soil; ψ is on behalf of the matrix suction; a, m, and n are on behalf of the fitting parameters, a be affected by intake air volume, n is linked to the pore size distribution of soil, m is associated with the global symmetry of the soil characteristic curve, and it often has the following function relation with parameter n, m = 1–1/n or m = 1–1/2n.
The test points of SWCC are obtained by filter papertest (ASTM, D5298), and the data are fitted with the van Genuchten function.
In Eq. 7, θw represents the volumetric water content; θr means the residual volumetric water content; θs is on behalf of the saturated volumetric water content.
So, the vertical distribution of matric suction is calculated by Formula 4, and then the corresponding volumetric moisture content can also be obtained. The calculation results of suction head and moisture content with depth are shown in Figure 5C.
From Figure 5C, when the infiltration flow q = 0, the suction head is 45° diagonal, and the groundwater will reach the surface under matric suction. When the q = 10−4 cm/s is close to the saturated coefficient, the soil will eventually reach saturation. The suction head is close to 0, and the surface water flows downward under the force of gravity. In a natural environment, the reality is somewhere in between the two extremes. Like the q = 7 × 10⁻⁷ cm/s (221 mm/a), this represents a total of more than 25 mm rainfall events throughout the year. The result of moisture content is 24.4% when the q = 7 × 10 7 cm/s, which is consistent with the monitoring data. When the moisture probe is located at 4 and 7 m (L1 loess), the moisture content is 23.3%–25.3% and 25.2%–26.5% respectively.
In actual scenarios, the annual rainfall has little change, which means the infiltration flow q is constant roughly, and the water moisture in the stable zone is also kept within a certain parameter. Only the rainfall has a sharp and long-term increase, infiltration flow increases, and the suction head and the moisture content increase to a higher stable value. For example, the q value increased from 7 × 10⁻⁷ cm/s (221 mm/a) to 10−5 cm/s (3,154 mm/a), leading to an improvement in moisture content, which rose from 24.4% to 32.7%.
Above the water table, the suction head is stable in a large range, the gradient of the suction head is 0, and the water flow in the soil is mainly driven by gravity. It is named the stable zone. As a result, the moisture content of the soil is associated with the surface infiltration flow in the case of homogeneous soil, and when the infiltration flow increases the moisture content also rises, like Figure 5D. That means if the water flux remains constant, the moisture content in the stable zone will remain the same. So, the change of moisture content can’t be observed, but the water in the soil moves down by gravity. Groundwater is supplied by a steady flow through a stable zone. The results of the theoretical analysis show that the constant water content in the stable zone in the deep loess layer does not mean that water transport does not occur in the deep loess, but there is a stable infiltration of water, water is only transported by gravity and downward, and the gradient of matric suction does not change, so the water content remains unchanged, which is the mechanism of water transport in the deep loess layer.
3.2.2 Numerical analysis
Numerical simulation has the advantages of flexibility and visibility. Through numerical simulation, the infiltration process of water in soil can be explained. In field monitoring, rainfall or partial irrigation is a long-period event, and it is difficult to obtain ideal results in a short time. In order to solve these problems, the numerical simulation of one-dimensional seepage flow was carried out while conducting field monitoring. In this case, the SEEP/W module of the software Geo-studio was used for simulating the water infiltration movement in loess. The water content and pore-water pressure at diverse times and locations can be obtained by analysis.
A simplified model was used to explain the water infiltration in loess, with a size of 10 × 10 m. The reason for this size is that the moisture content below 2 m is constant all year round according to the monitoring results. The soil material consists of the same homogeneous loess in the model. It can represent the moisture change of the soil in the same stratum. Although there are some differences from the actual situation, the principles of them are similar, so the results should be the same. The initial pore water pressure was set at −100 kPa, which means the initial moisture of the soil was 23.0%.
The accuracy of the simulation results is usually controlled by two factors: one is the boundary conditions, and the other is the characteristic parameters as mentioned earlier, SWCC and HCF.
SWCC and HCF used the values shown in Figures 5A, B. The boundary conditions are shown in Figure 6. The bottom edge does not allow water to escape from the bottom. The simulation is divided into two different infiltration conditions, intermittent infiltration and steady infiltration. According to the local climatic conditions, the total infiltration rate for both infiltration conditions was set to 7 × 10⁻⁷ cm/s (221 mm/a). Steady infiltration, 1–365 days, q = 7 × 10⁻⁵ cm/s. Intermittent infiltration, 0–100 days, q = 2.5 × 10⁻⁴ cm/s, 101–365 days, q = 0 cm/s. The inflow for intermittent infiltration was simplified to 100 days per year as the rainfall in the study area is concentrated in the 3 months from July to September. In homogeneous soils, the average recharge rate is the same for both types of boundary conditions, 7 × 10⁻⁷ cm/s, and the water content of the stable zone is not affected by the mode of recharge but is only related to the magnitude of the average recharge rate. In layered soils, the magnitude of the water content of the stable zone is related to the permeability and water-holding capacity of the unsaturated soil and is not related to the mode of recharge. A comparison of the results of rainfall and shallow soil moisture monitoring in loess areas shows that water only percolates into the deeper layers of the soil when the daily rainfall or cumulative rainfall over several days exceeds 25 mm; conversely, when the rainfall is less than 25 mm, evaporation is strong and the water is absorbed by the dry soil in the surface layer and then evaporates as soon as the rain stops so that small rainfall moisture is only circulating in the shallow layer and evaporates quickly.
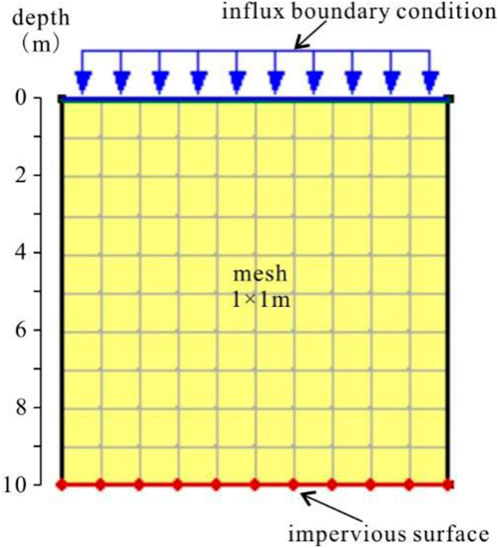
Figure 6. The model and the boundary conditions.
Figures 7A, B show the moisture content change on the model’s longitudinal profile. The initial moisture contents of the model for every node are equal to 23.5%, except for the nodes at 10 m, it subject to boundary conditions. With continuous stable watering, the soil moisture content increases from top to bottom successively. The upper layer of the model, 0 m, first reached a stable state after 1825 days (5a) infiltration. At 5 m, the moisture contents reached a stable state after 7,300 days (20a). After that, the moisture contents were regarded as a constant value although watering is continuous, with a value of 31%. From 6 to 10 m, the moisture contents were affected by the impervious surface. They went up from the beginning and still reached a stable state after 9,125 days (25a).

Figure 7. Variation of volumetric moisture content with time and depth under stable water supply conditions. (A) Variation of volumetric moisture content with time under intermittent water supply conditions at depths of 0–5 m; (B) Variation of volumetric moisture content with time under intermittent water supply conditions at depths of 6–10 m; (C) Variation of volumetric moisture content with depth under intermittent water supply conditions.
Figure 7C shows this more clearly, about 25 years, the moisture content in the model reached a stable state from an initial state under continuous infiltration. After that time, the moisture content is considered to be a constant value, even though the watering is continuous. Numerical simulations well demonstrate the results of theoretical analyses of unsaturated loess infiltration patterns: the constant water content in the stable zone in a deep loess layer does not mean that water transport does not occur in the deep loess, but rather that there is a stable infiltration of water, which is transported downward only by gravity, and that the gradient of matric suction does not change, and then the water content remains unchanged.
Intermittent water supply is more practical than stable water supply, because natural surface flows are usually intermittent, whether for irrigation or rainfall. Figure 8 shows the change of moisture content in the model with intermittent supply. At 0–1 m, the moisture contents fluctuate obviously, but as the depth increases, the fluctuation decreases. Although the water supply is intermittent, the moisture contents (except 0.1 m) gradually reached a certain value like the stable water supply, which reached 31% too. The water content within the stable zone is independent of the type of infiltration. Figures 7, 8 show that the soil moisture content in the stable zone was the same for both surface stabilised infiltration and intermittent infiltration and did not vary with intermittent infiltration under the same total infiltration conditions. According to the theoretical calculations and numerical simulation analysis process, if the soil properties are the same and the average infiltration flow rate is stable, then the soil matric suction and the water content are unchanged. Similarly, the hydraulic properties of SWCC and HCF parameters will change and then different values of water content in the stable zone will be obtained in the calculations if the average infiltration rate is constant and the soil properties are different. It can be concluded that the moisture content is entirely dependent on the total inflow and soil properties, regardless of the form of infiltration.
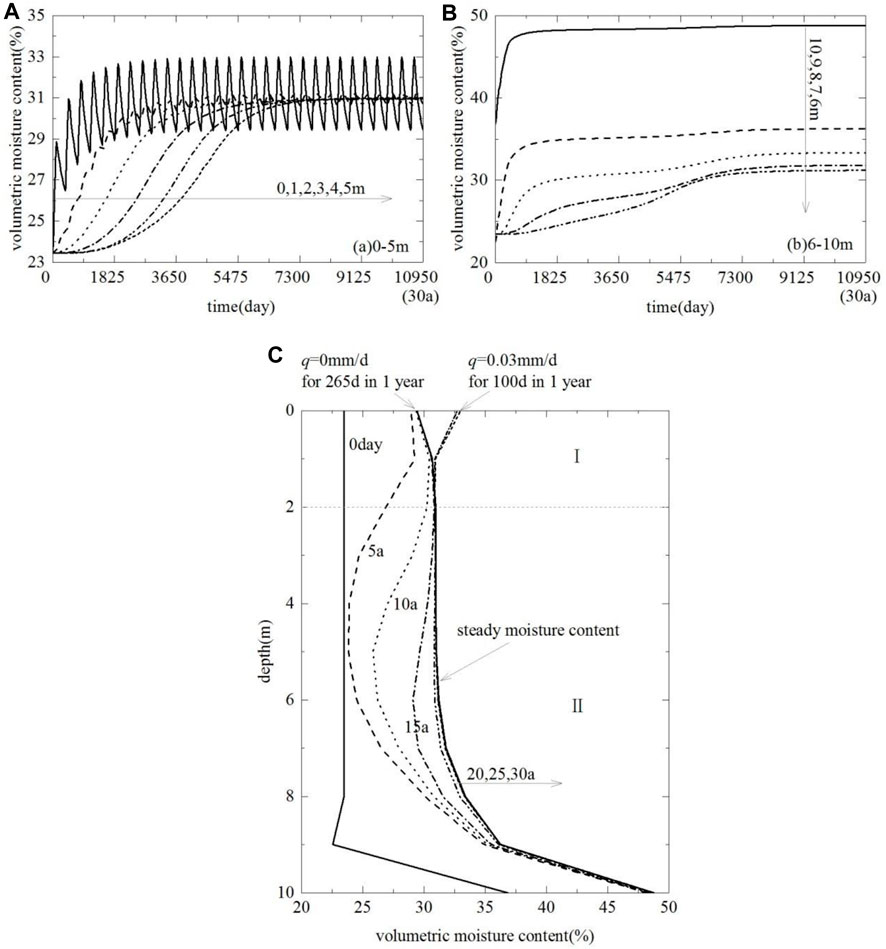
Figure 8. Variation of volumetric moisture content with time and depth under intermittent water supply conditions. (A) Variation of volumetric moisture content with time under intermittent water supply conditions at depths of 0–5 m; (B) Variation of volumetric moisture content with time under intermittent water supply conditions at depths of 6–10 m; (C) Variation of volumetric moisture content with depth under intermittent water supply conditions.
This is consistent with the field monitoring results, it can be classified into three distinct zones: Ⅰ the active zone, Ⅱ the stable zone, and Ⅲ the saturated zone. Because in the model, there is no underground water level, the saturated zone is inexistence. Both the seepage model analysis and the numerical simulation results can explain why the change in soil water content below 2 m cannot be observed in the field monitoring results. The simulating results can be used to illustrate the field monitoring results, that in the case of intermittent supply, the surface water gradually turns into the steady flow as the depth increases. Thus, in the stable zone, as long as the influx and the soil property stay constant, there are certain water content and matric suction.
3.3 Case analysis of Heifangtai landslides
The Heifangtai landslides complex in Yongjing County, Gansu, is caused by annual irrigation water infiltration. The annual rainfall in this area is 316–400 mm, while sunshine is abundant and evaporation is high, reaching 1,568 mm/a. To meet agricultural needs, irrigation canals were built to draw water from the Yellow River for irrigation, which raised the groundwater level in the loess area, causing a series of large landslides in the Heifangtai area. The essence of the development process of irrigation-induced deep loess landslides is that the long-term infiltration process creates a new water content stable zone within the slope, where the water content of the soil and matric suction no longer change, but water infiltrated by irrigation can be recharged to the groundwater through the stable zone. The groundwater level rises from the initial water level to a new water level and remains in equilibrium. In the process of groundwater level rise, seepage intensity increases, unsaturated loess matric suction decreases, strength decreases, deformation and damage occur, and then the process of slope instability is induced. This process explains the main reason for producing the deep instability of loess slopes.
4 Conclusion
This study lasted for 1 year and was located on the Loess Plateau in Gansu Province. The experiment mainly analyzes detected environmental factors and soil moisture content dates at diverse depths to explore the migration law of soil moisture in the loess area of the experimental zone. The following conclusions can be drawn.
(1) An on-site monitoring station was established in the loess area to monitor the surface climate, soil water content status and groundwater level under a long-term natural environment. According to the results of the experiment, the water infiltration process in unsaturated loess can be divided into the active zones, the stable zone (2–94 m) and the saturated zone (below 97 m) along the vertical profile.
(2) Based on the matric suction and water content calculations, the L1 soil stable water content is 24.4%, which corresponds to the moisture sensor measurement of L1 loess 4 m and 7 m of stable zone data. The theoretical analysis results can indicate that the stable zone of water content in the deep loess layer does not mean that there is no movement of moisture loess, but there is a stable infiltration of water, the water is only transported down by gravity, the gradient of the matric suction does not change, and the water content is unchanged.
(3) A hydrodynamic model for simulating unsaturated interstitial flow is proposed to reflect the characteristics of unsaturated vertical interstitial flow. The model can intuitively reveal the vertical migration law of one-dimensional unsaturated flow, and explain in principle the transition process from unsteady flow in the active zone to steady flow in the stable zone, as well as the way of groundwater recharge in the unsaturated area.
(4) Due to the results of calculation and simulation, in the stable zone, the moisture content of the soil is only related to the surface infiltration flow and soil property, it is independent of other factors. The moisture contents have some variation with the depth because of the differences in soil properties. If the surface water infiltration conditions change, such as channel leakage, pipeline leakage and agricultural irrigation other than rainfall. The infiltration flow increases, causing a rise in moisture contents within the stable zone and an increase in the groundwater level to a new value.
(5) Temperature effects on hydraulic parameters (including soil characteristics curves and non-saturated penetration functions) and soil structural properties are significant, and the combination of the two causes changes in soil humidity movement.
Data availability statement
The original contributions presented in the study are included in the article/Supplementary material, further inquiries can be directed to the corresponding author.
Author contributions
YX: Conceptualization, Funding acquisition, Methodology, Writing–original draft, Writing–review and editing. X-QH: Writing–review and editing. GL: Funding acquisition, Writing–review and editing, Conceptualization, Methodology. P-ZW: Validation, Writing–review and editing. S-SY: Validation, Writing–review and editing.
Funding
The author(s) declare that financial support was received for the research, authorship, and/or publication of this article. This study was supported by the Natural Science Basic Research Program of Shaanxi Province (2023-JC-QN-0322 and 2021JM-535), and Special Fund for Scientific Research by Xijing University (XJ18T01 and XJ22B05). Shaanxi Provincial Department of Education Service Local Special Research Program Project (23JE018).
Conflict of interest
Author P-ZW was employed by China Construction Fourth Engineering Division Corp, Ltd.
The remaining authors declare that the research was conducted in the absence of any commercial or financial relationships that could be construed as a potential conflict of interest.
Publisher’s note
All claims expressed in this article are solely those of the authors and do not necessarily represent those of their affiliated organizations, or those of the publisher, the editors and the reviewers. Any product that may be evaluated in this article, or claim that may be made by its manufacturer, is not guaranteed or endorsed by the publisher.
References
An, P., Zhang, A. J., Xing, Y. C., Ni, W. K., and Zhang, B. (2017). Analysis of soak infiltration and deformation characteristics for thick collapsible loess in IIi region. Rock Soil Mech. 38, 557–564. doi:10.16285/j.rsm.2017.02.032
Che, Y. T., Yu, J. Z., and Wu, J. Y. (1990). Study of the air-pressure effect on the deep well groundwater level in China. Hydrogeol. Eng. Geol. 4, 12–17. doi:10.16030/j.cnki.issn.1000-3665.1990.04.005
Cui, C. Y., Meng, K., Wu, Y. J., Chapman, D., and Liang, Z. M. (2018a). Dynamic response of pipe pile embedded in layered visco-elastic media with radial inhomogeneity under vertical excitation. Geomech. Eng. 16 (6), 609–618. doi:10.12989/gae.2018.16.6.609
Cui, C. Y., Zhang, S. P., Chapman, D., and Meng, K. (2018b). Dynamic impedance of a floating pile embedded in poro-visco-elastic soils subjected to vertical harmonic loads. Geomech. Eng. 15, 793–803. doi:10.12989/gae.2018.15.2.793
Feda, J. (1988). Collapse of loess upon wetting. J. Eng. Geol. 25, 263–269. doi:10.1016/0013-7952(88)90031-2
Garakani, A. A., Haeri, S. M., Khosravi, A., and Habibagahi, G. (2015). Hydro-mechanical behavior of undisturbed collapsible loessial soils under different stress state conditions. J. Eng. Geol. 195, 28–41. doi:10.1016/j.enggeo.2015.05.026
Hou, X. X., Vanapalli, S. K., and Li, T. L. (2018). Water infiltration characteristics in loess associated with irrigation activities and its influence on the slope stability in Heifangtai loess highland, China. J. Eng. Geol. 234, 27–37. doi:10.1016/j.enggeo.2017.12.020
Hu, W. L., Cheng, W. C., Wang, Y. H., Wen, S. J., and Xue, Z. F. (2023a). Applying a nanocomposite hydrogel electrode to mitigate electrochemical polarization and focusing effect in electrokinetic remediation of a Cu-and Pb-contaminated loess. Environ. Pollut. 333, 122039. doi:10.1016/j.envpol.2023.122039
Hu, W. L., Cheng, W. C., and Wen, S. J. (2023b). Investigating the effect of degree of compaction, initial water content, and electric field intensity on electrokinetic remediation of an artificially Cu-and Pb-contaminated loess. Acta Geotech. 18 (2), 937–949. doi:10.1007/s11440-022-01602-9
Hu, W. L., Cheng, W. C., Wang, Y. H., and Wen, S. J. (2023c). Feasibility study of applying a graphene oxide-alginate composite hydrogel to electrokinetic remediation of Cu (II)-contaminated loess as electrodes. Sep. Purif. Technol. 322, 124361. doi:10.1016/j.seppur.2023.124361
Jang, M. J., Sun, R. H., Li, T., and Liu, J. (2019). A three-dimensional cementation contact model for unsaturated structural loess. Chin. J. Geotech. Eng. 41, 213–216. doi:10.11779/cjge2019S1054
Leng, Y. Q., Peng, J. B., Wang, S., and Lu, F. (2021). Development of water sensitivity index of loess from its mechanical properties. Eng. Geol. 280, 105918. doi:10.1016/j.enggeo.2020.105918
Li, A. G., Yue, Z. Q., Tham, L. G., Lee, C. F., and Law, K. T. (2005). Field-monitored variations of soil moisture and matric suction in a saprolite slope. Can. Geotech. J. 42 (1), 13–26. doi:10.1139/t04-069
Li, B. X., Niu, Y. H., and Miao, T. D. (2007a). Water sensitivity of malan loess in lanzhou. Chin. J. Geotech. Eng. 29 (2), 294–298.
Li, H., Li, T. L., Jiang, R. J., Wang, Y., and Zhang, Y. G. (2020). A new method to simultaneously measure the soil–water characteristic curve and hydraulic conductivity function using filter paper. Geotech. Test. J. 43 (6), 1541–1551. doi:10.1520/gtj20190162
Li, J., Gao, G. Y., and Huang, X. F. (2011). Experimental research on immersion for unsaturated intact loess slope. Chin. J. Rock Mech. Eng. 30 (5), 1043–1048.
Li, M. X., Ma, B. H., Liu, J. F., Ja, C. Z., Guo, Z. D., Wang, Z. M., et al. (2000). A field study on moisture migration in loess aerated zone. Radiat. Prot. 20, 91–100.
Li, P., Li, T. L., and Vanapalli, S. K. (2016). Influence of environmental factors on the wetting front depth: a case study in the Loess Plateau. J. Eng. Geol. 214, 1–10. doi:10.1016/j.enggeo.2016.09.008
Li, X. A., Peng, J. B., Cheng, Z. X., and Li, B. (2007b). On the infiltration modes of surface runoff in the loess layer and geological hazards. J. Eng. Geo 15 (4), 495–499.
Liu, X. J., Yan, Y. C., and Luo, Y. (2015). Experimental research on the transfer'law of water and transferring quantity in unsaturated loess. J. Xi'an Univ. Arch. &Tech (Nat. Sci. Ed.) 47 (1), 56–61. doi:10.15986/j.1006-7930.2015.01.011
Liu, Z., Liu, F. Y., Ma, F. L., Wang, M., Bai, X. H., Zheng, Y. L., et al. (2016). Collapsibility, composition, and microstructure of loess in China. Can. Geotech. J. 53 (4), 673–686. doi:10.1139/cgj-2015-0285
Meng, K., Cui, C. Y., Liang, Z. M., Li, H. J., and Pei, H. F. (2020). A new approach for longitudinal vibration of a large-diameter floating pipe pile in visco-elastic soil considering the three-dimensional wave effects. Comput. Geotech. 128, 103840. doi:10.1016/j.compgeo.2020.103840
Qi, X., Xu, Q., Li, B., Peng, D. L., and Zhou, F. (2016). Preliminary study on mechanism of surface water infiltration at Heifangtai loess landslides in Gansu. J. Eng. Geo 24 (3), 418–424. doi:10.13544/j.cnki.Jeg.2016.03.011
Suo, A. N., Li, J. C., Wang, T. M., and Ge, J. P. (2008). Effects of land use changes on river basin soil and water loss in loess plateau. J. Hydraul. Eng. 39 (7), 767–772.
Toll, D. G. (2001). Briefing: rainfall-induced landslides in Singapore. J. Hydrol. Eng. 149, 211–216. doi:10.1680/geng.2001.149.4.211
Tu, X. B., Kwong, A. K. L., Dai, F. C., Tham, L. G., and Min, H. (2008). Field monitoring of rainfall infiltration in a loess slope and analysis of failure mechanism of rainfall-induced landslides. J. Eng. Geol. 105, 134–150. doi:10.1016/j.enggeo.2008.11.011
Van Genuchten, M. T. (1980). A closed-form equation for predicting the hydraulic conductivity of unsaturated soils. Soil Sci. Soc. Am. J. 44 (5), 892–898. doi:10.2136/sssaj1980.03615995004400050002x
Wang, H., Li, T. L., and Fu, Y. K. (2014). Determining permeability function of unsaturated loess by using instantaneous profile method. J. Hydraul. Eng. 45 (8), 997–1003. doi:10.13243/j.cnki.slxb.2014.08.014
Wang, T. X., and Zhao, S. D. (2003). Equation for water vapor transfer in unsaturated soil. China J. Highw. Transp. 16 (2), 18–21. doi:10.19721/j.cnki.1001-7372.2003.02.005
Xie, D. Y. (2001). Exploration of some new tendencies in research of loess soil mechanics. Chin. J. Geotech. Eng. 1, 3–13.
Zhang, C. L., Li, T. L., and Li, P. (2014). Rainfall infiltration in Chinese loess by in situ observation. J. Hydrol. Eng. 19 (9), 06014002. doi:10.1061/(ASCE)HE.1943-5584.0001015
Zhang, M. S., and Li, T. L. (2011). Triggering factors and forming mechanism of loess landslides. J. Eng. Geo. 19 (4), 530–540.
Keywords: water infiltration, unsaturated loess, field monitoring, theoretical investigation, numerical simulation
Citation: Xi Y, Hua X-Q, Li G, Wang P-Z and Yang S-S (2024) Investigation on the behaviors of water infiltration in the unsaturated loess. Front. Earth Sci. 12:1376694. doi: 10.3389/feart.2024.1376694
Received: 26 January 2024; Accepted: 09 April 2024;
Published: 24 April 2024.
Edited by:
Peiyue Li, Chang’an University, ChinaReviewed by:
Xi’An Li, Chang’an University, ChinaWen-Chieh Cheng, Xi’an University of Architecture and Technology, China
Copyright © 2024 Xi, Hua, Li, Wang and Yang. This is an open-access article distributed under the terms of the Creative Commons Attribution License (CC BY). The use, distribution or reproduction in other forums is permitted, provided the original author(s) and the copyright owner(s) are credited and that the original publication in this journal is cited, in accordance with accepted academic practice. No use, distribution or reproduction is permitted which does not comply with these terms.
*Correspondence: Gang Li, t_bag945@126.com