The dominant influence of indian ocean dipole-like ocean warming on decreased precipitation over eastern East Antarctica
 Hyun-Ju Lee
 Emilia Kyung Jin
- Division of Glacial and Earth Sciences, Korea Polar Research Institute (KOPRI), Incheon, Republic of Korea
East Antarctica is undergoing a noticeable decrease in precipitation, significantly impacting ice mass loss. However, there is a lack of research on the underlying factors behind this change. This study highlights that on an interannual timescale, the precipitation variations in Eastern East Antarctica (EEA) are predominantly influenced by the Indian Ocean Dipole mode (IOD) compared to other climate variabilities like the Southern Annular Mode (SAM), El Niño–Southern Oscillation (ENSO), and north Atlantic variability. Through trend analysis of each climate variability, we confirmed that the observed decrease in EEA precipitation can be attributed to positive IOD-like ocean warming. A positive SAM trend also contributed to specific Wilkes Land and Queen Mary Land regions. Despite these influence on long-term trend, the relationship between IOD and EEA precipitation exhibits sporadic changes on interdecadal timescales. Notably, the apparent negative correlation between the two declined to insignificance in the early 2000s, only to re-establish a significant negative correlation by the early 2010s. The primary driver of this change is the inconsistent propagation of waves originating from the Indian Ocean. During periods of high correlation, these waves propagate southeastward, inducing a robust low-pressure anomaly near Victoria Land, ultimately leading to decreased EEA precipitation. However, during periods of low correlation, the waves move eastward and fail to alter the circulation anomalies near East Antarctica.
1 Introduction
Since 2003, observation from GRACE satellites has indicated a significant decline in recent ice mass trends, primarily attributed to global warming (Shepherd et al., 2018; Rignot et al., 2019). This decline is not confined to the heavily affected regions of West Antarctica but also extends to Eastern East Antarctica (EEA) (Medley and Thomas, 2019; Stokes et al., 2022). In EEA, the decrease in ice mass is not driven by the ice discharge, known as the prevalent ice loss in West Antarctica (Parizek et al., 2013; Paolo et al., 2015), but rather by a decrease in surface mass balance (SMB) due to decreased precipitation in that region, where ice discharge contributes positively to ice mass (Medley and Thomas, 2019). Analyzing ERA5 reanalysis precipitation data from 1979 to 2022, a duration surpassing the GRACE observation period, also indicates a significant decreasing trend in the EEA region (Figure 1). Although the decrease in precipitation is apparent, it has not garnered substantial attention, possibly due to its slower pace compared to the rapid decline observed in West Antarctica. To comprehensively understand Antarctica’s climate, it is necessary to identify the primary climate factors that regulate precipitation changes over EEA.
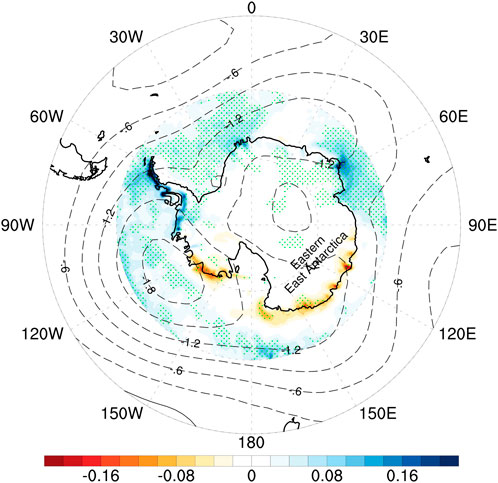
Figure 1. Trend map of annual-mean precipitation (shaded, mm) and 500-hPa geopotential height (contour, at intervals of 3 m) across high latitudes in the Southern Hemisphere from 1979 to 2022. The green dotted pattern indicates statistically significant area of precipitation at the 90% confidence level.
The primary climate variabilities influencing the Antarctic climate include the Southern Annular Mode (SAM), El Niño–Southern Oscillation (ENSO), Indian Ocean Dipole mode (IOD), and the North Atlantic variability. In its positive phase, SAM induces a dipole precipitation anomaly in West Antarctica and spatially uniformed precipitation decrease in East Antarctica (Clem and Fogt, 2013; Marshall et al., 2017). ENSO predominantly influences precipitation anomaly in West Antarctica (Bromwich et al., 2000). These well-known variabilities affect the mass of ice sheets (King et al., 2023), sea ice (Yuan, 2004; Crosta et al., 2021), ice-shelf basal melting (Verfaillie et al., 2022), and atmospheric rivers (Pohl et al., 2021; Shields et al., 2022) across various regions of Antarctica. Conversely, the impact of IOD is relatively less understood. In EEA, the positive phase of IOD leads to a negative precipitation anomaly (Nuncio and Satheesan, 2014) and a positive sea ice anomaly in summer and winter (Feng et al., 2019). While the climate variability also affects the sea ice variability in West Antarctica, its impact is less pronounced than ENSO (Kim et al., 2023). On an interdecadal timescale, IOD is more closely linked to surface temperature anomalies in Princess Elizabeth Land in EEA than the Antarctic Oscillation and Interdecadal Pacific Oscillation (Ekaykin et al., 2017). Recently, the impact of the Atlantic on the Antarctic climate has come to light. Variability in sea surface temperature in the North and tropical Atlantic Ocean has been found to lead to an anomaly in the Amundsen Sea Low (ASL) (Simpkins et al., 2014), resulting in sea ice variation in West Antarctica (Li et al., 2014; Ren et al., 2022). However, while elucidated, the impact of these four climate factors is predominantly confined to West Antarctica, with limited research on their impact on East Antarctica.
Therefore, to comprehend the unexplored variations in precipitation in East Antarctica, this study investigates the influence of these climate variabilities on precipitation in EEA and assesses their relative impacts. To achieve this goal, we first explore the relationships between climate variabilities and EEA precipitation from an interannual variability perspective. Additionally, we evaluate the impact of the trends of these climate variabilities on the recent decline in EEA precipitation. Given sporadic changes in the relationship between equatorial variability and Antarctic climate, we also aim to uncover variations in the relationships between climate variabilities and precipitation, and, if identified, to elucidate the possible underlying causes.
2 Data and methods
This study utilized monthly sea surface temperature (SST) data from the Met Office Hadley Center SST dataset (HadISST) version 1.1 covering the period 1948 to 2022. Additionally, monthly atmospheric data, including precipitation, was obtained from the European Centre for Medium-Range Weather Forecasts (ECMWF) through the ERA5 reanalysis for 1979 to 2022, and all variables were annually averaged. The time series of EEA precipitation was calculated by spatially summing the precipitation over the region depicted by the purple line in Figure 3B, corresponding to Antarctic Basin 12–14 as defined by Zwally et al. (2012). The SAM index from 1957 to 2022 was obtained from the NCAR-UCAR Climate Data Guide (Marshall, 2003). The IOD time series was derived as the difference between the domain-averaged SST over the western pole of the Indian Ocean (WIOD; 50°–70°E, 10°S–10°N) and the domain-averaged SST over the eastern pole of the Indian Ocean (EIOD; 90°–110°E, 10°S–0°). The Niño3.4 index was calculated as the SST averaged over the domain of 170°–120°W, 5°S–5°N; while the North Atlantic variability, representing the Atlantic Multidecadal Oscillation (AMO) index, was obtained by averaging the SST over the domain of 70°–10°W, 0°–70°N. The SAM, IOD, Niño3.4, and AMO indices were detrended and normalized for the regression analysis. The regression for the highly correlated IOD and Niño3.4 involved partial regression to eliminate the effects of each other. The significance of the regression coefficients was assessed using a two-tailed Student’s t-test, and the significance of Pearson correlation coefficients was verified using the p-values. The sliding correlation coefficient was computed to identify temporal change in the relationship between two variables, with the trends in the time series of each variable removed for each window prior to calculation. Additionally, for visualizing the wave propagation, the wave activity flux (WAF) was used following Plumb (1985) as follows:
Where a denotes the earth radius;
3 Results
Figure 2 displays the time series of the variabilities since industrialization (black lines). The SAM has exhibited a positive trend in response to greenhouse gas increase (Figure 2A). However, the trend is weakened by recent ozone recovery (Son et al., 2009), and it shows considerable interannual variability. The IOD and the AMO, without the removal of trends, consistently show a steady linear warming trend (Figures 2B,D). The SST of the Indian Ocean has risen by approximately 1.05 K and 0.66 K in the western and eastern Indian Ocean, respectively, until recently, at rates of 0.014 K yr–1 and 0.009 K yr–1. This exceeds the increases observed in the AMO, which were 0.59 K, significantly surpassing the equatorial average SST rise of 0.62 K. The greater warming of the eastern Indian Ocean than the western Indian Ocean induces a positive IOD-like warming (Cai et al., 2009; Cai et al., 2013). This warming is attributed to the mean state change in response to increased greenhouse gases. (Cai et al., 2013; Zheng et al., 2013). Conversely, the Niño3.4 exhibits sizeable interannual variability rather than a discernible trend (Figure 2C), while the AMO displays pronounced interdecadal variability compared to interannual variability (Figure 2D).
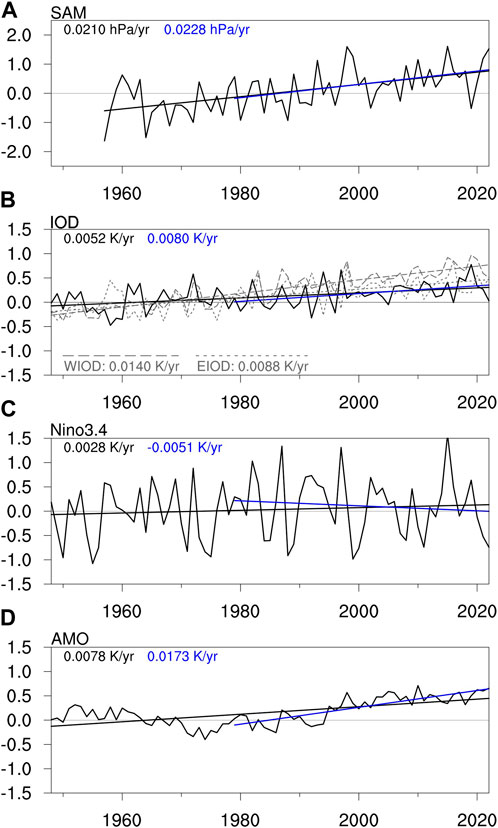
Figure 2. Time series of (A) SAM, (B) IOD, including the SSTs in the WIOD and EIOD regions, (C) Niño3.4, and (D) AMO indices. All time series and trend slopes except for the SSTs of WIOD and EIOD, depicted by grey lines, are represented by black lines. Blue lines indicate the slopes utilized in the regression analysis for 1979–2022. The values of these slopes are displayed adjacent to the panels, with corresponding colors for each period and variable. Except for the Niño 3.4 index, which shows non-significance for two periods, the trends in all variables are significant at the 99% confidence level.
Figure 3 presents regression maps of the precipitation and circulation for each factor to identify the impact of climate factors on EEA precipitation changes. The SAM not only induces zonally symmetric circulation anomalis but also generates anomalous low-pressure circulation near West Antarctica, leading to a significant dipole-like pattern of precipitation anomalies in the region (Figure 3A). In contrast, its impact on EEA is limited, inducing a relatively small decreased precipitation anomaly in specific areas of Wilkes Land and Queen Mary Land. In the regression maps for the IOD and Niño3.4, with their mutual influences removed (Figures 3B,C), the IOD triggers anomalous low-pressure circulation in the seas off Victoria Land and southerly over the EEA region, resulting in a negative precipitation anomaly across the region due to dry air transport. If the influence of the Eastern Pacific is not removed, the precipitation anomaly becomes weaker (not shown) (Nuncio and Satheesan, 2014). This relationship between IOD and the decrease in EEA precipitation is more pronounced from boreal late spring to early winter when the IOD is stronger, whereas during weaker seasons, the relationship appears to be weaker (not shown). Meanwhile, variations in Niño3.4 induce anomalous high-pressure circulation near the Amundsen Sea, resulting in a positive precipitation anomaly between 110° and 170°E and a negative precipitation anomaly between 60° and 110°E in EEA. Additionally, the AMO has a pronounced influence on precipitation anomaly in West Antarctica rather than East Antarctica (Figure 3D). These finding suggest that the primary drivers of precipitation change in EEA are the IOD and Niño3.4. In contrast, the influences of SAM and AMO are more pronounced in West Antarctica.
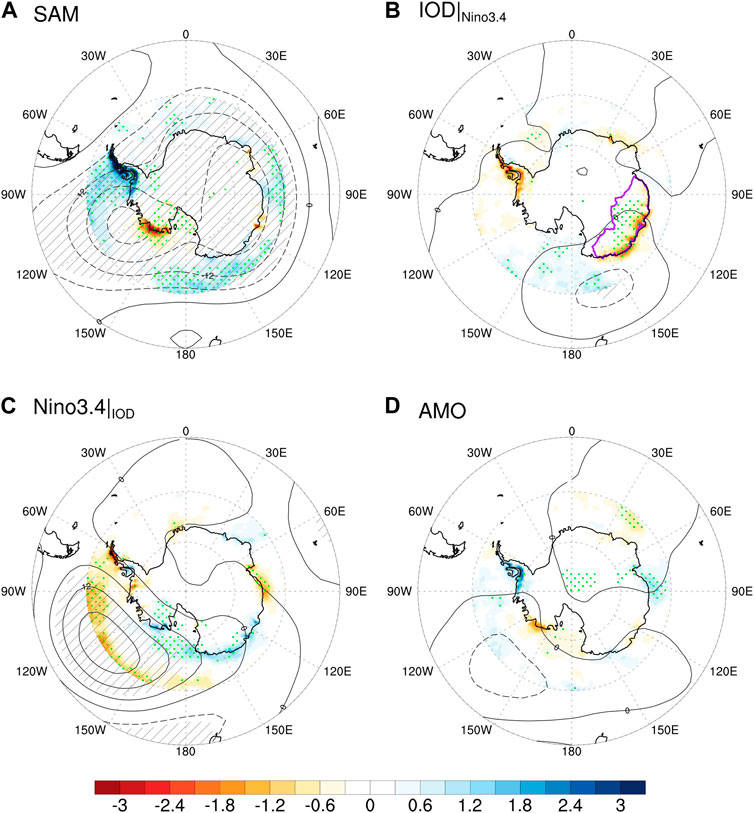
Figure 3. Regression maps of precipitation (shaded, mm) and 500-hPa geopotential height (contour, at intervals of 6 m) anomalies onto the climate factors, (A) SAM, (B) IOD, and (C) Niño3.4 and (D) AMO indices for the period of 1979–2022. After removing their correlation, the regressions for IOD and Niño3.4 were depicted as a partial regression. Green dotted and hatched patterns represent statistically significant areas of precipitation anomaly at the 95% confidence level and geopotential height anomaly at the 90% confidence level, respectively. The basin boundary of EEA is indicated as a purple line in (B).
We aim to extend our examination of the relationship between climate factors and precipitation from their interannual connection to long-term variability or trends. This method is widely used to investigate the impact of long-term variabilities (Li et al., 2014; Dou and Zhang, 2023a). To gauge the impact of each climate factor on the decreasing trend of precipitation, we examined the trend of each factor during the analysis period from 1979 to 2022 (blue lines in Figure 2). Throughout this period, the SAM, IOD, and AMO exhibited distinct positive trends. In contrast, the Niño3.4 index exhibited a negative trend, though not statistically significant. The greater influence of IOD on the EEA precipitation on interannual timescale suggestes that the significant positive IOD-like warming trend possibly played a major role in driving the decreasing precipitation trend in EEA. Additionally, the positive SAM trend might have contributed to the trend, albeit in a limited area. This suggests that the influence of the IOD-like ocean warming on the EEA precipitation trend is paramount among all other climate factors.
However, the correlation between IOD and EEA precipitation appears inconsistent on an interdecadal timescale. In the time series of IOD and EEA precipitation (Figure 4A), it is evident that from 1979 until the early to mid-2000s, the two variables exhibited a clear negative correlation. Subsequently, the correlation diminished, and from a mean state perspective, the IOD SST warmed compared to before (solid line in Figure 4A). Simultaneously, the precipitation decreased (dashed line in Figure 4A), albeit they recovered again recently. To quantitatively assess this change, we presented the running correlation coefficient. In Figure 4B, it was observed that from the early to mid-2000s, the negative correlation evident in both the 11-year and 21-year running windows sharply diminished to insignificant levels, with the correlation even transitioning to positive in the 11-year window. Subsequently, it has approached a significant negative correlation again recently. Additionally, concerning the relationship between EEA precipitation and other climate variabilities (Figure 5), it can be observed that, aside from Niño3.4, which showed a significant positive correlation approximately from the early 1990s to the early 2000s (Figure 5B), sporadic, short-lived significant levels were reached with SAM and AMO (Figures 5A,C). However, no consistent correlation is generally evident.
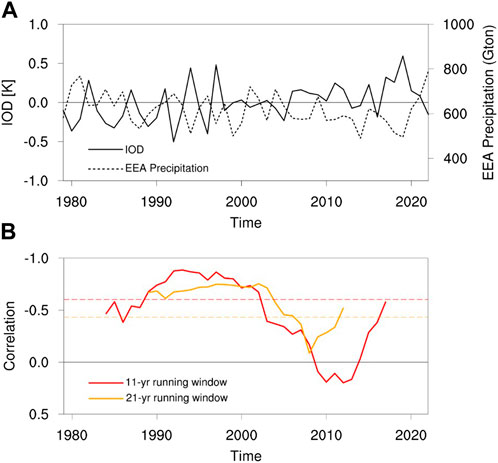
Figure 4. (A) Time series of IOD (solid line, K) and precipitation summed over the EEA basin (dashed line, Gton) with trend from 1979 to 2022. (B) The 11-year (red line) and 21-year (orange line) running correlation coefficients between IOD and EEA-basin-summed precipitation, with the impact of the Niño3.4 removed. The trends of the variables were eliminated in the window before calculating the correlation. Note that the y-axis is reversed in (B). The dashed lines in (B) represent the 95% significance level correlations.
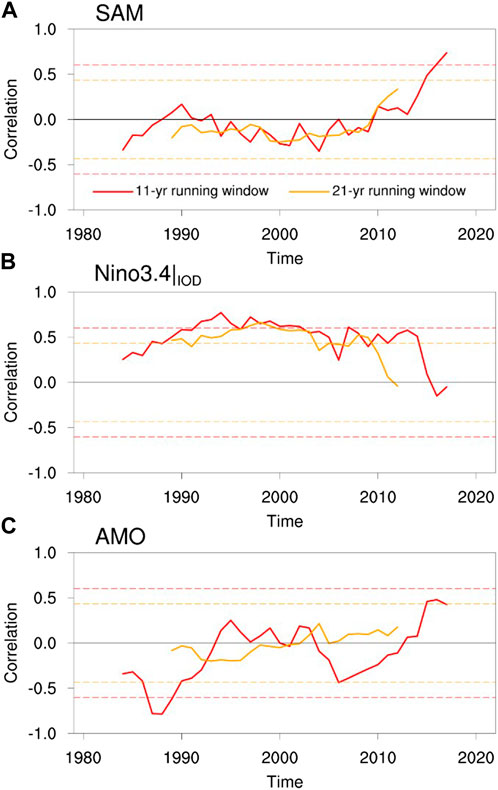
Figure 5. Same as Figure 4B, but for correlations between EEA-basin-summed precipitation and (A) SAM, (B) Niño3.4 with the IOD effect removed, and (C) AMO indices.
Previous studies have extensively documented the inconsistent interdecadal to multidecadal changes in the relationship between equatorial variability and the Antarctic climate. For instance, the relationship between ENSO and sea ice in West Antarctica shifted from negative to positive in the late 1990s, declining to an insignificant level by the early 2000s (Dou and Zhang, 2023b; Lim et al., 2023). Moreover, there are sporadic changes in the correlation between ENSO and precipitation in West Antarctica (Genthon and Cosme, 2003). The root cause of these changes seems to stem from the varying relationship over time between the East Pacific variability and the Low in the Amundsen-Bellingshausen Seas, driven by changes in teleconnection patterns (Clem and Fogt, 2013). Recent findings suggest that the weakened teleconnection is attributed to the decreased sensitivity of SST in the Tasman Sea to ENSO (Dou and Zhang, 2023b; Sun et al., 2023). Similarly, the change in the relationship between IOD and EEA precipitation may also be attributed to changes in teleconnection. This study confirmed teleconnection changes by examining Rossby wave propagation. Figure 6 shows regression maps of SST and atmospheric variables during the entire analysis period, a high negative correlation from 1992 to 2012, and a low correlation from 1998 to 2018, based on the running correlation, although there is some overlap between the two divided periods. During the high correlation period, the low-pressure anomaly in the seas off Victoria Land, evident throughout the entire analysis period, is clearly shown, along with a negative precipitation anomaly observed in EEA (Figure 6B). However, during the low correlation period, this low-pressure anomaly becomes insignificant. A weak dipole-like precipitation anomaly appears in EEA, with a negative anomaly around 120°−170°E and a positive anomaly around 70°−120°E (Figure 6C). In the SST regression, no notable differences between the two periods are observed. However, it is worth noting that a positive SST anomaly south of the Indian Ocean shifted slightly westward during the low-correlation period (Figure 6F). Meanwhile, the WAF, illustrating wave propagation, indicates robust differences in teleconnection between the two periods (vectors in Figures 6D−F). During periods of high correlation, waves originating from the southern coast of Australia propagate southeastward, inducing a robust low-pressure anomaly near the seas off Victoria Land, similar to the entire period (Figure 6E). However, during the low correlation period, waves from the exact location propagate eastward, extending the wave to the Antarctic Peninsula instead of inducing an anomalous low-pressure near Victoria Land (Figure 6F). This leads to a pronounced low-pressure anomaly near the Antarctic Peninsula, resulting in a significant negative precipitation anomaly in West Antarctica. The SST condition of the Tasman Sea known to regulate wave propagation related to ENSO teleconnection (Dou and Zhang, 2023b; Sun et al., 2023), appears to have little influence on the teleconnection of the IOD.
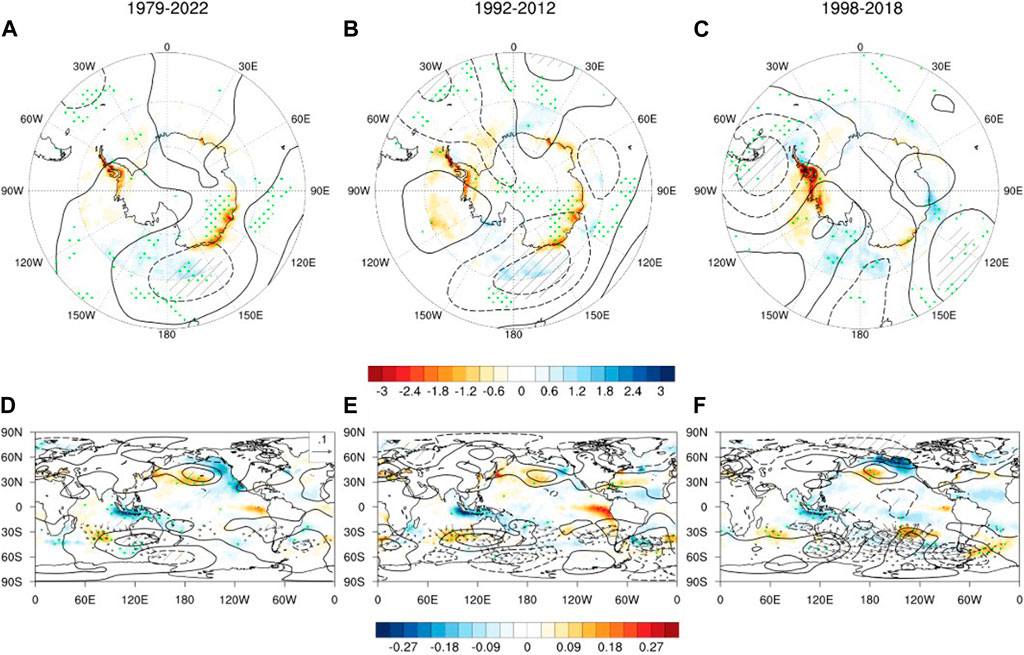
Figure 6. (A−C) Regression maps of precipitation (shaded, mm) and 250-hPa geopotential height (contour, at intervals of 6 m) anomalies, and (D−F) regression maps of SST (shaded, K), 250-hPa geopotential height (contour, at intervals of 6 m), and 250-hPa WAF (vector, m2 s−2, less than 0.01 m2 s−2 and the North Hemisphere are omitted) anomalies, onto the IOD index with the Niño3.4 effect removed, for the period of (left) 1979–2022, (mid) 1992–2012, and (right) 1998–2018. Green dotted in (A−C) and (D−F) are statistically significant areas of, respectively, precipitation and SST anomalies at the 95% confidence level; the hatched pattern represents statistically significant areas of geopotential height anomaly at the 95% confidence level.
4 Summary and discussion
This study investigated the impacts of four climate variabilities, known influencers of Antarctic climate, on precipitation changes in EEA to understand the cause of decreased precipitation responsible for the ice mass loss. Regression analysis on interannual timescales revealed that the IOD significantly impacts the decreased precipitation in most regions of EEA. At the same time, SAM induces a precipitation decrease in specific areas of Wilkes Land and Queen Mary Land within EEA. Conversely, the influence of ENSO and AMO is negligible. This suggests that the positive trend of IOD may serve as a primary driver of the declining EEA precipitation trend amid notable trends during the analysis period, including the positive SAM, IOD, and North Atlantic trends. Ultimately, it indicates that the positive IOD-like ocean warming, linked to increased greenhouse gases, could have contributed to decreased EEA precipitation.
However, examining the temporal changes in the relationship between IOD and EEA precipitation reveals an inconsistent correlation. Their relationship exhibits a significant negative correlation from the late 1980s, declines to insignificance in the early 2000s, and is currently resurging toward a significant negative correlation. This fluctuation, occurring over an interdecadal timescale, is attributed to variations in teleconnections. During periods of high correlation, waves originating near the Indian Ocean propagate southeastward, inducing low-pressure anomaly near EEA and consequent decreased precipitation in the region. Conversely, during the period of low correlation, the waves move eastward and extend to West Antarctica, generating weak precipitation anomaly in EEA and significant negative precipitation anomaly in West Antarctica. Although further research is needed for a deeper understanding, we can speculate on the potential causes of the change in the Rossby wave propagation. Examination of the regression maps between the two periods reveals a shift in the position of the positive SST anomaly in the southern Indian Ocean. This shift can potentially induce changes in atmospheric diabatic heating, initiating the onset of the Rossby wave. Additionally, changes in the atmospheric mean state may contribute to changes in the wave propagation. The subtropical jet and Hedley cell has been reported to change due to climate change and long-term variabilities (Martin and Thorncroft, 2014; Patterson et al., 2021). Comparing the wave propagation between the two periods, where similar starting points of the waves are observed but different propagation patterns, the altered mean state is expected to exert a primary influence on the change.
Additionally, the SAM, which is predicted to have a positive trend in future climates due to greenhouse gas increase, has recently begun to show a positive correlation with EEA precipitation (Figure 5A). Although it is uncertain how long this correlation will persist, if it does, the positive SAM trend is expected to mitigate the extent of EEA precipitation decrease induced by the positive IOD trend.
Furthermore, as previously noted, from the early 2000s to the early 2010s, a period of low correlation, there has been a notably negative correlation between IOD and precipitation in West Antarctica (Figure 6C). A study by Dou and Zhang (2023b) indicated a diminished impact of ENSO on sea ice in West Antarctica, reaching an insignificant level, during a similar period. This suggests that IOD may significantly impact the circulation near West Antarctica during this period, affecting precipitation and sea ice, compared to ENSO.
Data availability statement
The original contributions presented in the study are included in the article/Supplementary material, further inquiries can be directed to the corresponding author.
Author contributions
H-JL: Data curation, Formal Analysis, Methodology, Software, Visualization, Writing–original draft. EJ: Conceptualization, Investigation, Supervision, Validation, Writing–original draft, Writing–review and editing.
Funding
The author(s) declare financial support was received for the research, authorship, and/or publication of this article. This research was supported by Korea Institute of Marine Science & Technology Promotion (KIMST) funded by the Ministry of Oceans and Fisheries (RS-2023-00256677; PM24020).
Conflict of interest
The authors declare that the research was conducted in the absence of any commercial or financial relationships that could be construed as a potential conflict of interest.
Publisher’s note
All claims expressed in this article are solely those of the authors and do not necessarily represent those of their affiliated organizations, or those of the publisher, the editors and the reviewers. Any product that may be evaluated in this article, or claim that may be made by its manufacturer, is not guaranteed or endorsed by the publisher.
References
Bromwich, D. H., Rogers, A. N., Kållberg, P., Cullather, R. I., White, J. W., and Kreutz, K. J. (2000). ECMWF analyses and reanalyses depiction of ENSO signal in Antarctic precipitation. J. Clim. 13 (8), 1406–1420. doi:10.1175/1520-0442(2000)013<1406:eaardo>2.0.co;2
Cai, W., Sullivan, A., and Cowan, T. (2009). Climate change contributes to more frequent consecutive positive Indian Ocean Dipole events. Geophys. Res. Lett. 36 (23). doi:10.1029/2009GL040163
Cai, W., Zheng, X.-T., Weller, E., Collins, M., Cowan, T., Lengaigne, M., et al. (2013). Projected response of the Indian Ocean Dipole to greenhouse warming. Nat. Geosci. 6, 999–1007. doi:10.1038/ngeo2009
Clem, K. R., and Fogt, R. L. (2013). Varying roles of ENSO and SAM on the antarctic Peninsula climate in austral spring. J. Geophys. Res. Atmos. 118. doi:10.1002/jgrd.50860
Crosta, X., Etourneau, J., Orme, L. C., Dalaiden, Q., Campagne, P., Swingedouw, D., et al. (2021). Multi-decadal trends in Antarctic sea-ice extent driven by ENSO–SAM over the last 2,000 years. Nat. Geosci. 14 (3), 156–160. doi:10.1038/s41561-021-00697-1
Dou, J., and Zhang, R. (2023a). Impact of sea surface temperature in the extratropical southern Indian ocean on antarctic sea ice in austral spring. J. Clim. 36 (23), 8259–8275. doi:10.1175/JCLI-D-22-0655.1
Dou, J., and Zhang, R. (2023b). Weakened relationship between ENSO and Antarctic seaice in recent decades. Clim. Dyn. 60, 1313–1327. doi:10.1007/s00382-022-06364-4
Ekaykin, A. A., O, V. D., Lipenkov, V. Y., and Masson-Delmotte, V. (2017). Climatic variability in princess Elizabeth Land (East Antarctica) over the last 350 years. Clim. Past. 13, 61–71. doi:10.5194/cp-13-61-2017
Feng, J., Zhang, Y., Cheng, Q., San Liang, X., and Jiang, T. (2019). Analysis of summer Antarctic sea ice anomalies associated with the spring Indian Ocean dipole. Glob. Planet. Change 181, 102982. doi:10.1016/j.gloplacha.2019.102982
Genthon, C., and Cosme, E. (2003). Intermittent signature of ENSO in west-Antarctic precipitation. Geophys. Res. Lett. 30 (21). doi:10.1029/2003GL018280
Kim, J., Kang, D., Lee, M. I., Jin, E. K., Kug, J. S., and Lee, W. S. (2023). Remote influences of ENSO and IOD on the interannual variability of the west antarctic sea ice. J. Geophys. Res. Atmos 128, e2022JD038313. doi:10.1029/2022JD038313
King, M. A., Lyu, K., and Zhang, X. (2023). Climate variability a key driver of recent Antarctic ice-mass change. Nat. Geosci. 16 (12), 1128–1135. doi:10.1038/s41561-023-01317-w
Li, X., Holland, D. M., Gerber, E. P., and Yoo, C. (2014). Impacts of the North and tropical Atlantic Ocean on the antarctic Peninsula and sea ice. Nature 505, 538–542. doi:10.1038/nature12945
Lim, Y. K., Wu, D. L., Kim, K. M., and Lee, J. N. (2023). Decadal changes in the antarctic sea ice response to the changing ENSO in the last four decades. Atmosphere 14 (11), 1659. doi:10.3390/atmos14111659
Marshall, G. J. (2003). Trends in the southern annular mode from observations and reanalyses. J. Clim. 16, 4134–4143. doi:10.1175/1520-0442(2003)016<4134:titsam>2.0.co;2
Marshall, G. J., Thompson, D. W. J., and van den Broeke, M. R. (2017). The signature of southern Hemisphere atmospheric circulation patterns in antarctic precipitation. Geophys. Res. Lett. 44, 11580–11589. doi:10.1002/2017gl075998
Martin, E. R., and Thorncroft, C. D. (2014). The impact of the AMO on the West African monsoon annual cycle. Q. J. R. Meteorol. Soc. 140 (678), 31–46. doi:10.1002/qj.2107
Medley, B., and Thomas, E. R. (2019). Increased snowfall over the Antarctic Ice Sheet mitigated twentieth-century sea-level rise. Nat. Clim. Chang. 9 (1), 34–39. doi:10.1038/s41558-018-0356-x
Nuncio, M., and Satheesan, K. (2014). Indian Ocean Dipole and southern high latitude precipitation: possible links. Clim. Dyn. 43, 1965–1972. doi:10.1007/s00382-013-2020-5
Paolo, F. S., Fricker, H. A., and Padman, L. (2015). Volume loss from antarctic ice shelves is accelerating. Science 348, 327–331. doi:10.1126/science.aaa0940
Parizek, B. R., Christianson, K., Anandakrishnan, S., Alley, R. B., Walker, R. T., Edwards, R. A., et al. (2013). Dynamic (in) stability of thwaites glacier, West Antarctica. J. Geophys. Res. 118 (2), 638–655. doi:10.1002/jgrf.20044
Patterson, M., Woollings, T., and Bracegirdle, T. J. (2021). Tropical and subtropical forcing of future southern hemisphere stationary wave changes. J. Clim. 34 (19), 7897–7912. doi:10.1175/JCLI-D-21-0075.1
Plumb, R. A. (1985). On the three-dimensional propagation of stationary waves. J. Atmos. Sci. 42 (3), 217–229. doi:10.1175/1520-0469(1985)042<0217:ottdpo>2.0.co;2
Pohl, B., Favier, V., Wille, J., Udy, D. G., Vance, T. R., Pergaud, J., et al. (2021). Relationship between weather regimes and atmospheric rivers in East Antarctica. J. Geophys. Res. Atmos. 126 (24), e2021JD035294. doi:10.1029/2021JD035294
Ren, X., Zhang, L., Cai, W., Li, X., Wang, C. Y., Jin, Y., et al. (2022). Influence of tropical Atlantic meridional dipole of sea surface temperature anomalies on Antarctic autumn sea ice. Environ. Res. Lett. 17 (9), 094046. doi:10.1088/1748-9326/ac8f5b
Rignot, E., Mouginot, J., Scheuchl, B., van den Broeke, M., van Wessem, M. J., and Morlighem, M. (2019). Four decades of antarctic ice sheet mass balance from 1979-2017. Proc. Natl. Acad. Sci. U. S. A. 116, 1095–1103. doi:10.1073/pnas.1812883116
Shepherd, A., Ivins, E., Rignot, E., Smith, B., Van Den Broeke, M., Velicogna, I., et al. (2018). Mass balance of the antarctic ice sheet from 1992 to 2017. Nature 558, 219–222. doi:10.1038/s41586-018-0179-y
Shields, C. A., Wille, J. D., Marquardt Collow, A. B., Maclennan, M., and Gorodetskaya, I. V. (2022). Evaluating uncertainty and modes of variability for Antarctic atmospheric rivers. Geophys. Res. Lett. 49 (16), e2022GL099577. doi:10.1029/2022GL099577
Simpkins, G. R., Mcgregor, S., Taschetto, A. S., Ciasto, L. M., and England, M. H. (2014). Tropical connections to climatic change in the extratropical southern Hemisphere: the role of atlantic SST trends. J. Clim. 27, 4923–4936. doi:10.1175/jcli-d-13-00615.1
Son, S. W., Tandon, N. F., Polvani, L. M., and Waugh, D. W. (2009). Ozone hole and Southern Hemisphere climate change. Geophys. Res. Lett. 36, 1–5. doi:10.1029/2009GL038671
Stokes, C. R., Abram, N. J., Bentley, M. J., Edwards, T. L., England, M. H., Foppert, A., et al. (2022). Response of the East Antarctic ice sheet to past and future climate change. Nature 608, 275–286. doi:10.1038/s41586-022-04946-0
Sun, X. Q., Li, S. L., and Yang, D. X. (2023). Air–sea coupling over the Tasman Sea intensifies the ENSO-related South Pacific atmospheric teleconnection. Adv. Clim. Change Res. 14 (3), 363–371. doi:10.1016/j.accre.2023.06.001
Verfaillie, D., Pelletier, C., Goosse, H., Jourdain, N. C., Bull, C. Y. S., Dalaiden, Q., et al. (2022). The circum-Antarctic ice-shelves respond to a more positive southern annular mode with regionally varied melting. Commun. Earth Environ. 3 (1), 139. Article 1. doi:10.1038/s43247-022-00458-x
Yuan, X. (2004). ENSO-Related impacts on antarctic sea ice: a synthesis of phenomenon and mechanisms. Antartic Sci. 16, 415–425. doi:10.1017/s0954102004002238
Zheng, X. T., Xie, S. P., Du, Y., Liu, L., Huang, G., and Liu, Q. Y. (2013). Indian Ocean Dipole response to global warming in the CMIP5 multimodel ensemble. J. Clim. 26, 6067–6080. doi:10.1175/JCLI-D-12-00638.1
Zwally, H. J., Giovinetto, M. B., Beckley, M. A., and Saba, J. L. (2012). Antarctic and Greenland drainage systems, GSFC cryospheric sciences laboratory. Available at: http://icesat4.gsfc.nasa.gov/cryo_data/ant_grn_drainage_systems.php.
Keywords: eastern east Antarctica (EEA, ), decreased precipitation trend in EEA, positive IOD-like ocean warming, interdecadal change in the relationship between IOD and EEA precipitation, changes in teleconnections
Citation: Lee H-J and Jin EK (2024) The dominant influence of indian ocean dipole-like ocean warming on decreased precipitation over eastern East Antarctica. Front. Earth Sci. 12:1387809. doi: 10.3389/feart.2024.1387809
Received: 18 February 2024; Accepted: 27 March 2024;
Published: 12 April 2024.
Edited by:
Kyong-Hwan Seo, Pusan National University, Republic of KoreaReviewed by:
Won-Il Lim, Hanyang Universiy, Erica, Republic of KoreaWoosok Moon, Pukyong National University, Republic of Korea
Copyright © 2024 Lee and Jin. This is an open-access article distributed under the terms of the Creative Commons Attribution License (CC BY). The use, distribution or reproduction in other forums is permitted, provided the original author(s) and the copyright owner(s) are credited and that the original publication in this journal is cited, in accordance with accepted academic practice. No use, distribution or reproduction is permitted which does not comply with these terms.
*Correspondence: Emilia Kyung Jin, jin@kopri.re.kr