Analysis on the spatiotemporal evolutions of groundwater hydrochemistry and water quality caused by over-extraction and seawater intrusion in eastern coastal China
 Weifan Chen
 Chu Wu*
  Shibing Pan
- State Key Laboratory of Water Cycle Simulation and Regulation, China Institute of Water Resources and Hydropower Research, Beijing, China
The over-extraction of groundwater has resulted in seawater intrusion and the southward migration of the saltwater interface, gradually deteriorating the groundwater quality in the Weibei Plain. In this research, groundwater samples were gathered from 46 monitoring wells for shallow groundwater during the years 2006, 2011, 2016, and 2021. The hydrochemical features of regional groundwater and the factors influencing the issue were subjected to statistical analysis. Additionally, the assessment of spatiotemporal variations in groundwater quality was conducted using the customized entropy-weighted water quality index (EWQI) method. The relationship between groundwater over-extraction and the southward intrusion of the saltwater interface was compared and analyzed. The results of this paper revealed that the Weibei Plain has been in a state of long-term over-extraction of groundwater from 2000 to 2021, with an average annual over-extraction of 118.49 million m3. The groundwater depression cone areas in the northern part of the study area increased from 3,247.37 to 4,581.34 km2 from 2006 to 2021, with the center of the cone experiencing a drop in groundwater level from −22 to −85 m. The saltwater interface shifted southward by 711.71 km2 from 2006 to 2021. In groundwater, the high concentrations of TH, TDS, and Cl− were primarily related to the seawater intrusion, while higher concentrations of NO3− were mainly determined by frequent agricultural production, industrial wastewater, and domestic sewage discharges. The groundwater hydrochemical types in the study area transitioned from predominantly HCO3·Ca-Mg type in 2006 to HCO3-Na type and SO4·Cl-Ca·Mg type in 2021 due to seawater intrusion. The results of PCA and HCA show the effects of seawater intrusion, human activities, and rock weathering on groundwater hydrochemistry. The evaluation results based on the EWQI revealed that the average value of the samples in 2021 was 101.36, which belonged to Class IV water quality standards, representing the poorest water quality among the 4 years. The southward migration of the saltwater interface led to the deterioration of groundwater quality in the groundwater depression cone areas, which gradually worsened from 2006 to 2021. The maximum increase in EWQI value was 174.68 during the period, shifting from Class III water quality to Class V water quality. Groundwater quality remained relatively better in the western and southern regions which were less affected or unaffected by seawater intrusion. The results of the study can provide a certain reference value for the sustainable management of groundwater resources and the management of groundwater pollution and seawater intrusion in the Weifang City area in the future.
1 Introduction
Groundwater is an important part of the global water cycle (Condon et al., 2021). Groundwater supplies water to billions of people on Earth, and its health and safety are vital (Famigliettil, 2014; Cuthbert et al., 2019). In certain regions with scarce surface water resources or elevated water demands, such as arid and coastal areas, the significance of groundwater becomes particularly prominent (Wang et al., 2018; Bhakar and Singh, 2019). Therefore, the rational utilization of coastal groundwater resources is crucial for coastal cities (Xiong et al., 2020). However, continuous groundwater extraction in coastal areas reduces freshwater outflows to the sea and contributes to water table depression, which will lead to increased domestic water leakage and seawater intrusion (Alfarrah and Walraevens, 2018; Saleh et al., 2023). Seawater intrusion can alter the chemistry of groundwater in coastal areas, leading to the deterioration of groundwater quality, with significant environmental and economic consequences (Alfarrah and Walraevens, 2018; Costall et al., 2020; Tajwar et al., 2023). Since the 1970s, with the rapid economic development in China, extensive groundwater extraction has taken place (Huang et al., 2014). The excessive extraction of groundwater has given rise to a range of environmental threats, such as ground subsidence, seawater intrusion, and a decline in water quality. This has notably manifested in widespread ground subsidence across the North China Plain and exacerbated seawater intrusion problems in the coastal regions of Shandong and Liaoning Provinces in northern China (Shang et al., 2016; Ma et al., 2019; Jiao et al., 2020). In coastal regions, long-term over-extraction of groundwater to sustain socio-economic development has resulted in the formation of cones of groundwater depression, leading to seawater intrusion from the sea (Xiong et al., 2020; Tajwar et al., 2023). This, in turn, has contributed to environmental challenges, such as the degradation of groundwater quality, soil salinization, and ecological deterioration (Liu et al., 2017; Chen et al., 2021; He et al., 2020).
Groundwater in coastal over-extraction areas is often influenced by natural and anthropogenic activities such as seawater intrusion, excessive extraction, and climate change (Bahir et al., 2018). Numerous studies have been conducted on the groundwater resources in coastal over-extraction areas, employing stable isotopes, multivariate statistical methods, and graphical approaches to analyze groundwater recharge, source evolution mechanisms and hydrochemical characteristics (Bahir et al., 2018; Qi et al., 2019; Wen et al., 2020; Ez-zaouy et al., 2021; Ma et al., 2022; Shah et al., 2022). The Laizhou Bay area is a region in China that is more severely affected by seawater intrusion. There have been several recent studies examining groundwater quality assessment as well as seawater intrusion. Zhou et al. (2020) used Gibbs plots, Piper plots, solubility plots, and ion correlation analysis to evaluate groundwater formation processes. The Drinking Water Quality Index (DWQI) was also used to assess drinking water quality; the Irrigation Water Quality Index (IWQI) was used to assess irrigation water quality. Xia et al. (2022) analyzed the major ionic and isotopic compositions of precipitation, river water, wet-land water, and seawater in the Yellow River Delta, and correlatively grouped wetland water samples with river water samples through hierarchical cluster analysis (HCA) to identify ecological threats in the context of saline intrusion and human activities. Elumalai et al. (2020) assessed groundwater quality and its suitability for drinking and irrigation in the upper Luvuvhu sub-basin using multivariate statistical analysis, and analyzed groundwater chemistry as influenced by natural and anthropogenic activities using Pearson’s correlation analysis and Principle Component Analysis (PCA). However, there is no comprehensive study on the long-term trends of groundwater hydrochemical characteristics and causal analysis, analysis of the relationship between groundwater over-extraction and seawater intrusion, and assessment of shallow groundwater quality in coastal over-extraction areas. Therefore, this study takes the Weibei Plain in Shandong Province, northern China, as a case study. Based on the analysis of groundwater over-extraction in the Weibei Plain from 2000 to 2021, this paper selected four typical years (2006, 2011, 2016, and 2021) to investigate changes in groundwater flow fields and the saltwater interface caused by groundwater over-extraction. Additionally, an evaluation method based on the EWQI was employed to assess changes in groundwater quality in the Weibei Plain. And the impacts of seawater intrusion due to groundwater over-extraction on the hydrochemistry of groundwater were analyzed. The results of this study provide information for preventing further deterioration of groundwater quality in Weifang City and formulating strategies to address the challenge of seawater intrusion. Moreover, these insights support the sustainable utilization and management of groundwater resources in Weifang City, thereby fostering its long-term development.
The primary objectives of this study are as follows: 1) identify the types of groundwater hydrochemistry in the study area; 2) evaluate the groundwater quality in the study area based on customized criteria; 3) clarify the status of groundwater over-extraction, the cones of groundwater depression, and changes in the saltwater interface in the study area; 4) analyze the impacts of seawater intrusion on the groundwater quality in the study area.
2 Materials and methods
2.1 Study area
Weifang City is located in the middle of the Shandong Peninsula, with a total area of 16,167.23 km2 and a total resident population of 9,080,100 people. In 2021, the city’s total water consumption will be 1,645 million m³, of which agricultural water consumption will account for 40.5% and industrial water consumption will account for 16.4%.
The Weibei Plain is located in the north of Weifang City, near Bohai Bay, and includes most of Changyi City, Hanting District, Shouguang City, and a small part of Changle City (Figure 1). The northern region of Weibei Plain is situated along the Bohai Sea and experiences a warm temperate monsoonal continental climate with a semi-humid characteristic. The long-term average annual temperature is 12.9 °C (Liu et al., 2020), while the multi-year average annual precipitation (1986–2021) is recorded at 636.1 mm. Precipitation exhibits significant intra-annual variability and pronounced interannual variations. The rainy season typically spans from June to September, with alternating years characterized by abundance, normalcy, or scarcity of precipitation. Within the boundaries of Weibei Plain, six major rivers flow from west to east: the Mi River, Bailang River, Wen River, Wei River, Wulong River, and Jiao River (Figure 1).
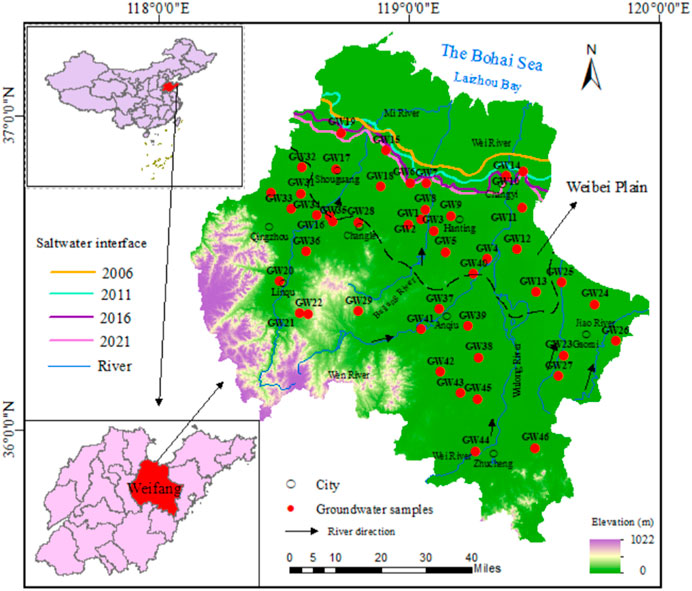
Figure 1. Location of the study area, with the location of the groundwater sampling site and saltwater interface.
The southern part of the Weibei Plain is characterized by low hills and ridges resulting from prolonged weathering, erosion, and water erosion. As a consequence, rocks are exposed, and the topography exhibits significant fluctuations, with elevation gradually decreasing from south to north, sloping gently towards the Bohai Sea and the Laizhou Bay. The region consists of alluvial plains, flood plains, and Bohai marine plains as one progresses from south to north. In the northern coastal area of the Weibei Plain, it transitions into a marine plain that slopes towards the coastline. Here, the beaches are broad, and saline-alkali land is commonly found.
The Weibei Plain is a result of fluvial and marine deposition by the Wei River, Mi River, and Bailang River, primarily composed of Quaternary deposits. It is predominantly distributed in areas like Shouguang, Hanting, and Changyi, with a general stratum thickness ranging from 50 to 200 m. The aquifer lithology in the Weibei Plain mainly consists of medium to coarse sand and pebble stones formed by fluvial and alluvial deposition, as well as clayey sand, sandy clay, and silt formed by alluvial and marine deposition. The aquifer system transforms from a single-layer to a multi-layer structure and from unconfined to semi-confined aquifers when moving from south to north (Liu et al., 2020). In the Weibei Plain, the main contributor to groundwater recharge is atmospheric precipitation, followed by runoff from the southern mountainous regions and lateral inflow from rivers. The predominant methods of groundwater discharge involve artificial extraction, evaporation, lateral outflow and discharge into rivers, with artificial extraction and evaporation being the primary means of discharge (Hu et al., 2018).
2.2 Sample collection and analyses
This investigation involved the selection of 46 groundwater monitoring wells within the region during the dry season (November) of 2006, 2011, 2016, and 2021. Groundwater samples were systematically collected for subsequent water chemistry analysis (Figure 1). The specimens were predominantly sourced from the pore phreatic water within loosely consolidated Quaternary rock formations. Samples were collected in double-clean polyethylene bottles for the analyses of trace elements. Before sampling, the pump was turned on and pumped for 5–10 min to remove stagnant water from the pipelines. The sample bottles were sterilized before sampling and rinsed with distilled water. Finally, the sample bottles were rinsed 2–3 times with the sample source water before the final sample collection. The main analytical indicators included pH, total hardness (TH), total dissolved solids (TDS), SO42-, F−, Cl−, NO3−, HCO3−, Ca2+, Mg2+, Na+, and K+. The pH value is measured on-site, and the concentration of other ions is taken back to the laboratory for measurement. A pH acidimeter was used to measure pH. The concentrations of TDS, Ca2+, Mg2+, Na+, and K+ were determined by inductively coupled plasmaoptical emission spectrometry (ICP-AES; optima 7000DV) with a lower limit of detection of 1 μg/L. The concentrations of SO42−, F−, Cl−, and NO3− were determined by ion chromatography (ICS- 1,100) with a lower limit of detection of 0.1 mg/L. The concentrations of HCO3− and TH were determined by titration using a burette (500 mL). To ensure the accuracy of the data, the charge balance error (%CBE) was calculated for all groundwater samples in Eq. (1). The %CBE values of more than 95% of the groundwater samples were within ±5, indicating that the groundwater quality data in the Weibei Plain are reliable. Given the absence of defined exceedance concentrations for Ca2+, Mg2+, K+, and HCO3− in groundwater quality standards (Standard for groundwater quality in China, 2024), the assessment of groundwater quality in this study focused on seven indicators: pH, TH, TDS, SO42−, F−, Cl−, and NO3−.
2.3 Methods
2.3.1 Water quality evaluation methods
The customized entropy-weighted water quality index (EWQI) method is commonly used to characterize groundwater quality due to its rationality and objectivity (Wu et al., 2018; Lyu et al., 2019; Liu et al., 2021a). This paper employed the EWQI method for groundwater quality assessment, with the following steps:
2.3.1.1 Establishment of the initial water quality matrix
If the number of groundwater samples is
2.3.1.2 Data standardization
The untransformed groundwater data is subjected to standardization. If
2.3.1.3 Determination of weights using the entropy-weighted method
The entropy-weighted method is applied to determine the weights of each evaluation parameter. If there are
A smaller entropy value indicates a more effective parameter, weight determination is:
2.3.1.4 Determination of quantitative grading. The formula is
In Eq. 8,
2.3.1.5 Calculation of the entropy weight water quality index
2.3.1.6 Classification of groundwater quality evaluation
The groundwater quality and its applicability were evaluated by the entropy-weighted water quality index. The classification criteria consist of five levels, corresponding to groundwater quality classification indicator limits (Standard for groundwater quality in China). And Eqs 2–9 were used to derive the grading criteria EWQI applicable to the evaluation of groundwater quality in the Weibei Plain, as shown in Table 1.
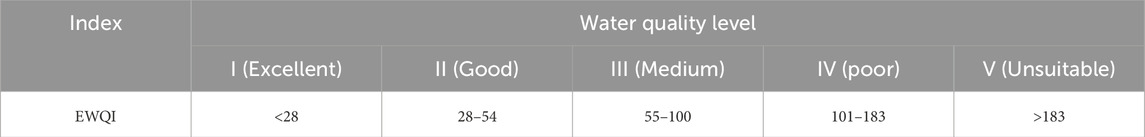
Table 1. Water quality evaluation grading standards of Weibei Plain (Standard for groundwater quality in China).
2.3.2 Groundwater hydrochemistry and multivariate statistical analysis methods
To unveil the correlation between the observed water samples and various ion indicators, this study employed R-mode factor analysis utilizing principal component analysis (PCA) and hierarchical clustering analysis (HCA) methods for corresponding analysis. The PCA method serves to condense multi-variable data into a few dimensions for analysis, while preserving key components and trends. On the other hand, HCA stands as one of the most prevalent multivariate cluster analysis methods. These approaches are frequently employed for statistical analysis of water chemical characteristics (Tran et al., 2020; Kumar et al., 2022).
The Piper diagram, comprised of a diamond and two triangles, serves as a frequently utilized tool for categorizing groundwater hydrochemistry types (Piper, 1944; Zhou et al., 2020). Gibbs (1970) developed a semi-logarithmic graph with the ordinate and abscissa representing TDS and Na+/(Na+ + Ca+) or Cl−/(Cl− + HCO3−), which was used to identify the factors controlling the groundwater chemistry.
3 Results and discussion
3.1 Hydrochemical indicators and causal analysis
The statistical characteristics of groundwater chemistry for the 46 monitoring wells in the study area during the years 2006, 2011, 2016, and 2021 are shown in Table 2 and Figure 2. In 2021, the pH values ranged from 7.15 to 8.1, with an average of 7.65, indicating that the groundwater in the study area is weakly alkaline. The concentration of TH ranged from 161 to 1,160 mg/L, with an average concentration of 546.37 mg/L, far exceeding the Class III water standard (Table 3). Specifically, 29 of these samples exceeded the TH limit. The concentration of TDS ranged from 310 to 2,960 mg/L, with an average concentration of 943.15 mg/L. Among them, the concentration of TDS in 13 samples exceeded the total dissolved solids limit (Table 3). The high concentrations of TH and TDS indicate that groundwater in most areas of the study region is hard and saline. On the other hand, since the TH and TDS in groundwater under normal circumstances are not so high, the high concentrations of TH and TDS in the groundwater samples in this study may be related to the regional seawater intrusion.
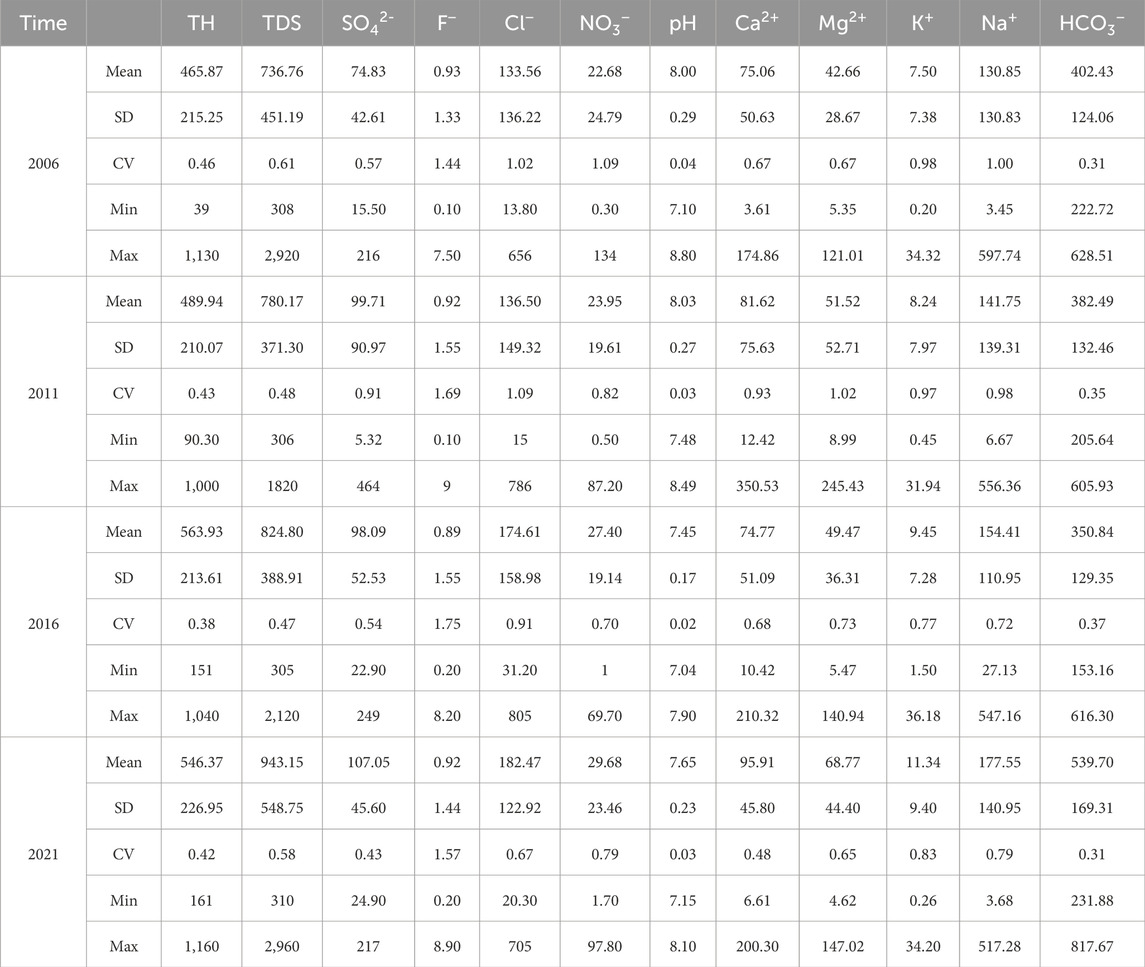
Table 2. Statistical summary of the main chemical components found in the groundwater of the Weibei Plain (unit: mg/L).
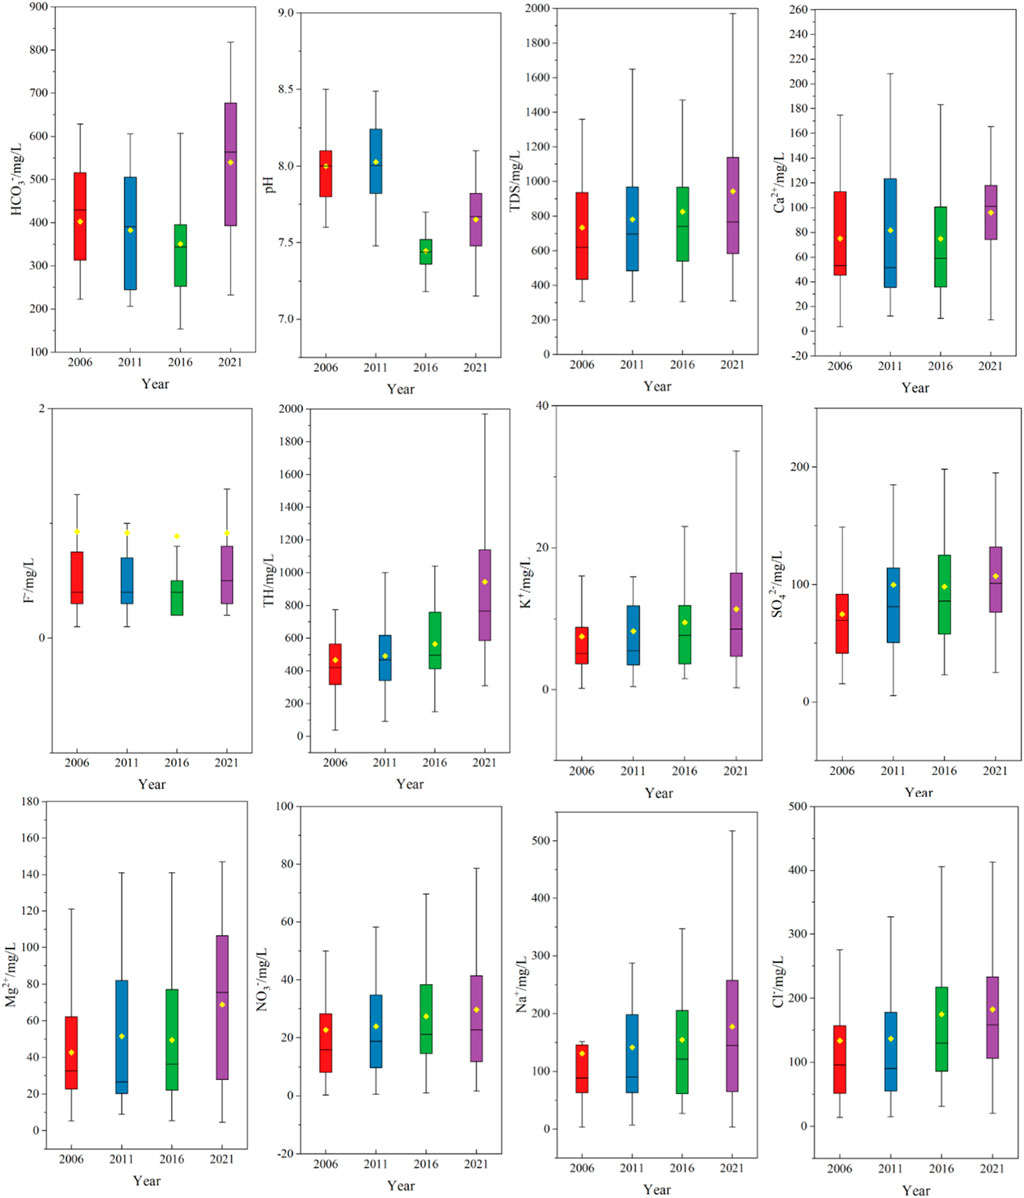
Figure 2. Distribution map of main hydrochemical characteristics of groundwater in the Weibei Plain. This diagram is represented by a box plot. Among them, the top and bottom black lines represent the maximum and minimum values, the middle black line represents the median, the upper and lower bounds of the rectangular box represent the upper and lower quartiles, and the yellow dots represent the average value (unit: mg/L).
Table 3. The limiting concentration for Class III water in the standard (Standard for groundwater quality in China) (Concentration units other than pH: mg/L).
The average concentration of NO3− was 29.68 mg/L, which far exceeded the Class III water standard (Table 3), and 25 samples exceeded the NO3− concentration limit. The high concentration of NO3− was primarily associated with human activities such as agricultural production, industrial wastewater, and domestic sewage (Adimalla and Qian, 2019; Kwon et al., 2022). The concentration of F− ranged from 0.2 to 8.9 mg/L, with an average concentration of 0.92 mg/L. A high concentration of F− was mainly observed in Gaomi City, the central parts of Hanting District, and Shouguang City. The limit concentration of Cl− in drinking water quality standards is 250 mg/L (Table 3), and the average concentration of Cl− was 182.47 mg/L, among which 8 samples exceeded the standard of Cl−. Cl− are the main ions in seawater. The most likely reason for excessive Cl− in groundwater is that seawater intrusion changes the ion concentration in groundwater. The concentration of SO42− ranged from 24.9 to 217 mg/L, which did not exceed the Class III water limit of 250 mg/L.
From 2006 to 2021, the average concentration of TH in the samples increased from 465 to 546 mg/L, while the concentration of TDS rose from 736 to 943 mg/L. The continuous increase in the average concentrations of TH and TDS is primarily attributed to the influence of saltwater intrusion in the northern region. Na+ and Cl− are the major cations and anions in seawater. As a result, coastal groundwater can have high concentrations of Na+ and Cl− due to seawater intrusion (Akshitha et al., 2021; Xu et al., 2021). The average concentration of Cl− in groundwater samples in the study area increased over the 4 years, measuring 133.56, 136.50, 174.61, and 182.47 mg/L, respectively. Similarly, the average concentration of Na+ increased over the same period, measuring 130.85, 141.75, 154.41, and 177.55 mg/L, respectively. The continual increase in the average concentrations of Na+ and Cl− indicates the persistent and escalating impact of seawater intrusion on groundwater in the study area. The severe intrusion of seawater in the study area may be attributed to the excessive extraction of regional groundwater, which has altered the groundwater flow field and hydrodynamic conditions.
The average concentration of NO3− in the samples over the 4 years was 22.68, 23.95, 27.4, and 29.68 mg/L, respectively, consistently exceeding the Class III water standard (20 mg/L) and showing an increasing trend. Studies have indicated that the concentration of NO3− is usually higher than 15 mg/L when groundwater is influenced by human activities (Chen et al., 2020; Naderi et al., 2020). Therefore, groundwater in the study area is significantly affected by human activities. The persistent elevation in the concentration of NO3− may be correlated with groundwater over-extraction and the use of fertilizers in large-scale agricultural areas (Kou et al., 2021).
The concentration order of cations and anions in groundwater of the study area were Na+ > Ca2+ > Mg2+ > K+ and Cl− > SO42- > NO3− > F−, respectively. The coefficient of variation (CV) is often used to reflect the stability of an indicator within a region (Abdul et al., 2020). The pH values over these 4 years exhibited small variations in CV and standard deviation (SD), indicating low dispersion and relatively uniform distribution. In contrast, F−, Cl−, and NO3− showed relatively high CV values, further indicating that point source pollution, diffuse pollution from agricultural or industrial activities, and saltwater intrusion are the main factors contributing to the poor stability of these indicators. Based on the analysis of these seven groundwater quality indicators, the number of samples which exceeded the standards in 2006, 2011, 2016, and 2021 was 11, 12, 16, and 22, re-spectively. The number of exceedance points in 2021 is double that of 2006, which fully demonstrates that the quality of groundwater in the study area is constantly deteriorating.
3.2 Multivariate statistical analysis
3.2.1 Principle component analysis (PCA)
To further analyze the hydrochemical data, determine the geochemical processes in the study area and the correlation of each hydrochemical ion. A total of 28 samples in the Weibei Plain area and the southern region of the study area were selected for principal component analysis. To capture temporal variations, data from both 2006 and 2021, which exhibit a significant time interval, were chosen for analysis. Table 4 shows the PCA analysis results including eigenvalues, variance percentage, cumulative variance percentage and principal component factor loading matrix. Based on Kaiser criterion and exposed to Varimax rotation with the Kaiser normalization process, factors with eigenvalues >1 were screened out as principal components. The main components in 2006 and 2021 are divided into 4, and these four factors account for 80.19% and 75.22% of the total variance of all parameters evaluated respectively.
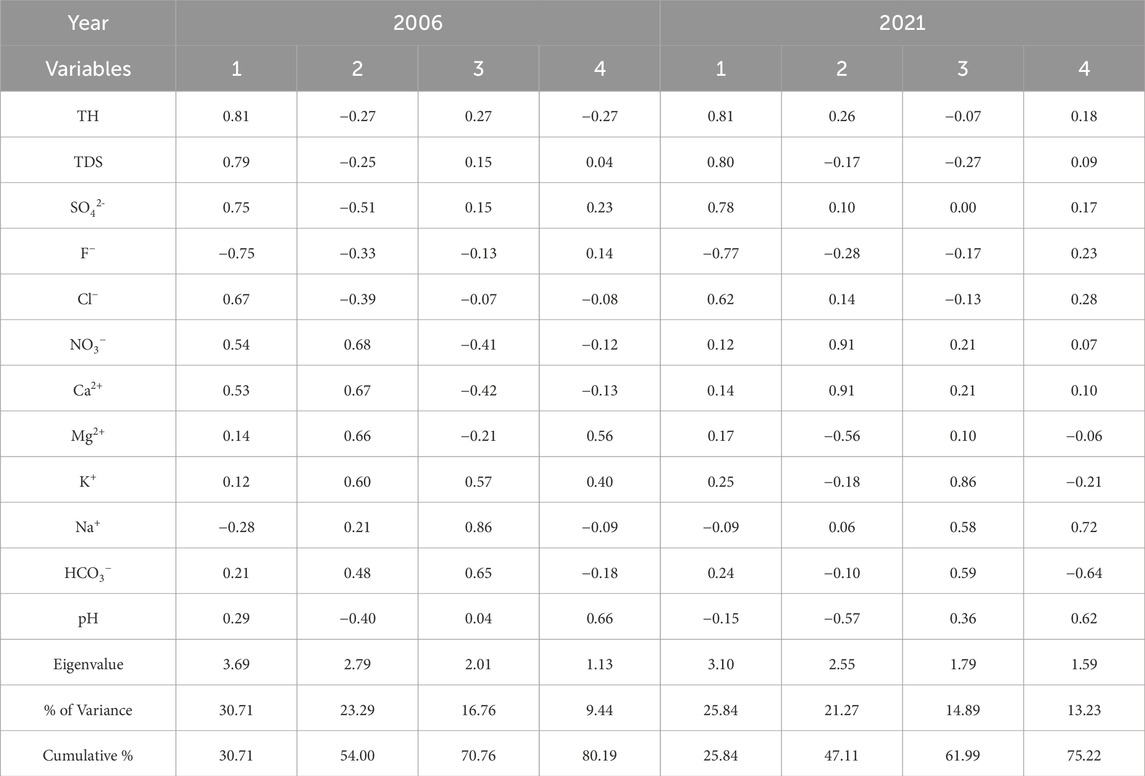
Table 4. Principal component analysis results table, including the loading matrix, eigenvalues and variance percentage of each principal component.
In 2006 and 2021, factor one explains 30.71% and 25.84% of the variance, mainly due to the high loading of TH, TDS, SO42− and Cl−. This part of the factor is mainly affected by seawater intrusion. SO42− is mainly attributed to the impact of human activities. Factor 1 occupies the largest variance, which also shows that seawater intrusion and human activities in the study area have a prominent impact on regional groundwater hydrochemistry. Factor 2 contributes 23.29% and 21.27% variance in 2006 and 2021 respectively, and shows high loading of NO3− and Ca2+. In addition, 2006 also shows high loads of K+ and Mg2+. These ions are mainly related to ion exchange and geochemical processes of rock weathering and dissolution, which are also one of the main controlling factors of regional groundwater hydrochemistry. Additionally, NO3− is also related to human agricultural activities such as the application of chemical fertilizers (Chen et al., 2020; Kou et al., 2021).
In 2006, factor three explained 16.76% of the variance and contained high loadings of Na+ and moderate loadings of K+ and HCO3−. In 2021, factor three provided 14.89% of the variance and contained high loadings of K+ and medium loadings of Na+ and HCO3−. HCO3− could give a hint on the recharge of the basin (Sunkari et al., 2021). Na+ and K+ ions also demonstrate the influence of seawater mixing into groundwater. Factor 4 contributed a variance of 9.44% and 13.33% in 2006 and 2021, respectively, and shows high loading of pH. The geochemistry of clays is greatly affected by pH, which may be related to the dissolution of clay minerals in the aquifer (Kumar et al., 2022). Moreover, K+ and Mg2+ are associated with factor 4 in 2006, while in 2021, factor four is mainly related to Na+.
3.2.2 Hierarchical cluster analysis (HCA)
Similar to PCA, HCA was used to identify groups with similar characteristics. In this study, the z-score of each variable was processed for analysis. Distances were calculated using the squared Euclidean distance method and clustering was performed using the between-groups linkage method. Since variables are classified in PCA, Q-mode classification is used to classify groundwater sampling points in HCA. The analysis results are shown in the dendrogram in Figure 3.
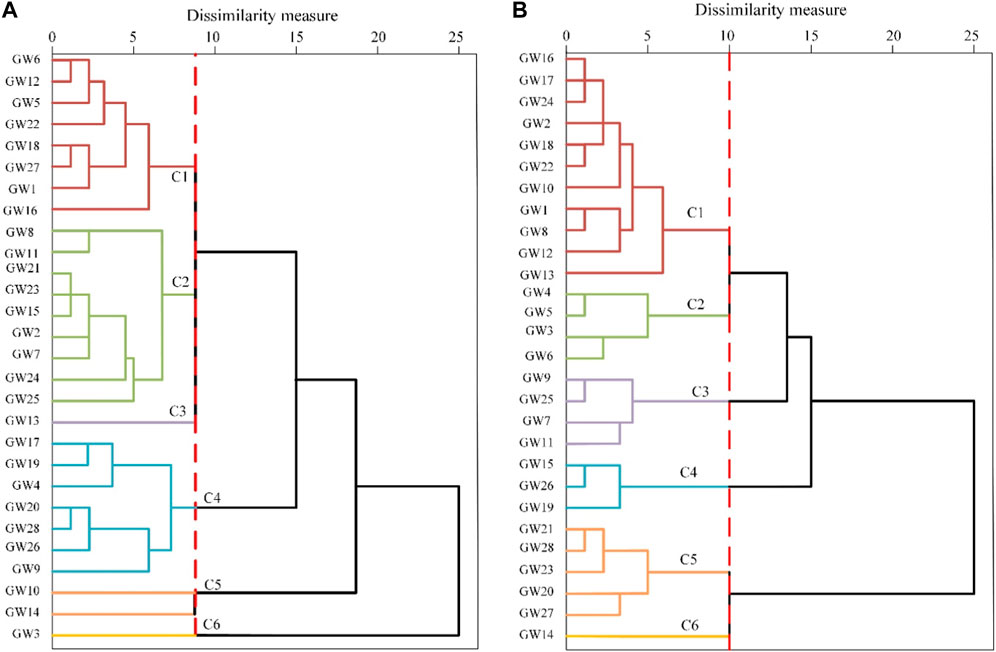
Figure 3. Dendrogram of hierarchical cluster analysis (HCA) results in 2006 (A) and 2021 (B), the red line cut the dendrogram at the desired level.
In 2006 and 2021, six clusters (C1, C2, C3, C4, C5 and C6) are obtained from PCA. In 2006, most physical and chemical indicators of samples clustered in C2 (n = 9) were the highest, followed by C1 (n = 8), C3 (n = 1), C5 (n = 2). Especially, C4 (n = 7) and C6 (n = 1) have the lowest indicator concentrations, without chemical indicators exceeding the Class III water limit. The concentrations of TH, TDS, Cl− and F− are generally higher in the C2 cluster. This may be related to the impact of seawater intrusion. In addition, the C5 (GW10, GW14) cluster also has the same characteristics, and the C5 sample is close to seawater. However, in 2021, the chemical indicators in the C1 (n = 11), C2 (n = 4) and C3 (n = 4) clusters are higher, followed by C4 (n = 3), C5 (n = 5) and C6 (n = 1) are the lowest. Moreover, C1, C2, and C3 all have higher concentrations of TH, TDS, Cl− and NO3−, and their average concentrations are much higher than in 2006. This fully reflects the adverse impact of seawater intrusion on groundwater during the past 20 years. And from a geographical point of view, all sampling points in C2 (GW3, GW4, GW5 and GW6), C3 (GW7, GW9, GW11 and GW25) and most of the sampling points in C1 are located within the scope of the groundwater depression cone areas. The concentration of F− is higher in C3 and C4 (GW15, GW19 and GW26) clusters. The sampling points in cluster C5 (GW20, GW21, GW23, GW27 and GW28) are far from the coast and are rarely or not affected by seawater intrusion. Although the C6 (GW14) cluster is close to the coast, it is also relatively close to the river, and various chemical indicators do not exceed standards.
3.3 Hydrochemical types
The water chemistry data from various monitoring wells in the study area over the 4 years were plotted on Piper diagrams (Piper, 1944), as shown in Figure 4.
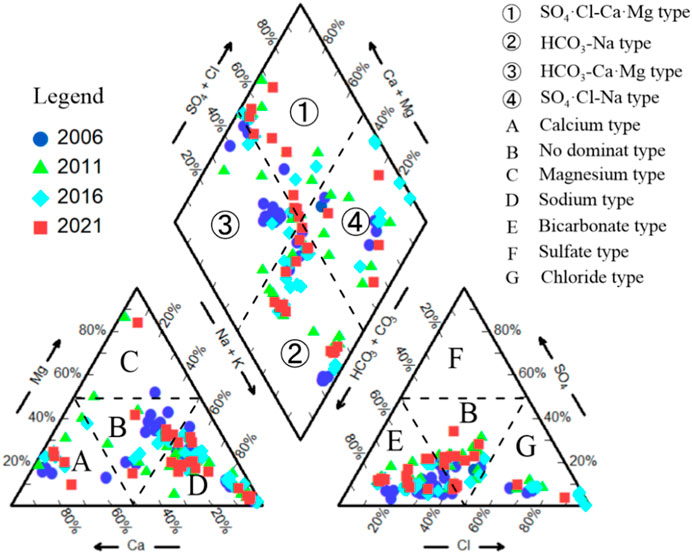
Figure 4. Piper diagram representing the chemistry of the Weibei Plain.
In the cation triangle, the groundwater samples from 2006 are primarily located in Zone B, while those from 2011, 2016, and 2021 are situated in Zone D. In the anion triangle, samples from all 4 years predominantly occupy Zone E, followed by Zone B in the middle. In 2006, the groundwater samples were concentrated in Zone ③, and the groundwater chemistry types were dominated by HCO3·Ca-Mg and HCO3-Na. In 2011, the groundwater samples were more dispersed, with the main hydrochemical types being HCO3-Na (33.33%), SO4·Cl-Na (26.66%), and SO4·Cl-Ca·Mg (26.66%). In 2016, the groundwater samples were concentrated in Zone ②, and the dominant hydrochemical type was HCO3-Na (55.88%). In 2021, the groundwater samples were concentrated in Zones ① and ②, with the primary hydrochemical types being HCO3-Na (46.43%) and SO4·Cl-Ca·Mg (42.86%).
From the classification of hydrochemical types mentioned above, it can be observed that over the 4 years from 2006 to 2021, due to saltwater intrusion caused by groundwater over-extraction, the dominant hydrochemical type in the study area shifted from HCO3·Ca-Mg to HCO3-Na and SO4·Cl-Ca·Mg. Particularly, the concentrations of Cl− and Na+ in the chemical components of groundwater increased significantly during this period.
3.4 Factors controlling groundwater chemistry
The predominant factors influencing water chemistry in the study area are rock weathering, atmospheric precipitation, and evapotranspiration. Gibbs diagrams are commonly employed for discerning the origin of groundwater chemistry (Gibbs, 1970; He et al., 2020). As illustrated in Figure 5, the distribution of groundwater samples in the study area predominantly aligns with the central region of the Gibbs diagram. This observation suggests that the hydrochemical attributes of groundwater in the Weibei Plain are primarily governed by the weathering processes of rocks. The dissolved minerals from these rocks constitute the principal source of ions in the water. All the samples were away from the precipitation dominance zone (Figure 3), this strongly suggested that atmospheric precipitation was not the predominant controlling factor for groundwater hydrochemistry over the study area. In addition, many groundwater sample sites are concentrated in the right-center region where the ratio of Na+/(Na+ + Ca2+) exceeds 0.5, which indicates that groundwater in the Weibei Plain may be affected by cation exchange (Li et al., 2016; He et al., 2020).
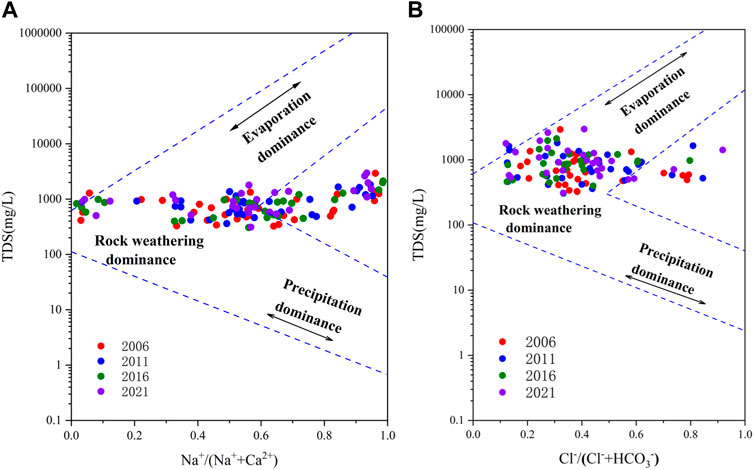
Figure 5. Gibbs diagram of Na+/(Na++Ca2+) versus TDS (A) and Cl−/(Cl−+HCO3−) versus TDS (B) of the groundwater samples in the Weibei Plain.
Gaillardet et al. (1999) constructed end-member plots of ionic ratios between Ca2+, Mg2+, Na+, and HCO3− (molar concentrations) to determine the effect of water-rock interactions on regional hydrochemical characterization for the three major rock types (silicates, carbonates, and evaporites). As shown in (a) and (b) of Figure 6, most of the groundwater samples from the Weibei Plain in this paper are distributed within the control area of silicates and evaporites. This indicates that the hydrochemistry of groundwater in the study area is mainly influenced by silicate weathering and evaporite dissolution.
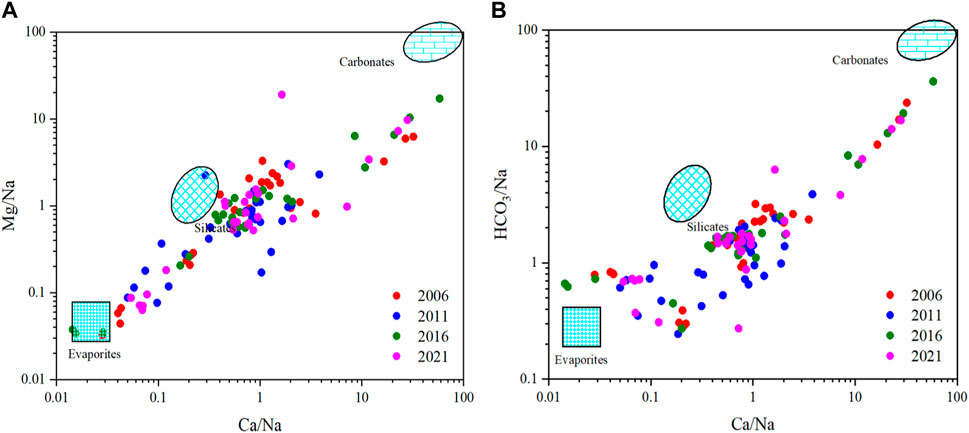
Figure 6. End-member diagram of the iron ratios among Ca/Na versus Mg/Na (A) and Ca/Na versus HCO3/Na (B) pf the groundwater samples in the Weibei Plain.
As mentioned before, ions related to human activities in groundwater include Cl−, Na+ and NO3− (Akshitha et al., 2021; Kwon et al., 2022). Figure 7 shows the scatter distribution of these ions. Figure 7A shows that most of the samples are mainly affected by urban sewage and agricultural activities. This is similar to the conclusion obtained previously. In addition, Figure 7B also reflects that some groundwater samples in the study area will be contaminated by industrial activities.
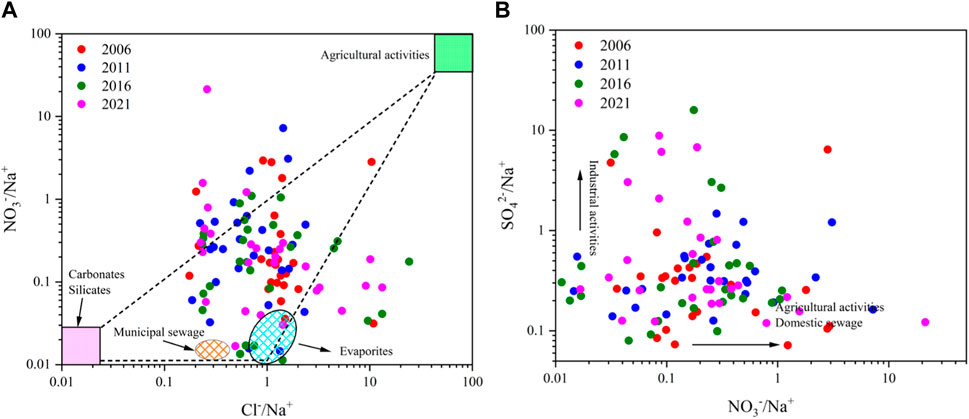
Figure 7. Scatter plot of Cl−/Na+ versus NO3−/Na+ (A) and NO3−/Na+ versus SO42-/Na+ (B) in the Weibei Plain.
3.5 Analysis of groundwater over-extraction and changes in the saltwater interface
The saltwater intrusion in the Weibei Plain is primarily attributed to groundwater over-extraction, which has led to the continual expansion of the groundwater depression cone, resulting in the southward migration of the saltwater interface (Figure 1). The most serious areas of groundwater over-extraction are located in Shouguang City, Changyi City, and Hanting District in the north of the Weibei Plain, where extensive cones of groundwater depression have formed. The extent of regional groundwater over-extraction in this paper is determined by subtracting the available groundwater for extraction from the actual amount of groundwater extracted. The groundwater flow field is interpolated from the measured data of groundwater monitoring wells (Figure 1) according to the Kriging interpolation method. This paper analyzes the over-extraction situation in these three regions from 2000 to 2021, as well as the changes in the groundwater flow field and the saltwater interface in the Weibei Plain in the years 2006, 2011, 2016, and 2021.
3.5.1 Groundwater over-extraction
Groundwater consumption in Weifang is 690 million m³ in 2021, accounting for 42% of the total water consumption in 2021. It indicates that groundwater water use is still the main water use in Weifang by 2021, and the problem of groundwater over-extraction still exists. The annual groundwater extraction and over-extraction volumes in the Shouguang City, Changyi City, and Hanting District of the Weibei Plain from 2000 to 2021 are shown in Figure 8. From 2000 to 2006, severe groundwater over-extraction in the region garnered attention from local authorities, and the amount of groundwater extraction volumes in Shouguang City, Hanting District, and Changyi City was continuously reduced from 231.20 million m³, 275.24 million m³, and 151.00 million m³ to 171.20 million m³, 86.50 million m³, and 23.40 million m³, respectively. During this period, the annual average groundwater over-extraction volumes in Shouguang City, Hanting District, and Changyi City were 97.27 million m³, 66.70 million m³, and 86.09 million m³, which indicates that groundwater over-extraction was most severe during this period, with a significant southward shift of the saltwater interface (Figure 1).
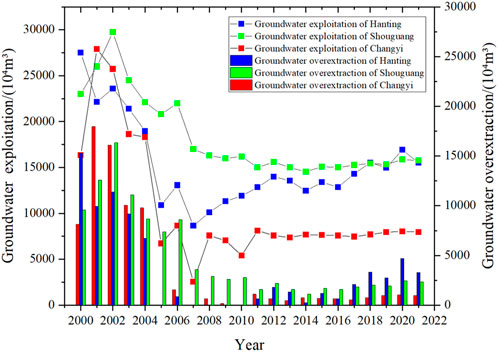
Figure 8. Groundwater exploitation and over-extraction situation from 2000 to 2021 in Weibei Plain.
From 2007 to 2011, economic and social development, as well as the expansion of vegetable farming areas in Weifang City, led to an increase in water demand. As a result, groundwater extraction volumes in Hanting District and Changyi City increased again, while Shouguang’s groundwater extraction, which was still in a state of over-extraction, decreased slightly. By 2011, the groundwater extraction volumes in Shouguang City, Hanting District, and Changyi City were 151.40 million m³, 128.50 million m³, and 75.60 million m³, respectively. During this period, the three regions had an annual average over-extraction volume of 34.66 million m³, primarily due to groundwater over-extraction in Shouguang City and Changyi City, resulting in a significant southward movement of the saltwater interface in these areas (Figure 1). In 2011, the groundwater over-extraction volumes in Shouguang City, Hanting District, and Changyi City were 15.85 million m³, 6.30 million m³, and 11.95 million m³, respectively.
From 2012 to 2021, the groundwater extraction volumes in the three regions showed a stable trend with a slight increase. By 2021, the amount of groundwater extraction in Shouguang City, Hanting District, and Changyi City reached 157.60 million m³, 155.20 million m³, and 73.50 million m³, respectively. During this period, the annual average groundwater over-extraction volumes in Shouguang City, Changyi City, and Hanting District were 18.73 million m³, 8.01 million m³, and 21.31 million m³, respectively. Over the past decade (2012–2021), the Weibei Plain region has continuously experienced groundwater over-extraction, with an increasing trend in groundwater over-extraction volumes in the past 5 years (2017–2021). In summary, the annual average groundwater over-extraction volume in the Weibei Plain region over the past decade (2012–2021) was 48.06 million m³, significantly lower than the 160.11 million m³ observed in the previous decade (2000–2011). However, the Weibei Plain region’s groundwater remains in a state of long-term over-extraction, leading to ongoing issues such as a decline in groundwater level, saltwater intrusion, and southward migration of the saltwater interface.
3.5.2 Groundwater flow field and transport at the saltwater interface
Figure 9 illustrates the changes in the groundwater flow field and the saltwater interface in Weibei Plain in 2006, 2011, 2016, and 2021, with the saltwater interface defined by a Cl− concentration of 250 mg/L as a criterion.
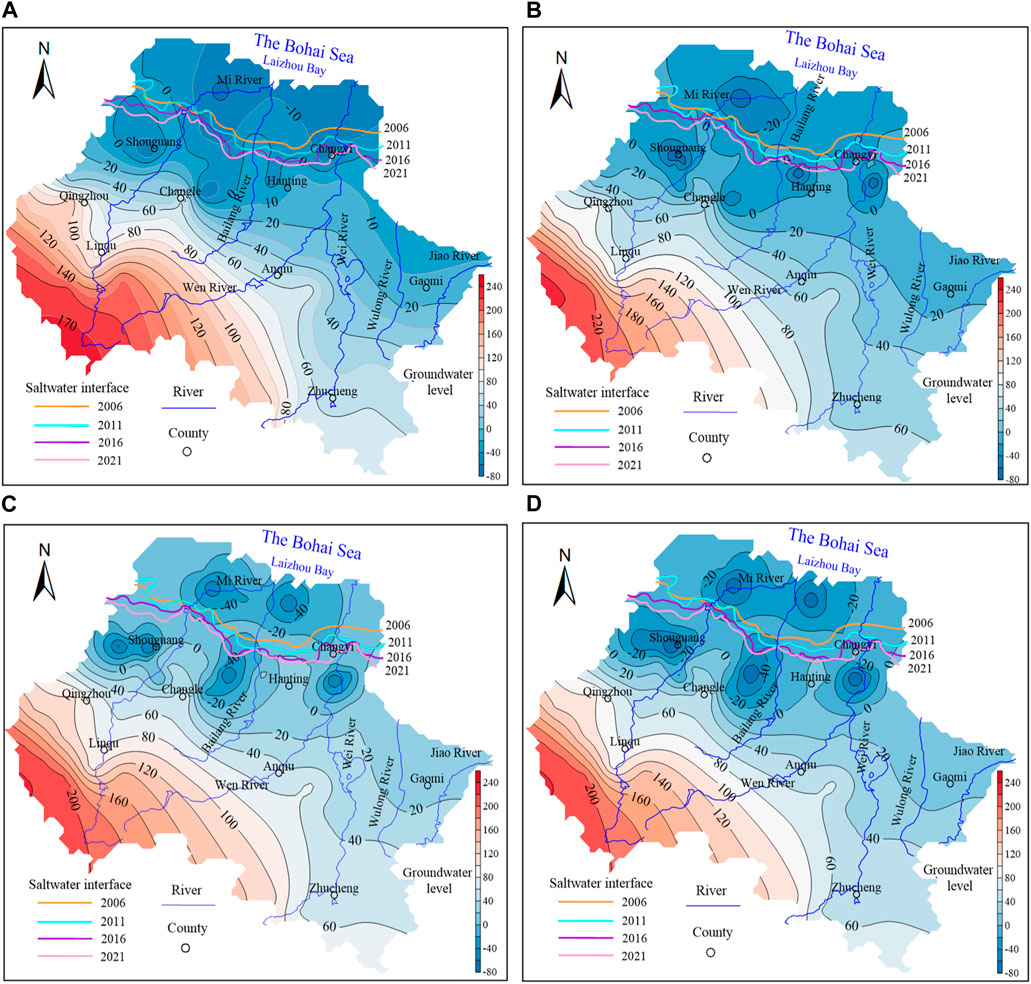
Figure 9. Changes in the groundwater flow field and saltwater interface of the study area during (A) 2006, (B) 2011, (C) 2016, and (D) 2021.
In 2006, the groundwater depression cone areas were observed in Shouguang City and Hanting District, with a groundwater level of −23 m in the center of the cone and covering an area of 3,247.37 km2. Between 2006 and 2011, the groundwater level of the center of the groundwater depression cone areas in all three regions decreased to −66 m, and the affected area expanded further. By 2011, two distinct groundwater depression cone centers appeared in Hanting District, and Changyi City started experiencing groundwater depression cone, resulting in an expanded affected area of 3,685.67 km2. From 2012 to 2016, Shouguang City developed two centers of groundwater depression cone, centers of groundwater depression cone in Hanting District became one, and the depth of the cone reached −78 m in all three regions. The affected area continued to expand, reaching 4,302.70 km2. In the period from 2017 to 2021, the center of the groundwater depression cone areas in the three regions reached a depth of −85 m, and the affected area expanded to 4,581.34 km2.
Between 2006 and 2011, the saltwater interface shifted southward by 242.46 km2. Particularly, in the areas of the Hanting District and Changyi City, the saltwater interface boundary has shifted significantly southward, with a maximum distance of 6.96 km. Between 2012 and 2016, with the intensification of groundwater over-extraction and the decline of groundwater level, the interface between saline and freshwater continued to shift southward, covering an additional area of 273.28 km2. Finally, from 2017 to 2021, the interface shifted southward by 195.97 km2.
Figure 9 reflects a consistent decline in groundwater levels across the Weibei Plain region from 2006 to 2021. The affected area of the groundwater depression cone continuously expanded, and the center of the groundwater depression cone areas continued to lower. This indicates that although groundwater over-extraction in the Weibei Plain region has decreased over the past 15 years and maintained a stable trend, there still exists a considerable groundwater over-extraction issue by 2021. This persistent over-extraction has led to prominent groundwater level declines. Moreover, as groundwater levels continue to decrease in the Weibei Plain region, the saltwater interface continues to shift southward. The northern part of the study area experiences ongoing intrusion of saltwater into shallow groundwater, resulting in significant alterations in the regional groundwater chemical composition.
3.6 Analysis of inter-annual variability in water quality
The EWQI values for the 46 monitoring wells in the study area are shown in Figure 10. In 2021, the EWQI values ranged from 37.64 to 259.02, with an average EWQI of 101.26. According to the groundwater quality classification criteria used in this study (Table 1), in 2021, 8.70%, 43.48%, 41.30%, and 6.52% of the samples were classified as Class II, Class III, Class IV, and Class V water, respectively. Among them, Class III water was mainly distributed in Anqiu County, Shouguang City, Qingzhou City, and the northern part of Jingle County, while Class IV water was primarily found in Hanting District, and Class V water was distributed in Changyi City and Gaomi City. This indicates that in 2021, the groundwater quality in most areas of Weibei Plain was relatively poor, and the groundwater quality in the northern part of the Weibei Plain region was worse than that in the southern areas (Figure 10).
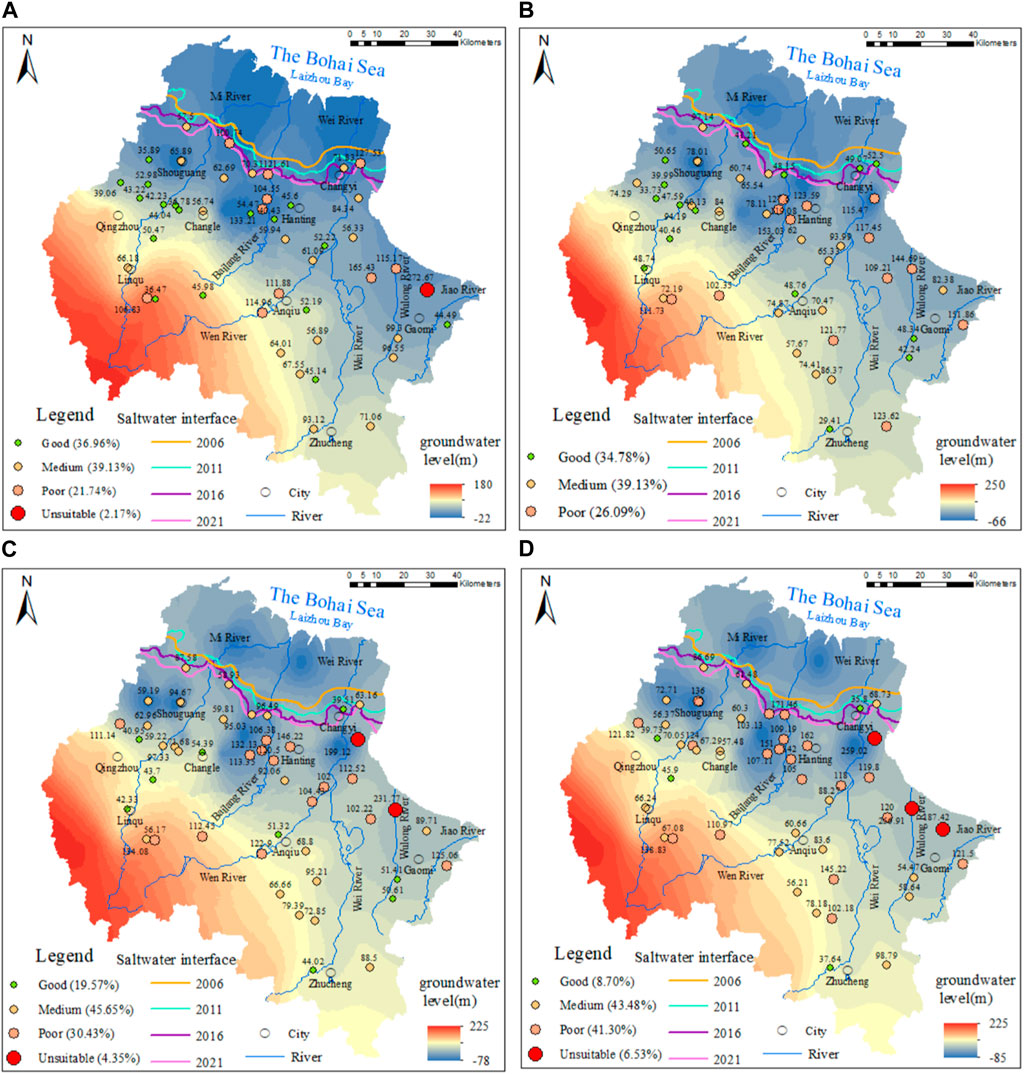
Figure 10. The results of the water quality assessment of groundwater in the study area during (A) 2006, (B) 2011, (C) 2016, and (D) 2021.
Figure 10 shows the spatiotemporal distribution of water quality evaluation results in the years 2006, 2011, 2016, and 2021. The distribution of EWQI values generally shows a trend of larger in the northern parts and smaller in the southern parts, with larger values in the eastern parts and smaller values in the western parts, which is primarily due to the severe groundwater over-extraction and proximity to the coastline in the northern areas of the Weibei Plain, while the southern regions experience minimal over-extraction, and the southward intrusion distance of the saltwater interface decreases from east to west. In addition, from the perspective of various chemical indicators, the concentrations of TH, TDS and Cl− in the northern region are significantly higher than those in the southern region. This shows that seawater intrusion has a greater impact on the northern region.
Eight samples, GW1, GW2, GW3, GW8, GW9, GW11, GW16, and GW17, are located in the groundwater depression cone areas in the Weibei Plain. Their average EWQI values over the 4 years were 71.56, 100.25, 126.21, and 148.79, which indicates a gradual deterioration in groundwater quality in the cone of depression areas. As analyzed in the previous sections regarding the groundwater flow field and the movement of the saltwater interface, this deterioration is primarily due to the southward shift of the saltwater interface caused by groundwater over-extraction. This shift results in saltwater intrusion into the shallow groundwater of the northern cone of groundwater depression areas, leading to the progressive deterioration of groundwater quality. For instance, GW1, located in the center area of the cone of groundwater depression in Hanting District, had an EWQI value that increased from 54.47 in 2006 to 151.00 in 2021. In 2006, the concentrations of TH, TDS, Cl−, and NO3− in this well were 401, 476, 101, and 8.06 mg/L, respectively, none of which exceeded the Class III water standard. However, by 2021, these concentrations had increased to 633, 1,270, 298, and 56.2 mg/L, respectively, exceeding Class III water standards, with NO3− exceeding Class IV standards. The increasing concentrations of Cl−, Na+, and TDS indicate that the extensive groundwater depression cone caused by groundwater over-extraction has directly led to the intrusion of saltwater into the freshwater zone in the northern part (Wang et al., 2020; Yang et al., 2021), while the increasing concentration of NO3− suggests a growing impact from activities such as widespread vegetable cultivation and agricultural fertilizer usage (Liu et al., 2020; Liu C. M. et al., 2021).
The southern part of the study area contains 15 samples. Their average EWQI values over the 4 years were 72.87, 75.71, 78.97, and 84.64, which show a continuous increase but remain below Class III water standards. This indicates relatively good groundwater quality in most areas of the southern region. For example, GW43 had EWQI values of 67.55, 74.40, 79.38, and 78.18 over the 4 years, which were all within Class III water standards. However, the concentrations of TH and NO3− in this well increased from 503 and 8.06 mg/L in 2006 to 548 and 43.6 mg/L in 2021, respectively, exceeding Class III water standards. This suggests that certain areas in the southern region are still affected by saltwater intrusion and human activities.
The eastern region of Weibei Plain consists of five samples with average EWQI values of 125.63, 93.90, 109.71, and 135.79 over the 4 years, which show very poor groundwater quality. For instance, GW25 had EWQI values of 115.17, 144.69, 231.77, and 256.91 over the 4 years, with deteriorating groundwater quality changing from Class IV to Class V. In this well’s groundwater quality indicators, except for concentrations of TH, TDS, and NO3−, which still exceeded the standards, the concentration of F− ranged from 7.5, 4.5, 4.2, to 3.5 mg/L over the 4 years. These values significantly exceed the Class IV water standard of 2 mg/L. The high fluoride ion concentration in groundwater in Gaomi City is mainly associated with the dissolution of fluorine minerals in the aquifer and human activities such as infiltration of industrial wastewater and the use of phosphate fertilizers in agriculture (Liu et al., 2022).
The western part of the study area contained seven samples with average EWQI values of 42.94, 46.69, 64.11, and 67.69 over the 4 years, which changed from Class II to Class III water, indicating the best groundwater quality in Weibei Plain. For example, GW30 had EWQI values of 39.06, 74.29, 111.14, and 121.81 over the 4 years, making it the poorest sample in terms of water quality in the western part of the study area. The characteristics of changes in various groundwater quality indicators in this well are similar to those in the southern region, with concentrations of TH and NO3− exceeding standards.
4 Conclusion
This study employed the customized entropy-weighted water quality index (EWQI) method and multivariate statistical analysis to evaluate and analyze the groundwater quality and hydrochemistry of groundwater in the Weibei Plain affected by seawater intrusion. The analysis focused on typical 4-year periods, investigating the groundwater flow field, variations in the saltwater interface, and groundwater hydrochemical types. This study can provide a certain basis for the development, utilization, and scientific management of groundwater resources. The study has resulted in the following conclusions:
(1) Among the 46 sampled locations in this study, the number of samples exceeding water quality standards in 2006, 2011, 2016, and 2021 were 11, 12, 16, and 22, respectively. The predominant hydrochemical types observed over the 4 years included HCO3·Ca-Mg, HCO3-Na and SO4·Cl-Na, HCO3-Na, HCO3-Na and SO4·Cl-Ca·Mg. The dominant hydrochemical type shifted from HCO3·Ca-Mg to HCO3-Na and SO4·Cl-Ca·Mg. The ion ratio diagram shows the hydrochemical characteristics of the groundwater in the Weibei Plain are mainly controlled by the weathering of the rocks, the minerals in the rocks that are dissolved in the water are the main source of the ions. PCA and HCA reveal that seawater intrusion has a certain impact on regional groundwater hydrochemistry. Human activities and mineral dissolution also regulate groundwater hydrochemistry.
(2) Groundwater over-extraction in the study area was substantial before 2006, with an annual average over-extraction of 28,068 million m³. However, it gradually decreased thereafter, with an average of 6,266 million m³ over the recent 5 years (2017–2021). Over-extraction remains a significant concern. Prolonged groundwater over-extraction resulted in extensive groundwater drawdown cones and saltwater intrusion. From 2006 to 2021, the drawdown cone area in the northern part of the study area increased from 3,247. to 4,581.34 km2, with the center water level dropping from −22 m to −85 m. The saltwater interface advanced southward by 711.71 km2 during this period.
(3) Concentrations of the TH, TDS, Cl−, and NO3− in the groundwater depression cone areas in the northern part of the study area gradually exceeded standards after 2011. In the southern region, most groundwater sample locations exceeded standards in TH and NO3−. In the eastern region, Gaomi City had several water sample locations that exceeded standards in the aforementioned indicators, along with the concentration of F− exceeding standards.
(4) The average EWQI values over these 4 years were 76.03, 77.52, 89.35, and 101.36, respectively. Overall, groundwater quality in the study area deteriorated gradually from 2006 to 2021, with the southward movement of the saltwater interface being the primary reason for this deterioration. Regarding spatial distribution, the EWQI values exhibited the following pattern: northern region > eastern region > southern region > western region, with the most compromised groundwater quality identified in the groundwater depression cone areas in the northern part and the most favorable quality in Qingzhou City in the western part.
This research revealed that the hydrochemical formation mechanisms of shallow groundwater in coastal over-extraction areas are determined by the combined effects of seawater intrusion and rock-water interactions (such as ion exchange processes and mineral dissolution). The process of seawater intrusion is identified as the primary factor altering the hydrochemical types of shallow groundwater in coastal over-extraction areas, with human activities exerting a significant influence on the shallow aquifer. The persistent decline in groundwater levels in the funnel zone due to continuous groundwater over-extraction is identified as the direct cause of seawater intrusion. Seawater intrusion has the most substantial impact on three key indicators in coastal shallow aquifer groundwater, namely, TH, TDS, and Cl−.
Data availability statement
The original contributions presented in the study are included in the article/Supplementary Material, further inquiries can be directed to the corresponding author.
Ethics statement
Written informed consent was obtained from the individual(s) for the publication of any potentially identifiable images or data included in this article.
Author contributions
WC: Writing–original draft, Writing–review and editing. CW: Conceptualization, Methodology, Writing–review and editing. SP: Methodology, Writing–review and editing. LS: Data curation, Writing–review and editing.
Funding
The author(s) declare that financial support was received for the research, authorship, and/or publication of this article. This research was supported by the National Key Research and Development Program of China (No. 2021YFC3000205), Independent Research Project of the State Key Laboratory of the Simulation and Regulation of the Water Cycle in River Basins (SKL2022ZD02), and Key R&D Program of Heilongjiang Province (JD22B001).
Conflict of interest
The authors declare that the research was conducted in the absence of any commercial or financial relationships that could be construed as a potential conflict of interest.
Publisher’s note
All claims expressed in this article are solely those of the authors and do not necessarily represent those of their affiliated organizations, or those of the publisher, the editors and the reviewers. Any product that may be evaluated in this article, or claim that may be made by its manufacturer, is not guaranteed or endorsed by the publisher.
Supplementary material
The Supplementary Material for this article can be found online at: https://www.frontiersin.org/articles/10.3389/feart.2024.1391235/full#supplementary-material
References
Abdul, W. D., Adomako, D., Abass, G., Adotey, D. K., Anornu, G., and Ganyaglo, S. (2020). Hydrogeochemical and isotopic assessment for characterizing groundwater quality and recharge processes in the Lower Anayari catchment of the Upper East Region, Ghana. Environ. Dev. Sustain 23, 5297–5315. doi:10.1007/s10668-020-00815-w
Abu-Alnaeem, M. F., Yusoff, I., Ng, T. F., Alias, Y., and Raksmey, M. (2018). Assessment of groundwater salinity and quality in Gaza coastal aquifer, Gaza Strip, Palestine: an integrated statistical, geostatistical and hydrogeochemical approaches study. Sci. Total Environ. 615, 972–989. doi:10.1016/j.scitotenv.2017.09.320
Adimalla, N., and Qian, H. (2019). Groundwater quality evaluation using water quality index (WQI) for drinking purposes and human health risk (HHR) assessment in an agricultural region of Nanganur, south India. Ecotoxicol. Environ. Saf. 176, 153–161. doi:10.1016/j.ecoenv.2019.03.066
Akshitha, V., Balakrishna, K., and Udayashankar, H. N. (2021). Assessment of hydrogeochemical characteristics and saltwater intru-sion in selected coastal aquifers of southwestern India. Mar. Pollut. Bull. 173, 112989. doi:10.1016/j.marpolbul.2021.112989
Alfarrah, N., and Walraevens, K. (2018). Groundwater overexploitation and seawater intrusion in coastal areas of arid and semi-arid regions. Water 10, 143. doi:10.3390/w10020143
Bahir, M., Ouhamdouch, S., and Carreira, P. M. (2018). Geochemical and isotopic approach to decrypt the groundwater salinization origin of coastal aquifers from semi-arid areas (Essaouira basin, Western Morocco). Environ. Earth Sci. 77, 485. doi:10.1007/s12665-018-7663-4
Bhakar, P., and Singh, A. P. (2019). Groundwater quality assessment in a hyper-arid region of Rajasthan, India. Nat. Resour. Res. 28, 505–522. doi:10.1007/s11053-018-9405-4
Chen, G. Q., Xiong, G. Y., Lin, J., Xu, X. Y., Yu, H. J., Liu, W. Q., et al. (2021). Elucidating the pollution sources and groundwater evolution in typical seawater intrusion areas using hy-drochemical and environmental stable isotope technique: a case study for Shandong Province, China. Lithosphere 2021 (3), 4227303. doi:10.2113/2021/4227303
Chen, Q., Jia, C., Wei, J., Dong, F., Yang, W., Hao, D., et al. (2020). Geochemical process of groundwater fluoride evolution along global coastal plains: evidence from the comparison in seawater intrusion area and soil salinization area. Chem. Geol. 552, 119779. doi:10.1016/j.chemgeo.2020.119779
Condon, L. E., Kollet, S., Bierkens, M. F. P., Fogg, G. E., Maxwell, R. M., Hill, M. C., et al. (2021). Global groundwater modeling and monitoring: opportunities and challenges. Water Resour. Res. 57, 1–27. doi:10.1029/2020WR029500
Costall, A. R., Harris, B. D., Teo, B., Schaa, R., Wagner, F. M., and Pigois, J. P. (2020). Groundwater throughflow and seawater intrusion in high quality coastal aquifers. Sci. Rep. 10, 9866. doi:10.1038/s41598-020-66516-6
Cuthbert, M. O., Gleeson, T., Moosdorf, N., Befus, K. M., Schneider, A., Hartmann, J., et al. (2019). Global patterns and dynamics of climate–groundwater interactions. Nat. Clim. Chang. 9, 137–141. doi:10.1038/s41558-018-0386-4
Elumalai, V., Nethononda, V. G., Manivannan, V., Rajmohan, N., Li, P., and Elango, L. (2020). Groundwater quality assessment and application of multivariate statistical analysis in Luvuvhu catchment, Limpopo, South Africa. J. Afr. Earth Sci. 171, 103967. doi:10.1016/j.jafrearsci.2020.103967
Ez-zaouy, Y., Bouchaou, L., Saad, A., Hssaisoune, M., Brouziyne, Y., Dhiba, D., et al. (2021). Morocco’s coastal aquifers: recent observations, evolution and perspectives towards sustainability. Environ. Pollut. 293, 118498. doi:10.1016/j.envpol.2021.118498
Famiglietti, J. (2014). The global groundwater crisis. Nat. Clim. Change 4, 945–948. doi:10.1038/nclimate2425
Gaillardet, J., Dupre, B., Louvat, P., and All egre, C. J. (1999). Global silicate weathering and CO2 consumption rates deduced from the chemistry of large rivers. Chem. Geol. 159 (1), 3–30. doi:10.1016/s0009-2541(99)00031-5
Gibbs, R. J. (1970). Mechanisms controlling world water chemistry. Science 170, 1088–1090. doi:10.1126/science.170.3962.1088
He, Z. K., Han, D. M., Song, X. F., and Yang, S. T. (2020). Impact of human activities on coastal groundwater pollution in the Yang-Dai River plain, northern China. Environ. Sci. Pollut. Res. 27, 37592–37613. doi:10.1007/s11356-020-09760-7
Hu, X. J., Ma, C. M., Qi, H. H., and Guo, X. (2018). Groundwater vulnerability assessment using the GALDIT model and the improved DRASTIC model: a case in Weibei Plain, China. Environ. Sci. Pollut. Res. 25, 32524–32539. doi:10.1007/s11356-018-3196-3
Huang, F., Wang, G. H., Yang, Y. Y., and Wang, C. B. (2014). Overexploitation status of groundwater and induced geological hazards in China. Nat. Hazards 73, 727–741. doi:10.1007/s11069-014-1102-y
Jiao, Y. F., Liu, J., Li, C. Z., Qiu, Q. T., Yu, X. Z., Wang, W., et al. (2020). Regulation storage calculation and capacity evaluation of the underground reservoir in the groundwater overdraft area of northern China. Environ. Earth Sci. 79, 18(1). doi:10.1007/s12665-019-8725-y
Kou, X. Y., Ding, J. J., Li, Y. Z., Li, Q. Z., Mao, L. L., Xu, C. Y., et al. (2021). Tracing nitrate sources in the groundwater of an intensive agricultural region. Agric. Water Manag. 250, 106826. doi:10.1016/j.agwat.2021.106826
Kumar, P., Biswas, A., Banerjee, S., Rathore, S., Rana, V., Ram, K., et al. (2022). Integrating magnetic susceptibility, hydrogeochemical, and isotopic data to assess the seawater invasion in coastal aquifers of Digha, West Bengal, India. Environ. Sci. Pollut. Res. 29, 23474–23503. doi:10.1007/s11356-021-16934-4
Kwon, E., Park, J., Park, W. B., Kang, B. R., Hyeon, B. S., and Woo, N. C. (2022). Nitrate vulnerability of groundwater in jeju volcanic island, korea[J]. Sci. Total Environ. 807, 151399. doi:10.1016/j.scitotenv.2021.151399
Li, P. Y., Wu, J. H., and Qian, H. (2016). Hydrochemical appraisal of groundwater quality for drinking and irrigation purposes and the major influencing factors: a case study in and around Hua County, China. Arab. J. Geosci. 9, 15. doi:10.1007/s12517-015-2059-1
Liu, B. J., Peng, S. H., Liao, Y. Y., and Long, W. L. (2018). The causes and impacts of water resources crises in the Pearl River Delta. Clean. Prod. 177, 413–425. doi:10.1016/j.jclepro.2017.12.203
Liu, C. M., Yu, J. J., and Eloise, K. (2021b). Groundwater exploitation and its impact on the environment in the north China plain. Water Int. 26 (2), 265–272. doi:10.1080/02508060108686913
Liu, J. T., Gao, Z. J., Zhang, Y. Q., Sun, Z. B., Sun, T. Z., Fan, H. B., et al. (2021c). Hydrochemical evaluation of groundwater quality and human health risk assessment of nitrate in the largest peninsula of China based on high-density sampling: a case study of Weifang. J. Clean. Prod. 322, 129164. doi:10.1016/j.jclepro.2021.129164
Liu, J. T., Ma, Y. Y., Gao, Z. J., Zhang, Y. Q., Sun, Z. B., Sun, T. Z., et al. (2022). Fluoride contamina-tion, spatial variation, and health risk assessment of groundwater using GIS: a high-density survey sampling in Weifang City, North China. Environ. Sci. Pollut. Res. 29, 34302–34313. doi:10.1007/s11356-021-18443-w
Liu, J. T., Peng, Y. M., Li, C. S., Gao, Z. J., and Chen, S. J. (2021a). Characterization of the hydrochemistry of water resources of the Weibei Plain, Northern China, as well as an assessment of the risk of high groundwater nitrate levels to human health. Environ. Pollut. 268, 115947. doi:10.1016/j.envpol.2020.115947
Lyu, M., Pang, Z. H., Huang, T. M., and Yin, L. H. (2019). Hydrogeochemical evolution and groundwater quality assessment in the dake lake basin, northwest China. Radioanal. Nucl. Chem. 320, 865–883. doi:10.1007/s10967-019-06515-8
Ma, F. Y., Chen, J. S., Zhan, L. C., Wang, T., Yan, J. H., and Zhang, X. (2022). Coastal upward discharge of deep basalt groundwater through developed faults: a case study of the Subei Basin, China. J. Environ. Manage. 306, 114469. doi:10.1016/j.jenvman.2022.114469
Ma, J., Zhou, Z. F., Guo, Q. N., Zhu, S. M., Dai, Y. F., and Shen, Q. (2019). Spatial characterization of seawater intrusion in a coastal aqui-fer of northeast liaodong Bay, China. Sustainability 11, 7013. doi:10.3390/su11247013
Naderi, M., Jahanshahi, R., and Dehbandi, R. (2020). Two distinct mechanisms of fluoride enrichment and associated health risk in springs’ water near an inactive volcano, southeast Iran. Ecotoxicol. Environ. Saf. 195, 110503. doi:10.1016/j.ecoenv.2020.110503
Piper, A. M. (1944). A graphic procedure in the geochemical interpretation of wateranalyses. Eos, Trans. Am. Geophys. Un-ion 25 (6), 914–928.
Qi, H., Ma, C., He, Z., Hu, X., and Gao, L. (2019). Lithium and its isotopes as tracers of groundwater salinization: a study in the southern coastal plain of Laizhou Bay, China. China. Sci. Total Environ. 650, 878–890. doi:10.1016/j.scitotenv.2018.09.122
Saha, S., Reza, A. H. M., and Roy, M. K. (2019). Hydrochemical evaluation of groundwater quality of the Tista floodplain, Rangpur, Bangladesh. Appl. Water Sci. 9 (8), 198–212. doi:10.1007/s13201-019-1085-7
Saleh, A., Gad, A., Ahmed, A., Arman, H., and Farhat, H. I. (2023). Groundwater hydrochemical characteristics and water quality in Egypt’s central eastern desert. Water 15, 971. doi:10.3390/w15050971
Shah, Y., Bhimani, S., Thacker, H., Borah, A. J., Jadeja, Y., Thakkar, M., et al. (2022). Spatial variations and trend analysis of groundwater salinity along coastal aquifers of Mundra-Kachchh over a decade—using thematic maps and GIS mapping. Appl. Water Sci. 12, 243. doi:10.1007/s13201-022-01760-x
Shang, Y., You, B., and Shang, L. (2016). China’s environmental strategy towards reducing deep groundwater exploitation. Environ. Earth Sci. 75, 1439. doi:10.1007/s12665-016-6110-7
Standard for groundwater quality in China (2024). Standard for groundwater quality in China. GB/T 14848-2017.
Sunkari, E. D., Abu, M., and Zango, M. S. (2021). Geochemical evolution and tracing of groundwater salinization using different ionic ratios, multivariate statistical and geochemical modeling approaches in a typical semi-arid basin. J. Contam. Hydrol. 236, 103742. doi:10.1016/j.jconhyd.2020.103742
Tajwar, M., Uddin, A., Lee, M.-K., Nelson, J., Zahid, A., and Sakib, N. (2023). Hydrochemical characterization and quality assessment of groundwater in hatiya island, southeastern coastal region of Bangladesh. Water 15, 905. doi:10.3390/w15050905
Tran, D. A., Tsujimura, M., Vo, L. P., Nguyen, V. T., Kambuku, D., and Dang, T. D. (2020). Hydrogeochemical characteristics of a multi-layered coastal aquifer system in the Mekong Delta, Vietnam. Environ. Geochem. Health 42 (2), 661–680. doi:10.1007/s10653-019-00400-9
Wang, Y., Zheng, C., and Ma, R. (2018). Review: safe and sustainable groundwater supply in China. Hydrogeol. J. 26, 1301–1324. doi:10.1007/s10040-018-1795-1
Wang, Z. Y., Wang, S., Liu, W. Y., Su, Q., Tong, H., Xu, X. T., et al. (2020). Hydrochemical characteristics and irrigation suitability evaluation of groundwater with different degrees of seawater intrusion. Water 12, 3460. doi:10.3390/w12123460
Wen, Y., Qiu, J., Cheng, S., Xu, C., and Gao, X. (2020). Hydrochemical evolution mechanisms of shallow groundwater and its quality assessment in the estuarine coastal zone: a case study of qidong, China. Int. J. Environ. Res. Public Health. 17, 3382. doi:10.3390/ijerph17103382
Wu, C., Wu, X., Qian, C., and Zhu, G. (2018). Hydrogeochemistry and groundwater quality assessment of high fluoride levels in the Yanchi endorheic region, northwest China. Appl. Geochem. 98, 404–417. doi:10.1016/j.apgeochem.2018.10.016
Xia, C., Liu, G., Meng, Y., and Jiang, F. (2022). Reveal the threat of water quality risks in Yellow River Delta based on evidences from isotopic and hydrochemical analyses. Mar. Pollut. Bull. 177, 113532. doi:10.1016/j.marpolbul.2022.113532
Xiong, G. Y., An, Q. X., Fu, T. F., Chen, G. Q., and Xu, X. Y. (2020). Evolution analysis and environmental management of intruded aqui-fers of the Dagu River Basin of China. Sci. Total Environ. 719, 137260. doi:10.1016/j.scitotenv.2020.137260
Xu, X. Y., Xiong, G. Y., Chen, G. Q., Fu, T. F., Yu, H. J., Wu, J. C., et al. (2021). Characteristics of coastal aquifer contamination by seawater intrusion and anthropogenic activities in the coastal areas of the Bohai Sea, eastern China. Asian Earth Sci. 217, 104830. doi:10.1016/j.jseaes.2021.104830
Yang, F., Liu, S., Jia, C., Gao, M. S., Chang, W. B., and Wang, Y. J. (2021). Hydrochemical characteristics and functions of groundwater in southern Laizhou Bay based on the multivariate statistical analysis approach. Estuar. Coast. Shelf Sci. 250, 107153. doi:10.1016/j.ecss.2020.107153
Keywords: seawater intrusion, groundwater over-extraction, water quality, hydrochemistry, spatiotemporal evolutions
Citation: Chen W, Wu C, Pan S and Shi L (2024) Analysis on the spatiotemporal evolutions of groundwater hydrochemistry and water quality caused by over-extraction and seawater intrusion in eastern coastal China. Front. Earth Sci. 12:1391235. doi: 10.3389/feart.2024.1391235
Received: 25 February 2024; Accepted: 27 March 2024;
Published: 16 April 2024.
Edited by:
Ke Zhang, Hohai University, ChinaReviewed by:
Wenbin Mu, North China University of Water Conservancy and Electric Power, ChinaArkoprovo Biswas, Banaras Hindu University, India
Guoqing Wang, Nanjing Hydraulic Research Institute, China
Copyright © 2024 Chen, Wu, Pan and Shi. This is an open-access article distributed under the terms of the Creative Commons Attribution License (CC BY). The use, distribution or reproduction in other forums is permitted, provided the original author(s) and the copyright owner(s) are credited and that the original publication in this journal is cited, in accordance with accepted academic practice. No use, distribution or reproduction is permitted which does not comply with these terms.
*Correspondence: Chu Wu, wuchu@iwhr.com