A seasonal snowpack model forced with dynamically downscaled forcing data resolves hydrologically relevant accumulation patterns
 Justine Berg
 Dylan Reynolds
 Louis Quéno
 Tobias Jonas2
  Michael Lehning
 Rebecca Mott
- 1Institute of Geography and Oeschger Centre for Climate Change Research, University of Bern, Bern, Switzerland
- 2WSL, Swiss Federal Institute for Snow and Avalanche Research, SLF, Davos, Switzerland
- 3Laboratory of Cryospheric Sciences, School of Architecture, Civil and Environmental Engineering, École Polytechnique Fédérale de Lausanne, Lausanne, Switzerland
The Mountain snowpack stores months of winter precipitation at high elevations, supplying snowmelt to lowland areas in drier seasons for agriculture and human consumption worldwide. Accurate seasonal predictions of the snowpack are thus of great importance, but such forecasts suffer from major challenges such as resolving interactions between forcing variables at high spatial resolutions. To test novel approaches to resolve these processes, seasonal snowpack simulations are run at different grid resolutions (50 m, 100 m, 250 m) and with variable forcing data for the water year 2016/2017. COSMO-1E data is either dynamically downscaled with the High-resolution Intermediate Complexity Atmospheric Research (HICAR) model or statistically downscaled to provide forcing data for snowpack simulations with the Flexible Snowpack Model (FSM2oshd). Simulations covering complex terrain in the Swiss Alps are carried out with the operational settings of the FSM2oshd model or with a model extension including wind- and gravitational-induced snow transport (FSM2trans). The simulated snow height is evaluated against observed snow height collected during LiDAR flights in spring 2017. Observed spatial snow accumulation patterns and snow height distribution are best matched with simulations using dynamically downscaled data and the FSM2trans model extension, indicating the importance of both accurate meteorological forcing data and snow transport schemes. This study demonstrates for the first time the effects of applying dynamical downscaling schemes to snowpack simulations at the seasonal and catchment scale.
1 Introduction
Approximately one-sixth of the world’s population relies on water from spring snowmelt for agriculture and human consumption (Barnett et al., 2005), highlighting the importance of snow as a temporary water storage worldwide (Ragettli et al., 2015). Snow serves as a major water resource in drier seasons to lowland areas for regional ecosystems, groundwater recharge, human consumption, agriculture as well as hydro power (Viviroli et al., 2011). With both magnitude and intensity of winter snowfall events decreasing (Hanzer et al., 2018), snow covered area is declining globally due to climate change (Sturm et al., 2017). The runoff regimes in snow and ice dominated catchments will show increased winter flow and decreased summer runoff in the future (e.g., Barnett et al., 2005; Horton et al., 2006), which may lead to a water shortage in downstream catchments (Arnoux et al., 2020). In order to understand these expected changes and their impact on water availability as well as extreme events, an accurate forecast of the winter snowpack is essential.
Snowpacks in mountain areas exhibit a high spatial variability (Schirmer et al., 2011; Freudiger et al., 2017). The complex interaction between precipitation, wind, and topography, acting at various temporal and spatial scales, results in the heterogeneous snow distribution found in alpine terrain (Clark et al., 2011; Gerber et al., 2017; Mott et al., 2018). There are three primary processes governing snow accumulation patterns in alpine terrain at catchment scale: 1) orographic precipitation at the mountain range scale, 2) preferential deposition at the ridge scale (Lehning et al., 2008) and 3) post-deposition snow transport at the slope scale (Vionnet et al., 2017). Orographic precipitation refers to any precipitation that is either entirely produced or altered by the interaction of atmospheric processes with mountain terrain (Stoelinga et al., 2013). Preferential deposition, which is defined as spatially varying deposition of precipitation due to topography-induced flow field modification close to the surface (Lehning et al., 2008), is an essential process that governs variability in snow accumulation on the mountain ridge scale (Mott and Lehning, 2010; Gerber et al., 2017). Post-depositional processes, particularly at the slope scale, strongly influence the final pattern of snow accumulation on the ground. This includes wind-induced snow transport (e.g., Pomeroy and Gray, 1990; Mott et al., 2018) and redistribution by avalanches (Bernhardt and Schulz, 2010). Following redistribution, variable ablation is affected by radiative processes controlled by solar elevation angle, cloud cover topographic shadings, and seasonal changes in temperature (Lehning et al., 2006; Brauchli et al., 2017). In order to capture spatial variabilities of snow cover and thus obtaining more accurate simulations of snowmelt, aforementioned processes have to be represented in the modeling chain.
Accurately describing the snow-atmosphere interactions in complex terrain is crucial for forecasting seasonal snow cover dynamics as well as run-off generation during spring melt and requires accurate wind forcing fields. However, wind fields are represented in varying complexity and are often not available at adequate high-resolution. Atmospheric models that resolve wind fields are computationally expensive over large domains, and their usage is therefore often limited to specific events, regions, and fewer downscaling studies (Reynolds et al., 2021). In order to acquire the high resolution data needed, downscaling methods are used, which bridge the gap between the resolution of climate models and regional or local scale processes (Fowler et al., 2007). Dynamical downscaling uses atmospheric models to downscale coarser model output. This approach has the benefit of being physically rigorous; all downscaled fields are considered at the same time, so interdependencies between downscaled variables are resolved, which is a priori not the case for other (statistical) downscaling (Michel et al., 2021). The High-resolution Intermediate Complexity Atmospheric Research (HICAR) model is a variant of the existing ICAR model, developed specifically for simulations down to the hectometer scale (Reynolds et al., 2023), while maintaining relatively low computational costs. HICAR can greatly decrease the required computational time compared to other regional climate models such as the Weather and Research Forecasting model (WRF), while demonstrating reasonable agreement with precipitation output of WRF, and is thus a more efficient solution to problems with multiple model runs at high resolutions and large spatial extents (Horak et al., 2019; Kruyt et al., 2022).
Further studies have investigated the influence of more sophisticated physics-based snow models and models including snow transport schemes on the accuracy of snowmelt and streamflow predictions. Bernhardt et al. (2012) found that the inclusion of snow transport processes into the model can improve the accuracy of the distributed snow predictions. However, the effect of snow cover redistribution on predicted melt rates is only detectable if the observed area is small. Griessinger et al. (2019) fed output from a multi-layer energy-balance snowmelt model into a semi-distributed hydrological model. Streamflow predictions were improved, especially at higher elevations where snow most prominently affected catchment hydrology. Brauchli et al. (2017) identified the effects of a more heterogenous snowpack on the melt season at the sub-basin scale. They found that a more rapid runoff pulse originates in areas with a shallower snow cover and an extended melting period is caused by snowmelt from deeper areas. This highlights the importance of an adequate representation of snow accumulation patterns to predict snowmelt and streamflow in mountain catchments.
It is challenging to accurately forecast snow accumulation patterns, particularly in areas with complex terrain, where interactions between local wind and precipitation fields strongly influence snow distribution at the mountain ridge scale (Gerber et al., 2018). Even today’s state-of-the art models are challenged with providing temporally resolved wind speed and direction to study entire seasons of snow accumulation in complex terrain (Dujardin and Lehning, 2022). Thus, high resolution simulations, especially over large extents of complex terrain and long time series are rare (Gerber et al., 2018). Model runs typically have limited applications, focusing on individual blowing snow events or small domains (Groot-Zwaaftink et al., 2013; Mott et al., 2018). However, in order to examine the impact of near surface processes like preferential deposition and wind-induced snow transport on snow distribution impacting snowmelt, a time series of high resolution wind and precipitation fields for an entire season is required (Vionnet et al., 2021).
This study evaluates the influence of applying dynamically downscaled forcing data and post-depositional snow transport schemes on snowpack and snowmelt simulations over an entire season. Statistically downscaled and dynamically downscaled forcing data at resolutions of 250 m, 100 m and 50 m are provided for snowpack simulations over the water year 2016/2017. Simulations are performed for an Alpine domain covering complex terrain with the Flexible Snow Model (FSM2oshd) (Mott et al., 2023) and a model extension including wind- and gravitational-induced snow redistribution (Quéno et al., 2023). The simulation results are evaluated with observed snow height collected with LiDAR in the spring 2017. This study demonstrates the impact of applying dynamical downscaling schemes to snowpack simulations on seasonal snowpack heterogeneity at the catchment scale.
2 Methodology
Simulations are performed with various forcing data at different resolutions with the Flexible Snow Model (FSM2oshd) (Table 1). A dynamical downscaling model (HICAR) and a semi-statistical downscaling approach (COSD) are used to downscale COSMO data to resolutions of 250 m, 100 m and 50 m. Simulations are run with the operational snow cover model FSM2oshd (Mott et al., 2023) and a model extension by Quéno et al. (2023) including wind- and gravity-induced snow redistribution (FSM2trans). The model setup including snow transport is only applied to the forcing data with a resolution of 50 m and 100 m as snow transport processes are important at smaller scales and can be considered as sub-grid processes beyond 100 m resolution (Mott and Lehning, 2010). All simulations are run in the time frame from 01.10.2016 to 31.07.2017 to include the entire snow accumulation and ablation period.
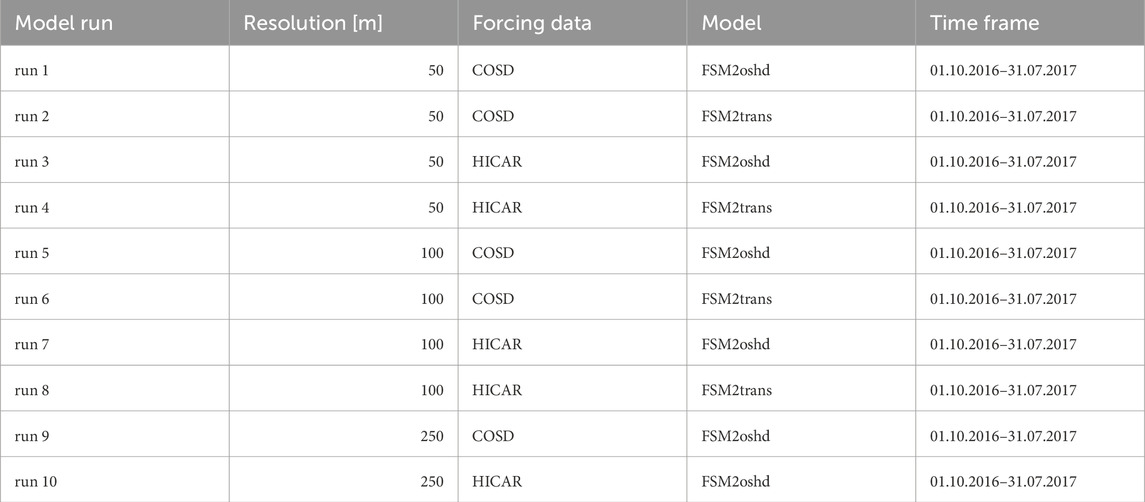
Table 1. Overview of the model runs.
2.1 Description of site
The simulation domain is located in the region of Davos in the Eastern Swiss Alps (Figure 1). This domain is chosen, because it is representative for complex terrain including a large elevation gradient and steep mountain ridges. The climate in the Davos region is characterized as moderate central alpine. The yearly average temperature is 3.5 °C and the average yearly precipitation is about 1,000 mm. A high percentage of precipitation (around 40%) falls as snow and a large part of the landscape is covered with snow between November and April. The maximum snow height is typically reached in the beginning of March. The simulation domain focuses on the Dischma valley since LiDAR data of snow height is available in the valley for model evaluation. The domain has a size of 14 km and 12.5 km in the west-east and north-south directions, respectively, which is an area of 175 km2. The elevation ranges between 1,650 m and 3,193 m with a mean elevation of 2,480 m and a mean slope of 26.1°. The landuse of the area is characterized through steep mountain ridges at higher elevations and grassland at lower elevations of the valley. The influence of human infrastructure on the valley is low with only a few small villages and one main road through the valley. There are some forested slopes at lower elevations of the domain, but vegetation is mostly sparse. A subdomain is chosen to analyse snow accumulation patterns at the mountain ridge scale. The subdomain is 13 km2 and has a mean elevation of 2,609 m.
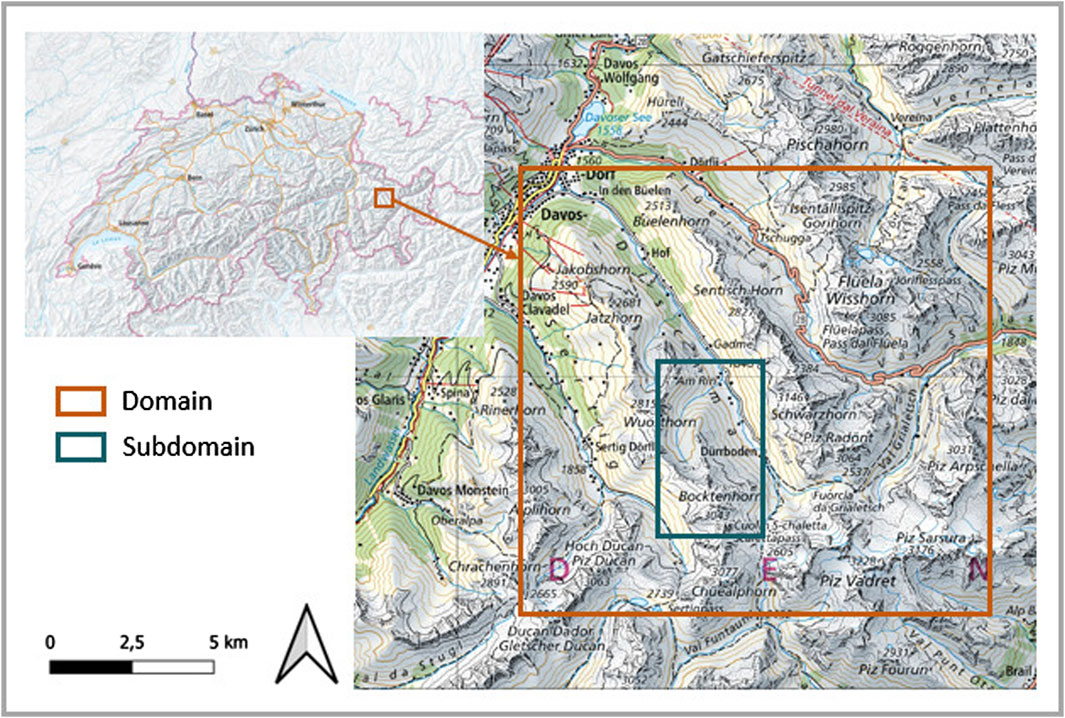
Figure 1. Simulation domain around the Dischma Valley including a mountain ridge subdomain. Map data from Swisstopo, copyright Bundesbehörden der Schweizerischen Eidgenossenschaft.
2.2 Forcing data
2.2.1 COSMO-1
The COSMO model (Consortium for Small-scale Modeling) is run operationally by various countries for daily operational weather forecasting including the Swiss weather service, MeteoSwiss. The model is a limited-area numerical weather prediction system, which is capable of simulating the state of the atmosphere over complex terrain like the alpine area (www.cosmo-model.org). The COSMO-1 reanalysis product is used as input for different downscaling approaches to produce forcing data for simulations with the FSM2oshd snowpack model. It is calculated eight times a day with a horizontal grid size of 1.1 km for a domain centered on Switzerland.
2.2.2 COSMO semi-statistical downscaling - COSD
The available COSMO data is downscaled from 1.1 km resolution to 250 m, 100 m and 50 m resolution to better account for small scale topographic effects. In this semi-statistical downscaling approach within the OSHD model framework (Mott et al., 2023), all meteorological variables are independently downscaled. Near surface air temperature, relative humidity and air pressure are downscaled by linear interpolation with lapse rate correction (Mott et al., 2023). Wind is downscaled using a statistical correction based on the local terrain with observed forecast biases, which removes much of the observed forecast systematic bias. An optimization scheme is used in order to match the observed distributions of wind speed with the downscaled wind speed (Winstral et al., 2017). Precipitation is split into solid and liquid based on air temperature. The solid precipitation is updated using data assimilation taking snow monitoring data to correct for snowfall undercatch (Magnusson et al., 2014). Total precipitation is then linearly interpolated to the target resolution using linear interpolation without lapse rate correction. Direct and shortwave radiation are dynamically downscaled following the approach of Jonas et al. (2020). Longwave radiation is downscaled applying the approach of Helbig and Löwe (2014).
2.2.3 HICAR
The HICAR model is a variant of the existing ICAR model (Gutmann et al., 2016) developed specifically for simulations down to the hectometer scale and in complex terrain (Reynolds et al., 2023). ICAR is a simplified three dimensional atmospheric model which offers an alternative to statistical methods and modern non-hydrostatic numerical weather prediction models such as the WRF Model (Skamarock and Klemp, 2008). HICAR differs from the base ICAR model in a number of ways, but in particular through the addition of a diagnostic wind solver similar to that proposed in Sherman (1978) and a higher order advection scheme (Wicker and Skamarock, 2002). These additions allow for an improved representation of wind fields in complex terrain like the Swiss Alps (Reynolds et al., 2023).
Input requirements for the HICAR model are three-dimensional time varying temperature, pressure, humidity, and wind fields. Temperature and humidity are only applied at the boundaries of the model while fields of wind and pressure are used from the driving low-resolution model throughout the domain. The low-resolution fields from the COSMO-1E input data are linearly interpolated to the HICAR high resolution grid while pressure is adjusted according to the change in elevation between interpolated input grid and HICAR grid. The grid dimensions of the domain and of the input forcing time steps are specified at run time. HICAR uses the Smooth Level Vertical (SLEVE) coordinate which employs a scale dependent vertical decay of underlying terrain features (Schär et al., 2002).
The HICAR model introduces a new wind solver capturing dynamics induced by the underlying high-resolution terrain. Two terrain descriptors highlight areas where direct wind adjustments to the interpolated fields are necessary (Reynolds et al., 2023). Empirical adjustments to the wind fields can lead to a violation of mass conservation. Thus, further corrections to the 3D wind field must be applied to ensure mass conservation (Sherman, 1978; Ross et al., 1988). The shortwave radiation scheme in HICAR calculates the above topography radiation per horizontal surface. Radiation downscaling has been implemented to split the shortwave into diffusive and direct components per inclined surface taking into account the sky view fraction and the horizon line matrix which is accounting for topographic shading effects (Steger et al., 2022). A higher order advection scheme (odd-ordered up to the fifth order) in combination with the SLEVE coordinate system (Schär et al., 2002) are implemented and reduce numerical diffusion in simulations. The surface scheme used in HICAR is the Noah land surface model described in Chen and Dudhia (2001). HICAR uses the Morrison microphysics scheme to calculate sources and sinks to mass species and energy (Morrison et al., 2005).
2.3 FSM2oshd model
The FSM2oshd model is included in the modular framework of the Operational Swiss Hydrological Service (OSHD), which is conducting ongoing analysis of snow water resources as a necessary input for hydrological forecasting (Mott et al., 2023). It is a physics-based model, which solves the complete mass and energy balance of the snowpack for open and forested areas (Mazzotti et al., 2020) at an hourly temporal resolution. The FSM2oshd model is an extension of the Flexible Snow Model (FSM2) (Essery, 2015) with adapted snowpack process parametrizations and new model components for snow cover fraction (Helbig et al., 2021) as well as forest processes (Mazzotti et al., 2021). The model is run at a horizontal resolution of 250 m in the operational setting, but can be applied at higher resolutions for research purposes.
Simulations with a resolution of 100 m and 50 m can be run with the snow transport model setup FSM2trans. This setup includes the process of wind- and gravitational-induced snow redistribution (Quéno et al., 2023). The implementation of gravitational snow transport is based on Bernhardt and Schulz (2010). The routine is executed at every time step of the simulation, checking the snow depth and minimum angle for each grid cell. If the holding snow depth and minimum angle is exceeded, snow is transferred to the lower neighbours and is partitioned based on vertical distance between grid cells. Hysteric features have been added to the original model to account for better determination of avalanche deposit extents (Quéno et al., 2023). The wind-driven snow transport scheme implemented in FSM2trans is based on the Snowtran-3D model (Liston et al., 2007). It simulates wind-driven snow redistribution over topographically variable terrain. The model simulates transport due to saltation and suspension, as well as blowing snow sublimation, based on the wind shear stress calculated, using surface snow properties and wind fields. Contrary to Quéno et al. (2023), the simpler original snowpack layering of FSM2oshd is used instead of the newly developed density-dependent layering.
2.4 Evaluation
A LiDAR data set from spring 2017 is used for model evaluation. LiDAR data was collected in the Dischma valley on a snow-off flight and three different snow-on flights in spring: 20.03.2017, 31.03.2017 and 17.05.2017 (Mazzotti et al., 2019). Bührle et al. (2023) compares snow depth observations with airplane photogrammetry in the same study region for several years. This study found that average snow depth for the selected season, 2017, was lower than seasonal average for other years in the period 2018–2021. However, similar distribution patterns between all years occurred and the relative snow depth distribution seems to be almost independent of the average snow depth.
In order to compare the LiDAR data with the simulation results of snow height, the original LiDAR data with a resolution of 2 m is upscaled to a resolution of 50 m, 100 m and 250 m. In the area of the LiDAR data (very) small glaciers exist. The use of LiDAR data over a glacier is not suitable in this setup, since the glacier itself may experience melt or movement between the snow off and snow-on LiDAR flights, resulting in erroneous depth measurements. The glacierized parts of the LiDAR data are masked. Further, the LiDAR dataset showed some obvious outliers in steep terrain, which were removed.
Several approaches are chosen to compare observed snow height with simulated snow height in the simulation domain. First statistical parameters, including minimum, maximum, mean and standard deviation (SD), are calculated for the simulated and observed snow height in the LiDAR area. Further, elevation-aspect plots are created that show the mean snow height per elevation-aspect band above 2,000 m. Elevation is divided in bands of 100 m, while aspect is divided in bands of 40°. The probability density function (PDF) is calculated for simulated and observed snow height for elevations above 2,000 m and 2,500 m, since snow transport processes are most active at higher elevations.
3 Results and discussion
3.1 Snow accumulation
The simulated snow height is compared with the observed snow height for each simulation run at the ridge scale for 31.03.2017 (Figure 2). The 50 m resolution simulation results are shown for a subdomain, focusing on a ridge (Figure 1). Compared with the observed snow height (Figure 2A), COSD-FSM2oshd and HICAR-FSM2oshd runs show a low spatial variability with HICAR-FSM2oshd overestimating the average snow height. The simulation runs with snow transport show a greater spatial heterogeneity with less snow at the ridges and snow deposition areas with high snow heights on the lee side of mountains. It is visible in Figure 2 that the overall variability of snow height matches the observed LiDAR data best for HICAR-FSM2trans runs. Snow erosion and accumulation areas may differ in their location, however, the overall patterns are well reproduced, which is of greater importance than a cell by cell comparison for the application in hydrological models.
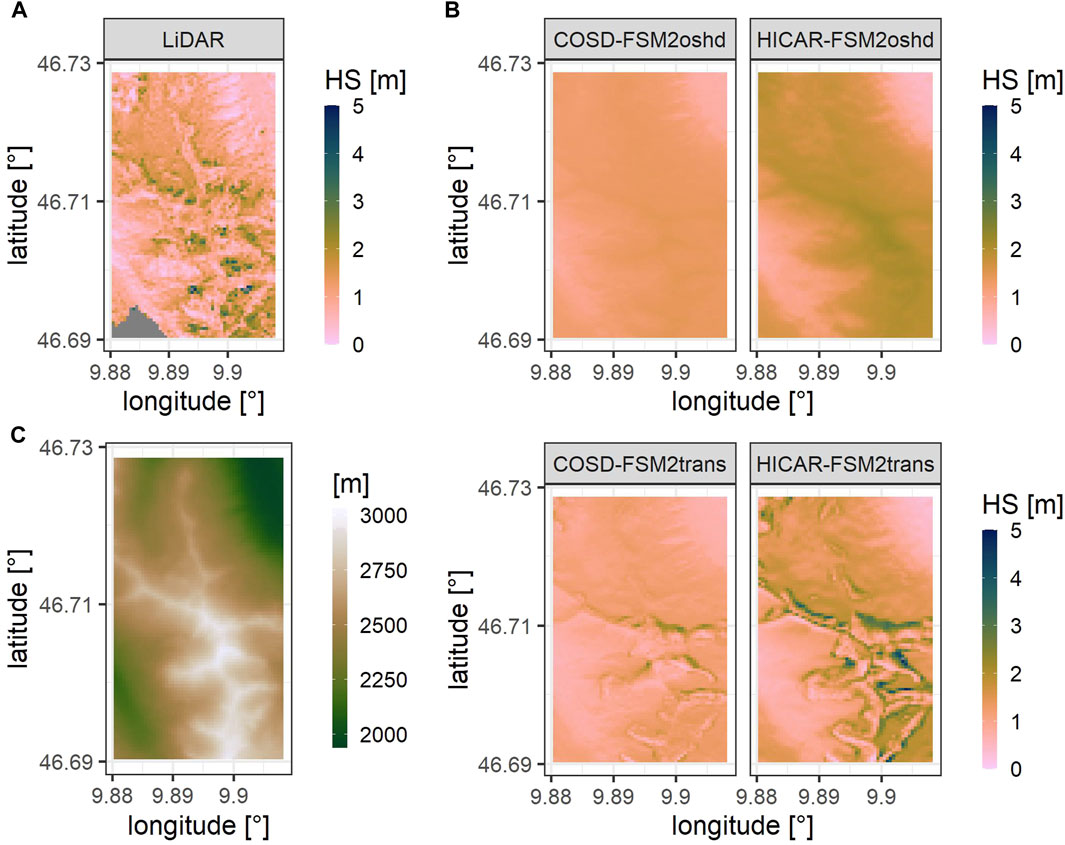
Figure 2. Observed and simulated snow height on 31.03.2017 for simulation runs with 50 m resolution and the ridge subdomain. (A) Observed snow height. (B) Simulated snow height for different downscaling methods (COSD and HICAR) and different model versions (FSM2oshd and FSM2trans). (C) DEM of ridge subdomain.
Figure 2 shows that higher elevations are most impacted by snow redistribution. Higher elevations are usually steeper and exposed to higher wind speeds, resulting in stronger wind- and gravitational-induced snow redistribution from higher to lower elevations (Winstral and Marks, 2002; Bernhardt and Schulz, 2010). Lehning et al. (2011) explained the spatial variability of snow by altitude and land surface roughness, while Grünewald et al. (2014) attributed snow height variability to four topographic parameters: elevation gradient, slope, aspect, and wind sheltering. Note that slope and roughness are highly correlated Lehning et al. (2011). The study area has a dominance of steep, rocky exposures above a certain elevation. In these areas snow distribution is expected to be highly variable, which is reflected in the HICAR-FSM2trans simulations. Simulations without snow transport schemes show a high accumulation of snow on mountain ridges, which is in not in line with LiDAR observations.
Figure 3 shows the mean snow height in aspect and elevations bands for all simulation runs with 50 m resolution and observed snow height on 17.05.2017. The figure is calculated for the entire domain above 2,000 m, since amount of simulation cells is low for lower elevations. All simulations show some aspect and elevation dependency. However, simulation runs with COSD forcing data show a rather uniform distribution of mean snow height, while the snow height distribution across elevation and aspects is more heterogeneous for runs with HICAR forcing. The HICAR-FSM2oshd run shows an overestimation of snow height, while the HICAR-FSM2trans run is in very high agreement with the observed snow height.
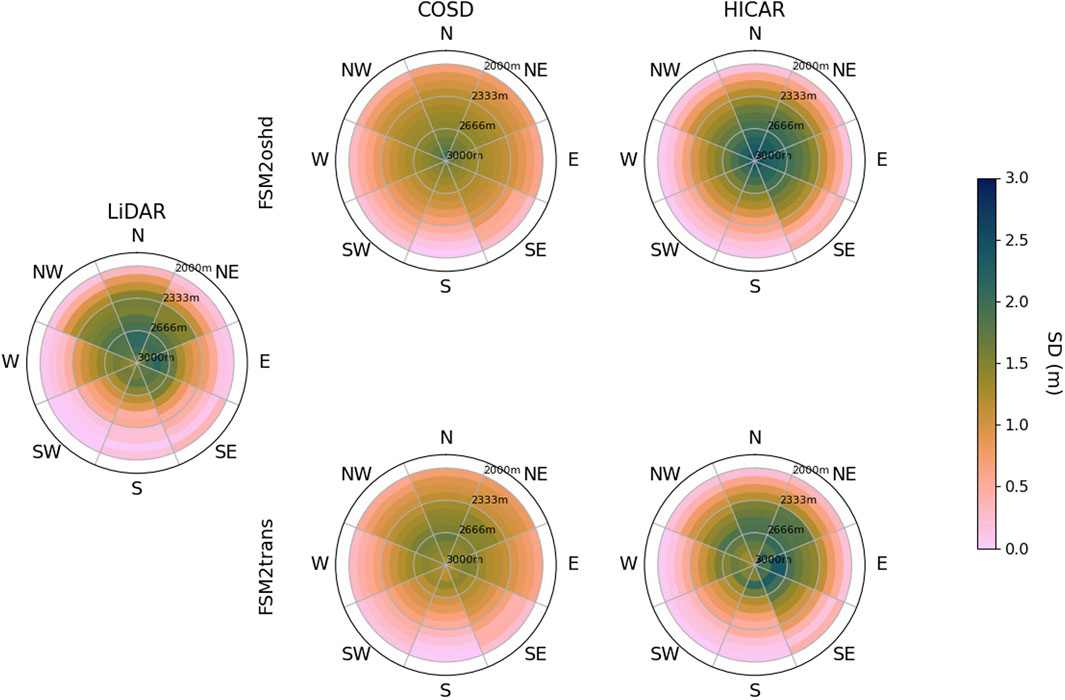
Figure 3. Elevation-aspect plot for simulated and observed snow height for 50 m resolution simulations above 2,000 m elevation and for 17.05.2017. The simulated snow height is shown for different downscaling methods (COSD and HICAR) and different model versions (FSM2oshd and FSM2trans).
Gerber et al. (2018) found that terrain-flow-precipitation interactions increase snow accumulation on the windward side of mountain ridges, while near surface particle-flow interactions, which represents preferential deposition, enhances leeward snow precipitation and therefore snow accumulation. Sharma et al. (2023) found that most active areas for snow erosion are windward sides of ridges with zones of deposition found immediately on the leeward side of ridges. Simualtions with HICAR forcing, that are expected to better represent orogrpahic precipitation and preferentail deposition, show an increased variability of snow height depending on aspect and elevation. This indicates a better representation of aforementioned processes. Combining HICAR forcing data with post depositional snow transport processes leads to the highest agreement with observed snow height. With a better representation of the spatial distribution of snow, a more accurate simulation of melt rates is expected. The temperature gradient in mountainous areas leads to higher temperatures in valleys than at mountain peaks, which leads to earlier and higher melt rates in lower elevations. Further, higher radiation input on south facing slopes leads to earlier and higher melt rates than on north facing slopes.
Figure 4 shows a boxplot with the mean snow height from all simulation runs with 100 m resolution and LiDAR data upscaled to a 100 m resolution. Generally, runs with HICAR forcing data have a higher average snow height than runs with COSD forcing data, while FSM2trans runs have a lower mean snow height than runs with FSM2oshd. The variability of snow height increases with FSM2trans runs, especially with HICAR-FSM2trans runs, and matches the observed variability more accurately. For example, observed snow height on the 17.05.2017 ranges between 0 m and 7.26 m, while the COSD-FSM2oshd run ranges between 0 m and 2.08 m and the HICAR-FSM2oshd run between 0 m and 2.74 m. The snow height ranges between 0 m and 4.53 m, and 0 m and 7.55 m for COSD-FSM2trans and HICAR-FSM2trans runs, respectively.
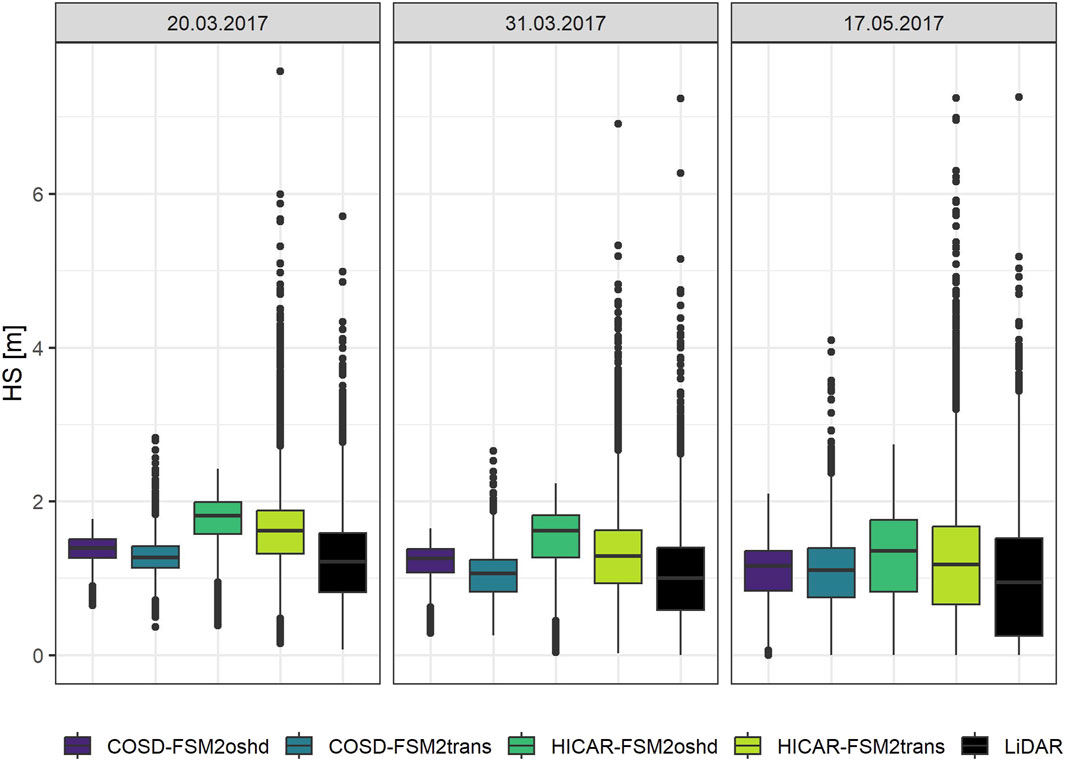
Figure 4. Boxplot of simulated and observed snow height for runs with 100 m resolution on all days observed snow height is available (20.03.2017, 30.03.2017, 17.05.2017).
Figure 5 shows a PDF for simulated and observed snow height for all simulations and LiDAR days. The PDF curves are shown for elevations higher than 2,500 m since snow transport schemes have the biggest impact at higher elevations. Simulations with COSD forcing data show a sharp peak of probability around a snow height of 1 m–1.5 m on 20.03.2017 and 31.03.2017. HICAR runs show a lower peak around a snow height of approximately 2 m. These peaks are lower for 17.05.2017 and snow height distribution is much wider, indicating an increase in snow height variability later in the melting season. Simulations with FSM2trans show a wider distribution of snow height than simulations with FSM2oshd, in better agreement with the LiDAR data. Especially the PDF curve of HICAR-FSM2trans runs matches the observed snow height distribution well. Snow height distributions between simulation runs with different resolutions show very similar patterns, indicating small difference in accumulation patterns caused by applying different model resolutions.
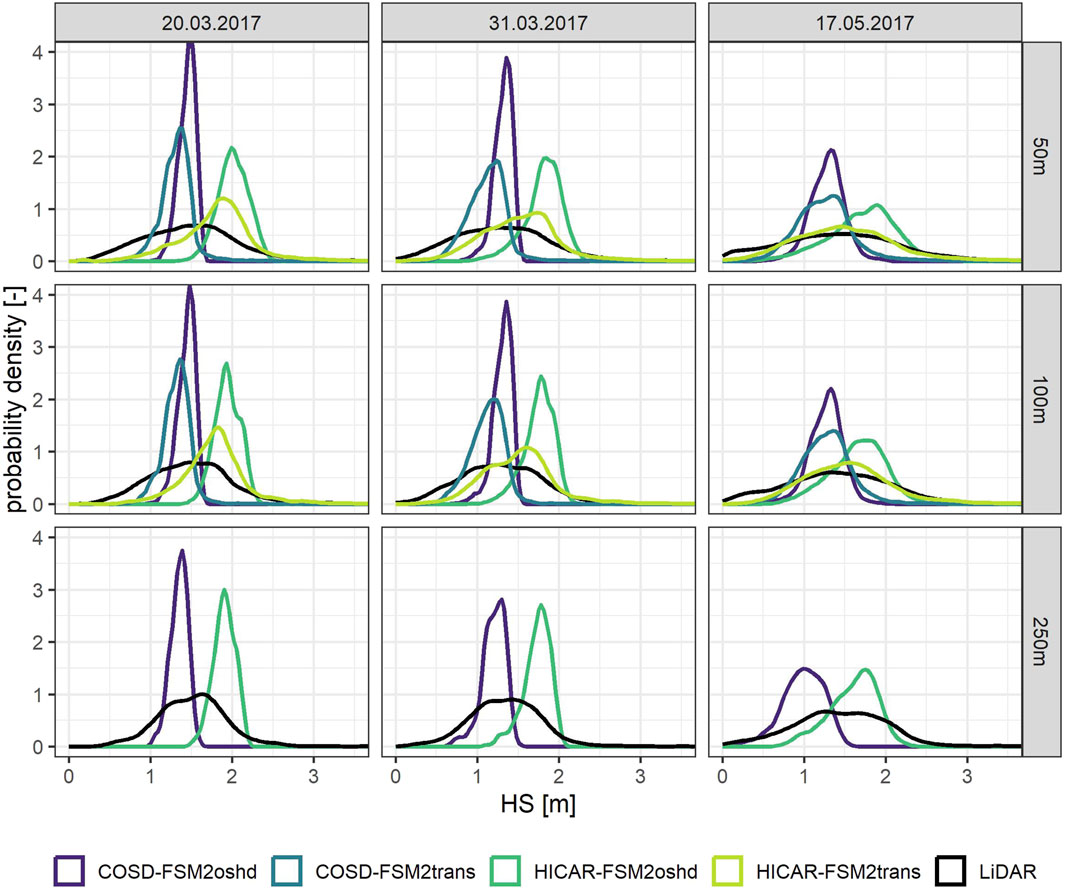
Figure 5. Probability density function (PDF) curves for simulated and observed snow height above 2,500 m elevation for all simulation runs. Results are shown for all days observed snow height is available (20.03.2017, 30.03.2017, 17.05.2017) and all simulation resolutions (50 m, 100 m, 250 m).
Other studies indicate a stronger effect of model resolution on snow accumulation patterns. Vionnet et al. (2014) found that the model reproduces snow erosion and deposition patterns at the ridge scale at a grid spacing of 50 m. Similarly, Gerber et al. (2018) demonstrates that lee-side flow separation and snowfall enhancement at the mountain ridge scale begin to form at a model resolution of 50 m or finer. One possible reason for the similarity in results is that processes at the ridge scale are well represented by 100 m and 50 m runs, while there is a need for finer resolutions to resolve smaller scale patterns of local topographic features which modify atmospheric flow, and generate snow erosion and deposition. Mott and Lehning (2010) found that running their model at a horizontal resolution of 50 m reproduces processes at the ridge scale but misses small scale deposition patterns. They were able to partially reproduce smaller patterns using resolution of 10 m and 5 m. This suggest a requirement for higher resolution modeling in complex terrain, possibly even at higher resolutions than 50 m. However, HICAR-FSM2trans is capable of replicating realistic patterns and distributions even at a 100 m resolution, which is critical for hydrological applications.
An important research question that can be addressed, is the relative importance of processes that shape the snow accumulation variability on mountains, namely, orographic precipitation, preferential deposition and post-deposition snow redistribution. Simulations with HICAR input should better represent pre-depositional processes with more complex and heterogeneous wind and precipitation patterns. Simulations with HICAR forcing data without any snow transport show an increase in variability of spatial snow height distribution. Scipiõn et al. (2013) quantified the importance of orographic precipitation patterns compared to near surface processes for snow accumulation variability. They found that the spatial variability of snow deposition on the ground is significantly larger than the variability of snowfall measured several hundred meters above the ground. The authors attribute this disparity as a signature of the fact that the main processes governing snow accumulation take place close to or at the surface. Mott and Lehning (2010) found evidence of preferential deposition at 50 m grid spacing simulations with enhanced leeward slope loading, which was caused by lower deposition velocities of snow on windward slopes due to strong wind speed and updraft as well as higher deposition velocities on the leeward side of ridges. Other studies found that accumulation is only minimally influenced by near surface flow fields (Vionnet et al., 2017). The results of this study show an increase in variability of spatial snow height distribution with HICAR forcing data, possibly indicating a better representation of orographic precipitation and preferential deposition. However, simulations without FSM2trans show a large disparity between simulated and observed snow height, indicating the importance of post-depositional snow transport. The highest agreement with observed snow height data is found for HICAR FSM2trans runs. Vionnet et al. (2017) revealed with simulations at 50 m grid spacing that wind-induced, post-deposition snow transport is the main source of snow accumulation during a snow fall event. This study highlights the importance of both, high-resolution meteorological forcing data and post-deposition redistribution processes, leading to the conclusion that models with snow transport schemes require high-resolution wind and precipitation fields.
3.2 Snow height bias
Snow height output of all simulation runs is subtracted from the aggregated observed snow height in order to analyse differences in snow height for each simulation cell. Figure 6 shows a bias map of simulations with 50 m resolution for 20.03.2017 (A) and 17.05.2017 (B). It shows that runs with HICAR forcing have the greatest wet bias, especially at higher elevations, while COSD-FSM2trans shows the greatest dry bias. The valley bottom displays a wet bias for COSD-FSM2oshd and COSD-FSM2trans earlier in the melt season, but by the middle of May most snow in the valley has melted. Generally, FSM2trans runs have a greater underestimation of snow height than FSM2oshd runs and runs with HICAR forcing data are generally wetter than runs with COSD forcing data (Table 2).
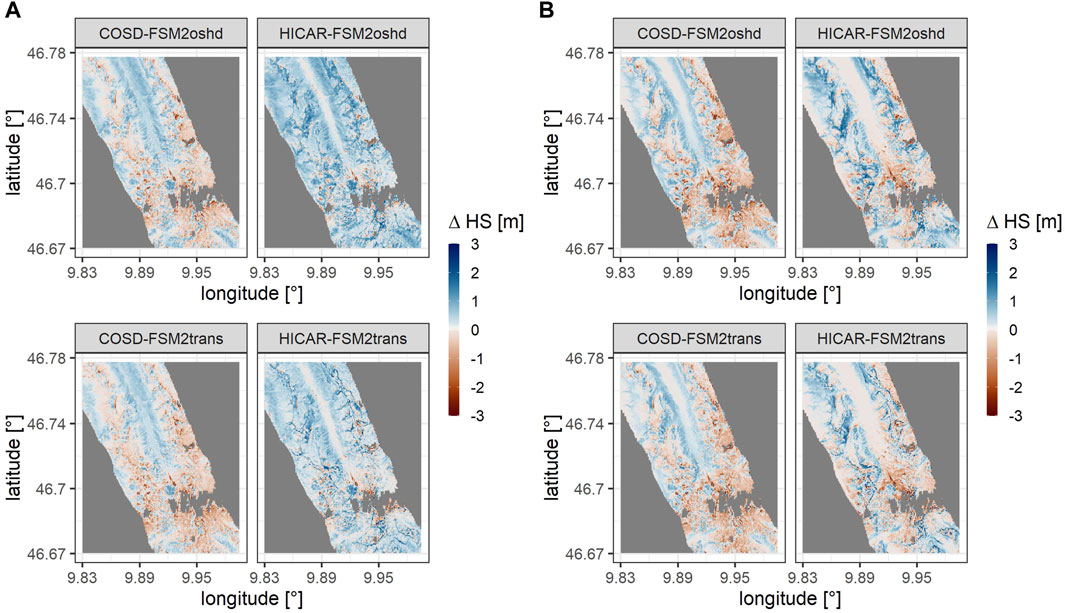
Figure 6. Snow height bias calculated as the simulated snow height subtracted from the observed snow height at 50 m resolution for simulation runs with different downscaling methods (HICAR and COSD) and different model versions (FSM2oshd and FSM2trans). (A) 30.03.2017. (B) 17.05.2027.
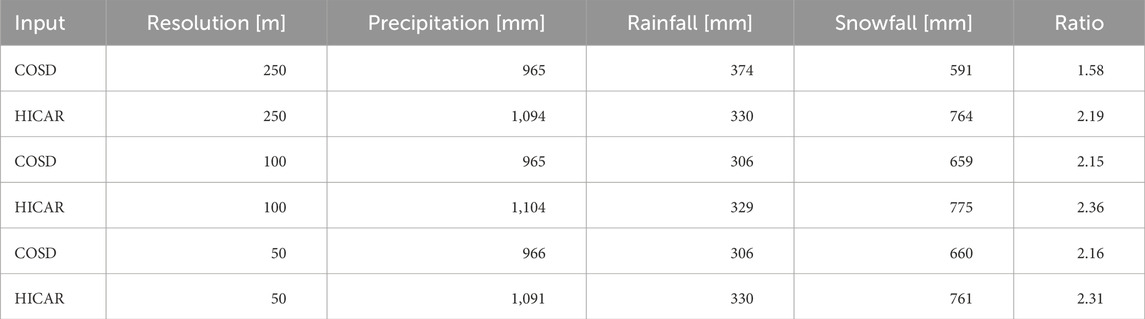
Table 2. Sum of precipitation [mm], snowfall [mm], rainfall [mm] and ratio of snow- and rainfall in the simulation domain for each resolution and downscaling method (COSD and HICAR).
The bias analysis shows relatively high biases on some parts of the domain, whereas other analyses like variability and distribution of snow height show a good agreement between observed snow height and simulated snow height of HICAR-FSM2trans. Other studies found differences in bias between dynamically downscaled and statistically downscaled precipitation data as well as increasing biases with higher resolutions (Leung and Qian, 2003). In this study, the sum of precipitation or snowfall does not change notably with resolution (Table 2), nor does the mean bias for the domain. Therefore, the findings of a higher precipitation bias with higher resolutions can not be supported. Silverman et al. (2013) found a difference in magnitude between dynamically downscaled precipitation with WRF and a statistical downscaling approach, where precipitation from WRF was much higher especially on mountain peaks. One explanation for possible overestimation of precipitation is that many of the physics parametrizations used in meso-scale models were initially developed for coarser resolutions. As resolutions increase, there is less topographic smoothing, which allows for the preservation of higher elevations and thus enhances orographic effects, making it possible for higher precipitation amounts to exist (Gerber et al., 2018). The underestimation of precipitation in statistical models may come from a variety of reasons including complex physical interactions at high elevations, which are not represented. Statistical models do not use information about wind direction, speed, air-flow dynamics or cloud properties. In complex terrain these physical parameters can lead to strong non-linearities in precipitation elevation relationship (Silverman et al., 2013). The bias analysis results show that the snowheight results of simulations with HICAR forcing lead to a wet bias and simulations with COSD forcing lead to areas with dry biases. However, these biases are considerably reduced by running simulations with the FSM2trans model setup. This shows that the implementation of snow transport schemes is a vital part for snow height bias analysis. Precipitation input may be accurate but without redistribution of snow and sublimation losses due to blowing snow, observed snow heights cannot be correctly represented by simulations.
3.3 Snow ablation
A time series of mean daily snowmelt in the melt period from 15.03.2017 to 15.07.2017 is plotted for each simulation run and the whole domain (Figure 7) with the date of the LiDAR flights shown as dashed lines. The melt patterns for simulation runs with different resolutions are very similar with small differences in magnitude of major melt events. The runs with COSD forcing generally show lower melt rates than the runs with HICAR forcing, which follows the higher snow input of the HICAR forcing data. This is also clear in Figure 8, which shows the cumulative snowmelt from 15.03.2017 to 15.07.2017. The snowfall input is on average 17% lower for COSD forcing and cumulative melt is 18.3% lower for COSD forcing snowmelt output. The difference in melt rates can thus mostly be explained with the difference in snowfall input (Table 2). Further Figure 7 shows that simulations with HICAR have the highest early season melt compared to COSD simualtion runs.
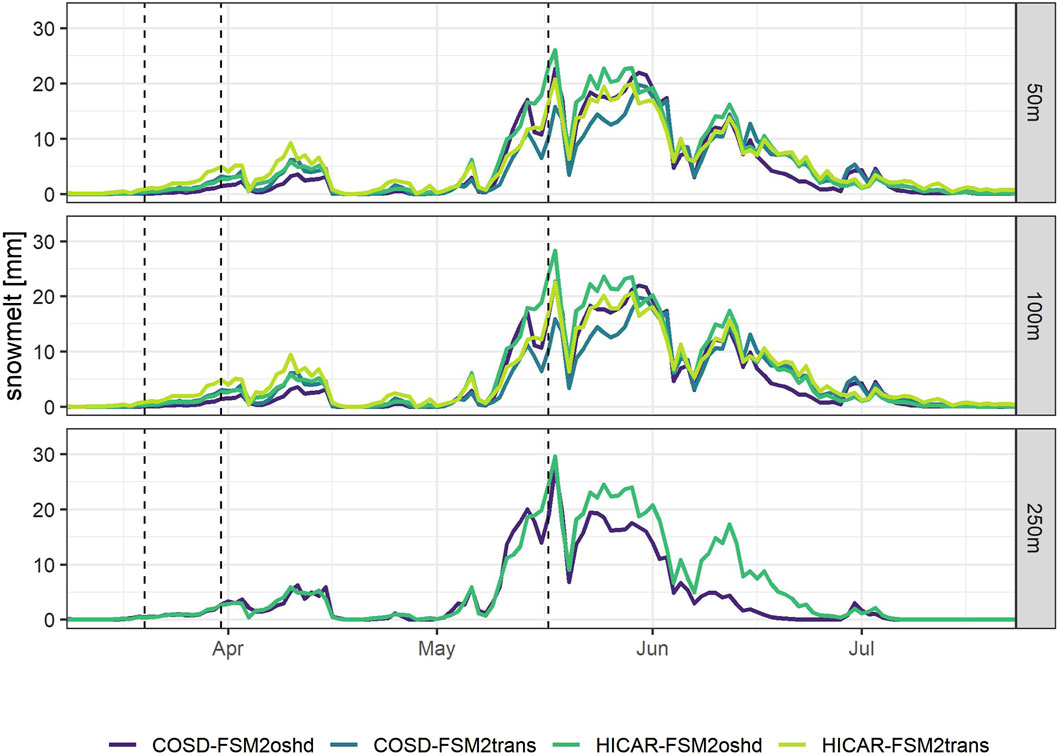
Figure 7. Mean daily snowmelt of the whole domain for the melting season from 15.03.2017 to 15.07.2017 for each simulation run with different downscaling methods (COSD and HICAR), different model versions (FSM2oshd and FSM2trans) and resolutions (50 m, 100 m, 250 m). Dashed lines indicate time of LiDAR flights.
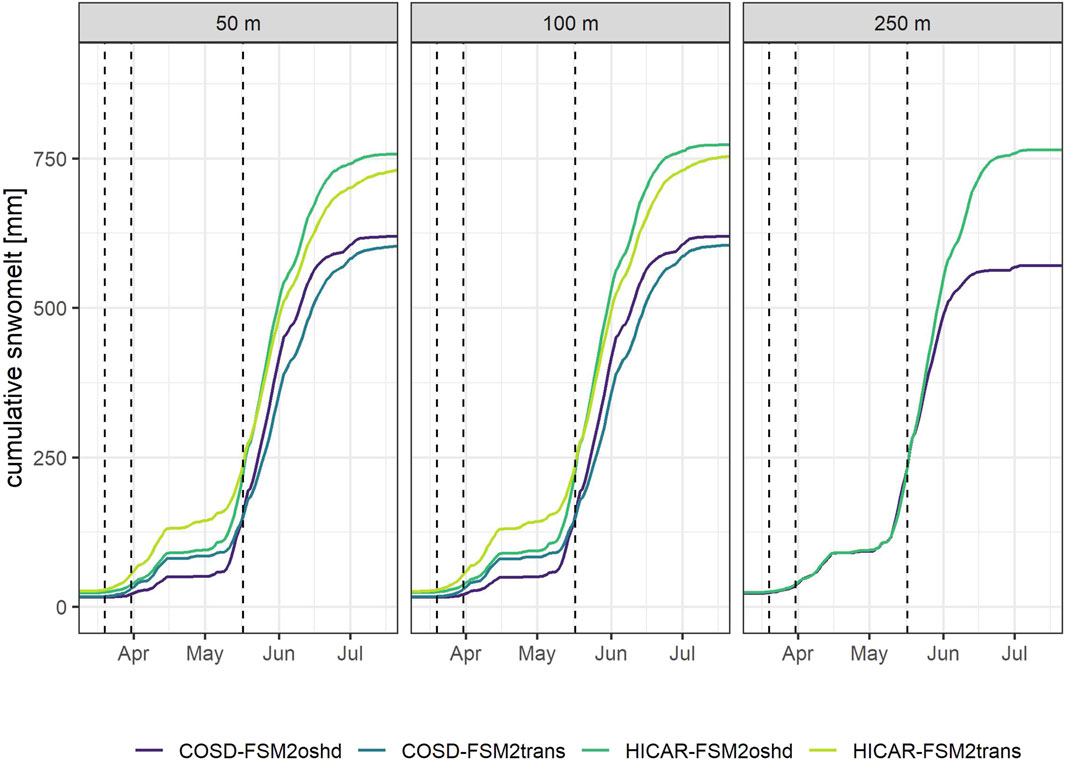
Figure 8. Cumulative mean daily snowmelt calculated over the entire season and shown for 15.03.2017 to 17.05.2017 for each simulation run with different downscaling methods (COSD and HICAR), different model versions (FSM2oshd and FSM2trans) and resolutions (50 m, 100 m, 250 m). Dashed lines indicate time of LiDAR flights.
Through snow drift and avalanches, snow is transported to lower elevations and overall variability of snow height in the domain increases. This leads to a more pronounced snowmelt in April, while there is less melt during the peak season, through shallow snowpacks and snow accumulations at lower elevations. These findings are in agreement with Brauchli et al. (2017), who found that a greater variability in snow height at the beginning of the melt season leads to more differential melt over space and time. In addition to a more pronounced onset of melt, they also observed a prolonged melt period caused by delayed melt out in areas with deeper snow accumulation. Snow transport schemes are expected to move snow to depressions, bowls or other shady topographic features, where it is protected from radiation and contributes to melt water later in the season. HICAR-FSM2trans runs have the highest melt rates in the beginning and the end of the melting season as well as the highest variability of snow height in the domain. This shows that the effects on melt rates by including dynamically downscaled forcing data and snow transport processes are considerable. This contrasts other studies that found the inclusion of snow transport processes can improve the accuracy of spatial snow variability, but the effect on predicted spatial melt rates are only detectable for small areas (Bernhardt et al., 2012; Musselman et al., 2015).
The cumulative melt plot shows a difference in the total melt between simulations with FSM2oshd and FSM2trans. This difference can be attributed in part to additional sublimation caused by snow transport. Cumulative snow drift sublimation is an output of FSM2trans simulation runs and the mean is calculated for the whole simulation domain. The mean cumulative sublimation for 100 m runs with HICAR-FSM2trans is 6.32 mm, which is 0.87% of the total snowfall, and 5.7 mm for COSD-FSM2trans, which is 0.87% of the sum of snowfall. For 50 m runs the mean cumulative sublimation is 5.49 mm and −3.43 mm with 0.72% and 0.52% of the sum of snowfall for HICAR-FMS2trans and COSD-FSM2trans, respectively. This shows that drifting snow sublimation is highest for simulation runs with HICAR forcing data. These findings are in agreement with previous studies in Alpine environments, where Groot-Zwaaftink et al. (2013) found that drifting snow sublimation over a season is small with a value of about 0.1% of precipitation. Further, Bernhardt et al. (2012) estimated drifting snow sublimation of 1.6% of snowfall over a whole season, indicating that additional sublimation through wind-induced snow transport is only a minor contributor to the loss of snow height.
4 Conclusion
The snow cover in alpine terrain is highly spatially variable. This heterogeneity has an influence on the magnitude and timing of snowmelt in spring. For this reason, an accurate representation of the snow cover is essential for forecasting streamflow at the catchment outlet. In this study, multiple simulations with the FSM2oshd snowpack model are run over the water year 2016/2017 in a domain of complex terrain in the Swiss Alps with different resolutions (250 m, 100 m and 50 m). Simulations are either run with the operational version of the FSM2oshd model or with a model extension that includes post-depositional snow transport processes (FSM2trans). The forcing data supplied to the snowpack model are either semi-statistically downscaled within the OSHD framework or dynamically downscaled with HICAR.
The snow height from simulations is evaluated with LiDAR data collected in March and May 2017. Spatial snow accumulation patterns and snow height distribution are best matched with HICAR-FSM2trans simulations, indicating the importance of both accurate meteorological forcing data and snow redistribution schemes. Overall patterns of spatial variability are well reproduced compared to observed snow height. Higher elevations are most impacted by snow redistribution since they are usually steeper and exposed to higher wind speeds, resulting in stronger wind- and gravity-induced snow redistribution. Further, a high agreement for elevation-aspect bands with the observed snow height is shown, which is expected to lead to more accurate melt curves since radiation and temperature input are responsible for melt and highly influenced by elevation and aspect. Snow height distribution is replicated even at a 100 m resolution, which is critical for an accurate prediction of snowmelt. The snow height distribution over the scale of the entire domain has greater relevance than a cell by cell comparison of snow height.
The bias analysis shows that simulation runs with HICAR forcing data show a wet bias in higher elevations and a dry bias in the valley, likely because microphysics schemes are calibrated for low-resolution and therefore less steep terrain. The wet bias of HICAR can be attributed to the preservation of higher elevations, which enhances orographic effects. Runs with COSD forcing show a wet bias in the valley and a larger dry bias on higher elevations. In comparison to HICAR, the semi-statistical downscaling does not use information about wind direction and speed, air flow dynamics or cloud properties, which can lead to non-linearities in precipitation elevation relationships. The mean bias is much lower for FSM2trans simulation runs, suggesting that snow transport schemes are a vital part for snow height bias analyses.
The snowmelt curves show a more pronounced melt in the beginning of spring with FSM2trans simulations, while also simulating highest melt rates in the end of the melting season. Snow is transported to lower elevations during the accumulation season and shallower snowpacks in snow erosion zones can be found, resulting in a more rapid snowmelt signal in the beginning of the melting season. Later in the year, thicker snowpacks that accumulated in depressions, bowls or other shady topographic features contribute to late season melt events and prolong the melt period. Future research may implement snowmelt and runoff output from snowpack simulations with dynamically downscaled forcing data in hydrological models to investigate how predicted streamflow is influenced and improved.
Data availability statement
The datasets presented in this study can be found in online repositories. The names of the repository/repositories and accession number(s) can be found below: 10.16904/envidat.487.
Author contributions
JB: Methodology, Validation, Visualization, Writing–original draft, Writing–review and editing, Conceptualization. DR: Conceptualization, Data curation, Methodology, Supervision, Writing–original draft, Writing–review and editing. LQ: Data curation, Methodology, Writing–original draft, Writing–review and editing. TJ: Writing–original draft, Writing–review and editing, Data curation, Supervision. ML: Supervision, Writing–original draft, Writing–review and editing. RM: Supervision, Writing–original draft, Writing–review and editing, Funding acquisition, Resources.
Funding
The author(s) declare that financial support was received for the research, authorship, and/or publication of this article. Swiss National Science Foundation (grant no. 188554). The computational resources needed to perform the simulations were provided by the Swiss National Supercomputing Center (CSCS) through projects s1148 and sm78. Open access funding by Swiss Federal Institute for Forest, Snow and Landscape Research (WSL).
Acknowledgments
The authors thank the funding source of this project, the Swiss National Science Foundation (Grant Nos. 188554).
Conflict of interest
The authors declare that the research was conducted in the absence of any commercial or financial relationships that could be construed as a potential conflict of interest.
The author(s) declared that they were an editorial board member of Frontiers, at the time of submission. This had no impact on the peer review process and the final decision.
Publisher’s note
All claims expressed in this article are solely those of the authors and do not necessarily represent those of their affiliated organizations, or those of the publisher, the editors and the reviewers. Any product that may be evaluated in this article, or claim that may be made by its manufacturer, is not guaranteed or endorsed by the publisher.
References
Arnoux, M., Brunner, P., Schaefli, B., Mott, R., Cochand, F., and Hunkeler, D. (2020). Low-flow behavior of alpine catchments with varying quaternary cover under current and future climatic conditions. J. Hydrology 592, 125591. doi:10.1016/j.jhydrol.2020.125591
Barnett, T. P., Adam, J. C., and Lettenmaier, D. P. (2005). Potential impacts of a warming climate on water availability in snow-dominated regions. Nature 438, 303–309. doi:10.1038/nature04141
Bernhardt, M., and Schulz, K. (2010). SnowSlide: a simple routine for calculating gravitational snow transport. Geophys. Res. Lett. 37, 43086. doi:10.1029/2010GL043086
Bernhardt, M., Schulz, K., Liston, G. E., and Zängl, G. (2012). The influence of lateral snow redistribution processes on snow melt and sublimation in alpine regions. J. Hydrology 424-425, 196–206. doi:10.1016/j.jhydrol.2012.01.001
Brauchli, T., Trujillo, E., Huwald, H., and Lehning, M. (2017). Influence of slope-scale snowmelt on catchment response simulated with the Alpine3D model. Water Resour. Res. 53, 10723–10739. doi:10.1002/2017WR021278
Bührle, L. J., Marty, M., Eberhard, L. A., Stoffel, A., Hafner, E. D., and Bühler, Y. (2023). Spatially continuous snow depth mapping by aeroplane photogrammetry for annual peak of winter from 2017 to 2021 in open areas. Cryosphere 17, 3383–3408. doi:10.5194/tc-17-3383-2023
Chen, F., and Dudhia, J. (2001). Coupling an advanced land surface–hydrology model with the penn state–NCAR MM5 modeling system. Part I: model implementation and sensitivity. Mon. Weather Rev. 129, 569–585. doi:10.1175/1520-0493(2001)129<0569:caalsh>2.0.co;2
Clark, M. P., Hendrikx, J., Slater, A. G., Kavetski, D., Anderson, B., Cullen, N. J., et al. (2011). Representing spatial variability of snow water equivalent in hydrologic and land-surface models: a review. Water Resour. Res. 47, 10745. doi:10.1029/2011WR010745
Dujardin, J., and Lehning, M. (2022). Wind-Topo: downscaling near-surface wind fields to high-resolution topography in highly complex terrain with deep learning. Q. J. R. Meteorological Soc. 148, 1368–1388. doi:10.1002/qj.4265
Essery, R. (2015). A factorial snowpack model (FSM 1.0). Geosci. Model Dev. 8, 3867–3876. doi:10.5194/gmd-8-3867-2015
Fowler, H. J., Blenkinsop, S., and Tebaldi, C. (2007). Linking climate change modelling to impacts studies: recent advances in downscaling techniques for hydrological modelling. Int. J. Climatol. 27, 1547–1578. doi:10.1002/joc.1556
Freudiger, D., Kohn, I., Seibert, J., Stahl, K., and Weiler, M. (2017). Snow redistribution for the hydrological modeling of alpine catchments. Wiley Interdiscip. Rev. Water 4, 1232. doi:10.1002/wat2.1232
Gerber, F., Besic, N., Sharma, V., Mott, R., Daniels, M., Gabella, M., et al. (2018). Spatial variability in snow precipitation and accumulation in COSMO-WRF simulations and radar estimations over complex terrain. Cryosphere 12, 3137–3160. doi:10.5194/tc-12-3137-2018
Gerber, F., Lehning, M., Hoch, S. W., and Mott, R. (2017). A close-ridge small-scale atmospheric flow field and its influence on snow accumulation. J. Geophys. Res. 122, 7737–7754. doi:10.1002/2016JD026258
Griessinger, N., Schirmer, M., Helbig, N., Winstral, A., Michel, A., and Jonas, T. (2019). Implications of observation-enhanced energy-balance snowmelt simulations for runoff modeling of alpine catchments. Adv. Water Resour. 133, 103410. doi:10.1016/j.advwatres.2019.103410
Groot-Zwaaftink, C. D., Mott, R., and Lehning, M. (2013). Seasonal simulation of drifting snow sublimation in alpine terrain. Water Resour. Res. 49, 1581–1590. doi:10.1002/wrcr.20137
Grünewald, T., Bühler, Y., and Lehning, M. (2014). Elevation dependency of mountain snow depth. Cryosphere 8, 2381–2394. doi:10.5194/tc-8-2381-2014
Gutmann, E., Barstad, I., Clark, M., Arnold, J., and Rasmussen, R. (2016). The intermediate complexity atmospheric research model (ICAR). J. Hydrometeorol. 17, 957–973. doi:10.1175/JHM-D-15-0155.1
Hanzer, F., Förster, K., Nemec, J., and Strasser, U. (2018). Projected cryospheric and hydrological impacts of 21st century climate change in the Ötztal Alps (Austria) simulated using a physically based approach. Hydrology Earth Syst. Sci. 22, 1593–1614. doi:10.5194/hess-22-1593-2018
Helbig, N., and Löwe, H. (2014). Parameterization of the spatially averaged sky view factor in complex topography. J. Geophys. Res. 119, 4616–4625. doi:10.1002/2013JD020892
Helbig, N., Schirmer, M., Magnusson, J., Mäder, F., Herwijnen, A. V., Quéno, L., et al. (2021). A seasonal algorithm of the snow-covered area fraction for mountainous terrain. Cryosphere 15, 4607–4624. doi:10.5194/tc-15-4607-2021
Horak, J., Hofer, M., Maussion, F., Gutmann, E., Gohm, A., and Rotach, M. W. (2019). Assessing the added value of the Intermediate Complexity Atmospheric Research (ICAR) model for precipitation in complex topography. Hydrology Earth Syst. Sci. 23, 2715–2734. doi:10.5194/hess-23-2715-2019
Horton, P., Schaefli, B., Mezghani, A., Hingray, B., and Musy, A. (2006). Assessment of climate-change impacts on alpine discharge regimes with climate model uncertainty. Hydrol. Process. 20, 2091–2109. doi:10.1002/hyp.6197
Jonas, T., Webster, C., Mazzotti, G., and Malle, J. (2020). HPEval: a canopy shortwave radiation transmission model using high-resolution hemispherical images. Agric. For. Meteorology 284, 107903. doi:10.1016/j.agrformet.2020.107903
Kruyt, B., Mott, R., Fiddes, J., Gerber, F., Sharma, V., and Reynolds, D. (2022). A downscaling intercomparison study: the representation of slope- and ridge-scale processes in models of different complexity. Front. Earth Sci. 10, 789332. doi:10.3389/feart.2022.789332
Lehning, M., Grünewald, T., and Schirmer, M. (2011). Mountain snow distribution governed by an altitudinal gradient and terrain roughness. Geophys. Res. Lett. 38, 48927. doi:10.1029/2011GL048927
Lehning, M., Ingo, I. V., Gustafsson, D., Nguyen, T. A., Stähli, M., and Zappa, M. (2006). ALPINE3D: a detailed model of mountain surface processes and its application to snow hydrology. Hydrol. Process. 20, 2111–2128. doi:10.1002/hyp.6204
Lehning, M., Löwe, H., Ryser, M., and Raderschall, N. (2008). Inhomogeneous precipitation distribution and snow transport in steep terrain. Water Resour. Res. 44, 6545. doi:10.1029/2007WR006545
Leung, L. R., and Qian, Y. (2003). The sensitivity of precipitation and snowpack simulations to model resolution via nesting in regions of complex terrain. J. Hydrometeorol. 4, 1025–1043. doi:10.1175/1525-7541(2003)004<1025:tsopas>2.0.co;2
Liston, G. E., Haehnel, R. B., Sturm, M., Hiemstra, C. A., Berezovskaya, S., and Tabler, R. D. (2007). Simulating complex snow distributions in windy environments using SnowTran-3D. J. Glaciol. 53, 241–256. doi:10.3189/172756507782202865
Magnusson, J., Gustafsson, D., Hüsler, F., and Jonas, T. (2014). Assimilation of point SWE data into a distributed snow cover model comparing two contrasting methods. Water Resour. Res. 50, 7816–7835. doi:10.1002/2014WR015302
Mazzotti, G., Currier, W. R., Deems, J. S., Pflug, J. M., Lundquist, J. D., and Jonas, T. (2019). Revisiting snow cover variability and canopy structure within forest stands: insights from airborne lidar data. Water Resour. Res. 55, 6198–6216. doi:10.1029/2019WR024898
Mazzotti, G., Essery, R., Moeser, C. D., and Jonas, T. (2020). Resolving small-scale forest snow patterns using an energy balance snow model with a one-layer canopy. Water Resour. Res. 56, 26129. doi:10.1029/2019WR026129
Mazzotti, G., Webster, C., Essery, R., and Jonas, T. (2021). Increasing the Physical Representation of forest-snow processes in coarse-resolution models: lessons learned from upscaling hyper-resolution simulations. Water Resour. Res. 57, 29064. doi:10.1029/2020WR029064
Michel, A., Sharma, V., Lehning, M., and Huwald, H. (2021). Climate change scenarios at hourly time-step over Switzerland from an enhanced temporal downscaling approach. Int. J. Climatol. 41, 3503–3522. doi:10.1002/joc.7032
Morrison, H., Curry, J. A., and Khvorostyanov, V. I. (2005). A new double-moment microphysics parameterization for application in cloud and climate models. Part I: description. J. Atmos. Sci. 62, 1665–1677. doi:10.1175/JAS3446.1
Mott, R., and Lehning, M. (2010). Meteorological modeling of very high-resolution wind fields and snow deposition for mountains. J. Hydrometeorol. 11, 934–949. doi:10.1175/2010JHM1216.1
Mott, R., Vionnet, V., and Grünewald, T. (2018). The seasonal snow cover dynamics: review on wind-driven coupling processes. Front. Earth Sci. 6, 00197. doi:10.3389/feart.2018.00197
Mott, R., Winstral, A., Cluzet, B., Helbig, N., Magnusson, J., Mazzotti, G., et al. (2023). Operational snow-hydrological modeling for Switzerland. Front. Earth Sci. 11, 1228158. doi:10.3389/feart.2023.1228158
Musselman, K. N., Pomeroy, J. W., Essery, R. L., and Leroux, N. (2015). Impact of windflow calculations on simulations of alpine snow accumulation, redistribution and ablation. Hydrol. Process. 29, 3983–3999. doi:10.1002/hyp.10595
Pomeroy, J. W., and Gray, D. M. (1990). Saltation of snow. Water Resour. Res. 26, 1583–1594. doi:10.1029/WR026i007p01583
Quéno, L., Mott, R., Morin, P., Cluzet, B., Mazzotti, G., and Jonas, T. (2023). Snow redistribution in an intermediate-complexity snow hydrology modelling framework. EGUsphere. doi:10.5194/egusphere-2023-2071
Ragettli, S., Pellicciotti, F., Immerzeel, W. W., Miles, E. S., Petersen, L., Heynen, M., et al. (2015). Unraveling the hydrology of a Himalayan catchment through integration of high resolution in situ data and remote sensing with an advanced simulation model. Adv. Water Resour. 78, 94–111. doi:10.1016/j.advwatres.2015.01.013
Reynolds, D. S., Gutmann, E., Kruyt, B., Haugender, M., Jonas, T., Gerber, F., et al. (2023). The high-resolution intermediate complexity atmospheric research (HICAR v1.0) model enables fast dynamic downscaling to the hectometer scale. Geosci. Model Dev. 16, 5049–5068. doi:10.5194/gmd-2023-16
Reynolds, D. S., Pflug, J. M., and Lundquist, J. D. (2021). Evaluating wind fields for use in basin-scale distributed snow models. Water Resour. Res. 57, 28536. doi:10.1029/2020WR028536
Ross, D. G., Smith, I. N., Manins, P. C., and Fox, D. G. (1988). Diagnostic wind field modeling for complex terrain: model development and testing. J. Appl. Meteorol. 27, 785–796. doi:10.1175/1520-0450(1988)027<0785:dwfmfc>2.0.co;2
Schär, C., Leuenberger, D., Fuhrer, O., Lüthi, D., and Girard, C. (2002). A new terrain-following vertical coordinate formulation for atmospheric prediction models. Mon. Weather Rev. 130, 2459–2480. doi:10.1175/1520-0493(2002)130<2459:antfvc>2.0.co;2
Schirmer, M., Wirz, V., Clifton, A., and Lehning, M. (2011). Persistence in intra-annual snow depth distribution: 1. Measurements and topographic control. Water Resour. Res. 47, 9426. doi:10.1029/2010WR009426
Scipiõn, D. E., Mott, R., Lehning, M., Schneebeli, M., and Berne, A. (2013). Seasonal small-scale spatial variability in alpine snowfall and snow accumulation. Water Resour. Res. 49, 1446–1457. doi:10.1002/wrcr.20135
Sharma, V., Gerber, F., and Lehning, M. (2023). Introducing CRYOWRF v1.0: multiscale atmospheric flow simulations with advanced snow cover modelling. Geosci. Model Dev. 16, 719–749. doi:10.5194/gmd-16-719-2023
Sherman, C. A. (1978). A mass-consistent model for wind fields over complex terrain. J. Appl. Meteorology 17, 312–319. doi:10.1175/1520-0450(1978)017<0312:amcmfw>2.0.co;2
Silverman, N. L., Maneta, M. P., Chen, S. H., and Harper, J. T. (2013). Dynamically downscaled winter precipitation over complex terrain of the Central Rockies of Western Montana, USA. Water Resour. Res. 49, 458–470. doi:10.1029/2012WR012874
Skamarock, W. C., and Klemp, J. B. (2008). A time-split nonhydrostatic atmospheric model for weather research and forecasting applications. J. Comput. Phys. 227, 3465–3485. doi:10.1016/j.jcp.2007.01.037
Steger, C. R., Steger, B., and Schär, C. (2022). HORAYZON v1.2: an efficient and flexible ray-tracing algorithm to compute horizon and sky view factor. Geosc. Model Dev. 15, 6817–6840. doi:10.5194/gmd-15-6817-2022
Stoelinga, M. T., Stewart, R. E., Thompson, G., and Thériault, J. M. (2013). Microphysical processes within winter orographic cloud and precipitation systems. Berlin, Germany: Springer, 345–408. doi:10.1007/978-94-007-4098-3_7
Sturm, M., Goldstein, M. A., and Parr, C. (2017). Water and life from snow: a trillion dollar science question. Water Resour. Res. 53, 3534–3544. doi:10.1002/2017WR020840
Vionnet, V., Marsh, C. B., Menounos, B., Gascoin, S., Wayand, N. E., Shea, J., et al. (2021). Multi-scale snowdrift-permitting modelling of mountain snowpack. Cryosphere 15, 743–769. doi:10.5194/tc-15-743-2021
Vionnet, V., Martin, E., Masson, V., Guyomarc’H, G., Naaim-Bouvet, F., Prokop, A., et al. (2014). Simulation of wind-induced snow transport and sublimation in alpine terrain using a fully coupled snowpack/atmosphere model. Cryosphere 8, 395–415. doi:10.5194/tc-8-395-2014
Vionnet, V., Martin, E., Masson, V., Lac, C., Naaim Bouvet, F., and Guyomarc’h, G. (2017). High-resolution large eddy simulation of snow accumulation in alpine terrain. J. Geophys. Res. Atmos. 122, 26947. doi:10.1002/2017JD026947
Viviroli, D., Archer, D. R., Buytaert, W., Fowler, H. J., Greenwood, G. B., Hamlet, A. F., et al. (2011). Climate change and mountain water resources: overview and recommendations for research, management and policy. Hydrology Earth Syst. Sci. 15, 471–504. doi:10.5194/hess-15-471-2011
Wicker, L. J., and Skamarock, W. C. (2002). Time-splitting methods for elastic models using forward time schemes. Mon. Weather Rev. 130, 2088–2097. doi:10.1175/1520-0493(2002)130<2088:tsmfem>2.0.co;2
Winstral, A., Jonas, T., and Helbig, N. (2017). Statistical downscaling of gridded wind speed data using local topography. J. Hydrometeorol. 18, 335–348. doi:10.1175/JHM-D-16-0054.1
Keywords: dynamical downscaling, complex topography, snow-atmosphere interactions, snow processes, snow hydrology
Citation: Berg J, Reynolds D, Quéno L, Jonas T, Lehning M and Mott R (2024) A seasonal snowpack model forced with dynamically downscaled forcing data resolves hydrologically relevant accumulation patterns. Front. Earth Sci. 12:1393260. doi: 10.3389/feart.2024.1393260
Received: 28 February 2024; Accepted: 10 May 2024;
Published: 04 June 2024.
Edited by:
Alun Hubbard, University of Oulu, FinlandReviewed by:
Juraj Parajka, Vienna University of Technology, AustriaRensheng Chen, Chinese Academy of Sciences (CAS), China
Copyright © 2024 Berg, Reynolds, Quéno, Jonas, Lehning and Mott. This is an open-access article distributed under the terms of the Creative Commons Attribution License (CC BY). The use, distribution or reproduction in other forums is permitted, provided the original author(s) and the copyright owner(s) are credited and that the original publication in this journal is cited, in accordance with accepted academic practice. No use, distribution or reproduction is permitted which does not comply with these terms.
*Correspondence: Rebecca Mott, mott@slf.ch; Justine Berg, bergjus94@gmail.com