Sedimentary architecture of thin-layer beach bar sand bodies in the G oilfield, Niger
 Jianing Wang
 Cheng Lei2
  Zhenhua Xu
- 1School of Earth Sciences, Yangtze University, Wuhan, Hubei, China
- 2Research Institute of Petroleum Exploration and Development, Beijing, China
- 3School of Earth Science and Technology, China University of Petroleum, Beijing, Beijing, China
The G oilfield in the southeastern Termit Basin of Niger is characterized by thin-bed beach bar deposits exhibiting strong reservoir heterogeneity and suboptimal production efficiency, necessitating internal structural dissection of the beach bar sand bodies. Employing a well-seismic integration approach, we systematically dissect the architecture of these sand bodies layer by layer to determine their spatial distribution. A classification scheme for beach bar architecture is proposed, with core and log data analysis identifying essential architectural elements and their logging responses. Seismic amplitudes, thin bed delineation, frequency decomposition inversion attributes, and attribute fusion technology delineate the architectural boundaries. Integrating five indicators from four-level architectural recognition at wellbores—shallow lake mudstone appearance, bar margin/beach microfacies occurrence, logging curve morphology differences, beach bar thickness variations, and elevation differences between adjacent bars—enables detailed dissection of the beach bar architecture, corroborated by connectivity analysis. In the study area, beach bar distribution primarily develops in two modes: vertical stacking (accumulation of multiple main bars from different episodes) and isolated (stable mudstone interlayers between main bar sand bodies appearing relatively isolated). This research provides a basis for dissecting beach bar architecture reservoirs under sparse well conditions.
1 Introduction
Beach-bar sand bodies are formed by the reworking and redeposition of sandy sediments carried along the periphery of lakes under the influence of hydrodynamic forces such as waves and lake currents (Jiang et al., 2015; Qiu et al., 2022). Comprising two types, beach and bar (Zhu et al., 1994), they represent a significant sedimentary type in lakes. Due to their geological conditions favoring proximity to oil sources, well-developed source-reservoir-cap rock combinations, and conducive conditions for oil and gas accumulation, they can give rise to sizable oil and gas fields (Zhang, 2012). Beach-bar reservoirs have been identified in various locations globally, including the Uinta Basin in the United States, Melut Basin in South Sudan, and the Bohai Bay Basin, Dongying Sag, Junggar Basin, and Tarim Basin in China, resulting in substantial research outcomes (Guan et al., 2021; Hou et al., 2022). Many scholars have conducted in-depth research on beach-bar sand bodies, exploring aspects such as genetic mechanisms (Di Celma et al., 2020), sedimentary environment (Aleman et al., 2015), and patterns (Yin et al., 2021). Significant achievements have been made in the classification of beach-bar sand bodies, the distribution patterns of sand bodies, as well as the geological significance and reservoir characteristics of oil and gas in beach-bar sand bodies.
In recent years, successful advancements have been made in reservoir architecture research, particularly in the detailed dissection and prediction of sand body distribution in continental reservoirs. From fluvial environments (Yue et al., 2008; Hu et al., 2017; Zhou et al., 2017; Wang et al., 2022) to deltaic environments (Feng et al., 2018; Ren et al., 2022), fan-delta environments (Lin et al., 2013; Sun et al., 2017; Shang et al., 2020), and alluvial fan environments (Yi et al., 2010; Zhang et al., 2023), researchers have delved into various settings. In the detailed dissection of beach-bar reservoirs, Shang et al. dissected the architecture of beach-bar sand bodies based on dense well networks, core data, and identified six signs for recognizing individual bars. They elucidated the distribution patterns of three types of individual bars: lateral migrating, vertically superimposed, and isolated. Building on this, the internal architecture of individual bars was dissected, and predictions were made for interbedded distributions within the bars, providing a systematic analysis method for beach-bar architecture dissection. Xia et al., based on drilling and core data, analyzed the relationship between the morphology of beach-bar sand bodies and reservoir characteristics, summarizing three types of beach-bar sand body morphologies: rock type extinction within a single sand body, isolated single sand body, and physical property masking. They clarified that within the bars, the main oil-bearing architecture unit is the beach-bar.
The G oil field in Niger is situated in the central Agadam block of the Termit Basin. Drilling data indicates beach-bar deposition in this block, with thin thickness of beach-bar sand bodies, rapid variations in reservoir lithology, and complex distributions of reservoirs and fluids. Due to sparse well networks, large well spacing, and deep burial of reservoirs, accurately predicting the architecture units of subsurface beach-bar reservoirs solely relying on well data is challenging. How to accurately characterize beach-bar sand bodies has become a significant issue in oil field development. This paper addresses this challenge by employing seismic data fusion methods to determine the macroscopic architecture unit’s planar distribution boundaries of beach-bar sand bodies. Building on this, detailed characterizations of beach-bar sand bodies and their internal structural units were conducted using well logging data. The well-seismic fusion achieved a refined dissection of the structural elements of beach-bar sand bodies. Utilizing connectivity analysis results for validation, a set of thin-layer beach-bar well-seismic fusion dissection technologies was established, laying the foundation for the efficient development of the G oil field in Niger. Additionally, it provides technical references for similar block dissections of beach-bar reservoirs.
2 Geological setting
Geographically, the Termit Basin is located in the southeastern region of the Republic of Niger, within the Sahara Desert hinterland (Figure 1). It stands as a prominent oil and gas basin within Niger’s borders. Positioned on the western side of the central Agadem block within the Termit Basin, the G oilfield is a noteworthy hydrocarbon-bearing fault block. It stretches in a northwest-southeast direction, forming an elongated structure with an area of 72 km2.
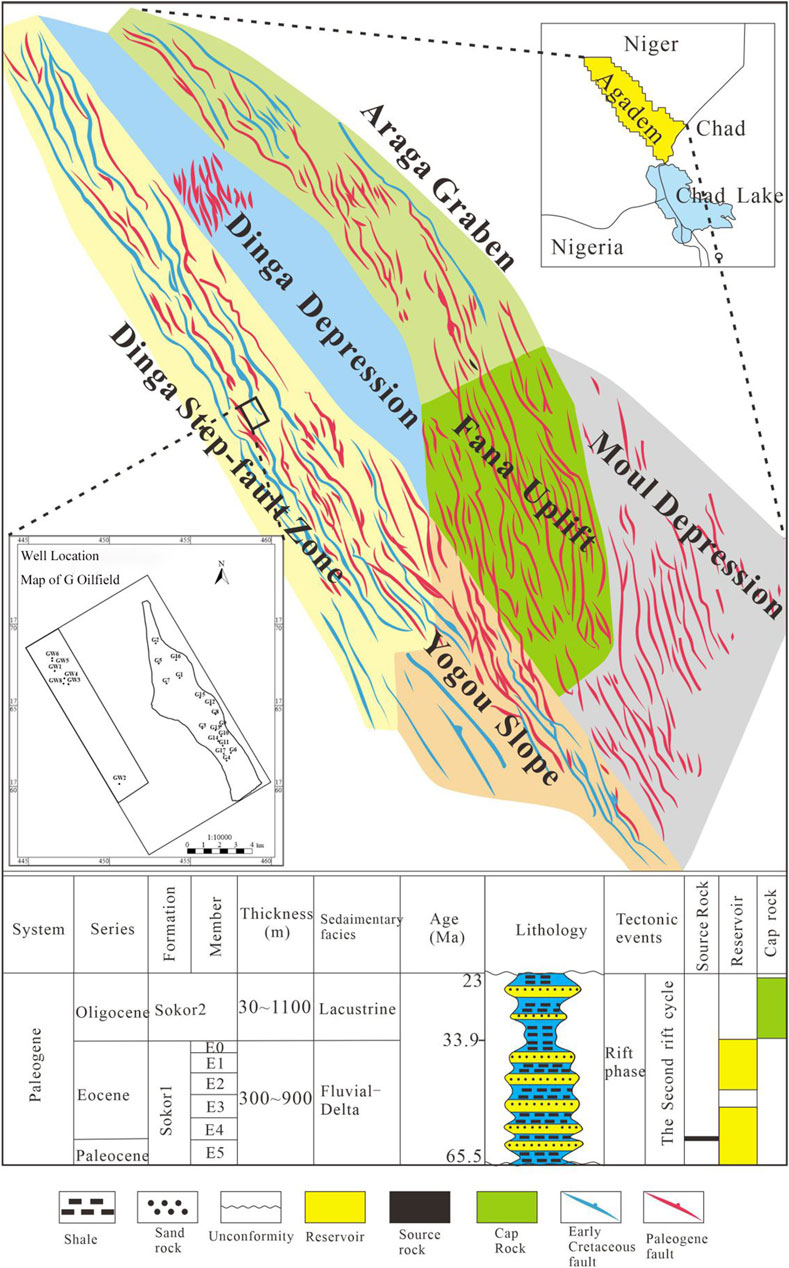
Figure 1. Structural location and stratigraphic column of G Oilfield, Niger.
During the Early Paleogene to Oligocene, the Termit Basin experienced two phases of rifting, with the sedimentation period of the G oilfield occurring during the early phase of rifting (Yuan et al., 2023). In this early rifting phase, the Sokor Formation’s first segment primarily witnessed the development of river delta, nearshore lake, and semi-deep lake to deep lake sediments. The G oilfield, positioned predominantly at the far end of the deltaic margin, belongs to the favorable facies belt of nearshore lake beach bar. The predominant source direction is southwest, characterized by quartz-rich fine to medium sandstone, fine sandstone, siltstone, and shale. The reservoirs mainly consist of intergranular permeability, with the development of both high porosity and high permeability reservoirs, while low porosity and low permeability reservoirs are relatively less common. The lithology displays interbedded sandstone and mudstone, with a maturity level ranging from low to medium. The primary reservoir space type is dominated by primary porosity, followed by intergranular dissolution pores, with sedimentary processes playing a crucial role in reservoir development. The primary oil-bearing interval in the G oilfield is the Sokor 1 segment, which, based on depositional cycles, can be further subdivided into E0, E1, E2, E3, E4, and E5, comprising a total of six stratigraphic units. Among these, E1 to E5 represent five oil-bearing units, while E0 at the top consists of mudstone. E1 and E2 layers constitute the main oil-bearing sequences in the G oilfield, with smaller-scale oil reservoirs distributed in E3 and E0 layers.
3 Beach bar sand body architecture division
3.1 Beach bar architecture interface division
The architecture interface refers to a series of stratigraphic contact surfaces with different hierarchical levels, based on which the strata can be divided into stratigraphic blocks of different levels with causal relationships (Wu et al., 2021). The identification of architecture interfaces is the foundation for reservoir architecture studies (Wang et al., 2019). In the study area, the predominant sedimentary type is beach bar, and beach bar sand bodies undergo frequent migration and oscillation during their development due to source, hydrodynamic changes, and periodic fluctuations in lake levels. Considering the study area’s conditions, definitions of architecture levels, and detailed stratigraphic correlations, we establish the architecture unit division scheme for the G oilfield in Niger (Table 1). The beach bar sedimentation in the G oilfield is classified into composite beach bar sedimentation at a layer scale, single episode beach bar sedimentation at a single layer level, single microfacies within the beach bar, and single intra-bar accretion sand bodies (corresponding to Miall’s architecture system levels 6 to 3) (Andrew, 1985). In this paper, the 6th-level architecture interface is considered the boundary between composite beach bar sediment bodies and surrounding rocks, representing composite beach bar sand bodies. The 5th-level architecture interface represents the boundary of single episode beach bar sediment bodies, representing single episode beach bar sand bodies. The 4th-level architecture interface marks the boundary of a single microfacies within the beach bar, corresponding to the architecture unit of a single microfacies within the beach bar. The 3rd-level architecture interface is the interface of a single bar’s internal accretion body, corresponding to the architecture unit of accretion body within a single bar. Vertically, each composite beach bar consists of multiple single episode beach bars, and each single episode beach bar comprises various sedimentary microfacies. Intervals between single episode beach bars of different periods are filled with lacustrine mud, forming stable interlayers vertically. Proliferations only exist within the bar body, separated by muddy or calcareous interbeds. As the 5th-level architecture interface defines single episode beach bar sand bodies as composite bodies, which makes it challenging to reflect the internal architecture characteristics of the reservoir, the distribution range of the 3rd-level architecture interface is limited to the intra-bar area. Its thickness is thin and constrained by the core data in this study. Guidance on the division of the 3rd-level architecture in the G oilfield can be drawn from previous studies (Shang et al., 2014) on the dissection of beach bar 3rd-level architecture. Within the beach bar single microfacies constrained by the 4th-level architecture interface, the main bar has the best physical properties and is a single-genetic sand body, representing a favorable reservoir for remaining oil. It can be effectively identified and divided based on existing data. Therefore, the focus of this study is to identify and clarify the distribution characteristics of the main bar sand body within the composite beach bar sand body.
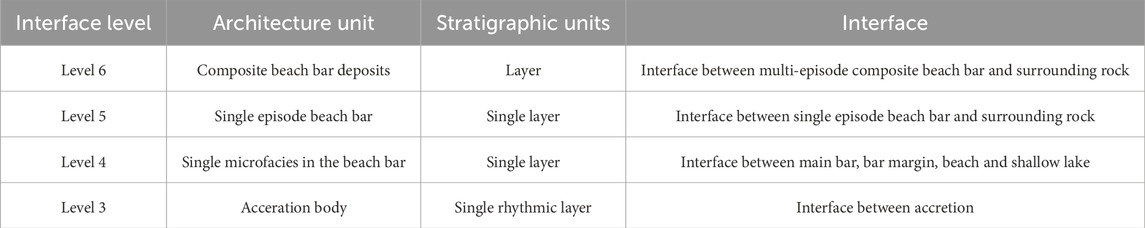
Table 1. Boundary classification of reservoir architectural units with different scales in beach bar.
3.2 Types and characteristics of beach bar architecture elements
Upon determining the architecture interface division scheme, the identification of beach bar architecture elements can be carried out through core and well logging data. This involves establishing the electrical response characteristics of architecture elements and interfaces, achieving the recognition and division of individual well architecture elements. This process lays the foundation for the spatial distribution analysis of architecture elements and the analysis of overlay patterns. Through core observations and calibration of well logs, combined with conventional well logging features, the study summarizes the sedimentary microfacies types and characteristics within the research area. In the G Oilfield, beach bar deposition can be classified into bar sand deposition and beach sand deposition, with bar sand deposition further categorized into main bars and bar margins (Table 2).
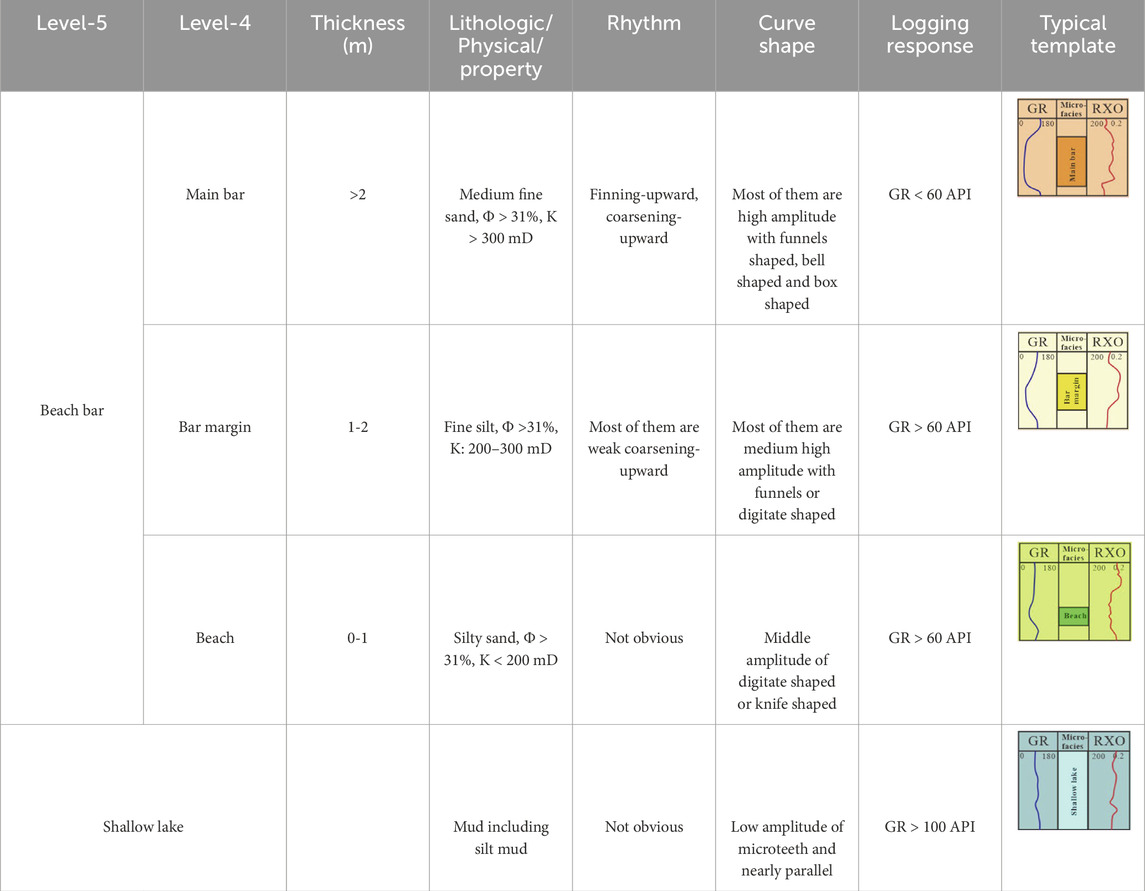
Table 2. Logging interpretation template for architecture units.
The logging characteristics of the main bar microfacies include a low natural gamma-ray value (GR < 60 API), a negative natural potential anomaly with generally larger amplitudes, higher resistivity (RD > 20 Ω m), and typical box-shaped or funnel-shaped curve features, occasionally exhibiting a bell-shaped curve. The curves are smooth, indicating strong hydraulic dynamics and sufficient sediment supply. The main composition is medium to fine sandstone, displaying typical low-angle crossbedding, occasional thin gravel layers (1–2 cm thick). The thickness of a single main bar body is generally more than 2 m, located in the upper part of the sand body, with good physical properties, primarily characterized by primary pores and a few fractures, typically representing oil reservoirs.
The logging characteristics of the bar margin microfacies include a medium to low natural gamma-ray value (GR > 60 API), a negative natural potential anomaly with a lesser degree than the main bar, and relatively high resistivity (RD ∈ [12, 20] Ω.m). The curve exhibits a higher frequency, low amplitude notched box or bell shape, indicating unstable sediment supply. The predominant composition is fine to silty sandstone, displaying typical ripple bedding, common bioturbation, and insect holes. The thickness of a single bar margin is generally around 1–2 m, located at the top or bottom of the sand body. While the porosity is comparable to the main bar, the permeability is lower, often representing non-productive layers.
The logging characteristics of the beach microfacies include a medium natural gamma-ray value to a low natural gamma-ray value (GR > 60 API), a negative natural potential anomaly, and relatively high resistivity (RD ∈ [8, 15] Ω.m). The curve exhibits minor notches, teeth, or finger shapes. The predominant composition is fine sandstone, with occasional sandy mudstone and muddy sandstone. Vertically, it is characterized by thin interbeds of sandy mudstone. It displays typical ripple bedding, common bioturbation, and insect holes. The thickness of a single beach sand is generally around 0.1 m, located at the top or bottom of the sand body, with comparatively poor physical properties.
The logging characteristics of the nearshore shallow lake mud include a high natural gamma-ray value (GR > 100 API), either no negative or positive natural potential anomaly, and low resistivity (RD < 8 Ω m). The curve exhibits minor notches. It represents pure mudstone or carbonaceous mudstone.
4 Beach bar architecture dissection
In the study area, there are a total of 25 wells with uneven spacing and a sparse well network, resulting in limited data availability. Conducting reliable reservoir dissection solely based on well logging data is challenging. The seismic main frequency in the target block is 30 Hz, with limited vertical resolution. However, there is dense lateral sampling, effectively compensating for the shortcomings of well logging in predicting the planar distribution, extension, orientation, and position of beach-bar sand bodies between wells. Additionally, the seismic effective bandwidth is 0–60 Hz, making it suitable for identifying the spatial distribution of beach-bar sand bodies through frequency division. This has led to a specific approach for dissecting beach-bar sand bodies in the study area: (1) Utilizing seismic inversion to enhance seismic resolution, simultaneously selecting diverse seismic attributes, and generating seismic attribute slices. By merging these slices through the fusion of seismic attributes, predicting the planar distribution of unconditioned architecture units. Integrating well logging data to ensure alignment between architecture predictions and well conditions, forecasting intricately layered composite bar sands at a layer level (sixth-level architecture), and delineating the planar characteristics of fifth level and fourth level architecture. (2) Building upon the study of architecture unit distribution, integrating seismic results and well logging data. Employing methods such as vertical staging and lateral demarcation to dissect individual sand bodies in the study area. Predicting the distribution of architecture units within the reservoir.
4.1 Seismic attribute fusion for identifying beach bar boundaries
The seismic attribute analysis encounters challenges in accurately capturing the comprehensive characteristics of reservoirs (Yue et al., 2022). To overcome these limitations, a method of seismic attribute fusion is employed by selectively choosing one or several attributes most sensitive to the target reservoir. Through mathematical operations, various seismic attributes are fused together to reflect geological features comprehensively and reliably, leveraging the physical significance of different attributes (Li et al., 2015). For the studied block, seismic attribute fusion is utilized to predict the planar distribution of architecture units and enhance vertical resolution. Before the fusion process, seismic attributes are carefully selected. In this study, based on the characteristics of seismic data in the research area, three seismic attributes—amplitude, thin layer identification, and frequency division inversion (Xie et al., 2023)—are preferred. Amplitude is sensitive to thick and laterally continuous sand bodies in the vertical direction but less effective in identifying thin-layered sand bodies. Thin layer identification is based on the oscillation of instantaneous frequency to capture local information, reflecting changes in adjacent reflection phase axes. While effective in identifying thin-layered sand bodies, it performs poorly in recognizing superimposed thick-layered sand bodies. Seismic frequency division inversion leverages different frequency information in seismic data, providing better insights into sand bodies at different scales. Analysis of single-frequency band data in the research area reveals that seismic attributes at 10 Hz reflect the distribution of relatively thick superimposed sand bodies. Attributes at 30 Hz can to some extent simultaneously reflect the distribution of both thick and thin-layered sand bodies, while attributes at 60 Hz primarily depict the distribution characteristics of thin-layered sand bodies (Figure 2). In this study, the three central frequency bands of 10 Hz (Figure 2A), 30 Hz (Figure 2B), and 60 Hz (Figure 2C) are employed for wavelet frequency division of the original seismic data, ensuring the completeness of seismic information while enhancing resolution. However, due to the influence of the terrain and seismic data in the research area, there is a certain impact on predicting sand bodies in areas without wells, and inversion results may contain errors. Considering the strengths and weaknesses of these three attributes, they are fused using the RGB fusion method, aiming to capitalize on their respective advantages and compensate for their limitations. This approach aims to reflect the distribution characteristics of different architecture units.
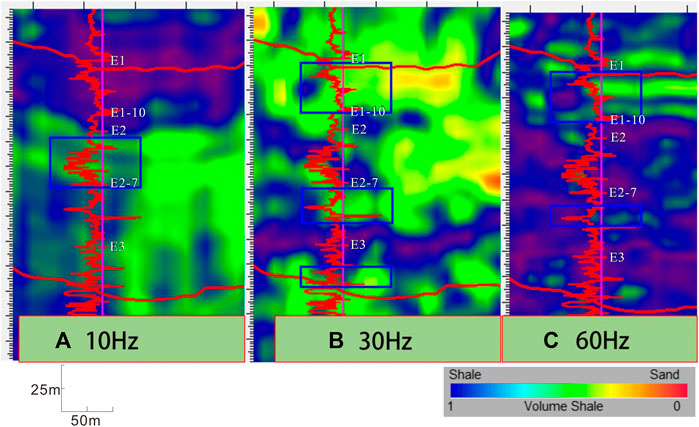
Figure 2. GR log of G3 well correlated with seismic attributes at 10 Hz (A), 30 Hz (B) and 60 Hz (C).
The seismic fusion slices consist of four colors: red, green, blue, and black. The red, blue, and green regions respectively reflect high attribute values of seismic amplitude (>8,000, thick sand bodies), thin layer detection (>300, thin sand bodies), and frequency division inversion (<85, thick-thin sand bodies). The black region reflects the common low values of the three attributes. The fusion results of these three attributes can effectively capture the macroscopic distribution characteristics of beach-bar sand bodies, while the black region primarily represents the distribution of shallow lake mud (Figure 3). Taking the E2-9 layer as an example, the development of beach-bar sand bodies in this layer is relatively high, and shallow lake mud is mainly distributed in the western and northern regions of the study area, both reflected in the RGB fusion slice. In the fusion slice, the overlap of red and green areas mainly reflects the deposition of bar sand. For instance, the development of four lens-shaped bar sand deposits near the northern part of the E2-9 layer is well represented in the RGB fusion slice. The boundaries of bar sand are clearly delineated, and the limits between the four adjacent bar sands are distinct. The beach sand, as a thin layer around the bar sand and a more continuous sand body, is primarily reflected by the overlap of blue and green areas in the RGB fusion slice, providing a good representation on the plane. Based on seismic slices and in conjunction with the well-based interpretation of architecture units and the development model of beach-bar patterns (Han et al., 2016), the overlaid planar distribution of beach-bar sand bodies for each layer is predicted.
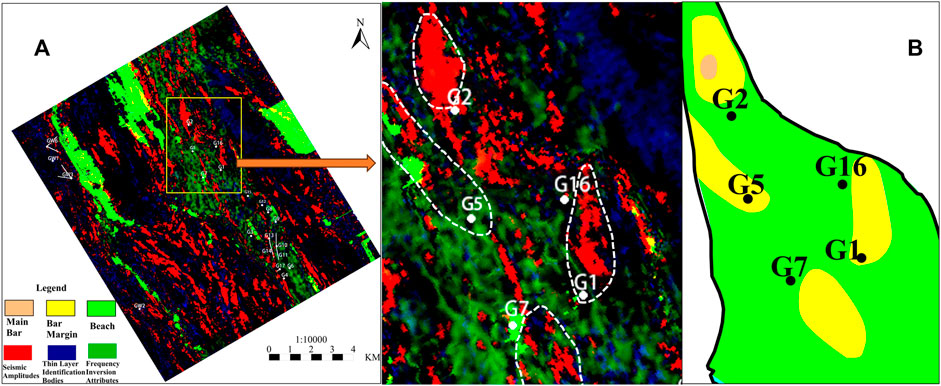
Figure 3. Seismic RGB fusion slice (A) and architecture plan (B) of the E2-9 layer.
4.2 Well logging-based architecture distribution determination
Drawing from the sedimentary evolution of bars and the superposition relationships of sand bodies, and utilizing seismic attribute fusion in conjunction with well logging data, we applied the ‘vertical staging, lateral delineation’ method to articulate five key identification indicators for architecture units, as illustrated in Figure 4.
(1) Appearance of shallow lake mudstone: Based on the formation model of bars, the deposition of a bar leads to a local topographic uplift, and a trough appears behind the bar where low-energy conditions prevail. Fine-grained mud sediments filled in this trough form inter-bar mudstones. The appearance of shallow lake mudstone indicates the outer side of the bar and is an important sign for determining the boundary of composite bars. For example, in Figure 4A, between the bar bodies of well G8 and well G10, there is inter-bar mud.
(2) Appearance of bar margin/beach microfacies: Based on the formation model of bars, waves undergo a series of changes when propagating to the gentle slope zone due to topographical influences. Sand bars form at the breaker lines and shorelines where sediment is concentrated, while beaches mainly occur in the wave shoal zone, wave rebound zone, and surf backflow zone. Bar margin/beach microfacies can be used to identify the edges of bars and are characterized by a belt-shaped distribution around the main bar. According to the pattern in this study, the beach is the outer edge of the bar, and the bar margin is the inner edge of the bar, both of which can serve as indicators for determining lateral boundaries. Figure 4B shows changes in sedimentary facies between wells G2, G16, and G1.
(3) Differences in well logging curve morphology: In different parts of a single bar, the sedimentary environment and sedimentary cycles have some similarities, and there are also similarities in well logging curve morphology. If there is a significant difference in the morphology of well logging curves between adjacent wells, it can be determined that they belong to different bar depositions, thus delineating the lateral boundaries of bars. In Figure 4C, wells G8 and G9 are adjacent, and bars develop in the same formation. However, the well logging curves of the two wells in the same formation show significant differences in morphology, indicating two separate bars.
(4) Thickness differences in the development of bars: In different parts of bars, the sedimentary thickness should gradually decrease uniformly from the main bar towards the periphery, transitioning gradually from the main bar to the bar margin, beach, and shallow lake mud. There should be no sudden thickening or thinning. At the same time, the most obvious difference between the main bar, bar margin, and beach is also reflected in the thickness of the sand bodies. In Figure 4D, two bars of the same layer show a sudden change in thickness, indicating two separate bars.
(5) Elevation differences between adjacent bar bodies: In a fine-scale comparison framework, the top and bottom surfaces of finely subdivided layers represent isochronous surfaces, and in high-energy environments such as wave and lake flow action, the strata quickly “fill and level.” Isochronous surfaces are almost consistent with isobaths. If there is a significant difference in elevation between the bottom surfaces of two adjacent bar bodies, reflecting their inconsistent sedimentation times, it is highly likely that they do not belong to the same sand bar. Therefore, when there is a significant elevation difference in the sand body bottom between two neighboring wells, it can be used as an indicator to judge that the sand bodies belong to different periods (Figure 4D).
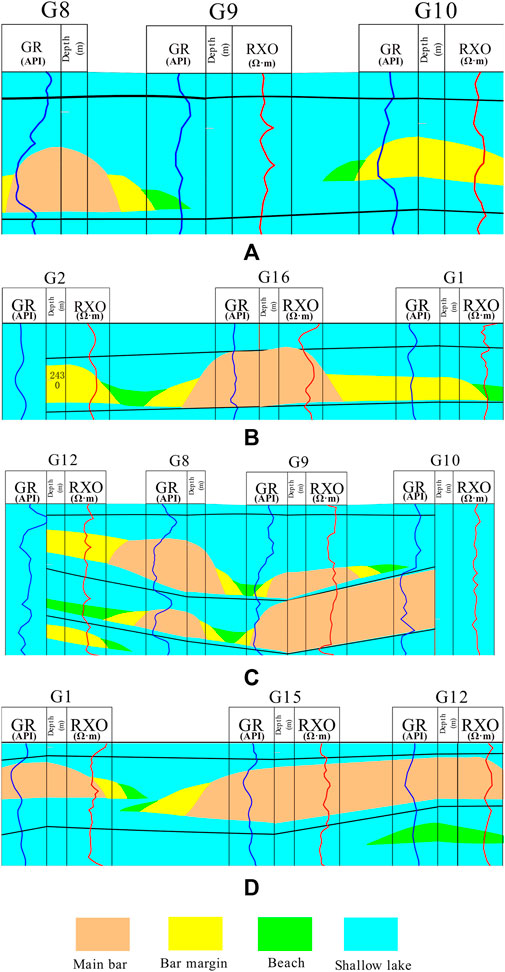
Figure 4. Identification criteria for single main bar in G oilfield. (A) Appearance of shallow lake mudstone; (B) Appearance of bar margin/beach microfacies; (C) Differences in well logging curve morphology; (D) Thickness differences in the development of bars; Elevation differences between adjacent bar bodies.
5 Beach bar reservoir architecture distribution characteristics
5.1 Sedimentary patterns of beach bar
Using the above-mentioned methods, an analysis was conducted on the E2-9 beach-bar reservoir (Figure 5). E2-9 can be divided into two episodes: E2-9-1 and E2-9-2. Along the AA’ profile and combining the planar development characteristics of the beach-bar, a consensus was reached, identifying 4 beach-bar episodes, 10 individual bars, and 6 main bars. E2-9-1 represents the first episode of the E2-9 layer, developing 2 single-episode beach-bars, 7 individual bars, and 3 main bars. The main bars are concentrated near wells G3, G14, G17, and G4. The internal beach-bars in this single layer exhibit a banded distribution with a northwest-southeast orientation. Along the AA’ profile, 2 beach-bar episodes and 2 individual bars are developed, with no main bars. Stable nearshore mud is deposited between the two beach-bar episodes, and the boundary between the two episodes lies between wells G15 and G1.
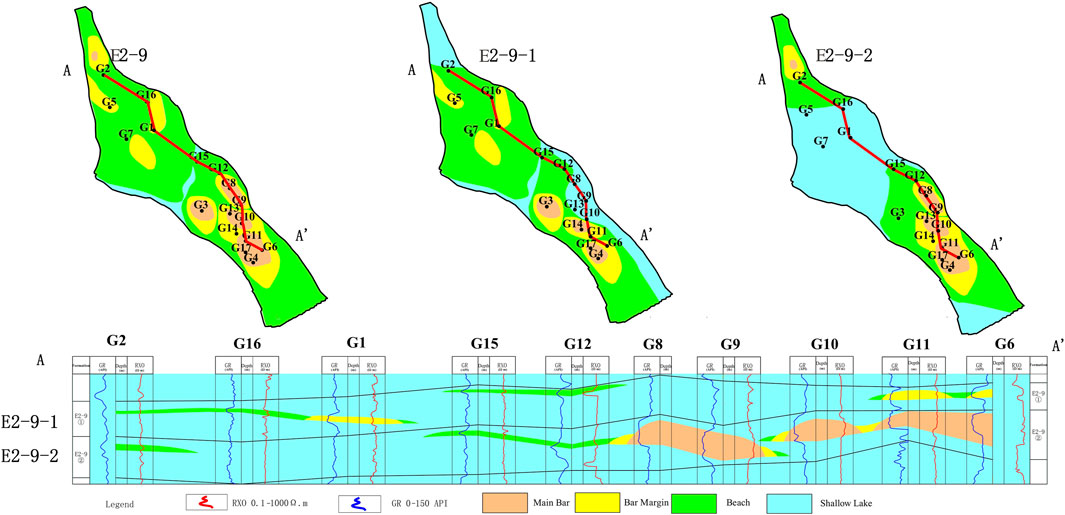
Figure 5. Results of the dissection for the E2-9 layer.
The single layer E2-9-2 represents the second episode of the E2-9 layer, developing 2 single-episode beach-bars, 3 individual bars, and 4 main bars. Among the 3 individual bars, two of them each develop a main bar, while the other individual bar hosts the development of two main bars. Internally, the beach-bars in this single layer exhibit a banded and lens-shaped distribution with a northwest-southeast orientation. Along the AA’ profile, 2 beach-bar episodes, 2 individual bars, and 3 main bars are developed. Notably, the main bars developed in well G9 and well G10 each occur on different individual bars, while the main bars in G10 and G11 co-develop on a single individual bar.
5.2 Connectivity analysis
To validate the sand body architecture results of the E2-9-2 single layer, considering the connectivity analysis results (Figure 6), G6 well, an oil production well within the G oilfield, is adjacent to other oil production wells, including G4, G10, G11, G14, and G17. Based on this, an architecture grid map for the E2-9 and E2-10 layers was established (Figure 6). Inter-well water absorption tests were conducted on G6 well, and the results showed that the main water-absorbing layers in G6 well were the E2-9-2 single layer and E2-10-1 single layer, with water absorption intensities of 77.12% and 11.66%, respectively. The water absorption intensity of other layers was 0. According to the architecture anatomy results, G6 well is connected through the main bar sand body with G4, G17, and G11 wells in the E2-9-2 single layer, and it is connected to G10 well through the bar margin sand body. The main bar is the best reservoir microfacies type within the beach bar, indicating good sand body connectivity and high water absorption intensity between these wells, consistent with the architecture anatomy results.

Figure 6. Well distribution map of E2-9-2 and grid pattern of E2-9 and E2-10 well group.
At the same time, the relationship between the daily oil production of individual wells and the maximum permeability of the perforation interval, single sand body thickness, and overlapping sand body thickness was statistically analyzed (Figure 7). The results show a strong positive correlation between daily oil production, maximum permeability of the perforation interval (Figure 7A), and single sand body thickness (Figure 7B). There is no significant correlation with the thickness of overlapping sand bodies (Figure 7C). This further supports the conclusion that the main bar is the primary oil-bearing architecture unit.
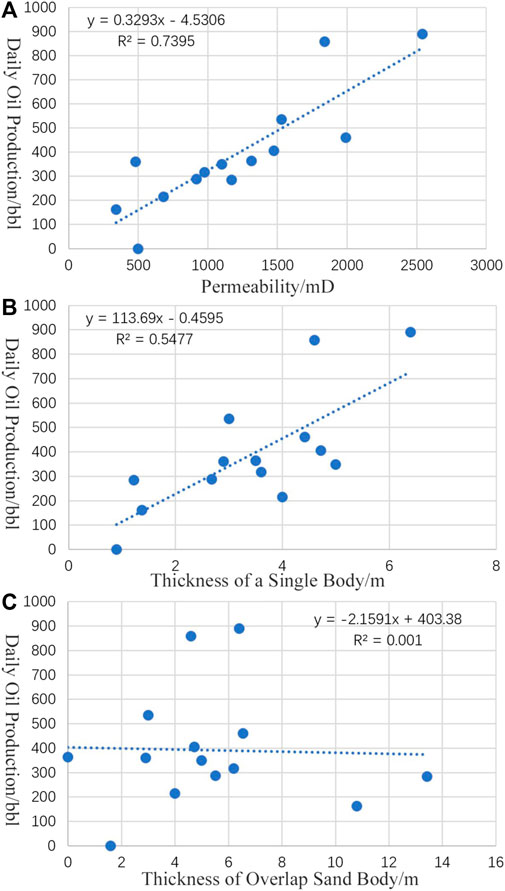
Figure 7. Daily oil production correlation diagram: max permeability (A), single sand body thickness (B), and overlapping sand bodies thickness (C) in perforation interval.
5.3 Quantitative parameter analysis of beach bar architecture elements
Building on the detailed subdivision of the main bars within the G oilfield, the dimensions of the sand bars (including main bars and bar margins) were statistically analyzed (Figure 8). The length of the sand bars mostly ranged from 1,000 to 3,000 m, with an average of 2,000 m; the width varied from 500 to 1,000 m, with an average of 700 m. The length-to-width ratio was mostly between 1 and 4, averaging 2.5. There is a certain linear positive correlation between the length and width of the sand bars, while there is no apparent correlation between width and thickness.
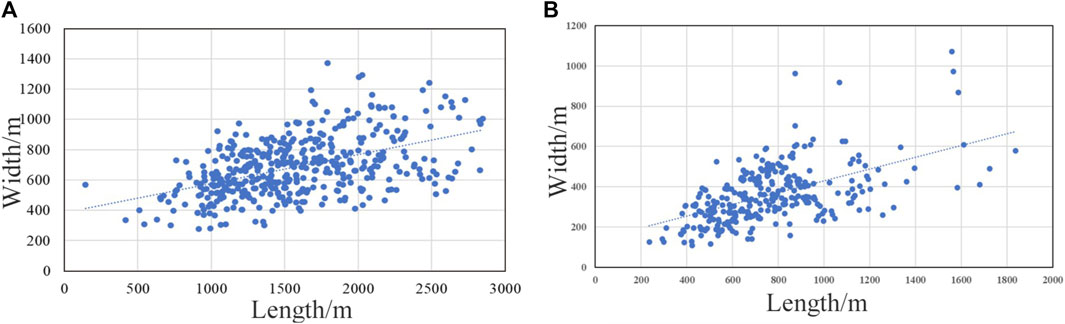
Figure 8. Length-width relationship of sand bars (A) and main bars (B) in G Oilfield.
The main bars were relatively smaller, with lengths mostly ranging from 500 to 1,000 m, averaging about 700 m; widths ranging from 200 to 400 m, averaging about 300 m; and thickness exceeding 2 m, averaging about 4 m. The length-to-width ratio of the main bars was mostly between 1 and 3, averaging 2. There is a certain linear positive correlation between the length and width of the main bars, while there is no apparent correlation between width and thickness.
6 Beach bar architecture element distribution patterns
By characterizing the sand body features of the reservoir architecture in G Oilfield on both the plan view and the profile, and referring to previous studies (Xia et al., 2019) on the contact styles of single sand bodies in sand bars, the spatial distribution patterns of the main sand bars in G Oilfield were summarized into two types: vertical stacking type and isolated type (Figure 9).
(1) Vertical Stacking Type: This involves the vertical accumulation of multiple single main bars from different periods. Most of these main bars are well developed, with significant thickness. They exhibit continuous vertical stacking. This type is mainly distributed in the E1-1 to E1-4 oil groups and E2-4 to E2-8 oil groups. Based on previous research, the main development periods of the sand bar system in a rift basin are during the early rifting and fault transition periods. During these periods, tectonic movement is relatively stable, and the impact of faulting is weaker. The paleogeomorphology is relatively gentle, favoring the formation of sand bar bodies (Lin et al., 2010). Additionally, influenced by the base-level cycle, when the base level is lower, the water body is shallower, promoting the development of sand bars. G Oilfield is mainly developed in the Sokor1 group, which is the initial faulting period, providing a good foundation for the development of sand bar reservoirs in G Oilfield.
(2) Isolated Type: This involves the development of stable mudstone interlayers between main sand bars, presenting a relatively isolated spatial pattern. Laterally and vertically, it usually exhibits poor connectivity in the vertical direction due to episode changes causing poor vertical connectivity between multiple periods of sand bars. This type is mainly influenced by the ancient water depth. Due to deeper water bodies and higher base levels, most of the source materials are below the wave base and are less affected by lake waves, thereby limiting the development of sand bar bodies. Typically, this type exhibits smaller and scattered distributions of main sand bars.
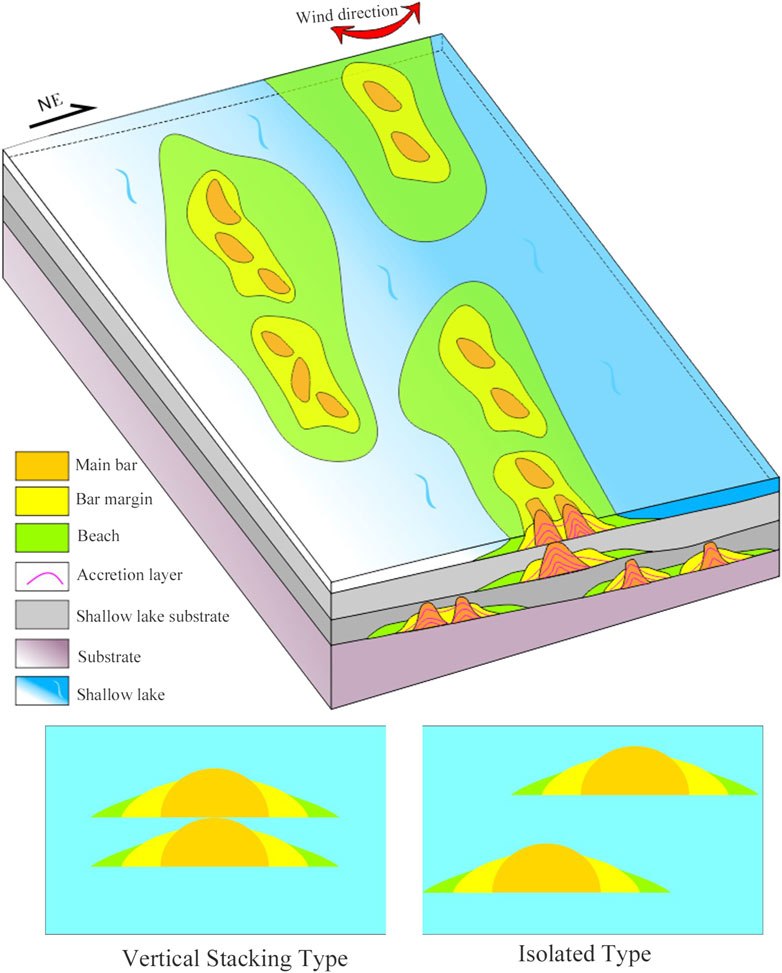
Figure 9. Distribution model of beach bar sand bodies in G oilfield.
7 Discussion
This study employed a well-seismic integrated dissection method specifically tailored for thin-layer beach-bar sand bodies, resulting in a detailed characterization and the development of a thin-layer beach-bar well-seismic fusion dissection technique. In previous studies (Shang et al., 2014) on the distribution of beach-bar sand bodies, researchers primarily relied on the combination of abundant well data and core information to depict the spatial distribution. However, in cases with a limited number of wells, there has been a relative lack of corresponding research support. The innovation of this paper lies in the establishment of an architecture dissection method suitable for sparse well networks and deeper burial conditions of beach-bar sand bodies. This method excels in predicting the spatial distribution of thin-layer beach-bar sand bodies with limited well data. It particularly focuses on the detailed characterization of the main bar sand bodies, highlighting their superior physical properties within the beach-bar sand bodies. This innovation provides a new perspective and feasibility for addressing the distribution of beach-bar sand bodies under similar geological conditions, holding significant implications for the efficient development of oil fields. However, it should be noted that the method has certain requirements for the quality of seismic data, and in practical applications, attention must be paid to the quality of seismic data to ensure the credibility of the architecture dissection results.
Simultaneously, in delineating the boundaries of composite beach bars and single bars, the seismic RGB fusion was employed in this study. During this process, amplitude, thin-layer identification, and frequency division inversion were selected as the seismic attributes, based on various factors such as the characteristics of the study area and seismic data. It is crucial to emphasize that these three attributes are not the sole options, as their selection depends on the differences in the study area and the diversity of seismic data. Therefore, future applications of this method in similar areas should carefully consider the characteristics of the specific study area and the quality of seismic data for optimizing seismic attributes, aiming to achieve more effective boundary recognition results in accordance with scientific paper standards.
8 Conclusion
This paper presents a scheme for the sedimentary architecture division of beach-bar sand bodies in the G oil field. The 6th-level architecture unit represents composite beach-bar deposition, the 5th-level unit signifies a single-episode beach-bar deposition, and the 4th-level unit indicates the individual microfacies within the beach-bar, including the main bar, bar margin, and beach sand bodies. The 3rd-level unit corresponds to the intra-main bar accretionary bodies. An interpretative template for the elements of beach-bar architecture has been established, forming a thin-layer beach-bar sand body architecture dissection technology using well-seismic fusion. The well-seismic fusion method was employed to identify beach-bar sand bodies, integrating amplitude, thin layer identification bodies, and frequency decomposition inversion attributes to identify the spatial distribution boundaries of individual beach-bars. Five identification indicators for the architecture units were summarized based on well logging data, determining the spatial distribution of the main bar, bar margin, and beach sand body architecture. The accuracy of the dissection was validated using connectivity analysis results. Quantitative analysis of the beach-bar architecture elements in the G oil field revealed that the length of the bar sands ranges mostly from 1,000 to 3,000 m, averaging around 2000 m. The width typically falls between 500 and 1,000 m, with an average of 700 m. The length-to-width ratio varies from 1 to 4, averaging at 2.5. The main bars tend to be smaller, with lengths ranging from 500 to 1,000 m and averaging around 700 m. Width falls mostly between 200 and 400 m, averaging around 300 m, and a thickness greater than 2 m, averaging about 4 m. The length-to-width ratio varies from 1 to 3, averaging at 2. Finally, the spatial distribution patterns of beach-bar architecture elements were summarized, indicating two main types: vertical superposition and isolated. During the initial faulting period, beach-bar sand bodies widely developed, influenced by the rotation of base level. When the base level is low, the primary development is vertical superposition, while at a higher base level, the main development is isolated.
Data availability statement
The datasets presented in this study can be found in online repositories. The names of the repository/repositories and accession number(s) can be found in the article/Supplementary Material.
Author contributions
JW: Methodology, Validation, Writing–original draft, Writing–review and editing. CL: Data curation, Writing–review and editing. YY: Data curation, Project administration, Validation, Writing–review and editing. ZX: Data curation, Formal Analysis, Methodology, Project administration, Supervision, Validation, Writing–review and editing.
Funding
The author(s) declare that financial support was received for the research, authorship, and/or publication of this article. This research was supported by National Natural Science Foundation of China (No. 42372137).
Conflict of interest
The authors declare that the research was conducted in the absence of any commercial or financial relationships that could be construed as a potential conflict of interest.
The reviewer JH declared a shared affiliation with the author ZX to the handling editor at time of review.
Publisher’s note
All claims expressed in this article are solely those of the authors and do not necessarily represent those of their affiliated organizations, or those of the publisher, the editors and the reviewers. Any product that may be evaluated in this article, or claim that may be made by its manufacturer, is not guaranteed or endorsed by the publisher.
References
Aleman, N., Robin, N., Certain, R., Anthony, E. J., and Barusseau, J.-P. (2015). Longshore variability of beach states and bar types in a microtidal, storm-influenced, low-energy environment. Geomorphology 241, 175–191. doi:10.1016/j.geomorph.2015.03.029
Andrew, D. M. (1985). Architectural-element analysis: a new method of facies analysis applied to fluvial deposits. J. Earth-Science Rev. 22, 261–308. doi:10.1016/0012-8252(85)90001-7
Di Celma, C., Pitts, A., Jablonska, D., and Haynes, J. T. (2020). Backset lamination produced by supercritical backwash flows at the beachface-shoreface transition of a storm-dominated gravelly beach (middle Pleistocene, central Italy). Mar. Petroleum Geol. 112, 103987–104011. doi:10.1016/j.marpetgeo.2019.08.015
Feng, W. J., Lu, F. M., Wu, S. H., et al. (2018). Reservoir architecture analysis of braided delta front developed in the long-axis gentle slope of faulted basin: a case study of the fifth Zaoyuan formation, Zaonan fault block, Zaoyuan Oilfield, Dagang. J. J. China Univ. Min. Technol. 47 (2), 367–379. doi:10.13247/j.cnki.jcumt.000746
Guan, X., Pan, S. X., Qu, Y. Q., Xu, D. N., Zhang, H., Ma, Y. P., et al. (2021). Discovery and hydrocarbon exploration potential of beach-bar sand in Shawan Sag, Junggar Basin. J. Lithol. Reserv. 33 (1), 90–98. doi:10.12108/yxyqc.20210109
Han, Y. H., Hao, L. W., Wang, Qi., et al. (2016). Sedimentary characteristics and types of beach bars deposited in modern times in nearshore of Qinghai Lake. J. JOPC. 18 (5), 759–768. doi:10.7605/gdlxb.2016.05.057
Hou, Q. J., Liu, X. T., Han, H. W., Liu, H. J., Wei, G. H., Chen, Y. M., et al. (2022). Fractal characteristics, prediction and application for pores in a tight beach-bar sand reservoir: a case study for dongying Sag. J. Acta Sedimentol. Sin. 40 (5), 1439–1450. doi:10.14027/j.issn.1000-0550.2021.060
Hu, G. Y., Fan, T. E., Chen, F., Jing, Y. Q., Wang, H., and Song, L. M. (2017). From reservoir architecture to seismic architecture facies: characteristic method of a high-resolution fluvial facies model. J. Acta Geol. Sin. 91 (2), 465–478. doi:10.3969/j.issn.0001-5717.2017.02.012
Jiang, Z. X., Wang, J. h., and Zhang, Y. F. (2015). Advances in beach-bar research: a review. J. J. Of Palaeogeogr. 17 (4), 427–440. doi:10.7605/gdlxb.2015.04.036
Li, T. T., Wang, Z., Ma, S. Z., Wang, Z., and Yuan, Z. L. (2015). Summary of seismic attributes fusion method. J. Prog. Geophys. 30 (1), 378–385. doi:10.6038/pg20150155
Lin, H. X., Deng, H. W., Qin, Y. Q., Gao, X. P., Long, G. Q., Zhao, N., et al. (2010). Control of sequence stratigraphic evolution on the distribution and hydrocarbon accumulation of beach and bar reservoirs. Petroleum Explor. Dev. 37 (6), 1882–1890.
Lin, Yu., Wu, S. H., Yue, D. L., Yan, J. S., Li, B., and Wang, L. Q. (2013). Fine anatomizing reservoir architecture of fan-delta front:A case study on dujiatai reservoir in shu2-6-6 Block,Liaohe oilfield. J. Nat. Gas. Geosci. 24 (2), 335–344.
Qiu, L. W., Li, X., Yang, Y. Q., et al. (2022). Research progresses of the genetic mechanism and architecture characterization on lake bars. J. J. Of Palaeogeogr. 24 (2), 191–209. doi:10.7605/gdlxb.2022.02.015
Ren, Y. L., Zhao, J. F., Chen, J. Y., Guan, X., and Song, J. G. (2022). Sedimentary characteristics and sand body architecture of shallow delta front in ordos basin: a case study of chang 9 member in shiwanghe section in yichuan. J. Xinjiang Pet. Geol. 43 (3), 310–319. doi:10.7657/XJPG20220307
Shang, J. X., Zhang, H., Ye, Q., Li, H., Wang, M. W., and Ruan, H. J. (2020). Architecture analysis of fan delta thick reservoir and its application in potential tapping of remaining oil at high water cut stage: taking the Wenchang B oilfield in Pearl River Mouth Basin as an example. J. China Offshore Oil Gas 32 (02), 96–105. doi:10.11935/j.issn.1673-1506.2020.02.011
Shang, X. F., Hou, J. G., Sun, F. T., Tang, L., Liu, Y. M., Li, Y. Q., et al. (2014). Architectural characteristics and sedimentary models of beach-bar sandstone reservoirs: a case study of the Paleogene Shahejie Formation in Banqiao oilfield, Huanghua depression. [J]. ACTA PET. SIN. 35 (6), 1160–1171. doi:10.7623/syxb201406014
Sun, L., Wang, Z. Z., Yu, X. H., Ma H, Y., and Cao, Q. (2017). Study on reservoir architecture of fan delta in the upper karamay formation of eastern block Wu2, karamay oilfield. J. Petroleum Geol. Recovery Effic. 24 (4), 8–15. doi:10.13673/j.cnki.cn37-1359/te.2017.04.002
Wang, J., Li, X. B., Liu, H. Q., Zhang, Z. J., Wanyan, R., Wang, H. B., et al. (2019). Study of the development and preservation of lacustrine beach and bar based on the modern sedimentary characteristics of qinghai lake. J. Acta Sedimentol. Sin. 37 (5), 1016–1030. doi:10.14027/j.issn.1000-0550.2019.038
Wang, X., Yu, S., Li, S., and Zhang, N. (2022). Two parameter optimization methods of multi-point geostatistics. J. Petroleum Sci. Eng. 208, 109724. doi:10.1016/j.petrol.2021.109724
Wu, S. H., Yue, D. L., Feng, W. J., et al. (2021). Research progress of depositional architecture of clastic systems. J. JOPC 23 (2), 245–262. doi:10.7605/gdlxb.2021.02.018
Xia, X. M., Wu, Y. X., Zhang, S. Q., Xue, J. Q., Wang, L., Shi, Q., et al. (2019). Study on sand body architecture of lacustrine beach-bar and significance for development of tight oil sweet areas: case study of Well Za-2 area in Zahaquan area, Qaidam Basin. J. Nat. Gas. Geosci. 30 (8), 1158–1167. doi:10.11764/j.issn.1672-1926.2019.07.006
Xie, P. F., Hou, J. G., Duan, D. P., Yao, Y. R., Yang, W. Z., Liu, Y. M., et al. (2023). A novel genetic inversion workflow based on spectral decomposition and convolutional neural networks for sand prediction in Xihu Sag of East China Sea. Geoenergy Sci. Eng. 231, 212331. doi:10.1016/j.geoen.2023.212331
Yi, Z. L., Wu, S. H., Du, Q. L., Zhang, B. G., Yue, D. L., and Li, Y. P. (2010). An accurate anatomizing method for structure of reservoir of alluvial fan: a case study on lower karamay formation, liuzhong area, karamay oilfield. J. J4. 40 (4), 939–946. doi:10.3969/j.issn.1671-5888.2010.04.024
Yin, S., Zhu, B., Wu, Y., and Xu, F. (2021). Lithofacies architecture and distribution patterns of lacustrine mixed fine-grained rocks —a case study of permian lucaogou formation in jimsar Sag, NW China. Front. Earth Sci. 9, 782208. doi:10.3389/feart.2021.782208
Yuan, S. Q., Dou, L. R., Cheng, D. S., Mao, F. j., Pan, C. F., Zheng, F. Y., et al. (2023). New understanding and exploration direction of hydrocarbon accumulation in Termit Basin, Niger. J. Petroleum Explor. Dev. 50 (2), 268–280. doi:10.1016/s1876-3804(23)60386-6
Yue, D. l., Li, W., Du, Y. S., Hu, G. Y., Wang, W. F., Wang, W. R., et al. (2022). Review on optimization and fusion of seismic attributes for fluvial reservoir characterization. Earth Sci. 47 (11), 3929–3943. doi:10.3799/dqkx.2022.221
Yue, D. L., Wu, S. H., Tan, Q. H., et al. (2008). An anatomy of paleochannel reservoir architecture of meandering river reservoir——a case study of Guantao formation,the west 7th block of Gudong oidfield. J. Earth Sci. Front. 15 (1), 101–109. doi:10.3799/dqkx.2022.221
Zhang, S. W. (2012). Thinking and practice of Tertiary oil and gas exploration of maturing region in eastern China: a case study of Jiyang depression. J. ACTA Pet. Sin. 33 (S1), 53–62. doi:10.7623/syxb2012S1007
Zhang, Y., Li, J., Song, B. H., Huang, J. F., and Wu, X. W. (2023). Progress and development direction of researches on remaining oil in alluvial fan reservoir. J. J. Southwest Petroleum Univ. Sci. Technol. Ed. 45 (6), 1–17. doi:10.11885/j.issn.1674-5086.2022.01.02.01
Zhou, Y. B., Zhao, S. X., Zhang, Q. X., and Zhong, X. X. (2017). Progress of the outcrop analogy method application in the modeling of underground reservoirs. J. Bull. Geol. Sci. Technol. 36 (1), 247–254.
Keywords: beach bar, sedimentary architecture, reservoir characterization, wellseismic integration, termit basin
Citation: Wang J, Lei C, Yin Y and Xu Z (2024) Sedimentary architecture of thin-layer beach bar sand bodies in the G oilfield, Niger. Front. Earth Sci. 12:1394612. doi: 10.3389/feart.2024.1394612
Received: 01 March 2024; Accepted: 18 March 2024;
Published: 27 March 2024.
Edited by:
Wenguang Wang, Northeast Petroleum University, ChinaReviewed by:
Muming Wang, University of Calgary, CanadaJiagen Hou, China University of Petroleum, Beijing, China
Mei Chen, University of Bremen, Germany
Copyright © 2024 Wang, Lei, Yin and Xu. This is an open-access article distributed under the terms of the Creative Commons Attribution License (CC BY). The use, distribution or reproduction in other forums is permitted, provided the original author(s) and the copyright owner(s) are credited and that the original publication in this journal is cited, in accordance with accepted academic practice. No use, distribution or reproduction is permitted which does not comply with these terms.
*Correspondence: Yanshu Yin, 2021710328@yangtzeu.edu.cn