Pore structure expansion and evolution in sandstone with prefabricated crack under freeze-thaw cycles based on CT scanning
 Xinting Zhang
 Xuedong Luo*
  Xu He
Xu He Shuaishuai Niu
- Faculty of Engineering, China University of Geosciences, Wuhan, China
In cold regions, rocks undergo periodic temperature fluctuations, resulting in deterioration in pore structure and mechanical behavior. This degradation can lead to instability in rock masses and contribute to landslides. While many studies have investigated the effects of freeze-thaw (F-T) cycles on the mechanical behavior of rocks, the micro-level mechanisms of deterioration remain less understood. In this study, the evolution of the pore structure of a prefabricated sandstone with 30 freeze-thaw cycles ranging from −20°C to 20°C is explored using CT scanning. The influence of the prefabricated crack is highlighted. The results indicate a significant impact of freeze-thaw cycles on large pores, with their proportion increasing from 15.28% to 38.72% after 30 F-T cycles. Within the initial 10 F-T cycles, pore structure changes occur without the expansion of prefabricated crack. However, after 15 F-T cycles, prefabricated crack begins extending downward, eventually becoming nearly continuous after 30 F-T cycles. Prefabricated crack notably influences pore distribution during freeze-thaw cycles, with higher porosity near the fracture, where pores initially expand and connect. These findings provide insights into the damage mechanism in sandstone under F-T cycles.
1 Introduction
Freeze-thaw cycles are the predominant cause of engineering-related deterioration in rock masses in cold regions (Xia et al., 2021; Lv et al., 2022; Ju et al., 2024). Seasonal temperature fluctuations lead to the cyclic freezing and thawing of rock masses, leading to many problems in engineering, such as rockfall, instability of tunnel surrounding rock (Cui et al., 2022; Chen et al., 2023; Lu et al., 2023; Wang et al., 2024). Open-pit rock slopes are especially vulnerable to the erosive effects of freeze-thaw cycles, significantly endangering the stability of geological rock masses on slopes, resulting in geological disasters, such as landslides (Li et al., 2018; Qiao et al., 2022; Ma et al., 2023; Zhang et al., 2024). In high-altitude and cold regions, which are rich in mineral resources, mining operations encounter significant challenges due to the profound effects of freeze-thaw cycles (Wang et al., 2021). Hence, understanding freeze-thaw cycles is crucial for the design and construction of engineering structures and the exploitation of mineral resources in cold climates.
When the temperature of pore water and microcrack water in rocks falls below the freezing point, it undergoes a 9% expansion in volume, generating considerable freeze-thaw pressure (Deprez et al., 2020; Niu et al., 2024). This volumetric expansion results in an accumulation of tensile stress in the rock. As the temperature increases, water flows through discontinuities, accelerating the degradation of the rock. The periodic freeze-thaw cycles caused by temperature variations in cold regions lead to progressive cracking, driven by the repeated application of freeze-thaw pressure. This process triggers the creation of new cracks, the expansion of existing cracks, and a reduction in slope strength (Kjelstrup et al., 2021; Huang et al., 2020). This degradation compromises the mechanical integrity of rocks in geological engineering, threatening the safety and stability of infrastructures in cold regions (Ghoreishian Amiri et al., 2022). The expansion of pores and microcracks in rocks leads to a greater water storage capacity, intensifying frost damage upon subsequent freezing (Zhang et al., 2020). Therefore, understanding the evolution of rock pores and microcracks during the freeze-thaw cycles is essential to uncover the mechanisms of rock degradation due to freezing and thawing.
Research has delved into the expansion process of rock fractures during freeze-thaw cycles (Zhang et al., 2024; Li et al., 2018). Yahaghi et al. (2021) conducted indoor experiments, including uniaxial compression and Brazilian tensile tests, revealing that increased freeze-thaw cycles shift the primary failure mode in sandstone from axial splitting to shear in compression tests, and from smooth to serrated central cracks in tensile tests. Zhou et al. (2023) investigated the dynamic fracture characteristics of fractured sandstone under F-T cycles, employing a combination of freeze-thaw cycling and drop weight tests. Their findings showed reductions in dynamic elastic modulus, and wave velocities, alterations in pore distribution, and an acceleration in crack propagation velocity with more F-T cycles. Lu et al. (2019) explored single-fractured sandstone across four groups, conducting F-T cycle experiments and triaxial compression tests to develop a damage evolution model that accounts for prefabricated cracks, loading, and F-T cycles, offering predictions for the triaxial compressive strength of such sandstone.
These studies primarily address the macroscopic mechanical properties of rocks. However, for a deeper understanding of the inherent mechanisms of rock degradation through freeze-thaw cycles, it is crucial to examine the microscale, focusing on changes in the internal pore and crack structures of rocks (Meng et al., 2021; Niu et al., 2021; Liu et al., 2021). For instance, Seyed Mousavi et al. (2019) used scanning electron microscopy (SEM) to study the structural and microscopic structure changes in samples after weathering, noting increased microcracks, loss of matrix cement, and significant reductions in cohesion and internal friction angle with F-T cycles. Zhang et al. (2024) utilized nitrogen adsorption/desorption (NAD) and mercury intrusion porosimeter (MIP) to measure the microscopic morphology and pore size distribution of sandstone samples, finding that F-T cycles mainly affect large pores and mesopores, with a lesser impact on small pores. Zhou et al. (2020) used SEM and nuclear magnetic resonance (NMR) to trace the microstructural and pore size distribution of sandstone under F-T cycles, observing particle detachment and significant impact on pores with diameters ranging from 0.02 μm to 2 μm.
Despite these advances, the intrinsic limitations of such techniques have left the expansion mechanism of non-throughgoing structural surfaces and the evolution characteristics of rock pores during the F-T cycles underexplored. In recent years, the adoption of CT technology in geotechnical engineering has spurred numerous scholars to pursue research with this sophisticated tool (Maľa et al., 2022; Liu et al., 2020; Maji and Murton, 2020). Song et al. (2023) utilized CT scanning to study the F-T damage of sandstone under varying saturation conditions, revealing that pore size distribution reflects complex pore structures, with an increase in the proportion of large pores and mesopores with F-T cycles. Wang et al. (2020) used CT scanning to study the effects of F-T cycles on granite samples with two non-parallel fractures, indicating that F-T cycles and the inclination angle both affect crack propagation paths and rock bridge fracture behavior. F-T damage can drive crack extension at the defect tip and accelerate the propagation of existing fractures. Li et al., 2022 used CT scanning to analyze saturated and dry rock specimens with cyclic freeze-thaw tests, finding that the peak stress of granite decreases to different extents with the increasing number of freeze-thaw cycles. Under freeze-thaw cycles, pore water frost heave causes initiation and development of micro-defects, and new microcracks mainly develop along fractures and boundaries between different mineral crystals, resulting in intergranular and transgranular cracking. Although CT technology has produced some insights into the microscopic field of rocks, further research is necessary to understand the evolution characteristics of crack propagation in rocks during the F-T process.
This study focuses on red sandstone with prefabricated crack, employing CT scanning to track the evolution of prefabricated crack under different F-T cycles. The heterogeneity and connectivity of pore structures after F-T cycles are systematically analyzed. The insights garnered from this study offer theoretical support for understanding the damage and deterioration of rocks in cold regions. findings can provide significant theoretical.
2 Materials and methods
2.1 Materials/sample preparation
This experiment focuses on red sandstone, with samples sourced from Ezhou City, Hubei Province, China. The samples are derived from a single, fresh, and intact rock block to ensure their integrity and uniformity. Basic physical-mechanical parameters are tested on cylindrical samples with a diameter of 50 mm and a height of 100 mm. These parameters include dry density, saturated density, porosity, P-wave velocity, Poisson’s ratio, and uniaxial compressive strength, as detailed in Table 1.
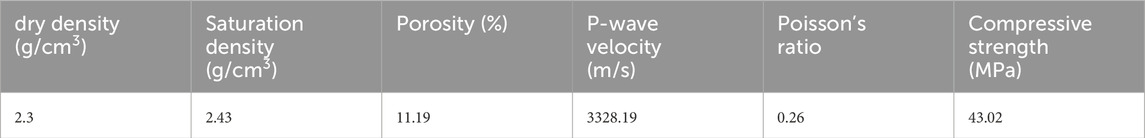
Table 1. Samples’ basic physical-mechanical properties (between line 104 and line 105).
The specimens are cut into cubes with a side length of 70 mm. A small arc cutting tool is used to prefabricate a crack in the middle of one side of the samples, measuring 70 mm in length, 35 mm in height, and 2 mm in width, as shown in Figure 1.
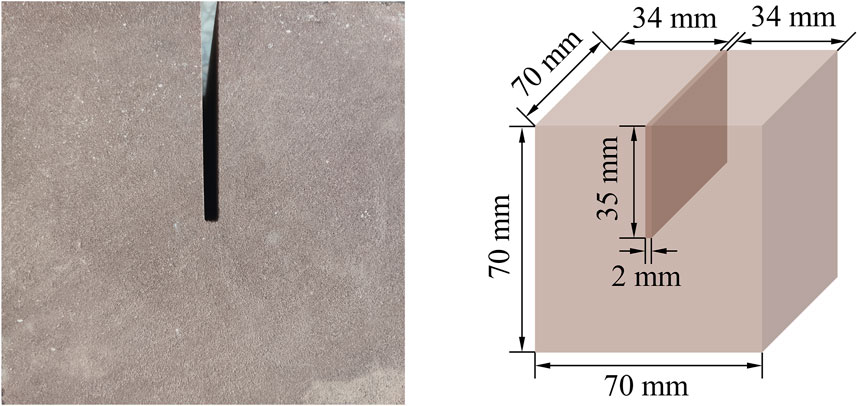
Figure 1. Sample preparation and size (between line 104 and line 105).
2.2 F-T cycles experiment
The equipment utilized for F-T cycles experiment is the AB-1000 High-Low Temperature Alternating Humidity Test Chamber. To simulate the periodic variations characteristic of cold regions, the test temperature is set between −20°C and 20°C, following indoor freeze-thaw testing standards, with a total of 30 cycles. The experimental process and equipment are shown in Figure 2. The main experimental steps are outlined as follows:
(1) Place the samples in a saturator, apply Vaseline to the opening, use a vacuum pump to reach a certain negative pressure, slightly open the pipe clamp, and inject distilled water. Throughout the water injection process, ensure that the vacuum pressure gauge’s value remains relatively constant. Then, remove the water intake tube from the cylinder and wait for some time to saturate the samples.
(2) Take out the saturated samples, wipe off sample surfaces, wrap them with industrial cling film, ensuring a tight fit without any gaps, and seal with waterproof tape. Place the side with the crack facing upward and fill the crack with water using a needle.
(3) Position the samples in the AB-1000 High-Low Temperature Alternating Humidity Test Chamber, set the temperature to −20°C, freeze for 4 h, then adjust the temperature to 20°C, thaw for 4 h. This constitutes one complete freeze-thaw cycle. After each cycle, repeat step (2) and proceed to the next freeze-thaw cycle.
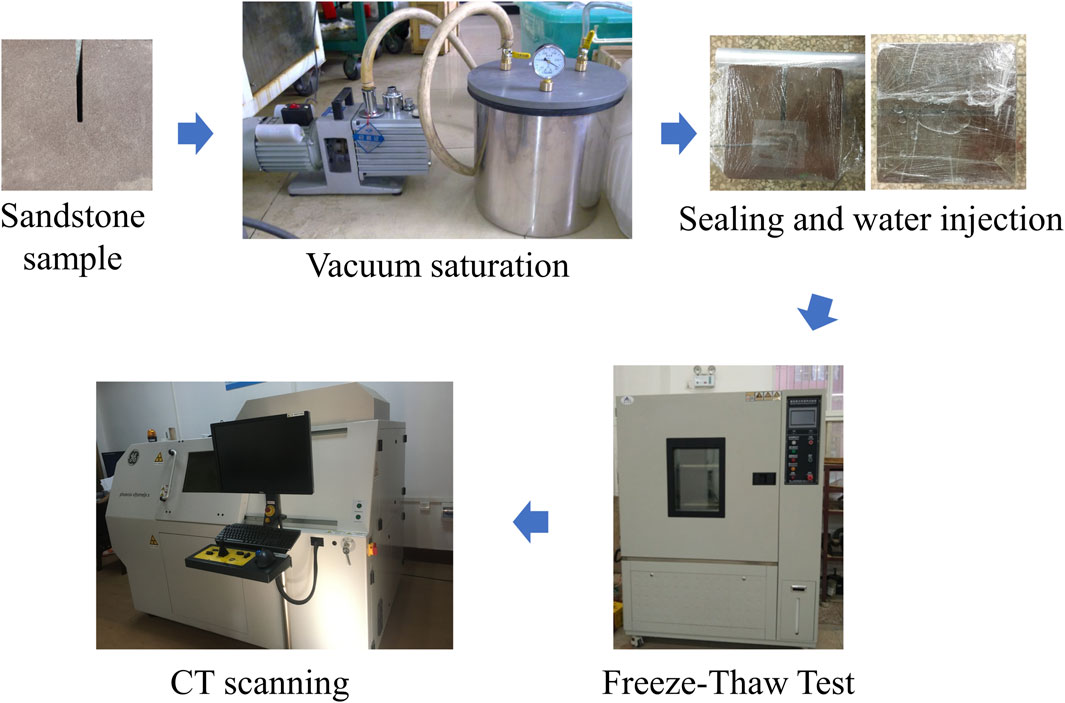
Figure 2. The experimental process and equipment (between line 121 and line 122).
2.3 CT scanning experiment
To investigate the influence of F-T cycles on the expansion process of non-penetrating structural surfaces, CT scans were conducted on the samples after 0, 5, 10, 15, 20, 25, and 30 F-T cycles. The CT scanning equipment used in this study is the Phoenix V|tome|, capable of identifying pores with a diameter as small as 5 μm. (Park et al., 2015).
The CT image processing for this study utilized VG Studio MAX 2.2 software. Firstly, the raw images obtained from CT scanning were imported into the software for three-dimensional reconstruction, followed by data processing. The main processes included image pre-processing, threshold selection, region of interest (ROI) selection, and extraction of pore characteristics within the ROI.
Image Pre-processing: The three-dimensional reconstruction of CT raw data was performed in VG Studio MAX 2.2, where 1,000 images obtained from scanning are reconstructed into a 3D model with contrast settings to make the sample images clearer and the pore structure more obvious.
Threshold Selection: The reconstructed 3D model can distinguish the composition of the internal matrix from the pores by the difference in grayscale value, which is the threshold value. In this study, the porosity before freeze-thaw cycle is used as the basis for determining the threshold value.
Region of Interest (ROI) Selection: The region of interest (ROI) is the effective CT image area used for analysis and calculation. Two regions of interest, ROI 1 and ROI 2, were selected in this study, and their locations are shown in Figure 3. The entire gray cube represents the image reconstructed from the sandstone scan, with the orange area indicating a prefabricated crack. ROI 1 is the light blue area, a 30 mm × 60 mm × 60 mm cuboid primarily used to analyze the overall expansion characteristics of fractures after F-T cycles. ROI 2 is the pink area, a cuboid obtained by extending downward from the central 15 mm × 15 mm square section of the sample, measuring 30 mm in length, and is mainly used to analyze the microscopic changes in pore structure after F-T cycles.
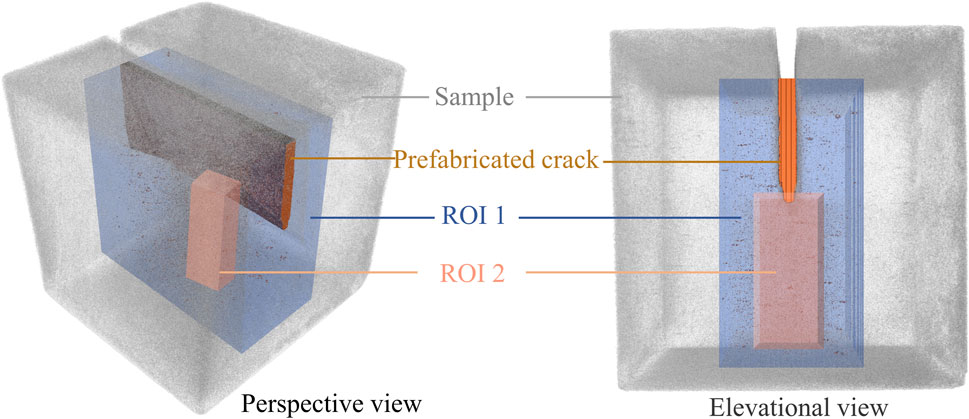
Figure 3. Position of ROI 1and ROI 2 (between line 146 and line 147).
2.3.1 Extraction of feature parameters within the region of interest (ROI)
Utilizing the pore volume quantification tool provided by VG Studio MAX 2.2, pores within the ROI were quantitatively calculated. The key parameters extracted include changes in pore diameter, quantity, and porosity within the ROI after F-T cycles. The diameter of the maximum inscribed sphere within the pore space was defined as the equivalent pore diameter (D) (Zhang et al., 2022). To quantitatively illustrate the evolution of the pore size distribution (PSD) under F-T cycles, rock pores were categorized into three groups: pores with a diameter greater than 1 mm were classified as large pores, pores with a diameter ranging from 0.2 mm to 1 mm were classified as mesopores, and pores with a diameter smaller than 0.2 mm were classified as small pores (Sun et al., 2020). The total porosity was calculated as the ratio of the total pore volume within the ROI to the total volume of the ROI. Similarly, the large porosity, medium porosity, and small porosity were calculated. Surface porosity (Fan et al., 2020) refers to the ratio of the pore area on any surface within ROI to the total surface area.
3 Results
3.1 Surface and internal temperatures during freezing process
From Figure 4, it can be observed that during the freezing process, both the surface and internal temperatures of samples undergo significant changes. Due to the cooling system, the surface temperature of samples rapidly drops to −20°C. However, the internal temperature of samples undergoes three main stages. The first stage is the rapid cooling period, where the internal temperature rapidly drops to 0°C within about an hour, with water remaining unfrozen, primarily influenced by the cooling system. Following this is the stable phase transition period, where water in the crack begins to freeze, releasing a significant amount of latent heat, thereby maintaining the temperature relatively stable around 0°C. Finally, there is the sustained cooling period, occurring after the complete freezing of the crack water, where the internal temperature continues to decrease, gradually approaching that of the surface temperature.
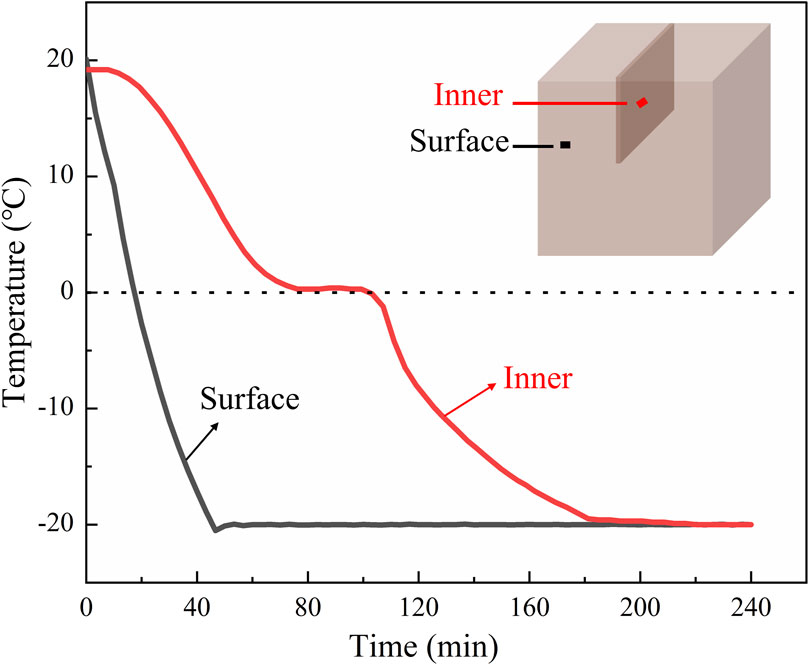
Figure 4. Frozen temperature curves (between line 161 and line 162).
3.2 Prefabricated crack expansion
After 15 F-T cycles, the prefabricated crack in samples starts to expand. Until 15 F-T cycles, there are no apparent cracks on the sample surface. Visible cracks begin to appear after 20 F-T cycles. By the 30 F-T cycles, the prefabricated crack has essentially connected, as depicted in the apparent results shown in Figure 5.
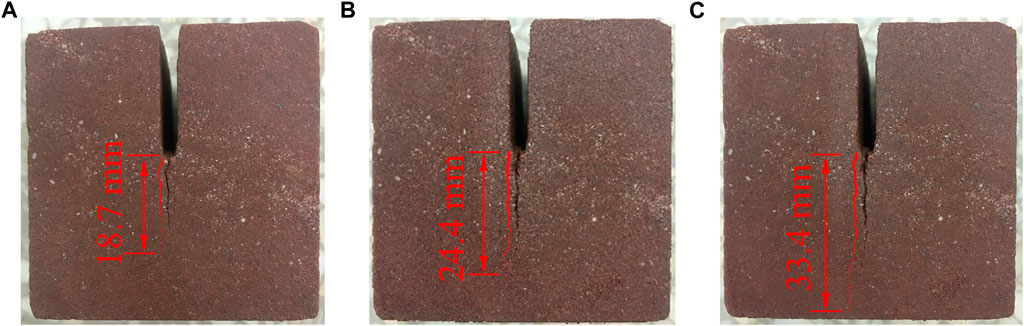
Figure 5. Cracks with 20 F-T cycles (A), 25 F-T cycles (B) and 30 F-T cycles (C) (between line 176 and line 177).
From Figure 5, it can be observed that after 20 F-T cycles (as shown in Figure 5A), a crack appears on the sample surface. Measurements indicate that the crack length is 18.7 mm after 20 F-T cycles, increases to 24.4 mm after 25 F-T cycles (as shown in Figure 5B), and reaches 33.4 mm after 30 F-T cycles (as shown in Figure 5C). To further observe the extension of crack in samples, an analysis is conducted on ROI 1 during 30 F-T cycles, as shown in Figure 6.
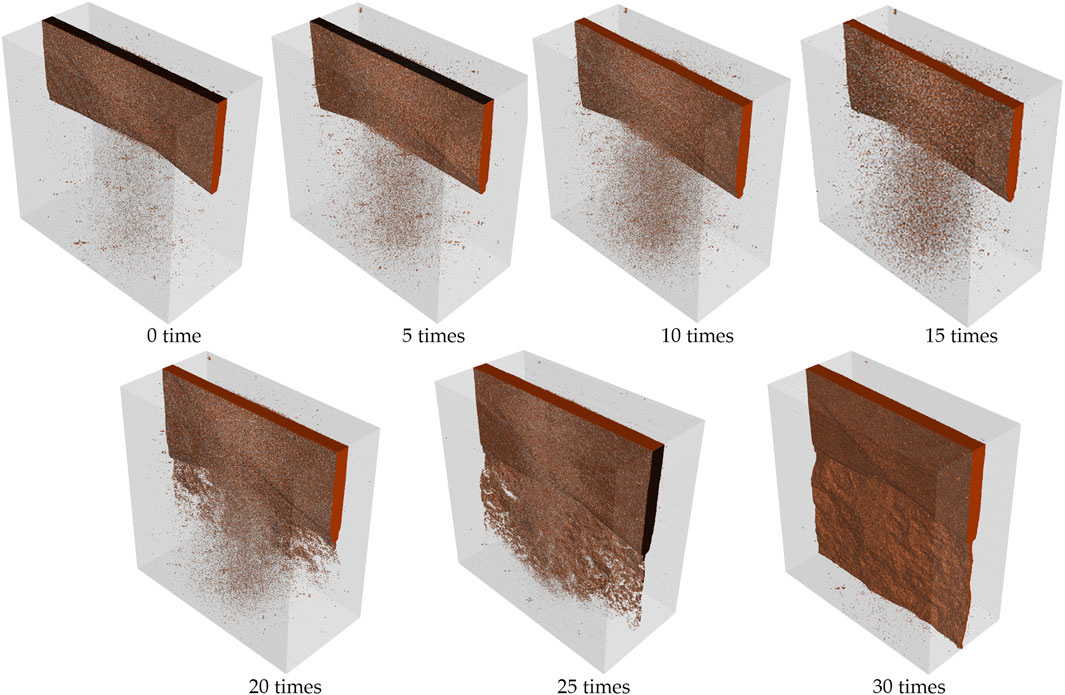
Figure 6. Crack with F-T cycles in ROI 1 (between line 181 and line 182)
From Figure 6, it can be observed that during the 0–15 F-T cycles, the internal pores of sandstone sample start to increase and concentrate below the prefabricated crack. However, the prefabricated crack does not expand. After 20 F-T cycles, the sample begins to penetrate downward the prefabricated crack. The penetration occurs from the inside out, and by 30 F-T cycles, the sample is essentially fully penetrated. Extract the results of crack extension from ROI1 and project them onto a 60 mm × 60 mm plane. This way, the max length of crack can be directly obtained, while the average length is the result of the ratio of the projected area to the 60 mm side length. Figure 7 shows the average length and max length of crack.
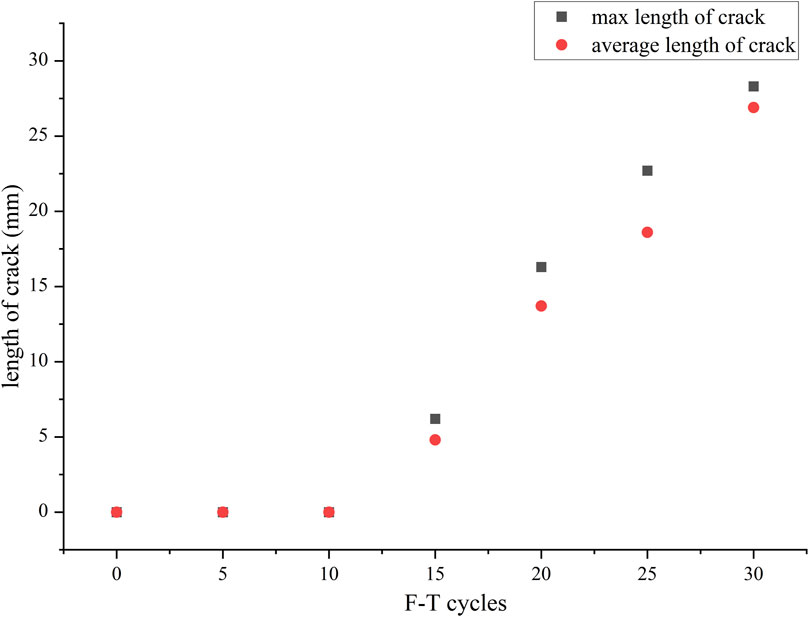
Figure 7. Crack evolution with F-T cycles (between line 189 and line 190).
From Figure 7, it can be observed that crack length of sample remains relatively unchanged before 15 F-T cycles. After 15 F-T cycles, the sample starts to penetrate downward from the prefabricated crack, and the crack length begins to increase. To understand how the internal pores change and why penetration begins after 15 F-T cycles, an analysis of pore characteristics within ROI 2 was conducted. A cross-section from the same location on ROI 2 is shown in Figure 8.
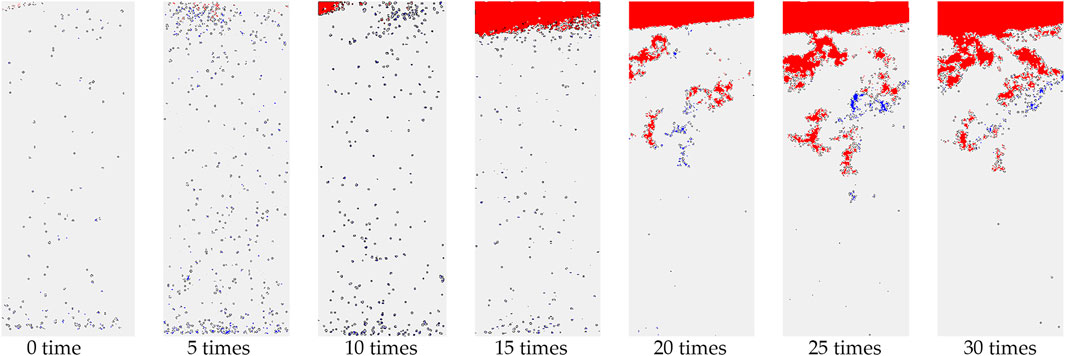
Figure 8. Pores structure and variation with F-T cycles in ROI 2 (blue represents smaller pore volumes, and red represents larger pore volumes) (between line 194 and line 195).
Figure 8 displays the distribution of pores on various cross-sections under different F-T cycles. It can be observed that before 15 F-T cycles, the main changes inside sample involve an increase in the number of pores and an enlargement of pore diameters, but there is no connectivity between pores. After 15 F-T cycles, microcracks initiated at the bottom of the prefabricated cracks, and nearby pores began to connect, leading to an increase in crack length. After 20 F-T cycles, the phenomenon of pore connectivity becomes more pronounced, with a noticeable increase in larger pores, ultimately resulting in the specimen becoming essentially fully penetrated downward. The phenomenon is attributed to the volumetric expansion of water within the crack and pores during freezing process, resulting in the generation of frost heave pressure. This force exerts additional stress on the rock structure, potentially causing the abrasion of rock particles and facilitating the enlargement of pores, as well as the initiation of microcracks. Under F-T cycles, the recurring expansion and contraction continuously lead to the formation, expansion and interconnection of microcracks and pores. After 15 F-T cycles, a noticeable increase in the length of the prefabricated crack can be observed, indicating that the structure has been significantly affected at this point. As the freeze-thaw cycles persist, the expansion process continues until the prefabricated crack are fully penetrated.
Extracting pore characteristic parameters from ROI 2 and conducting statistical analysis, the variation in porosity for different-sized pores with F-T cycles is shown in Figure 9.
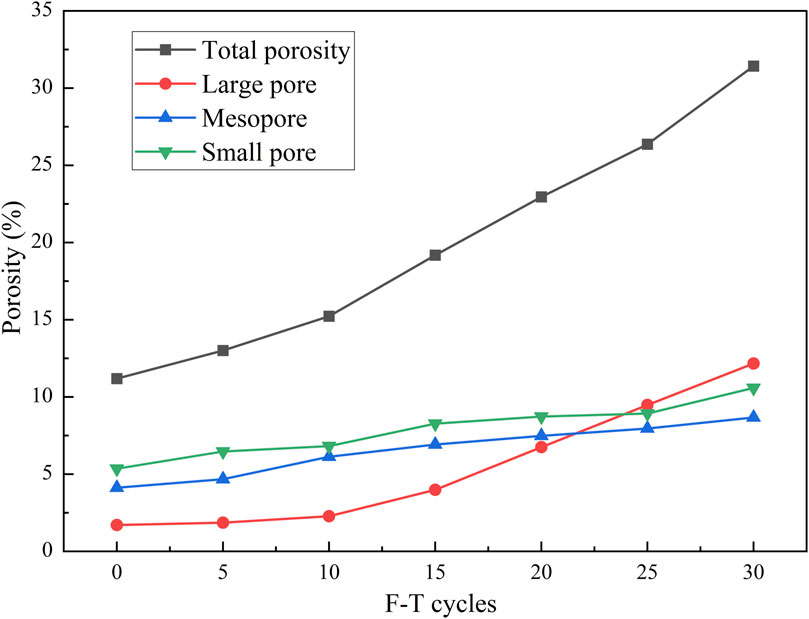
Figure 9. Porosity with F-T cycles (between line 211 and line 212).
From Figure 9, it can be observed that with an increase in F-T cycles, the total porosity gradually increases. The growth rates of medium-sized and small-sized porosity are nearly consistent, while the large porosity remains relatively constant during the initial 10 F-T cycles and experiences rapid growth after 15 F-T cycles.
Figure 10 illustrates the proportion of different-sized pore volumes to the total pore volume under F-T cycles. Before the start of F-T cycles, small pores occupy 47.9% of the total volume, mesopores account for 36.82%, and large pores have the smallest proportion at 15.28%. After 15 F-T cycles, there is a slight change in the proportions of pores of different sizes. However, after 30 F-T cycles, the proportion of large pores increases to 38.72%, while the proportion of mesopores decreases to 27.58%, and small pores decrease to 33.7%. It can be observed that F-T cycles significantly increase the proportion of large pores.
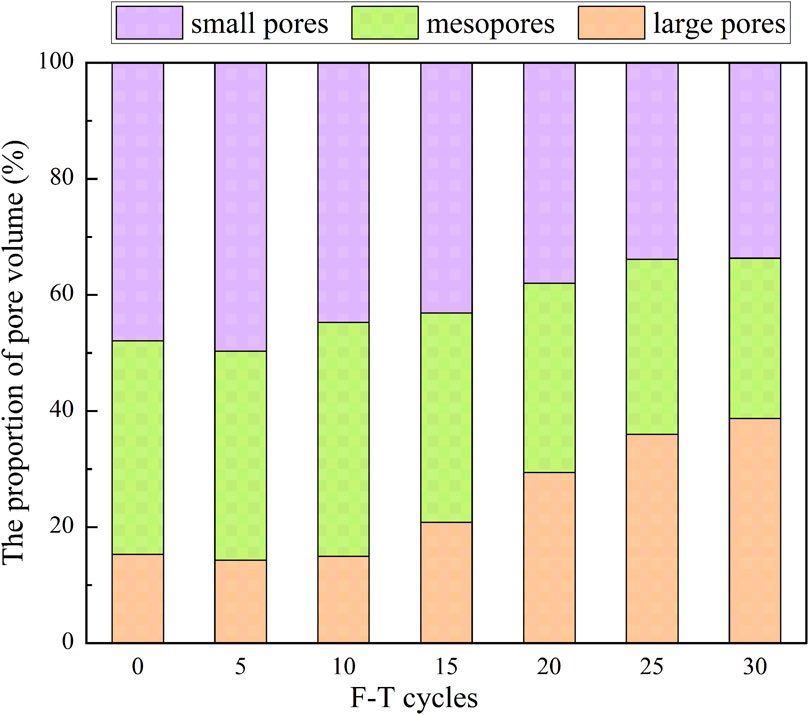
Figure 10. The proportion of the different-sized pores to the total pore volume (between line 215 and line 216).
To better quantitatively characterize the evolution of pore diameter in sandstone samples after different F-T cycles, the cumulative distribution of pore diameters in the ROI 2 is obtained by statistically analyzing the volumes corresponding to different pore diameters, as shown in Figure 11.
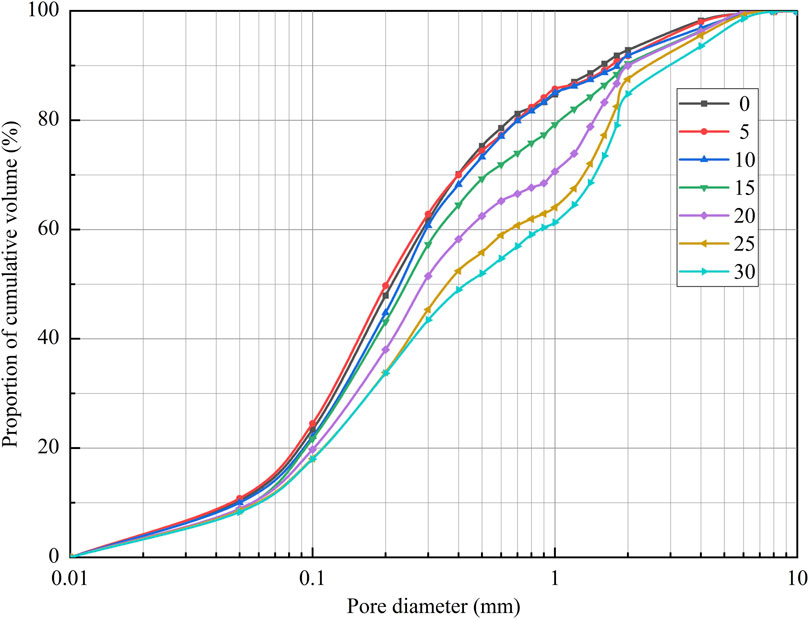
Figure 11. Pore cumulative distribution curve (between line 225 and line 226).
It is evident that F-T cycles result in noticeable changes in the diameter of the internal pore structure in sandstone, and the cumulative distribution curve shows a systematic morphological variation. Pores with a diameter smaller than 0.2 mm (small pores) account for around 20% of the volume percentage, and their cumulative distribution features under different F-T cycles are similar. However, with an increase in F-T cycles, the percentage slightly decreases. Pores with a diameter smaller than 1 mm (including small pores and mesopores) constitute approximately 85% without F-T effects, but after 30 F-T cycles, this percentage decreases to 60%.
To explore the relationship between pore distribution and prefabricated crack, the surface porosity is extracted from cross-sections within the ROI 2. Data are extracted at intervals of 3 mm starting from the bottom of the prefabricated crack, and the results are as follows.
From Figure 12, it is noticeable that, before the initiation of F-T cycles and after 5 F-T cycles, the surface porosity across different sections remains essentially consistent. The porosity increases with the number of F-T cycles, indicating similar deteriorating characteristics in the overall rock mass structure during 5 F-T process. However, starting from 10 F-T cycles, the porosity near the prefabricated crack is slightly higher than that at a distance from the crack. By 15 F-T cycles, pores near the prefabricated crack begin to connect. At this point, the upper part at −6 mm exhibits higher porosity, while the lower part has lower porosity, resulting in a significant difference in porosity between the two locations. After 20 and 25 F-T cycles, the porosity pattern is similar to that at 15 F-T cycles, with differences occurring at sections −15 mm and −22 mm, respectively. After completing 30 F-T cycles, the selected area of interest is essentially fully connected, and the porosity at various locations shows no significant differences. The results indicate that the presence of prefabricated crack has no significant impact on samples during the early stages of F-T cycles. However, with an increase in the number of F-T cycles, the bottom of the prefabricated crack is initially damaged, and the crack gradually expands until it penetrates the entire sample. In natural settings, the presence of structural planes exacerbates the deteriorating characteristics of rock masses during the F-T cycles.
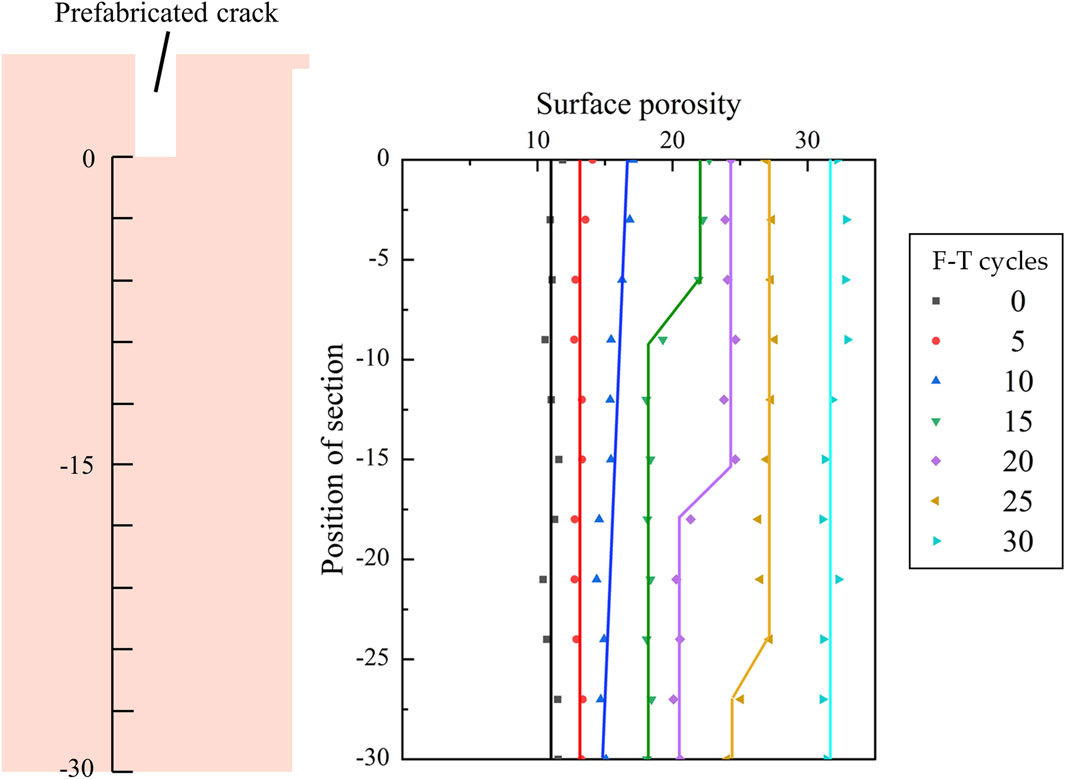
Figure 12. Surface porosity under prefabricated crack (between line 235 and line 236).
4 Discussion
Cracks are an important geological structure influencing the properties of rock masses (Chen et al., 2022). The deterioration of rock masses through F-T effect is primarily attributed to the expansion force generated from the phase transition of water to ice within the fissures, leading to the expansion of these cracks (Huang et al., 2021; Yu et al., 2023).
The F-T cycles have altered the pore distribution structure of the sandstone. Before the F-T cycles, the samples exhibit good integrity, with mineral particles tightly connected, fewer large pores, and more small pores (Liu et al., 2020). During the initial 5 F-T cycles, there is a relatively slow growth rate in porosity, and the variation in the porosity of large pores is minimal. This indicates that in the early stages of F-T cycles, the inherent pores are primarily composed of smaller ones, as shown in Figure 13A, and the frost heave pressure on water molecules within the pores induced by F-T cycles is limited, resulting in a restrained effect on pore expansion. At this stage, the surface porosity at various cross-sections below the bottom of the prefabricated crack is essentially consistent, suggesting that the presence of the prefabricated crack has minimal impact on the entire sample. The overall internal changes are attributed to the initiation and expansion of some small pores, as shown in Figure 13B. After 10 F-T cycles, the porosity near the bottom of the prefabricated crack is slightly higher than that at locations further away from the crack bottom. This indicates that the prefabricated crack is beginning to influence the pore distribution structure of the sample. At this stage, due to the presence of the prefabricated crack, the phase transition of water to ice around and at the bottom of the prefabricated crack intensifies, accelerating the development of small pores. These small pores interconnect, forming larger pores, as shown in Figure 13C.
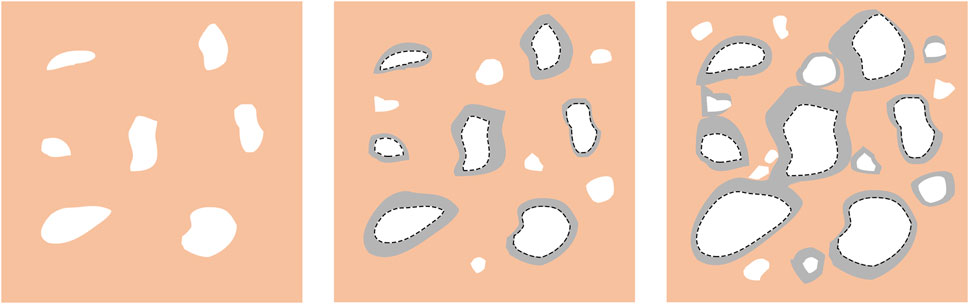
Figure 13. Pores evolution in initial stage, mid stage and late stage of F-T cycles (between line 271 and line 272).
After 15 F-T cycles, CT scan results reveal that the prefabricated crack has begun to penetrate downward, with a crack extension length reaching 6.2 mm. At this point, the overall porosity growth rate accelerates, and there is an increase in presence of large pores. The surface porosity from the bottom of the prefabricated crack to 6.2 mm is nearly uniform, and they are significantly higher than the porosity below 6.2 mm. The presence of the prefabricated crack is now exerting a pronounced influence on the internal pore distribution characteristics of sample. After 20 and 25 F-T cycles, the crack continues to extend downward, reaching maximum extension lengths of 16.3 mm and 22.7 mm, respectively. At these positions, there is a considerable difference in porosity above and below the crack extension.
After 30 F-T cycles, the proportion of large pores in the sample’s pore volume increases from 1.71% to 12.17%, while the proportion of mesopores increases from 4.12% to 8.67%. At this point in ROI 2, the prefabricated crack has fully penetrated, with slightly higher surface porosity near the bottom of the prefabricated crack. The porosity across various cross-sections shows little difference. Throughout the entire F-T cycle process, the downward extension of the prefabricated crack has not only lengthened but also widened, as depicted in Figure 14.
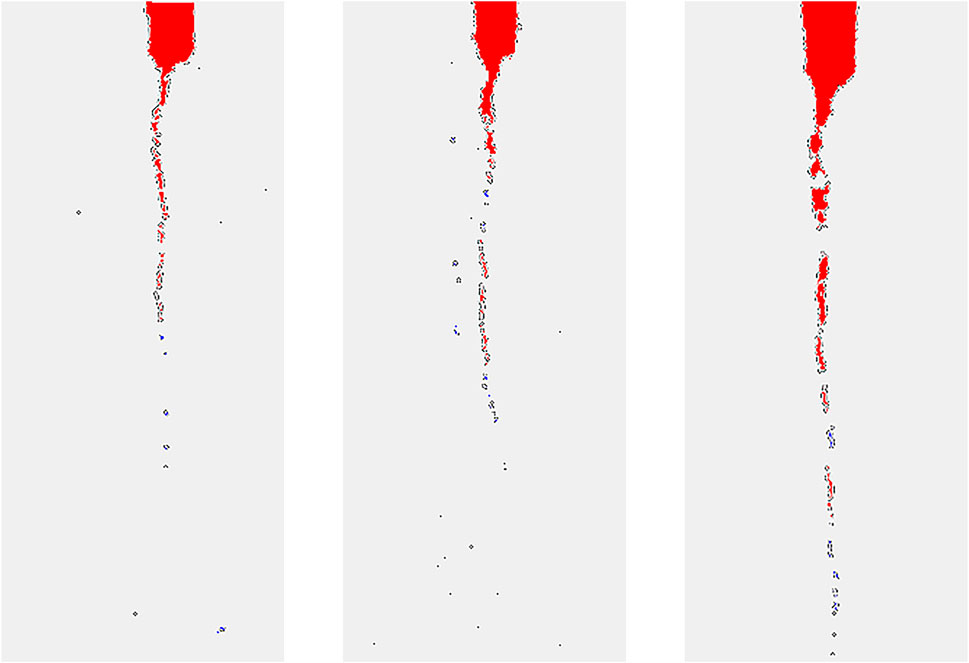
Figure 14. The extension of prefabricated crack with F-T cycles in ROI 2 (between line 286 and line 287).
The prefabricated crack significantly influences the pore distribution characteristics of the sample, primarily due to the F-T process and the resulting freeze expansion pressure generated during the ice-water phase transition within the pores (Huang et al., 2018). The sandstone comprises large, medium, and small pores, which are interconnected at different scales and randomly distributed, as shown in Figure 15A. Due to curvature effects (Huang et al., 2020), the initial temperature drops lead to the freezing of larger pores. During the freezing process, the expansion of water in these larger pores forces unfrozen water into smaller pores, increasing the water pressure. When this pressure exceeds the tensile strength of the rock, pore expansion occurs. As the cooling continues, unfrozen water in the smaller pores begins to freeze, further triggering pore expansion. This process enlarges the original pores, resulting in the formation of larger ones, and they start to interconnect. This process repeats continuously with the periodic F-T cycles (Jia et al., 2020). In samples with a prefabricated crack, the crack acts as the largest pore. During a freezing process, as water in the prefabricated crack begins to freeze, frost heave pressure rapidly increases. This induces water migration in prefabricated crack, alters the permeation field around the crack, and forces unfrozen water into the connected smaller pores with the lowest tensile strength, the freezing of these small pores leads to expansion and increased volume. Once frost heave pressure surpasses the minimum tensile strength of the rock, prefabricated crack begins to extend and connect, causing further volume increase in the crack and subsequently reducing the frost heave pressure. The frost heave pressure and the minimum tensile strength of the rock remain in dynamic equilibrium. When the crack water completely freezes, and no further changes in the frost heave pressure occur, the extension of prefabricated crack halts, as shown in Figure 15B. Through repeated F-T cycles, pores gradually interconnect, and the prefabricated crack gradually extends until full penetration, as shown in Figure 15C.
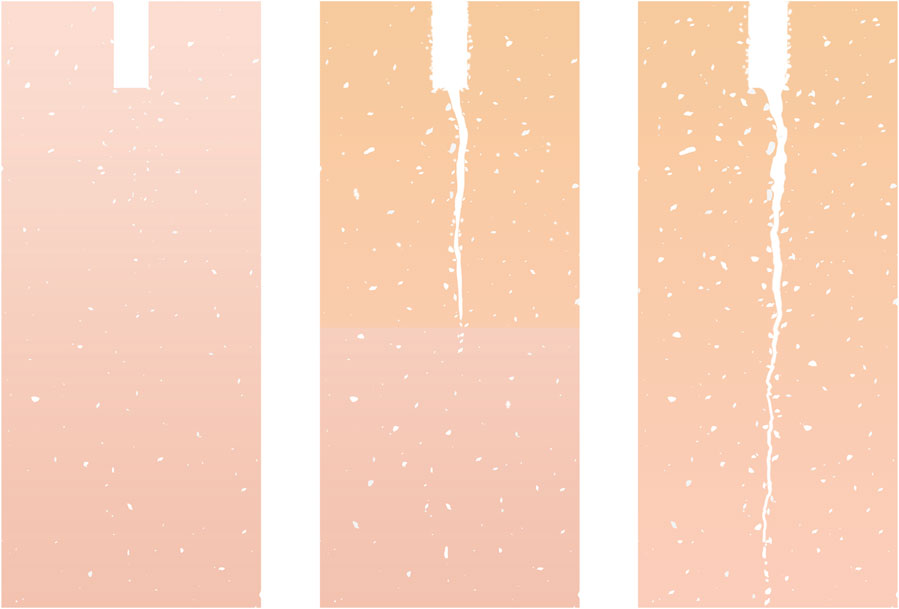
Figure 15. The influence of prefabricated cracks on pores evolution in initial stage, mid stage and late stage of F-T cycles (between line 308 and line 309).
5 Conclusion
This study conducted CT scans on sandstone samples with prefabricated crack subjected to F-T cycles, examining the evolution of surface morphology under F-T conditions. Concurrently, a statistical analysis was performed on porosity and crack length to gain an in-depth understanding of pore structure and expansion characteristics of the sandstone samples. The following conclusions were drawn:
(1) During F-T cycles, there is a notable increase in the quantity of pores within the sandstone, accompanied by an enlargement of pore diameters. Additionally, as the cycles progress, the pores start to interconnect.
(2) The impact of F-T cycles on large pores is notably significant. Without F-T cycles, small pores constitute 47.9% of the total pore volume, mesopores account for 36.82%, and large pores have the smallest proportion at 15.28%. After 30 F-T cycles, the proportion of large pores increases to 38.72%, while the proportion of mesopores decreases to 27.58%, and small pores decrease to 33.7%.
(3) During 15 F-T cycles, changes occur in the internal pores of samples, but the prefabricated crack does not begin to extend. After 15 F-T cycles, the prefabricated crack starts to extend downward and becomes essentially fully connected after 30 F-T cycles.
(4) Prefabricated crack has a significant influence on the distribution of pores during F-T cycles. Porosity is higher near the prefabricated crack, and as F-T cycles progress, the prefabricated crack starts to penetrate, leading to higher porosity within the penetrated length compared to other parts.
Data availability statement
The raw data supporting the conclusion of this article will be made available by the authors, without undue reservation.
Author contributions
XZ: Conceptualization, Data curation, Formal Analysis, Investigation, Methodology, Writing–original draft. XL: Funding acquisition, Resources, Writing–review and editing. XH: Validation, Writing–review and editing. SN: Validation, Writing–review and editing.
Funding
The author(s) declare that financial support was received for the research, authorship, and/or publication of this article. This research was funded by the National Natural Science Foundation of China (Grant NO.41572281, 42072309).
Conflict of interest
The authors declare that the research was conducted in the absence of any commercial or financial relationships that could be construed as a potential conflict of interest.
Publisher’s note
All claims expressed in this article are solely those of the authors and do not necessarily represent those of their affiliated organizations, or those of the publisher, the editors and the reviewers. Any product that may be evaluated in this article, or claim that may be made by its manufacturer, is not guaranteed or endorsed by the publisher.
References
Chen, G., Guo, T. Y., Serati, M., and Pei, B. (2022). Microcracking mechanisms of cyclic freeze–thaw treated red sandstone: insights from acoustic emission and thin-section analysis. Constr. Build. Mater. 329, 127097. doi:10.1016/j.conbuildmat.2022.127097
Chen, R., Chen, J., Shi, L., Cui, Z., and Chen, S. (2023). Geomorphological characteristics and the kinematic process of the Ganheba rock–ice avalanche in Yulong Mountain, China. Front. Earth Sci. 11. doi:10.3389/feart.2023.1017207
Cui, P., Ge, Y., Li, S., Li, Z., Xu, X., Zhou, G. G. D., et al. (2022). Scientific challenges in disaster risk reduction for the Sichuan–Tibet Railway. Eng. Geol. 309, 106837. doi:10.1016/j.enggeo.2022.106837
Deprez, M., De Kock, T., De Schutter, G., and Cnudde, V. (2020). A review on freeze-thaw action and weathering of rocks. Earth-Sci. Rev. 203, 103143. doi:10.1016/j.earscirev.2020.103143
Fan, L. F., Gao, J. W., and Du, X. L. (2020). Thermal cycling effects on micro-property variation of granite by a spatial micro-observation. Rock Mech. Rock Eng. 53, 2921–2928. doi:10.1007/s00603-020-02065-8
Ghoreishian Amiri, S. A., Grimstad, G., and Kadivar, M. (2022). An elastic-viscoplastic model for saturated frozen soils. Eur. J. Environ. Civ. Eng. 26, 2537–2553. doi:10.1080/19648189.2016.1271361
Huang, S., He, Y., Liu, X., and Xin, Z. (2021). Experimental investigation of the influence of dry-wet, freeze-thaw and water immersion treatments on the mechanical strength of the clay-bearing green sandstone. Int. J. Rock Mech. Min. Sci. 138, 104613. doi:10.1016/j.ijrmms.2021.104613
Huang, S., Liu, Q., Liu, Y., Ye, Z., and Cheng, A. (2018). Freezing strain model for estimating the unfrozen water content of saturated rock under low temperature. Int. J. Geomech. 18, 04017137. doi:10.1061/(ASCE)GM.1943-5622.0001057
Huang, S., Lu, Z., Ye, Z., and Xin, Z. (2020). An elastoplastic model of frost deformation for the porous rock under freeze-thaw. Eng. Geol. 278, 105820. doi:10.1016/j.enggeo.2020.105820
Huang, S., Ye, Y., Cui, X., Cheng, A., and Liu, G. (2020). Theoretical and experimental study of the frost heaving characteristics of the saturated sandstone under low temperature. Cold Reg. Sci. Tech. 174, 103036. doi:10.1016/j.coldregions.2020.103036
Jia, H., Ding, S., Zi, F., Dong, Y., and Shen, Y. (2020). Evolution in sandstone pore structures with freeze-thaw cycling and interpretation of damage mechanisms in saturated porous rocks. Catena 195, 104915. doi:10.1016/j.catena.2020.104915
Ju, X., Niu, F., Liu, M., and Luo, J. (2024). Evolution characteristics of freeze–thaw-induced sandstone damage under water immersion conditions in Changdu, Tibet, China. Cold Reg. Sci. Tech. 217, 104013. doi:10.1016/j.coldregions.2023.104013
Kjelstrup, S., Ghoreishian Amiri, S. A., Loranger, B., Gao, H., and Grimstad, G. (2021). Transport coefficients and pressure conditions for growth of ice lens in frozen soil. Acta Geotech. 16, 2231–2239. doi:10.1007/s11440-021-01158-0
Li, B., Zhang, G., Wang, G., and Qiao, J. (2022). Damage evolution of frozen-thawed granite based on high-resolution computed tomographic scanning. Front. Earth Sci. 10. doi:10.3389/feart.2022.912356
Li, J., Kaunda, R. B., and Zhou, K. (2018). Experimental investigations on the effects of ambient freeze-thaw cycling on dynamic properties and rock pore structure deterioration of sandstone. Cold Reg. Sci. Tech. 154, 133–141. doi:10.1016/j.coldregions.2018.06.015
Li, J., Zhou, K., Liu, W., and Zhang, Y. (2018). Analysis of the effect of freeze–thaw cycles on the degradation of mechanical parameters and slope stability. Bull. Eng. Geol. Environ. 77, 573–580. doi:10.1007/s10064-017-1013-8
Liu, C., Deng, H., Chen, X., Xiao, D., and Li, B. (2020). Impact of rock samples size on the microstructural changes induced by freeze–thaw cycles. Rock Mech. Rock Eng. 53, 5293–5300. doi:10.1007/s00603-020-02201-4
Liu, H., Yang, G., Yun, Y., Lin, J., Ye, W., Zhang, H., et al. (2020). Investigation of sandstone mesostructure damage caused by freeze-thaw cycles via CT image enhancement technology. Adv. Civ. Eng. 2020, 1–13. doi:10.1155/2020/8875814
Liu, T., Zhang, C., Li, J., Zhou, K., and Ping, C. (2021). Detecting freeze–thaw damage degradation of sandstone with initial damage using NMR technology. Bull. Eng. Geol. Environ. 80, 4529–4545. doi:10.1007/s10064-021-02242-1
Lu, J., Tan, L., Yang, H., Wan, X., Wang, Y., and Yan, Z. (2023). Experimental study on the hydro-thermal-deformation characteristics of cement-stabilized soil exposed to freeze–thaw cycles. Front. Earth Sci. 10. doi:10.3389/feart.2022.1041249
Lu, Y., Li, X., and Chan, A. (2019). Damage constitutive model of single flaw sandstone under freeze-thaw and load. Cold Reg. Sci. Tech. 159, 20–28. doi:10.1016/j.coldregions.2018.11.017
Lv, Z., Wu, M., Huang, F., and Cai, Y. (2022). Analytical solution of mechanical response in cold region tunnels under transversely isotropic freeze–thaw circle induced by unidirectional freeze–thaw damage. Front. Earth Sci. 10. doi:10.3389/feart.2022.1016605
Ma, J., Jin, J., Wu, P., Qin, Z., and Jia, B. (2023). Study on the pore structure characteristics and damage constitutive model of sandstone under freeze-thaw conditions. Front. Earth Sci. 11. doi:10.3389/feart.2023.1095686
Maji, V., and Murton, J. B. (2020). Micro-computed tomography imaging and probabilistic modelling of rock fracture by freeze–thaw. Earth Surf. Process. Landf. 45, 666–680. doi:10.1002/esp.4764
Maľa, M., Greif, V., and Ondrášik, M. (2022). Pore structure evolution in andesite rocks induced by freeze–thaw cycles examined by non-destructive methods. Sci. Rep. 12, 8390. doi:10.1038/s41598-022-12437-5
Meng, F., Zhai, Y., Li, Y., Zhao, R., Li, Y., and Gao, H. (2021). Research on the effect of pore characteristics on the compressive properties of sandstone after freezing and thawing. Eng. Geol. 286, 106088. doi:10.1016/j.enggeo.2021.106088
Niu, C., Zhu, Z., Zhou, L., Li, X., Ying, P., Dong, Y., et al. (2021). Study on the microscopic damage evolution and dynamic fracture properties of sandstone under freeze-thaw cycles. Cold Reg. Sci. Tech. 191, 103328. doi:10.1016/j.coldregions.2021.103328
Niu, S., Luo, X., and Jiang, N. (2024). Frost-heaving characteristics and formation mechanism of saturated sandstone under unidirectional freezing conditions. Cold Reg. Sci. Tech. 217, 104049. doi:10.1016/j.coldregions.2023.104049
Park, J., Hyun, C., and Park, H. (2015). Changes in microstructure and physical properties of rocks caused by artificial freeze–thaw action. Bull. Eng. Geol. Environ. 74, 555–565. doi:10.1007/s10064-014-0630-8
Qiao, C., Wang, Y., Li, C., Yan, B., Yang, H., and Xiao, Y. (2022). Catastrophe instability analysis of rock slopes with locked segments in open-pit mine due to freeze–thaw weathering. Bull. Eng. Geol. Environ. 81, 135. doi:10.1007/s10064-022-02635-w
Seyed Mousavi, S. Z., Tavakoli, H., Moarefvand, P., and Rezaei, M. (2019). Assessing the effect of freezing-thawing cycles on the results of the triaxial compressive strength test for calc-schist rock. Int. J. Rock Mech. Min. Sci. 123, 104090. doi:10.1016/j.ijrmms.2019.104090
Song, Y., Zhou, Y., Yang, H., Li, C., Cao, J., Sun, Y., et al. (2023). Mesoscopic freeze-thaw damage evolution characteristics of fractured sandstone at different saturations. Geofluids 2023, 1–22. doi:10.1155/2023/3399012
Sun, Y., Zhai, C., Xu, J., Cong, Y., Qin, L., and Zhao, C. (2020). Characterisation and evolution of the full size range of pores and fractures in rocks under freeze-thaw conditions using nuclear magnetic resonance and three-dimensional X-ray microscopy. Eng. Geol. 271, 105616. doi:10.1016/j.enggeo.2020.105616
Wang, X., Li, L., Mu, W., Yang, T., An, J., and Du, Y. (2024). Diffusion mechanism of cement-based slurry in frozen and thawed fractured rock mass in alpine region. Constr. Build. Mater. 411, 134584. doi:10.1016/j.conbuildmat.2023.134584
Wang, Y., Feng, W. K., Wang, H. J., Li, C. H., and Hou, Z. Q. (2020). Rock bridge fracturing characteristics in granite induced by freeze-thaw and uniaxial deformation revealed by AE monitoring and post-test CT scanning. Cold Reg. Sci. Tech. 177, 103115. doi:10.1016/j.coldregions.2020.103115
Wang, Y., Yang, H., Zhu, C., and Gao, S. (2021). On the fracture evolution and instability of pyrite-filled marble exposed to freeze-thaw-compression loads. Lithosphere 2021, 7599916. doi:10.2113/2021/7599916
Xia, M., Ren, G. M., and Yang, X. L. (2021). Mechanism of a catastrophic landslide occurred on may 12, 2019, qinghai Province, China. Landslides 18, 707–720. doi:10.1007/s10346-020-01559-4
Yahaghi, J., Liu, H., Chan, A., and Fukuda, D. (2021). Experimental and numerical studies on failure behaviours of sandstones subject to freeze-thaw cycles. Transp. Geotech. 31, 100655. doi:10.1016/j.trgeo.2021.100655
Yu, S., Huang, S., Liu, F., Cai, H., and Ye, Y. (2023). Quantification of pore structure evolution and its correlation with the macroscopic properties of sandstones under freeze–thaw action. Bull. Eng. Geol. Environ. 83, 3. doi:10.1007/s10064-023-03484-x
Zhang, G., Chen, G., Xu, Z., Yang, Y., and Lin, Z. (2020). Crack failure characteristics of different rocks under the action of frost heaving of fissure water. Front. Earth Sci. 8. doi:10.3389/feart.2020.00013
Zhang, J., Chen, Y., Du, R., Zhao, X., and Wu, J. (2024). Macroscopic and microscopic mechanical characteristics and crack propagation behavior of sandstone-like samples with single cracks under freeze–thaw cycles: experimental and numerical simulation. Theor. Appl. Fract. Mech. 129, 104201. doi:10.1016/j.tafmec.2023.104201
Zhang, J., Tang, H., Li, C., Gong, W., Zhou, B., and Zhang, Y. (2024). Deformation stage division and early warning of landslides based on the statistical characteristics of landslide kinematic features. Landslides 21, 717–735. doi:10.1007/s10346-023-02192-7
Zhang, J., Wang, G., Liu, H., and Yang, M. (2024). Study on the evolution of microscopic pore structure of sandstone under freeze-thaw cycles. Cold Reg. Sci. Tech. 217, 104018. doi:10.1016/j.coldregions.2023.104018
Zhang, K., Wang, S., Wang, L., Cheng, Y., Li, W., Han, X., et al. (2022). 3D visualization of tectonic coal microstructure and quantitative characterization on topological connectivity of pore-fracture networks by Micro-CT. J. Pet. Sci. Eng. 208, 109675. doi:10.1016/j.petrol.2021.109675
Zhou, L., Jiang, Y., Zhu, Z., Feng, B., Chen, J., and Wang, H. (2023). Scrutiny of freeze-thaw cycles effect on physical and dynamic fracture characteristics of cracked sandstone. Cold Reg. Sci. Tech. 210, 103837. doi:10.1016/j.coldregions.2023.103837
Keywords: freeze-thaw (F-T) cycles, landslide, CT scanning, prefabricated crack, pore structure
Citation: Zhang X, Luo X, He X and Niu S (2024) Pore structure expansion and evolution in sandstone with prefabricated crack under freeze-thaw cycles based on CT scanning. Front. Earth Sci. 12:1394731. doi: 10.3389/feart.2024.1394731
Received: 02 March 2024; Accepted: 29 April 2024;
Published: 14 May 2024.
Edited by:
Tao Wen, Yangtze University, ChinaReviewed by:
Shibing Huang, Wuhan University of Science and Technology, ChinaTubing Yin, Central South University, China
Copyright © 2024 Zhang, Luo, He and Niu. This is an open-access article distributed under the terms of the Creative Commons Attribution License (CC BY). The use, distribution or reproduction in other forums is permitted, provided the original author(s) and the copyright owner(s) are credited and that the original publication in this journal is cited, in accordance with accepted academic practice. No use, distribution or reproduction is permitted which does not comply with these terms.
*Correspondence: Xuedong Luo, cugluoxd@foxmail.com